Embed Size (px)
Citation preview

AGC’s CONSTRUCTION INFLATION ALERT
REPORTED BY AGC CHIEF ECONOMIST KEN SIMONSON
Construction Costs: End of the Calm Is Coming Soon
Nonresidential construction has had a banner year so far in 2007. Spending on nearly every segment has increased compared to 2006, despite the plunge in homebuilding. Meanwhile, the materials cost surges that plagued the industry in 2004-2006 have slowed dramatically, and labor remains available in most markets.
Unfortunately, many observers expect that the end of the calm is coming soon. The worsening slide in homebuilding and turmoil in the credit markets threaten some types of nonresidential construction. At the same time, some materials costs are beginning to turn up again, and labor costs have started to accelerate.
This report analyzes the most pertinent data to answer questions about supplies of labor, materials and capital such as: will the Federal Reserve’s half-point cut in interest rate targets help keep nonresidential construction going? Or was the move too late, or irrelevant? Are construction costs getting back to “normal”? Or is the recent slowdown in materials price increases only a pause before escalation resumes? Will the recent run-up in construction wages continue? Or will a slowing economy bring down labor costs?
For the first time, this report shows the cumulative price change since December 2003 and trends in construction wages. Also new to this report is a sampling of comments on credit market turmoil. Finally, the report examines the trends in construction activity, materials and labor costs over the past several years as well as the record so far in 2007 to draw conclusions about what contractors and owners should expect in 2008 and beyond. The report relies on publicly available data to give contractors, owners, budget planners, media and others an independent basis for understanding what has happened and will happen next.
Summary
The strong growth of nonresidential construction in 2006 and 2007 has been obscured by the steep falloff in residential work. Nonresidential construction recovered more slowly than many sectors after the business
October 2007
The Construction
Inflation Alert is the
fifth in a series of
continuing economic
reports educating
contractors and
owners on construction
materials prices.
www.agc.org
Building Your Quality of Life
The Associated General
Contractors of America
2300 Wilson Boulevard
Arlington, Virginia 22201

slump of 2000-2001. But in 2006, nonresidential spending jumped 12 percent from 2005. In the first eight months of 2007, nonresidential spending climbed another 14 percent compared to the same period of 2006. Meanwhile, spending on residential construction has tumbled since early 2006, with no letup in sight.
The housing meltdown and the more recent credit market turmoil do have some spillover effects on nonresidential construction. Retail, suburban office and local government construction are especially affected by the drop in homebuilding, home sales, and property values, respectively. Tighter lending standards and financial-firm layoffs will trim construction of offices and other income-producing properties, such as hotels and warehouses.
The Fed’s cuts in short-term lending rates and encouragement to banks to borrow through the Fed’s “discount window” appear to have restored the flow of some commercial lending. That may help some home buyers and commercial developers. But the move also raises the risk of greater inflation and, especially, higher prices for petroleum products and imported materials. The net impact on nonresidential construction is unclear.
After years of minimal cost increases, prices of many construction materials skyrocketed from 2004 to mid-2006. Since mid-2006, some input prices have moderated, while others have fallen. But the cumulative increase in the producer price index (PPI) for construction inputs since December 2003 (28 percent through August 2007) remains more than double the 13 percent increase in the most common measure of overall inflation, the consumer price index (CPI) for all urban consumers. Labor costs, in contrast, have risen at similar rates for construction and for the private sector as a whole.
The cumulative difference matters because the estimates for many projects now being bid, especially public facilities, were prepared in 2003-2005 under the assumption that construction costs would escalate at the same rate as the CPI. That divergence explains why some projects are being canceled, delayed or redesigned.
In the next several months, the PPI for construction inputs, which covers items used up in construction such as diesel fuel as well as materials that go into a project, is expected to accelerate to a 3-5 percent annual rate of increase from the recent 1.5-3 percent range. By the end of 2008, and indefinitely thereafter, construction input costs are likely to be rising at 6-8 percent. Labor cost increases could top 5 percent by the end of 2007 and 5-6 percent in subsequent years.
Construction Spending
Recent History
In 2006, construction spending as reported by the Census Bureau (www.census.gov/constructionspending) set a record of $1.19 trillion, up 5 percent from 2005. Private residential construction was unchanged after 10 straight years of strong growth. Private
AGC’s CONSTRUCTION INFLATION ALERT: 2007 2
The Associated General Contractors of America | 2300 Wilson Blvd. | Arlington, VA | www.agc.org
“We have experienced a slowdown in our business and project starts in general due to financing. The devel-opers are encountering difficulties in obtaining financing even when they have appropriate sales.”
–deep foundation contractor; Miami, FL
Take part in Ken
Simonson’s next
Economic Outlook
Audio Conference on
Thursday, December
13: A Debate on
Construction’s Fate
in 2008. Log onto
www.agc.org/
audioconferences for
more details.

nonresidential construction, which fell from 2000 to 2003, surged 15 percent, and public construction rose 9 percent.
The plunge in homebuilding and home sales and the deceleration or drop in residential property values have had limited effects to date on nonresidential construction. With the development of fewer subdivisions, there has been a slowdown in related retail (convenience stores, neighborhood shopping centers), office (real estate agents and mortgage brokers), religious and public construction (schools, playgrounds, streets, water and sewer). The slump has also led retailers that sell homebuilding, yard and
3 AGC’s CONSTRUCTION INFLATION ALERT: 2007
The Associated General Contractors of America | 2300 Wilson Blvd. | Arlington, VA | www.agc.org
Table 1
Construction Spending by Segment, 2006 and August 2007
Segment 2006 8/07
Total $1.19 tril. $1.17 tril.
% of total 100% 100%
Private residential 54% 45%
New single-unit 35 26
New multi-unit 4 4
Improvements 14 15
Private nonresidential 25 30
Public 21 25
Note: Detail may not add to 100% due to rounding. August 2007 total is seasonally adjusted at annual rate. Source: U.S. Census Bureau
Table 2
Nonresidential Construction Spending by Segment, 2006 and Change, January-August 2007
2006 Spending % Change Segment (bil. $) (%) 2006-2007
Educational 86 16 +14
Commercial 76 14 +15
Highway & street 72 13 + 5
Office 55 10 +21
Healthcare 40 7 +15
Power 39 7 +22
Manufacturing 34 6 + 6
Transportation 27 5 +11
Sewage & waste disposal 23 4 + 6
Communication 21 4 +20
Amusement & recreation 18 3 +9
Lodging 18 3 +64
Water supply 15 3 + 6
Public safety 8 1 +27
Religious 8 1 - 2
Conservation & develop. 5 1 +5
Total $545 100% +14%
Note: Details may not add to totals due to rounding. 2006-2007 change is for January-August. Source: U.S. Census Bureau
The market has shifted radically during 2007. (See Table 1.)
Although total spending fell only 2 percent from 2006 (full
year total) to August 2007 (seasonally adjusted monthly
total, expressed at an annual rate), the share represented
by single-unit construction plunged from 35 percent of
the total to 26 percent. New multi-unit construction and
improvements to existing single- and multi-unit residential
structures remained nearly constant, while nonresidential
construction continued to grow rapidly.
So far in 2007, nearly every category of nonresidential construction has risen, many at double-digit rates. (See Table 2.) Some segments are still rebounding from the long slowdown earlier in the decade (lodging, power, manufacturing). Others are growing in response to changing technological, demographic and other market factors (healthcare, education, communication).
garden supplies and furniture and furnishings to trim construction. But the bulk of retail construction has been driven by rising personal incomes and continuing low unemployment.
Recent turmoil in credit markets also has had relatively little effect on nonresidential construction, according to contractors reporting to AGC or to the Federal Reserve’s ”Beige Book” surveys conducted in July and late August. However, some developers have reported that it has become much harder to secure financing for income-producing properties, such as retail, warehouses, hotels, apartments and mixed-use projects.
The Outlook
The moves by the Federal Reserve to lower short-term interest rate targets and encourage banks to borrow from its “discount window” will enable more families to buy or hang onto houses. In addition, companies will have more access to credit. But lending standards are likely to remain tighter than before the turmoil began. In addition, the lowering of U.S. interest rates may depress the dollar further, making imports such as petroleum products more expensive and possibly pushing up inflation rates. Thus, it is not clear that the Fed’s actions will aid construction.
Currently, it appears that segments of nonresidential construction that are relatively insulated from short-term interest rates or changing loan standards, such as power, communications, hospitals and some public construction, will continue to expand rapidly through 2008. Income-producing properties will slow sharply as current projects are completed. Highway construction also is likely to slow, as federal and state highway funds become depleted by a combination of high materials costs and sluggish growth of gas tax receipts.
Materials Costs
Recent history
Construction materials costs, like consumer prices, were relatively stable during the business slowdown of 2000-2001 and the early years of recovery. The CPI for all urban consumers (posted monthly by the Bureau of Labor Statistics at www.bls.gov/cpi) went up about 2 percent per year in 2001 through 2003. The PPI (posted monthly at www.bls.gov/ppi) for inputs to construction industries, comprising materials that go into finished structures and also those consumed in construction (principally diesel fuel) declined 0.9 percent in the 12 months through December 2001, then rose 0.7 percent in 2002 and 3 percent in 2003. Nearly every major construction input had at least one year in which prices declined in that three-year period.
But since December 2003, the PPI for inputs to construction industries has far outrun both
AGC’s CONSTRUCTION INFLATION ALERT: 2007 4
The Associated General Contractors of America | 2300 Wilson Blvd. | Arlington, VA | www.agc.org
“I am beginning to
see the turmoil in the
financial markets have
an effect on infant
projects, and my view
of this is financing for
certain projects is
in question.”
- air conditioning
contractor;
Colorado
the broader, more familiar PPI for finished goods and the CPI for all urban consumers (CPI-U). (See Chart 1, page 6.)
A combination of steadily rising gross domestic product (GDP) in the United States, an upturn in both residential and nonresidential construction, and demand from fast-growing economies such as China and India led to sharp price escalation for numerous construction inputs in 2004. From December 2003 to December 2004 there were increases of 20-49 percent in the PPIs for steel mill products, diesel fuel, copper and brass mill shapes and gypsum products. The overall PPI for construction inputs jumped 9.1 percent, compared to a 3.3-percent rise in the CPI.
Some of these prices subsided in 2005 but the damage to oil and gas production facilities caused by Hurricanes Katrina and Rita produced even larger increases in the cost of diesel fuel, asphalt and plastic construction products. High energy and transportation costs, in turn, pushed up the price of energy-intensive and imported materials, including cement and copper ore. From December 2004 to December 2005, there were increases of 10-47 percent for diesel fuel, copper and brass mill shapes, plastic construction products, gypsum products, asphalt paving mixtures and blocks, and concrete products. The overall PPI for construction inputs climbed 8.2 percent, vs. 3.4 percent for the CPI.
In 2006, prices continued rising for several months but peaked in the late spring or early summer. For instance, the futures price for copper on the Comex division of the New York Mercantile Exchange more than doubled, from $1.90 per pound in December 2005 to $4 per pound in May 2006, before retreating steeply over the next eight months. Retail diesel prices rose to a near-record $3.06 per gallon in mid-August 2006, according to a weekly survey of truckstops posted by the Energy Information Administration (www.eia.doe.gov/mogas), before tumbling to $2.41 per gallon by January 2007. For the 12 months ending in December 2006, the PPI for inputs to construction rose 4.6 percent, less than in the previous two years but again outpacing the CPI, which climbed just 2.5 percent.
Construction input prices have been mixed so far in 2007 but generally have varied less in both directions than in the previous three years. Large price increases for iron and steel scrap pushed up the price of structural steel, which is made almost entirely from scrap, in the first four months of the year, but those prices leveled off by mid-year. An enormous jump in nickel prices, along with higher steel prices, sent stainless steel soaring in the first half of the year before retreating somewhat in the summer. Retail diesel prices rose more than 40 cents per gallon but remained slightly lower than year-ago prices during the first eight months of 2007. The PPI for gypsum products peaked in July 2006 but tumbled 20 percent in the subsequent 12 months under the combined weight of new plant openings and a dive in demand from residential construction. As a result of these more moderate—or negative—movements, the PPI for construction inputs was up 1.6 percent from August 2006 to August 2007, even less than the 2.5 percent rise in the CPI.
5 AGC’s CONSTRUCTION INFLATION ALERT: 2007
The Associated General Contractors of America | 2300 Wilson Blvd. | Arlington, VA | www.agc.org

AGC’s CONSTRUCTION INFLATION ALERT: 2007 6
Cumulative change
Despite the recent narrowing in construction materials and consumer price changes, the cumulative change in the construction PPI since December 2003—28 percent—dramatically exceeds the 13 percent change in the CPI over that span, as Chart 1 shows. The disparity is even greater for some types of construction, depending on the predominant inputs. (See Chart 2.)
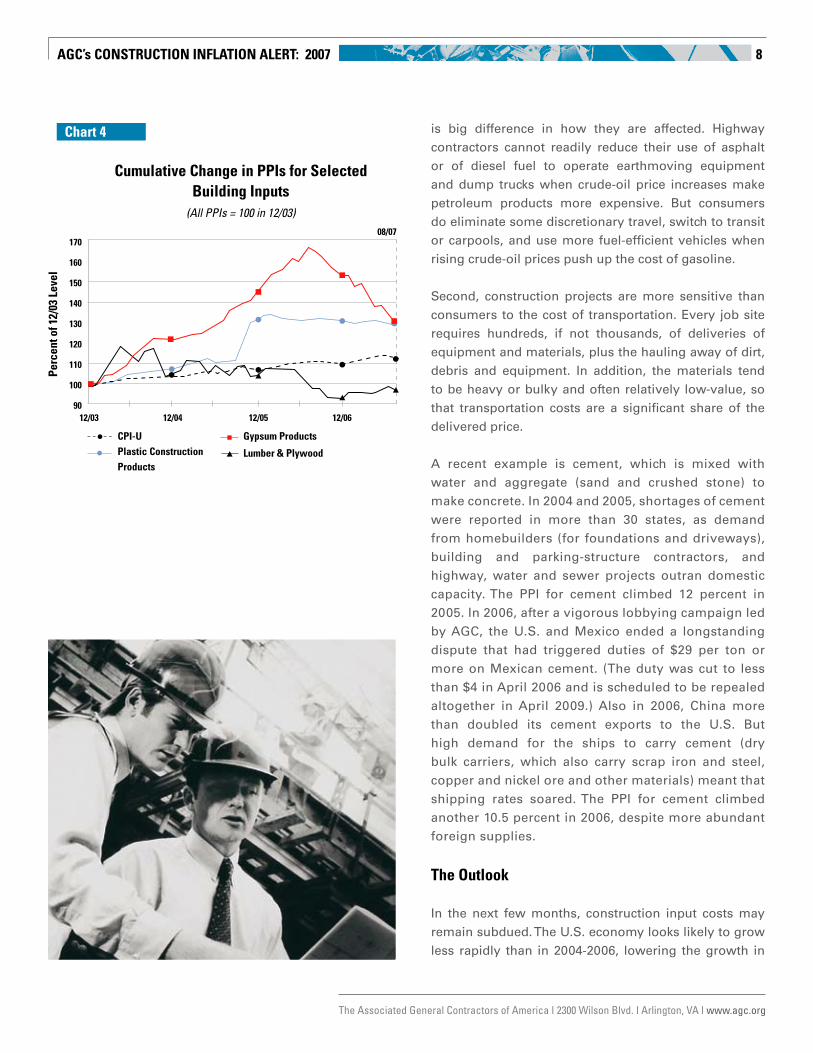
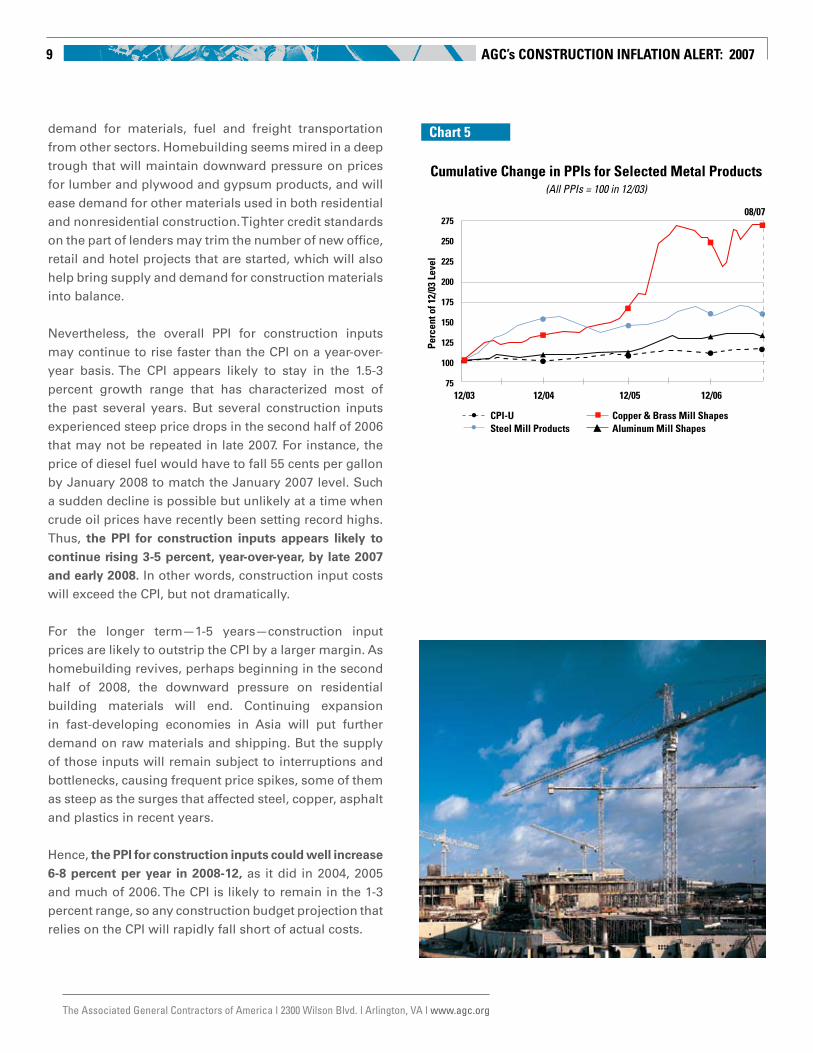
The PPI for highway and street construction inputs soared 43 percent from December 2003 through August 2007; the index for “other heavy construction,” 36 percent. Both of those types rely more than building construction does on diesel fuel, steel, concrete and—in the case of highways—asphalt. All four of those indexes rose more rapidly than the overall construction inputs PPI: 140 percent for diesel fuel, 61 percent for steel mill products, 31.5 percent for concrete products, and 49 percent for asphalt paving mixtures and blocks. (See Chart 3.) The cumulative change in the PPIs for nonresidential and multi-unit residential buildings each rose 27 percent (See Chart 2), while the index for single-unit residential buildings climbed 22 percent—less than the increase in nonbuilding construction but well above the 13 percent change in the CPI. The building indexes were pulled up somewhat by the rise in steel, concrete and diesel prices. In addition, builders experienced above-average increases in the PPIs for copper and brass mill shapes (used in wiring, plumbing and roofing), 168 percent; gypsum products (wallboard and plaster), 27.5 percent; and construction plastic products (principally polyvinyl chloride, or PVC, pipes), 30 percent. Countering these large increases were the PPIs for brick and structural clay tile, up 20 percent; insulation materials, 11.5 percent; and lumber and plywood, -3 percent. (See Charts 4 and 5, pages 8 and 9, for selected inputs.)
The cumulative change matters for two reasons. First, many public agencies use the CPI or a similar index as the basis for projecting future costs. Jurisdictions that passed bond issues or adopted multi-year capital budgets in 2003-2005 using the CPI have encountered “sticker shock” when they opened bids in 2006 or 2007 that reflect
The Associated General Contractors of America | 2300 Wilson Blvd. | Arlington, VA | www.agc.org
Chart 1
Perc
ent o
f 12/
03 L
evel
130
125
120
115
110
105
100
95 12/03 12/04 12/05 12/06
Cumulative Change in Consumer, Producer & Construction Prices
(All PPIs = 100 in 12/03)
08/07
CPI-U PPI for Finished Goods
Inputs to Construction Industries
Chart 2
Cumulative Change in PPIs for Construction Types(All PPIs = 100 in 12/03)
12/03 12/04 12/05 12/06
08/07150
140
130
120
110
100
90
CPI-U
Highway & Street
Construction
Other Heavy Construction
Nonresidential Buildings
Multi-Unit Residential
Perc
ent o
f 12/
03 L
evel

7 AGC’s CONSTRUCTION INFLATION ALERT: 2007
the reality of construction cost increases since then. Second, the current slowdown in construction cost increases may lead owners of projects currently under design or planning to assume that the 2004-2006 price run-up was an aberration that has ended, and that a CPI-like projection rate for construction costs will be appropriate again. Is that assumption valid?
Materials Costs vs. Consumer Prices
Two factors distinguish construction input costs from the CPI. First, construction depends heavily on a relatively fixed set of materials. The choice of materials to enclose a given space or pave a mile of highway is limited and relatively unresponsive to price changes. Furthermore, many of the materials used by the U.S. construction industry are in strong demand in China, India and other developing countries. Those countries are simultaneously building infrastructure, industrial capacity and housing with modern conveniences. Many of the goods they are producing for their own new consumer class and for export also add to demand for materials needed for construction in the U.S.
Unfortunately, the supply of some of these inputs expands erratically, at best. An example is copper, used in construction, consumer and commercial electronics, motors, automobiles and many other products worldwide. There are relatively few mines that produce most of the world’s supply. In 2006, strikes, labor unrest and political turmoil kept supplies from expanding in line with surging demand.
Also, many construction materials incorporate relatively little processing or “value added.” Thus, an increase in copper ore prices shows up with little delay or mitigation in the price of wire, pipe and flashings.
In contrast, the consumer expenditure “basket” is dominated by services and by goods for which substitutes are often readily available or for which the cost of the raw materials is a minor fraction of the consumer price. Even for an input that is important to both contractors and consumers, such as oil, there
The Associated General Contractors of America | 2300 Wilson Blvd. | Arlington, VA | www.agc.org
“The 2-3 percent cement increase implemented mid-summer is hurting us, and the corrugate increase of anywhere from 6.5-12 percent which the corrugators are trying to implement by September 20 are deeply damaging our cost structure.”
– stone supplier, Colorado
Chart 3
275
250
225
200
175
150
125
100
75
Perc
ent o
f 12/
03 L
evel
12/03 12/04 12/05 12/06
Cumulative Change in PPIs for Selected Highway Inputs
(All PPIs = 100 in 12/03)
08/07
CPI-U#2 Diesel Fuel
Asphalt Paving Mixtures & BlocksConcrete Products
AGC’s CONSTRUCTION INFLATION ALERT: 2007 8
is big difference in how they are affected. Highway contractors cannot readily reduce their use of asphalt or of diesel fuel to operate earthmoving equipment and dump trucks when crude-oil price increases make petroleum products more expensive. But consumers do eliminate some discretionary travel, switch to transit or carpools, and use more fuel-efficient vehicles when rising crude-oil prices push up the cost of gasoline.
Second, construction projects are more sensitive than consumers to the cost of transportation. Every job site requires hundreds, if not thousands, of deliveries of equipment and materials, plus the hauling away of dirt, debris and equipment. In addition, the materials tend to be heavy or bulky and often relatively low-value, so that transportation costs are a significant share of the delivered price.
A recent example is cement, which is mixed with water and aggregate (sand and crushed stone) to make concrete. In 2004 and 2005, shortages of cement were reported in more than 30 states, as demand from homebuilders (for foundations and driveways), building and parking-structure contractors, and highway, water and sewer projects outran domestic capacity. The PPI for cement climbed 12 percent in 2005. In 2006, after a vigorous lobbying campaign led by AGC, the U.S. and Mexico ended a longstanding dispute that had triggered duties of $29 per ton or more on Mexican cement. (The duty was cut to less than $4 in April 2006 and is scheduled to be repealed altogether in April 2009.) Also in 2006, China more than doubled its cement exports to the U.S. But high demand for the ships to carry cement (dry bulk carriers, which also carry scrap iron and steel, copper and nickel ore and other materials) meant that shipping rates soared. The PPI for cement climbed another 10.5 percent in 2006, despite more abundant foreign supplies.
The Outlook
In the next few months, construction input costs may remain subdued. The U.S. economy looks likely to grow less rapidly than in 2004-2006, lowering the growth in
The Associated General Contractors of America | 2300 Wilson Blvd. | Arlington, VA | www.agc.org
Chart 4
170
160
150
140
130
120
110
100
90
Perc
ent o
f 12/
03 L
evel
12/03 12/04 12/05 12/06
Cumulative Change in PPIs for Selected Building Inputs
(All PPIs = 100 in 12/03)08/07
CPI-UPlastic Construction Products
Gypsum Products
Lumber & Plywood
9 AGC’s CONSTRUCTION INFLATION ALERT: 2007
demand for materials, fuel and freight transportation from other sectors. Homebuilding seems mired in a deep trough that will maintain downward pressure on prices for lumber and plywood and gypsum products, and will ease demand for other materials used in both residential and nonresidential construction. Tighter credit standards on the part of lenders may trim the number of new office, retail and hotel projects that are started, which will also help bring supply and demand for construction materials into balance.
Nevertheless, the overall PPI for construction inputs may continue to rise faster than the CPI on a year-over-year basis. The CPI appears likely to stay in the 1.5-3 percent growth range that has characterized most of the past several years. But several construction inputs experienced steep price drops in the second half of 2006 that may not be repeated in late 2007. For instance, the price of diesel fuel would have to fall 55 cents per gallon by January 2008 to match the January 2007 level. Such a sudden decline is possible but unlikely at a time when crude oil prices have recently been setting record highs. Thus, the PPI for construction inputs appears likely to continue rising 3-5 percent, year-over-year, by late 2007 and early 2008. In other words, construction input costs will exceed the CPI, but not dramatically.
For the longer term—1-5 years—construction input prices are likely to outstrip the CPI by a larger margin. As homebuilding revives, perhaps beginning in the second half of 2008, the downward pressure on residential building materials will end. Continuing expansion in fast-developing economies in Asia will put further demand on raw materials and shipping. But the supply of those inputs will remain subject to interruptions and bottlenecks, causing frequent price spikes, some of them as steep as the surges that affected steel, copper, asphalt and plastics in recent years.
Hence, the PPI for construction inputs could well increase 6-8 percent per year in 2008-12, as it did in 2004, 2005 and much of 2006. The CPI is likely to remain in the 1-3 percent range, so any construction budget projection that relies on the CPI will rapidly fall short of actual costs.
The Associated General Contractors of America | 2300 Wilson Blvd. | Arlington, VA | www.agc.org
275
250
225
200
175
150
125
100
75
Perc
ent o
f 12/
03 L
evel
12/03 12/04 12/05 12/06
Cumulative Change in PPIs for Selected Metal Products(All PPIs = 100 in 12/03)
08/07
CPI-USteel Mill Products
Copper & Brass Mill ShapesAluminum Mill Shapes
Chart 5

AGC’s CONSTRUCTION INFLATION ALERT: 2007 10
Labor Inputs
Labor represents roughly half the cost of construction, although the proportions of labor and materials vary from project to project. For several years, nonresidential contractors have worried about the shrinking pool of new entrants into the construction labor market, as more teens head to college and then to office, retail or other service-sector jobs.
Yet, from 2003 until early 2007, average hourly wages in construction rose less than in private industry as a whole (See Chart 6), even though construction employment rose more rapidly than overall nonfarm payroll employment (See Chart 7). Construction employment was propelled first by a buoyant homebuilding market and more recently by strong growth in private and public nonresidential construction.
Recent job trends
Even as recently as August 2007, nonresidential construction was outpacing the overall economy in job creation. BLS reported that the combined employment growth among nonresidential building contractors, nonresidential specialty trade contractors and heavy and civil engineering construction from August 2006 to August 2007 was 1.5 percent, vs. 1.3 percent for total nonfarm payroll employment.
In fact, the BLS estimate may substantially understate the growth in nonresidential construction jobs. BLS reports that employment among residential building and specialty trade contractors fell 4.5 percent over the same span. But Census figures show residential construction spending fell 16 percent from August 2006 to August 2007, while nonresidential construction spending rose 15 percent. Furthermore, homebuilders appeared poised to cut spending—and presumably employment—even more: building permits, a reliable indicator of near-term building plans, were down 24 percent from August 2006 to August 2007. It is not credible that homebuilders would hold onto so many workers with spending down so much already and likely to get worse.
The Associated General Contractors of America | 2300 Wilson Blvd. | Arlington, VA | www.agc.org
Chart 6
Total nonfarm private industry Total construction Nonresidential building Heavy & civil contractors engineering Specialty trade contractors construction
Perc
ent o
f 12/
03 L
evel
114
112
110
108
106
104
102
1007/03 7/04 7/05 7/06 7/07
Average Hourly Earnings- Construction Types (not seasonally adjusted; all indexes = 100 in 12/03)

11 AGC’s CONSTRUCTION INFLATION ALERT: 2007
The Associated General Contractors of America | 2300 Wilson Blvd. | Arlington, VA | www.agc.org
The reality is that a large number of “residential” specialty trade contractors, as their companies were classified when they entered the BLS data sample, have turned to nonresidential work. Indeed, general contractors have reported a much greater availability in once-tight labor markets of electricians, plumbers, wallboard installers and concrete finishers who formerly had been too busy with residential projects to bid on commercial work.
Reclassifying 400,000 specialty trade contractors from residential to nonresidential would produce a drop in residential employment of 16 percent and an increase of nonresidential employment of 11 percent, figures that are much more consistent with the spending changes than are the official totals.
Recent wage trends
Wages (average hourly earnings) in construction as a whole show divergent patterns when separated into segments. (See Chart 6.) Specialty trade contractors’ wages have risen less rapidly than overall construction wages, while wages in nonresidential building or heavy and civil engineering have gone up faster.
But recently, from July 2006 to July 2007, specialty wages rose 4.7 percent, despite the downturn in residential work. This suggests that the pool of specialty workers is getting shallower and general contractors are increasing the wages they pay by greater amounts than before in order to get the workers required. That accords with what many contractors themselves have reported.
Although there were 2.3 million workers classified as residential specialty trade contractors in August 2007, many of them are not able to do the work that nonresidential contractors need. There is no counterpart in single-family construction for tower-crane and other specialized building-equipment operators, steel erectors or other crafts required for high-rise or technically sophisticated projects. In addition, in some parts of the country, nonresidential work is predominantly unionized, and there are virtually no union members to be pulled from single-family residential jobs. Also, many
Chart 7
08/07
Total nonfarm private industry
Residential total
Total construction
Nonresidential total
Employment Change- Total, Res. & Nonres. Construction (seasonally adjusted; all indexes = 100 in 12/03)
120
115
110
105
100
95
12/03 12/04 12/05 12/06
Perc
ent o
f 12/
03 L
evel
AGC’s CONSTRUCTION INFLATION ALERT: 2007 12
workers in single-family construction and remodeling may lack the language skills, familiarity with nonresidential methods or documentation required for nonresidential work sites.
Labor Outlook
Nonresidential construction spending has not shown any signs of slackening in recent months. Although measured employment growth (1.5 percent from August 2006 to August 2007) is only slightly faster than for the entire nonfarm economy (1.3 percent), it appears that actual growth, including workers counted by BLS as residential, remains vigorous.
Several other indicators suggest nonresidential construction will keep expanding. BLS figures on architectural and engineering services employment increased 2.9 percent from August 2006 to August 2007, much faster than the rate of employment growth overall or in nonresidential construction. Generally, architects and engineers are hired only if an owner plans to do construction. A monthly survey by the American Institute of Architects of 300 architectural firms has consistently reported higher billings throughout 2007 for nonresidential practices. And monthly reports from Reed Construction Data and McGraw-Hill Construction (the “Dodge Report”) show a generally rising trend for nonresidential construction.
All of these signals portend a further increase in hiring and an acceleration of wage increases beyond the 4.5 percent recorded from August 2006 to August 2007. It is likely that average hourly earnings in construction will rise at an annual rate of 5-5.5 percent during the next several months. If residential construction revives in the second half of 2008, specialty trade workers will be at even more of a premium, especially if there is a crackdown on immigration. In that case, wages could rise as much as 6 percent annually by the end of 2008.
Putting the Pieces Together
Nonresidential construction so far has shrugged off years of high materials costs, a steep downturn in homebuilding, and, most recently, turmoil in credit markets. At the moment, it appears the industry will continue to expand in 2008, though most likely at single-digit rates, not the 14 percent growth in spending that occurred in January-August 2007 compared to January-August 2006.
The Associated General Contractors of America | 2300 Wilson Blvd. | Arlington, VA | www.agc.org
“I am turning down
work in four New
England states right
now due to lack of
skilled labor.”
– New England
contractor

13 AGC’s CONSTRUCTION INFLATION ALERT: 2007
The Associated General Contractors of America | 2300 Wilson Blvd. | Arlington, VA | www.agc.org
The rate of cost increases for construction inputs slowed from 8-10 percent in 2004 through mid-2006 to only 1.6 percent in the 12 months ending in August 2007. But this slowdown was in comparison to record-high prices, for many inputs in the spring and summer of 2006. The cumulative increase since December 2003 in the PPI for construction inputs remains more than double the increase in the CPI, 28 percent vs. 13 percent. Moreover, the price plunge of late 2006 is unlikely to be repeated. Instead, materials price comparisons in late 2007 and early 2008 probably will show increases of 3-5 percent rather than the 1.5-3 percent range for the CPI.
Meanwhile, the nonresidential industry has benefited from greater availability of specialty trade workers who have lately shifted from residential work. But wages have begun rising more steeply for specialty trade contractors, suggesting that the number of workers suitable to switch is close to exhaustion. In the next several months, the rate of wage increases is likely to reach 5-5.5 percent, up from a recent 4.5 percent gain.
Residential construction may start to pick up in the second half of 2008. If so, the tumble in gypsum and wood products prices that has held down the overall price index for construction materials inputs would end. Because construction depends on materials that are in hot demand worldwide and “sticky” supply, and because transport and fuel costs are an important element of the delivered price of construction materials, renewed growth in construction during a period of high worldwide demand could mean construction input prices rise 6-8 percent a year for several years beginning in mid-2008.
Labor costs are likely to accelerate further as well if residential building begins to draw back specialty trade contractors in late 2008. Construction wages could go up 5-6 percent annually for several years beginning in late 2008.
The bottom line: Owners, budget setters and contractors should expect larger materials and labor cost increases in 2008 than they have experienced in the past 12 months. Nonresidential construction activity is still likely to grow, as will demand for construction materials that are used in other industries and other countries.

AGC’s CONSTRUCTION INFLATION ALERT: 2007 14
BLS Series ID 12 months through December: to August 2007 since:
2001 2002 2003 2004 2005 2006 7/07 5/07 8/06 12/03
CUUR0000SA0 Consumer price index (CPI-U) 1.6 2.4 1.9 3.3 3.4 2.5 -0.2 0.0 2.5 12.8
WPUSOP3000 Producer price index (PPI) for finished goods -1.6 1.2 4.0 4.2 5.4 1.1 -1.4 -1.2 2.2 14.7
WPUSOP2200 PPI for materials and components for construction
0.0 0.8 3.0 10.1 6.1 4.3 -0.1 0.4 1.5 24.1
PCU236221236221 New warehouse construction not available before 2005 7.5 8.1 0.3 1.4 5.4 n.a.
PCU236222236222 New school construction not available; series began 12/05
17.3 -0.2 0.4 11.6 n.a.
PCU236222236223 New office construction not available; series began June 2006 0.0 0.3 5.4 n.a.
Table 4: Changes in PPIs Weighted by Construction Types
BLS Series ID 12 months through December: to August 2007 since:
2001 2002 2003 2004 2005 2006 7/07 5/07 8/06 12/03
PCUBCON Inputs to construction industries -0.9 0.7 3.0 9.1 8.2 4.6 -0.8 -0.1 1.6 27.9
PCUBHWY Highway and street construction -3.6 1.0 2.6 10.8 14.1 6.2 -2.0 -1.3 1.5 42.6
PCUBHVY Other heavy construction -2.6 1.0 2.6 13.4 8.8 5.5 -1.1 -0.4 2.0 36.4
PCUBBLD Nonresidential buildings -0.5 0.7 2.4 9.3 7.4 4.0 -0.8 0.0 1.5 26.5
PCUBRSM Multi-unit residential -0.1 0.4 2.7 8.9 7.8 4.9 -0.6 0.1 1.9 26.8
PCUBRS1 Single-unit residential -0.4 0.6 3.5 7.0 6.9 4.2 -0.3 0.4 1.7 22.1
BLS Series ID 12 months through December: to August 2007 since:
2001 2002 2003 2004 2005 2006 7/07 5/07 8/06 12/03
WPU056 Crude petroleum (domestic production) -42.4 60.6 14.3 30.5 49.6 -0.1 1.3 16.5 -0.3 137.9
WPU0553 Industrial natural gas -36.7 12.2 20.3 20.1 31.5 -13.2 -5.2 -6.8 -1.3 26.2
WPU066 Plastic resins and materials -9.8 9.2 6.4 28.6 10.8 -7.8 0.0 2.3 -1.7 38.1
WPU1321 Construction sand/gravel/crushed stone 3.3 2.5 2.4 4.3 7.7 9.3 0.6 1.1 7.8 31.4
WPU1322 Cement 1.0 1.3 -1.1 7.9 12.2 10.5 -0.3 -1.0 4.0 38.9
WPU1011 Iron ore 1.5 -1.3 1.6 6.7 15.5 7.5 0.0 0.5 -4.5 34.3
WPU1012 Iron and steel scrap -5.6 27.8 64.9 50.8 -10.8 2.9 3.0 -1.1 17.5 67.7
WPU101212 Stainless and alloy steel scrap no data from 1996 until September 2006 22.8 -44.7 n.a.
WPU102102 Copper ores (through 7/07; no data for 8/07)
-19.6 3.6 37.4 65.1 39.3 53.1 -1.0 12.9 -2.7 292.2
WPU102301 Copper base scrap -17.4 11.2 30.7 34.5 51.9 50.0 -3.8 -8.2 5.4 232.4
Table 5: Changes in PPIs for Basic Inputs Important to Construction
Table 3: Changes in Consumer, Producer & Construction Prices
Updated 9/19/07 Source: Bureau of Labor Statistics (BLS): www.bls.gov/cpi for CPI, www.bls.gov/ppi for PPIsCompiled by Ken Simonson ([email protected]), Chief Economist, Associated General Contractors of America, www.agc.org

15 AGC’s CONSTRUCTION INFLATION ALERT: 2007
The Associated General Contractors of America | 2300 Wilson Blvd. | Arlington, VA | www.agc.org
Table 6: Changes in PPIs for Specific Construction Inputs
BLS Series ID 12 months through December: to August 2007 since:
2001 2002 2003 2004 2005 2006 7/07 5/07 8/06 12/03
WPU057303 #2 diesel fuel -44.7 54.4 13.0 37.9 46.7 2.3 -3.3 3.9 -5.9 140.0
WPU05810112 Asphalt (at refinery) not available 10.0 18.3 17.8 34.9 -5.7 1.2 -18.6 107.0
WPU13940113 Asphalt paving mixtures and blocks not available 4.2 14.4 27.7 0.1 0.8 3.6 49.3
WPU136 Asphalt felts and coatings 4.6 -0.6 6.3 4.1 15.3 5.0 1.9 0.6 0.5 26.2
WPU1361 Prepared asphalt & tar roofing & siding products
5.0 -1.7 5.3 4.6 16.2 5.2 1.9 -0.1 2.3 27.4
WPU133 Concrete products 2.5 -0.3 1.5 7.6 10.1 8.1 0.0 0.2 3.5 31.5
WPU1331 Concrete block and brick 2.3 1.6 3.2 4.7 8.1 6.8 0.2 0.3 3.0 24.8
WPU1332 Concrete pipe 4.4 1.7 1.4 5.5 7.5 2.5 -0.1 0.5 1.8 18.4
WPU1333 Ready-mixed concrete 2.5 -1.1 2.1 8.7 11.3 10.1 0.0 0.5 3.4 36.5
WPU1334 Precast concrete products 0.7 0.3 2.5 6.0 6.0 4.7 0.3 -0.5 4.9 22.3
WPU1335 Prestressed concrete products 5.3 1.8 -0.2 8.2 14.3 4.9 0.4 -1.2 1.0 30.1
WPU1342 Brick and structural clay tile 5.3 1.9 0.7 3.0 9.4 6.0 0.2 0.2 1.1 19.8
WPU072106 Plastic construction products -2.7 3.1 3.2 7.2 21.6 -0.7 0.2 0.7 -0.9 29.6
WPU137 Gypsum products 0.4 3.4 2.8 20.0 18.8 5.5 -2.6 -5.9 -21.8 27.5
WPU1392 Insulation materials 0.4 -1.5 2.0 8.6 2.6 2.1 -0.1 -1.1 -3.9 11.5
WPUSI004011 Lumber and plywood -2.9 1.4 13.1 5.0 -1.1 -10.8 -1.5 1.5 -0.4 -2.8
WPU062101 Architectural coatings 2.9 0.6 3.9 5.3 9.2 6.3 0.1 -0.1 4.6 27.3
WPU1017 Steel mill products -6.1 11.1 1.7 48.8 -3.8 11.6 -2.7 -5.3 -0.6 61.3
WPU101704 Hot-rolled bars, plates, & structural shapes
-4.3 2.1 11.3 53.8 -1.0 7.5 -2.0 -1.6 9.2 80.3
WPU101706 Steel pipe and tube -3.7 9.1 3.3 66.0 1.2 5.5 0.4 0.3 -1.2 74.7
WPU102502 Copper and brass mill shapes -9.5 -1.6 11.6 29.6 31.0 44.4 -1.2 2.8 2.6 168.3
WPU102501 Aluminum mill shapes -2.9 -0.9 -0.5 9.9 5.0 12.7 -0.2 -1.6 3.4 32.0
WPU107405 Fabricated structural metal -1.3 -2.4 0.1 24.7 2.8 3.6 -0.1 0.0 2.9 37.5
WPU10740501 Fabricated structural metal for buildings -1.5 -3.3 -0.1 20.0 3.1 3.3 -0.1 0.2 2.9 32.6
WPU107408 Architectural and ornamental metalwork -0.1 3.7 0.7 23.5 3.1 4.9 1.0 1.3 4.7 36.4
WPU107409 Fabricated iron & steel pipe, tube, & fittings
0.6 0.1 1.2 32.6 5.5 -2.8 0.7 -1.2 -6.3 36.3
WPU1076 Fabricated steel plate 0.6 -1.0 0.6 7.6 0.6 8.6 2.0 3.1 5.3 22.8
WPU1079 Prefabricated metal buildings 0.0 4.0 -0.7 35.5 2.0 5.5 0.8 1.3 2.7 47.7
WPU112 Construction machinery and equipment -0.1 1.9 1.3 6.0 4.9 3.6 0.1 0.5 2.6 17.2
AGC’s CONSTRUCTION INFLATION ALERT: 2007 16
The Associated General Contractors of America | 2300 Wilson Blvd. | Arlington, VA | www.agc.org
AGC Resources for Tracking Construction Economic Information
AGC provides a variety of materials to help contractors, owners and the public learn what is happening to construction costs. The Data DIGest is a weekly one-page email newsletter covering economic developments, including cost and supply issues, affecting construction. It is posted at www.agc.org; for a free subscription, email [email protected]. Once a month, tables of PPIs for construction materials and segments are sent along with The Data DIGest (See Table 3-6, pages 14-15). AGC also offers fact sheet comparing construction by state at www.agc.org/factsheets. Back issues of AGC’s Construction Inflation Alert are posted at www.agc.org. Audio conferences with experts on construction economics and specific materials and segments are held twice a year and can be purchased for download; go to www.agc.org/audioconference.
About the Author
Ken Simonson has been Chief Economist for AGC of America since 2001. In that role, he provides a multitude of information, through written materials, personal appearances, and media interviews, about the role of construction in the economy and about economic developments affecting construction nationally and locally.
Ken was appointed in 2006 to the Blue Ribbon Panel of experts advising the National Surface Transportation Policy and Revenue Study Commission. Ken is a board member of the National Association for Business Economics (NABE) and chairs its quarterly Industry Survey.
Among his many publications is “Digging into Construction Data,” published in NABE’s journal, Business Economics. Since 1982, he has co-chaired the Tax Economists Forum, a professional meeting group he co-founded for leading researchers and policy makers among tax economists. He is a member of several other professional organizations for economists.
Ken has a BA in economics from the University of Chicago, an MA in economics from Northwestern University, and has taken advanced graduate economics courses at the Université de Paris, Johns Hopkins and Georgetown.