Embed Size (px)
Citation preview

2016 ANNUAL REPORT
ENGiNEERiNGFOOd SeCurity
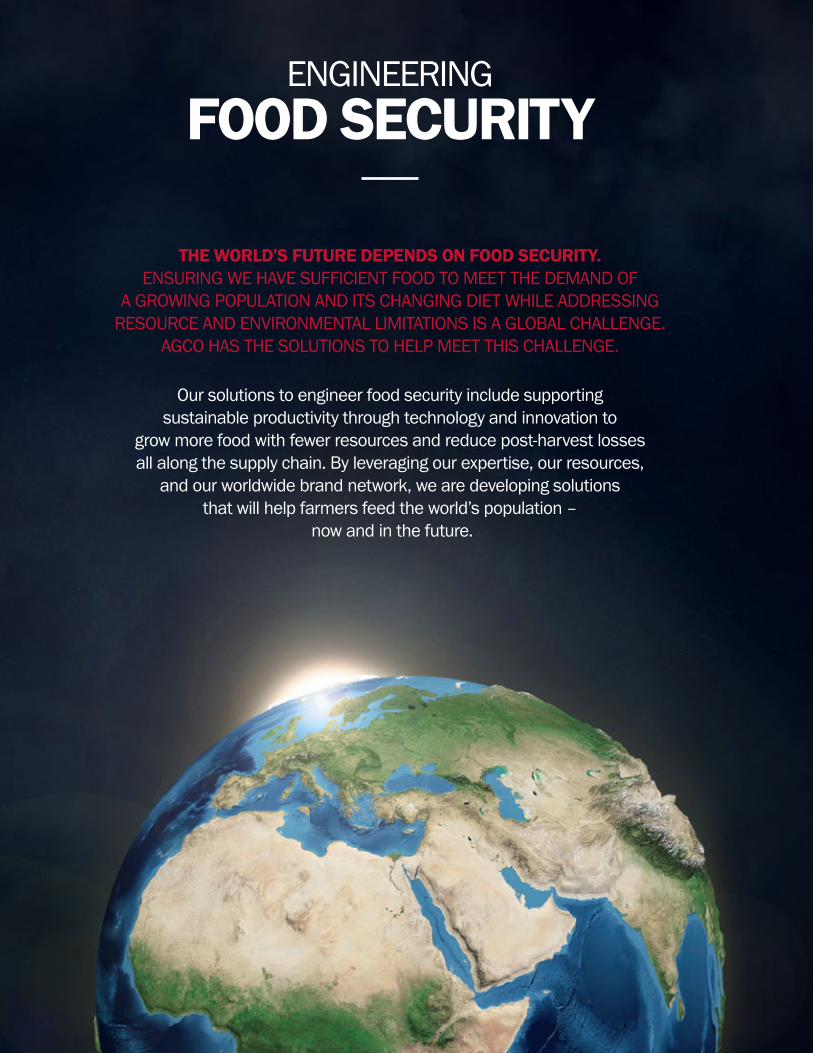
ENGiNEERiNGFOOd SeCurity
the wOrld’S Future dependS On FOOd SeCurity. ENSURiNG wE hAvE SUFFiCiENT FOOD TO mEET ThE DEmAND OF
A GROwiNG POPULATiON AND iTS ChANGiNG DiET whiLE ADDRESSiNG RESOURCE AND ENviRONmENTAL LimiTATiONS iS A GLObAL ChALLENGE.
AGCO hAS ThE SOLUTiONS TO hELP mEET ThiS ChALLENGE.
Our solutions to engineer food security include supporting sustainable productivity through technology and innovation to
grow more food with fewer resources and reduce post-harvest losses all along the supply chain. by leveraging our expertise, our resources,
and our worldwide brand network, we are developing solutions that will help farmers feed the world’s population –
now and in the future.

02Page
2016 AnnuAl RepoRt AGCO 01
Financial HigHligHts
net SAleS
$7.4Bn
FRee CASh Flow*
$169M
AdjuSted net inCoMe*
$201.6M
AdjuSted epS*
$2.47
ContentS
agco at a glance
Page
04
10
Page
06global Presence
a Message from Martin Richenhagen
Page
Engineering Food security
12Page
agco’s Food security solutions
02 AGCo at a Glance
04 Global presence
06 A Message from Martin Richenhagen
10 our Commitment to engineering Food Security
12 AGCo’s Food Security Solutions
18 officers and directors
20 Selected Financial data
21 Consolidated Statements of operations
22 Consolidated Balance Sheets
23 Consolidated Statements of Cash Flows
24 Consolidated Statements of Stockholders’ equity
26 Forward-looking Statements
27 Shareholder information
28 Global Recognition
*please see reconciliation of non-GAAp measures on page 20.

02 AGCO 2016 AnnuAl RepoRt
AGCo AT A GLANCE
AGCo hAS A lonG-StAndinG hiStoRy oF deliveRinG leAdinG AGRiCultuRAl innovAtionS
And SolutionS ACRoSS the Supply ChAin
lEaDing BRanDs
GSi offers world-class grain storage, material handling, conditioning, and structures, as well as seed-processing solutions and a full line of swine and poultry production equipment.
From straightforward performance to high-specification machines, Massey Ferguson is a force in global agriculture.
Valtra equipment is specifically designed for farmers and contractors who value close customer relationships, as well as solutions that handle demanding working conditions.
Challenger delivers a comprehensive range of high-performance machines built to maximize returns.
From tractors to harvesters to balers, when it comes to Fendt, it’s always high quality; it’s always high-tech.
innovative, powerful and recognizable brands like Challenger®, Fendt®, GSi®, Massey Ferguson®, and valtra®.
AGCo’s broad portfolio of brands empowers farmers and helps engineer food security sustainably and profitably.
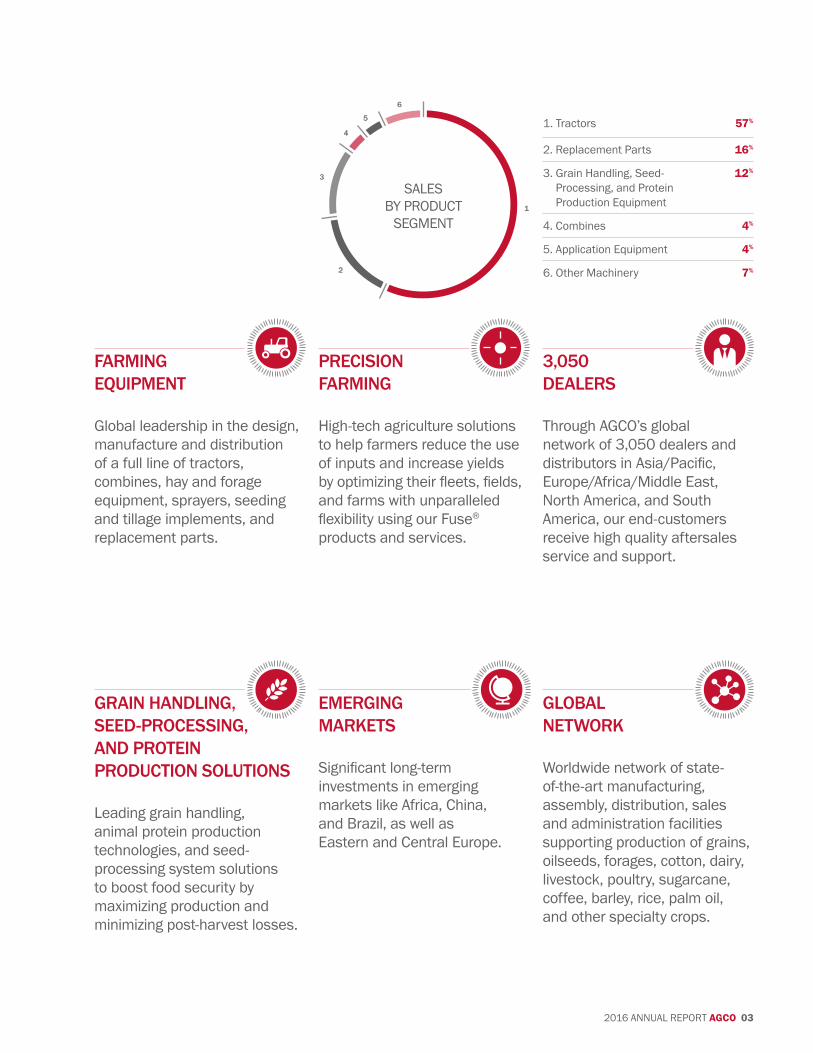
1
6
5
4
3
2
2016 AnnuAl RepoRt AGCO 03
FaRMing EquiPMEnt
Global leadership in the design, manufacture and distribution of a full line of tractors, combines, hay and forage equipment, sprayers, seeding and tillage implements, and replacement parts.
PREcision FaRMing
high-tech agriculture solutions to help farmers reduce the use of inputs and increase yields by optimizing their fleets, fields, and farms with unparalleled flexibility using our Fuse® products and services.
3,050 DEalERs
through AGCo’s global network of 3,050 dealers and distributors in Asia/Pacific, europe/Africa/Middle east, north America, and South America, our end-customers receive high quality aftersales service and support.
gRain HanDling, sEED-PRocEssing, anD PRotEin PRoDuction solutions
leading grain handling, animal protein production technologies, and seed-processing system solutions to boost food security by maximizing production and minimizing post-harvest losses.
EMERging MaRkEts
Significant long-term investments in emerging markets like Africa, China, and Brazil, as well as eastern and Central europe.
gloBal nEtwoRk
worldwide network of state- of-the-art manufacturing, assembly, distribution, sales and administration facilities supporting production of grains, oilseeds, forages, cotton, dairy, livestock, poultry, sugarcane, coffee, barley, rice, palm oil, and other specialty crops.
SAleS By pRoduCt
SeGMent
1. tractors 57%
2. Replacement parts 16%
3. Grain handling, Seed-processing, and protein production equipment
12%
4. Combines 4%
5. Application equipment 4%
6. other Machinery 7%

04 AGCO 2016 AnnuAl RepoRt
South AMeRiCA
290deAleRS
noRth AMeRiCA
1,390deAleRS
12%ReGionAl net SAleS
24%ReGionAl net SAleS
Global Corporate headquarters
Regional Corporate headquarters
l Manufacturing/Assembly
nManufacturing/Assembly (joint venture)
sparts distribution
Future Farm and Global learning Centre
GloBAl PRESENCE
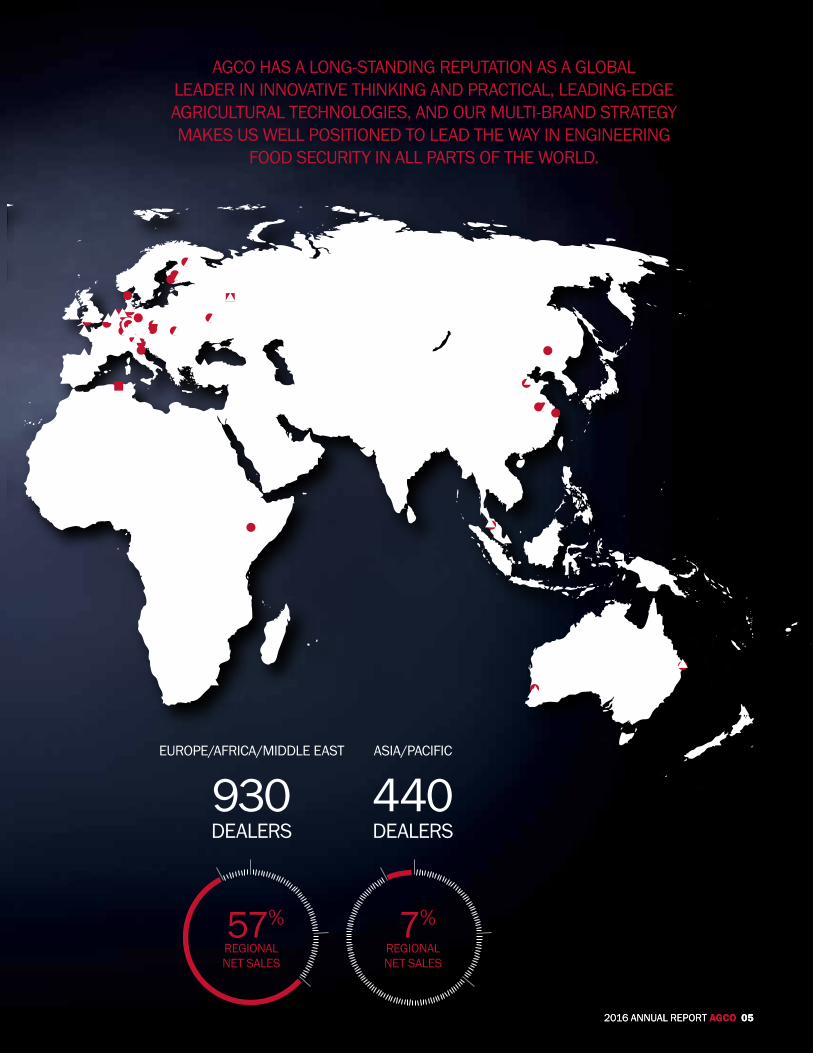
2016 AnnuAl RepoRt AGCO 05 2016 AnnuAl RepoRt AGCO 05
ASiA/pACiFiC
440deAleRS
euRope/AFRiCA/Middle eASt
930deAleRS
AGCo hAS A lonG-StAndinG ReputAtion AS A GloBAl leAdeR in innovAtive thinkinG And pRACtiCAl, leAdinG-edGe AGRiCultuRAl teChnoloGieS, And ouR Multi-BRAnd StRAteGy MAkeS uS well poSitioned to leAd the wAy in enGineeRinG
Food SeCuRity in All pARtS oF the woRld.
57%ReGionAl net SAleS
7%ReGionAl net SAleS

06 AGCO 2016 AnnuAl RepoRt
a MEssagE FRoM MaRtin RicHEnHagEn ChAiRMAn, pReSident And ChieF eXeCutive oFFiCeR
FoCuS ON GROWTH

2016 AnnuAl RepoRt AGCO 07
2016 FinAnCiAl ReCApour industry and AGCo (the “Company”) experienced soft market demand last year. A record grain harvest in the u.S. combined with healthy crop production across europe and Brazil resulted in increased grain inventories and lower soft commodity prices. deteriorating farm economics negatively impacted farmer sentiment, and we experienced softer industry equipment demand in all major markets. we responded by cutting production and closely managing our Company and dealer inventories. AGCO’s 2016 results reflect the adverse impact of operating in the lower end of the agricultural equipment cycle, particularly in north and South America.
AGCO’s 2016 net sales were $7.4 billion, relatively flat compared to 2015 levels. Adjusted net income for 2016 was $2.47 per share, excluding restructuring expenses of $0.12 per share and a non-cash deferred income tax adjustment of $0.39 per share. We generated approximately $169 million in free cash flow after funding significant investments in new products and other long-term profitability improvement initiatives. Our free cash flow was largely used to support share repurchases of approximately $213 million in 2016.
StRAteGy updAteAt AGCo, we are focused on consistent execution against strategic principles that are driven by our vision and mission. our clear vision at AGCo is to provide high-tech solutions for professional farmers feeding the world. we accomplish this by supplying agricultural equipment that increases the efficiency and productivity of our customers. AGCo’s mission, with the shareholder in mind, is to achieve profitable growth through superior customer service, innovation, quality, and commitment.
For more than two decades, AGCo has been working to provide the right products and the right technology to compete effectively in our dynamic marketplace. we will continue to invest in new products, new technology, and improved distribution in order to expand our margins and produce higher returns on our invested capital. during the downturn we are working diligently on our cost reduction strategies targeted at purchasing actions, factory productivity, and new product development.
Fellow shareholders, AGCo is dedicated to generating long-term shareholder value. over the past three years, market conditions in our industry have weakened significantly providing a strong test of our ability to operate successfully throughout the business cycle.
in a year of challenging farm fundamentals and weak industry demand, i am pleased to tell you that 2016 was a year of significant progress on many fronts for AGCO. We met our financial goals, launched important new products, completed a strategic acquisition, expanded our Fuse technology capabilities, and continued to improve our production facilities. As you will read in the coming pages, our success is achieved through our operational excellence, project-execution capabilities, and the application of new technologies, supported by strong financial flexibility, investment discipline, and a world-class workforce. All of this lets AGCo do its part to meet the global challenge of food security, and support farmers and our global partners in profitable, sustainable food production, both now and in the future.
please see reconciliation of non-GAAp measures on page 20.

08 AGCO 2016 AnnuAl RepoRt
you can view our latest video with Martin Richenhagen, Ceo, where he discusses AGCo’s successful year:
www.AGCOcorp.com/ar2016video
a MEssagE FRoM MaRtin RicHEnHagEn ChAiRMAn, pReSident And ChieF eXeCutive oFFiCeR
Sales growth is another important element of our margin improvement roadmap. AGCo is focused on growing our business in the markets we currently serve and expanding into the developing areas of eastern and Central europe, China, and Africa. A key sales-growth initiative is our investment in product development. A great example of this is the Fendt 1000 tractor that launched during 2016. it delivers over 500 horsepower on an impressive conventional chassis, making it very efficient and more flexible to perform a wider variety of operations.
high horsepower tractors for the professional producer segment have always been a major strength and focus for AGCo. the launch of the Fendt 1000 marks an important beginning of our premium tractor platform consolidation. this new tractor range also introduced our Fendt technology for the north American market under the Challenger brand. The Challenger version of this tractor was designed specifically to meet north American row width standards, providing us with a new opportunity to increase our sales of premium tractors in north America.
our research and development also includes investments in Fuse, AGCo’s approach to precision agriculture that optimizes the farm by providing improved access to farm data and better connections to trusted service providers. these improvements allow farmers to make more informed business decisions, reduce input costs, and improve yields, and profitability.
the two key components of our Fuse program are Fuse technologies and Fuse Connected Services. Fuse technologies is the portfolio of technology tools that are the foundation of the optimized farm, and we have solutions that address all elements of improving farm productivity and reducing farm waste. Fuse Connected Services builds on this by using data-transfer technologies and analytic insights combined with dealer capabilities to help customers optimize their fleet and farm, and maximize up-time throughout the year.
this past year was the biggest yet for our Fuse initiative. Along with new product introductions, we announced development partnerships with agricultural technology companies Aglytix and Farmobile to deliver farm-optimization services to AGCo customers. these partnerships will enable growers to reduce waste, increase yield, and improve profitability through actionable insights for their fleet, in their fields and across their farms. Fuse also continued to receive awards as the recipient of two 2016 technology innovator Awards by Corporate Vision magazine, including “Most innovative Agricultural platform.”
Another important growth driver for AGCo is our GSi family of products and services. in our grain handling business, we are a global leader in storing, moving, and drying grains. we offer world-class solutions for on-farm storage and commercial applications, including river and rail terminals and sea ports. the acquisition of Cimbria in September brought us the leading position in the global seed-processing equipment market and together, GSi and Cimbria combine to extend our global leadership in grain handling.
while the low commodity prices have hurt demand for our grain handling products in 2016, demand has increased for our global animal protein businesses. For swine, poultry, and egg producers, we provide housing, climate control, feeding, and watering solutions. we are a global leader across these categories, and our recent entrance into the commercial egg market provides us significant growth opportunities. We are bringing new, best-in-class technologies for improving animal welfare, including being a leading provider of cage-free systems for commercial egg producers in north America.
ouR long-tERM viEw REMains oPtiMistic FoR ouR inDustRy anD FoR agco, anD ouR stRatEgy is aiMED at gRowing ouR BusinEss anD iMPRoving tHE REtuRns FoR ouR sHaREHolDERs as wE continuE to PRoviDE solutions tHat will HElP EnginEER gloBal FooD sEcuRity.”
2016 AnnuAl RepoRt AGCO 09
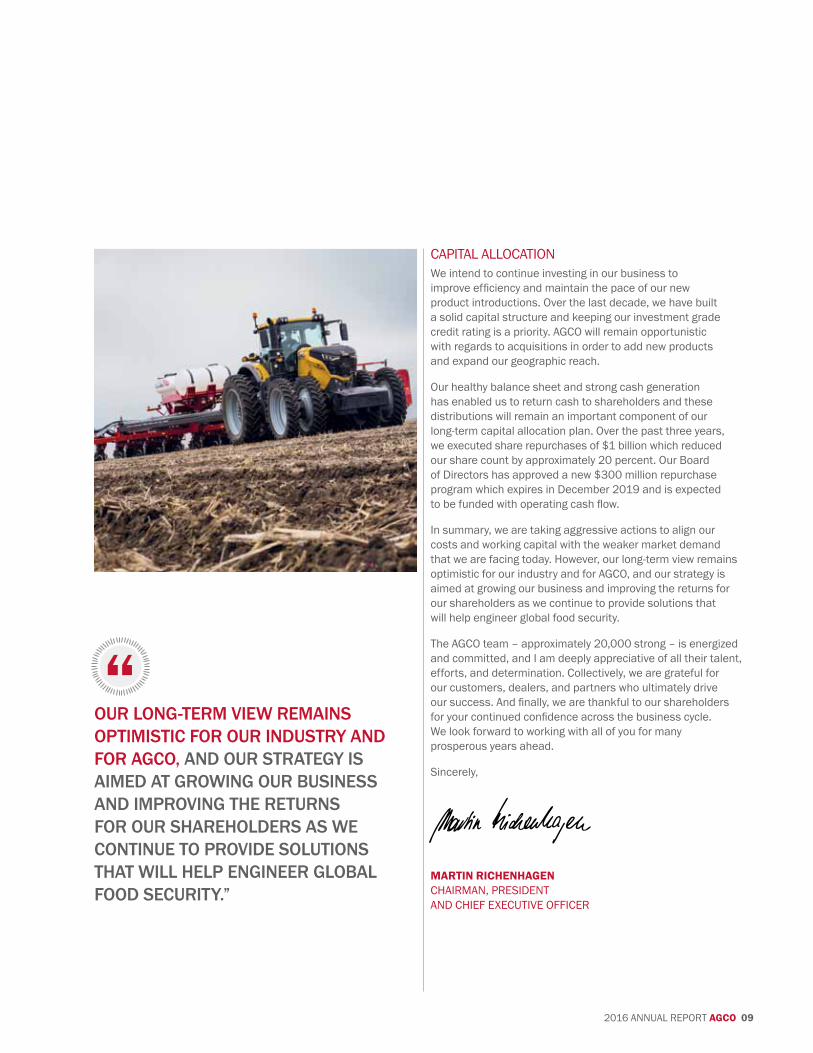
CApitAl AlloCAtionwe intend to continue investing in our business to improve efficiency and maintain the pace of our new product introductions. over the last decade, we have built a solid capital structure and keeping our investment grade credit rating is a priority. AGCo will remain opportunistic with regards to acquisitions in order to add new products and expand our geographic reach.
our healthy balance sheet and strong cash generation has enabled us to return cash to shareholders and these distributions will remain an important component of our long-term capital allocation plan. over the past three years, we executed share repurchases of $1 billion which reduced our share count by approximately 20 percent. our Board of directors has approved a new $300 million repurchase program which expires in december 2019 and is expected to be funded with operating cash flow.
in summary, we are taking aggressive actions to align our costs and working capital with the weaker market demand that we are facing today. however, our long-term view remains optimistic for our industry and for AGCo, and our strategy is aimed at growing our business and improving the returns for our shareholders as we continue to provide solutions that will help engineer global food security.
the AGCo team – approximately 20,000 strong – is energized and committed, and i am deeply appreciative of all their talent, efforts, and determination. Collectively, we are grateful for our customers, dealers, and partners who ultimately drive our success. And finally, we are thankful to our shareholders for your continued confidence across the business cycle. we look forward to working with all of you for many prosperous years ahead.
Sincerely,
MARTiN RiCHENHAGENChAiRMAn, pReSident And ChieF eXeCutive oFFiCeR

10 AGCO 2016 AnnuAl RepoRt
ouR CoMMitMent to ENGiNEERiNG FOOd
SECuRiTy
enSuRinG the woRld hAS enouGh to eAt iS not An eASy tASk, But it iS A key dRiveR Behind ouR
BuSineSS – the BuSineSS oF SuppoRtinG Food pRoduCeRS ARound the woRld. thRouGh ReSponSiBle MAnAGeMent oF itS poRtFolio oF BRAndS, AGCo iS one oF the woRld’S
leAdinG AGRiCultuRAl induStRy inFluenCeRS And iS ACtively involved in All StAGeS oF the
AGRiCultuRAl liFe CyCle.
AGCo is focused on delivering practical solutions to increase agricultural production with mechanization and boost productivity using precision farming technology. we also encourage healthy animal protein production with efficient and responsible solutions and support the delivery of more food to market by reducing post-harvest losses with better harvesting and grain handling.
our global expertise and innovative technologies are focused on meeting the challenges that farmers face around the world. through our development and innovation commitments, our goal is to empower farmers to find solutions to those
challenges. that empowerment will help us collectively engineer food security and ensure the sustainability of our business, our industry, and our planet.
As a global thought leader, AGCo supports the united nations’ Sustainable development Goals and plays a critical role in notably addressing Goal 2* to end hunger, achieve food security, improve nutrition, and promote sustainable agriculture; and Goal 12* to ensure sustainable consumption and production patterns such as reducing post-harvest losses.
united nAtionS SuStAinABle developMent GoAlS*
* sustainabledevelopment.un.org/sdgs
10 AGCO 2016 AnnuAl RepoRt
2016 AnnuAl RepoRt AGCO 11
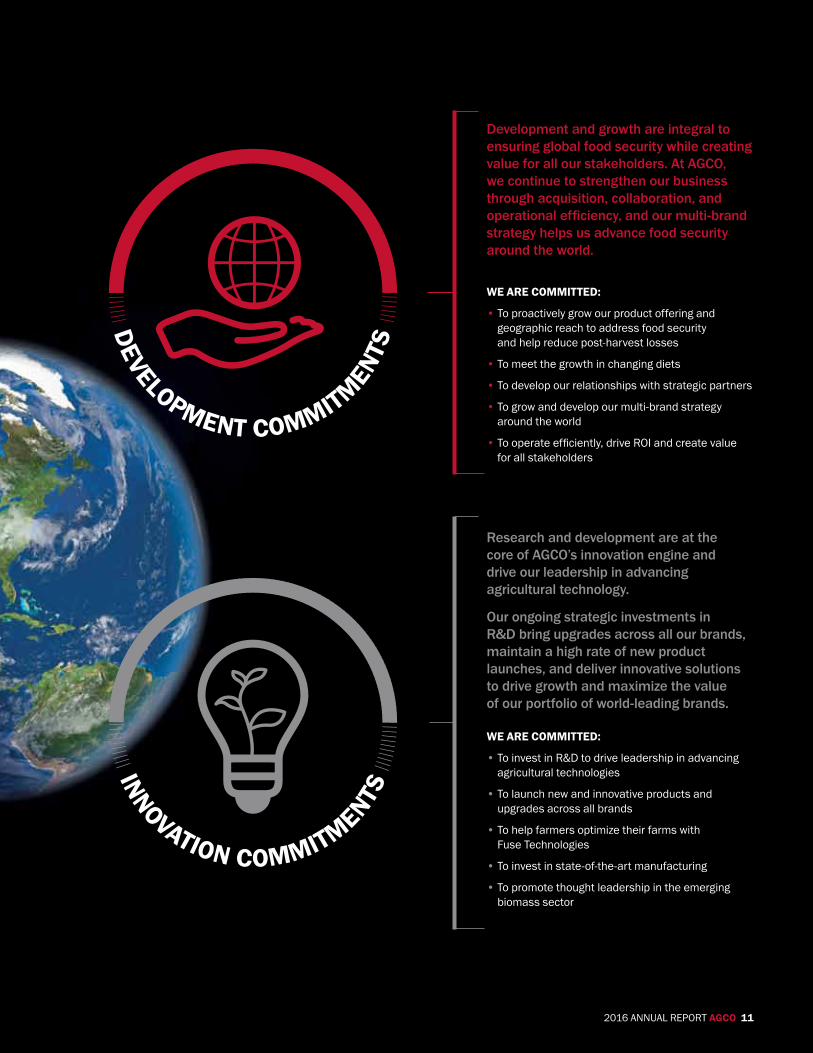
Development and growth are integral to ensuring global food security while creating value for all our stakeholders. at agco, we continue to strengthen our business through acquisition, collaboration, and operational efficiency, and our multi-brand strategy helps us advance food security around the world.
WE ARE COMMiTTEd:
• to proactively grow our product offering and geographic reach to address food security and help reduce post-harvest losses
• to meet the growth in changing diets
• to develop our relationships with strategic partners
• to grow and develop our multi-brand strategy around the world
• To operate efficiently, drive ROI and create value for all stakeholders
Research and development are at the core of agco’s innovation engine and drive our leadership in advancing agricultural technology.
our ongoing strategic investments in R&D bring upgrades across all our brands, maintain a high rate of new product launches, and deliver innovative solutions to drive growth and maximize the value of our portfolio of world-leading brands.
WE ARE COMMiTTEd:
• to invest in R&d to drive leadership in advancing agricultural technologies
• to launch new and innovative products and upgrades across all brands
• to help farmers optimize their farms with Fuse technologies
• to invest in state-of-the-art manufacturing
• to promote thought leadership in the emerging biomass sector
2016 AnnuAl RepoRt AGCO 11
dEVELOPMENT COMMiTMENTS
iNNOVATiON COMMiTMENTS

12 AGCO 2016 AnnuAl RepoRt
agco’s commitment to post-harvest loss reduction is at the core of investments in its gsi business of cutting-edge, scalable technologies for grain and perishables storage.
the 2016 acquisition of Cimbria, a leading manufacturer of products and solutions for the processing, handling, and storage of seed and grain, has added global leadership in the seed-handling industry as well as new grain markets to the AGCo portfolio. this supports better inputs for farmers and helps reduce post-harvest losses.
with its strong GSi family of brands, which include grain handling and seed-processing, as well as poultry, egg, and swine production, AGCo is well positioned to meet future shifts in global dietary demands.
COMMiTMENT TO REduCiNG
POST-HARVEST LOSSES
AGCo’S FOOd SECuRiTy
SOLuTiONS

AnnuAl RepoRt 2016 AGCO 13 2016 AnnuAl RepoRt AGCO 13
RESPONSibLy MEETiNG THE CHALLENGE OF PROTEiN dEMANd
Global demand for high quality protein is increasing due to an expanding middle class and improving animal welfare is becoming more critical. through GSi’s animal protein production brands, we are meeting these challenges by providing the most efficient animal production systems. As a leader in commercial egg systems, GSi offers one of the most comprehensive global portfolios for commercial egg production. in europe and north America, GSi is a leader in enriched and cage-free systems and will continue to lead the industry with its launch of next generation aviary solutions as well as through its continuous commitment to product innovation for developing leading products for the commercial egg production market worldwide.
PROMOTiNG iNNOVATiVE SOLAR-POWEREd COLd STORAGE SOLuTiONS
Food storage systems can be a critical way of boosting farm productivity and food security in Africa, where significant losses occur annually due to inadequate post-harvest infrastructure.
A promising innovation is a village-level, solar-powered cold storage for perishables. this will allow smallholder farmers to reduce post-harvest losses and improve their market access by extending the shelf life of perishables until they can be sold at a fair price.

AGCo’S FOOd SECuRiTy
SOLuTiONSContinued
14 AGCO 2016 AnnuAl RepoRt
we are committed to delivering innovative, practical solutions that empower farmers, shape the long-term sustainability of agriculture, and strengthen food security around the world. our global series tractor platform, for example, represents the heart of agco and what we do – provide machinery to feed the world.
the Global Series is an investment in the future that addresses tractor production and development in the all-important low to medium horsepower sector. this platform expresses our commitment to brand-new designs, to delivering sustainable manufacturing in all parts of the world, and to transforming agriculture through the production of machines with appropriate technology to support a wide range of farming sectors.
iNVESTiNG iN NEW PROduCT LAuNCHES ANd
uPGRAdES

AnnuAl RepoRt 2016 AGCO 15 2016 AnnuAl RepoRt AGCO 15
CONTiNuiNG iNVESTMENT iN FuSE TECHNOLOGiES
we are continuing our investment in our Fuse initiative, developing precision farming solutions to drive productivity and increase yields.
The past year marked the most significant yet for Fuse technologies. new development partnerships will allow AGCo to deliver farm optimization services to its customers and give farmers actionable insights into their fleets, fields, and farms to support waste reduction, yield increases, and improved profitability.
iNVESTiNG iN STATE-OF- THE-ART MANuFACTuRiNG
AGCo’s manufacturing facilities are quality-driven and state-of-the-art, and we are constantly making investments to ensure we stay efficient, innovative, and on the cutting edge.
in 2016, our tractor manufacturing facility in Beauvais, France won the Factory of the year 2016 award from L’Usine Nouvelle, France’s leading industrial magazine. Some 14,500 Massey Ferguson tractors roll off the assembly lines each year at this site. An implementation of lean manufacturing standards has brought high levels of efficiency and agility that let us respond quickly to changing market demands.

16 AGCO 2016 AnnuAl RepoRt
AGCo’S FOOd SECuRiTy
SOLuTiONSContinued
increasing farm productivity and food security is at the heart of agco’s africa strategy.
our 150-hectare Future Farm in Zambia now features the full line of Fuse technologies. its facilities, which also include crop demonstration plots and GSi grain storage and protein production units, provide training in agronomy and modern agricultural practices to farmers, equipment operators, and service people. plans for a second Future Farm in French-speaking west Africa are underway.
AGCo’s partnership with the international non-profit organization Cultivating new Frontiers in
Agriculture is part of our vision to transform African agriculture through inclusive, sustainable mechanization solutions. our new Massey Ferguson Farm Mechanization package, which consists of a tractor and multiple compatible implements, is aimed at farmers taking their first steps in mechanized agriculture.
our annual Africa Summit brings together international leaders to share innovative approaches to further the development of the agricultural sector on the continent.
dRiViNG AGRiCuLTuRAL
MECHANizATiON iN AFRiCA
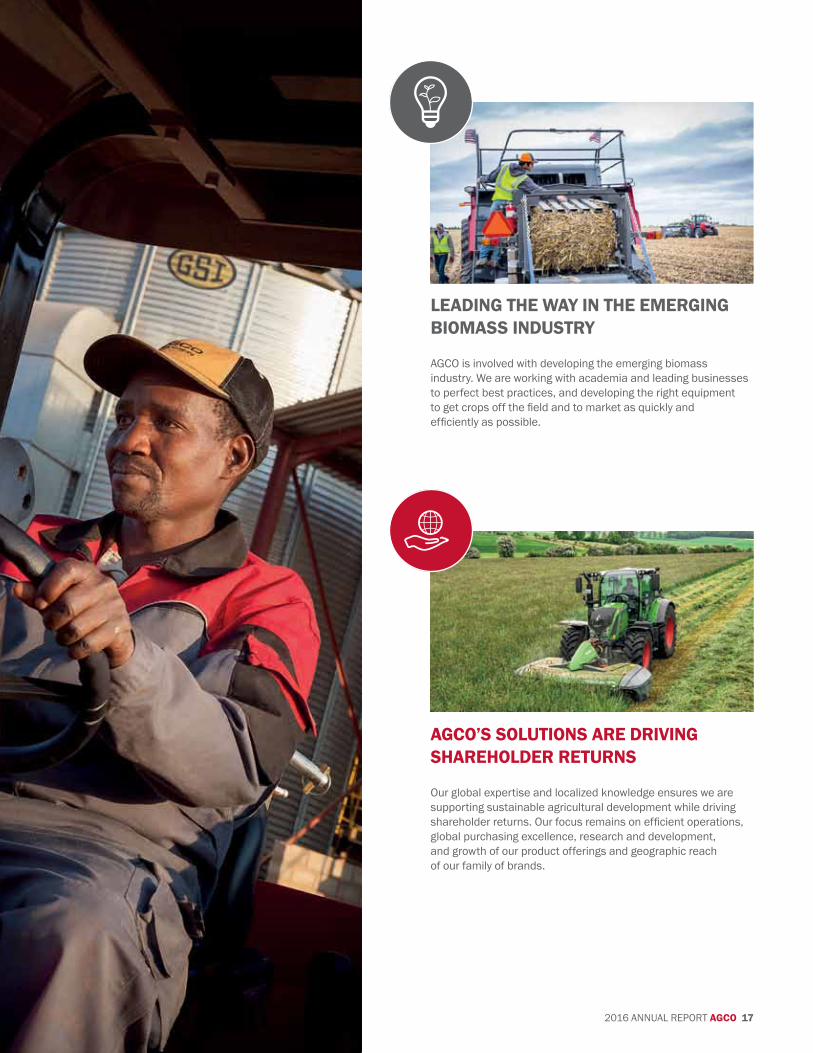
LEAdiNG THE WAy iN THE EMERGiNG biOMASS iNduSTRy
AGCo is involved with developing the emerging biomass industry. we are working with academia and leading businesses to perfect best practices, and developing the right equipment to get crops off the field and to market as quickly and efficiently as possible.
AGCO’S SOLuTiONS ARE dRiViNG SHAREHOLdER RETuRNS
our global expertise and localized knowledge ensures we are supporting sustainable agricultural development while driving shareholder returns. Our focus remains on efficient operations, global purchasing excellence, research and development, and growth of our product offerings and geographic reach of our family of brands.
2016 AnnuAl RepoRt AGCO 17

oFFiCeRS ANd diRECTORS
11 Martin H. Richenhagen Chairman, president and Chief Executive Officer9 Roger N. batkin vice president, General Counsel and Corporate Secretary20 Andrew H. beck Senior vice president, Chief Financial Officer15 Gary L. Collar Senior vice president, General Manager, Asia/Pacific and Africa
12 Robert b. Crain Senior vice president, General Manager, Americas7 ulrich Stockheim* Global head of Corporate Communications and Marketing2 Helmut R. Endres Senior vice president, engineering6 Eric P. Hansotia Senior vice president, Global Crop Cycle and Fuse Connected Services
14 Lucinda b. SmithSenior vice president,Global Business Services13 Rob SmithSenior vice president,General Manager, europe and Middle east21 Hans-bernd VeltmaatSenior vice president,Chief Supply Chain Officer17 Thomas F. WelkeSenior vice president,Global Grain and protein, GSi
BoARd oF diReCtoRS
11 Martin H. RichenhagenChairman, president and Chief Executive Officer AGCo16 Roy V. ArmesFormer executive Chairman, president and Ceo Cooper tire and Rubber Company19 Michael C. ArnoldFormer president and Ceo Ryerson inc.3 P. George bensonprofessor of decision Sciences and former president College of Charleston5 Wolfgang demlFormer president and Chief Executive Officer Baywa Corporation
SenioR MAnAGeMent
*Not an Officer or Director.
18 AGCO 2016 AnnuAl RepoRt

4 Luiz Fernando FurlanFormer Minister of development, industry and Foreign trade of Brazil18 George E. MinnichFormer Senior vice president and CFo itt Corporation10 Gerald L. ShaheenFormer Group presidentCaterpillar inc.8 Mallika SrinivasanChairman and Ceotractors and Farm equipment limited (tAFe)1 Hendrikus VisserFormer Chairman Royal huisman Shipyards n.v.
Executive CommitteeMartin H. Richenhagen, ChairmanP. george Bensonwolfgang Demlgeorge E. Minnichgerald l. shaheenHendrikus visser
Audit Committeegeorge E. Minnich, ChairmanMichael c. arnoldP. george BensonHendrikus visser
Compensation Committeegerald l. shaheen, ChairmanRoy v. armesluiz Fernando Furlangeorge E. Minnich
Finance CommitteeHendrikus visser, Chairmangeorge E. Minnichgerald l. shaheen
Governance CommitteeP. george Benson, ChairmanMichael c. arnoldwolfgang DemlMallika srinivasan (guest)Hendrikus visser
Succession Planning Committeewolfgang Deml, ChairmanRoy v. armesluiz Fernando FurlanMartin H. Richenhagengerald l. shaheenMallika srinivasan
AGCo 2016 BoARd CoMMitteeS
2016 AnnuAl RepoRt AGCO 19
2 3 4 1 12
5
8
11 9 16 13 17 7 19 20
21
181514106

years Ended december 31,(in millions, except per share amounts) 2016 2015 2014 2013 2012Operating data:net sales $ 7,410.5 $ 7,467.3 $ 9,723.7 $ 10,786.9 $ 9,962.2Gross profit 1,515.5 1,560.6 2,066.3 2,390.6 2,123.2income from operations 288.4 361.1 646.5 900.7 693.2net income 160.2 264.0 404.2 592.3 516.4net (income) loss attributable to noncontrolling interests (0.1) 2.4 6.2 4.9 5.7net income attributable to AGCo Corporation and subsidiaries $ 160.1 $ 266.4 $ 410.4 $ 597.2 $ 522.1net income per common share – diluted $ 1.96 $ 3.06 $ 4.36 $ 6.01 $ 5.30Cash dividends declared and paid per common share $ 0.52 $ 0.48 $ 0.44 $ 0.40 $ – weighted average shares outstanding – diluted 81.7 87.1 94.2 99.4 98.6
As of december 31(in millions, except number of employees) 2016 2015 2014 2013 2012balance Sheet data:Cash and cash equivalents $ 429.7 $ 426.7 $ 363.7 $ 1,047.2 $ 781.3total assets(1) 7,168.4 6,497.7 7,364.5 8,390.2 7,693.3total long-term debt, excluding current portion 1,610.0 925.2 993.3 932.9 1,028.7Stockholders’ equity 2,837.2 2,883.3 3,496.9 4,044.8 3,481.5Other data:number of employees 19,795 19,588 20,828 22,111 20,320
(1) total assets have been retroactively adjusted for december 31, 2015 and all prior year periods related to the adoption of the change in the presentation of debt issuance costs in the balance sheet as a direct deduction from the carrying amount of the related debt liability instead of a deferred charge (an asset). Refer to note 1 of our Consolidated Financial Statements for further information.
(2) the Company makes reference to adjusted earnings per share, as reconciled below:
2016 2015 2014 2013 2012net income per common share – diluted $ 1.96 $ 3.06 $ 4.36 $ 6.01 $ 5.30Restructuring expenses(3)(4) 0.12 0.18 0.34 – – tax adjustments(5)(6) 0.39 – – – (0.27)impairment charge(3)(7) – – – – 0.22net income per common share – adjusted $ 2.47 $ 3.24 $ 4.70 $ 6.01 $ 5.25
the following is a reconciliation to net cash provided by operating activities to free cash flow for the year ended december 31, 2016 (in millions):
the following is a reconciliation of reported net income to adjusted net income for the year ended december 31, 2016 (in millions):
20162016
Net income(3)
net cash provided by operating activities $ 369.5 As reported $ 160.1less: Restructuring expenses(3)(4) 9.9 Capital expenditures (201.0) deferred income tax adjustment(5) 31.6
Free cash flow $ 168.5 As adjusted $ 201.6
(3) After tax.(4) the restructuring expenses recorded during 2016, 2015 and 2014 related
primarily to severance and other costs associated with the rationalization of the Company’s operations in the united States, South America, europe and China.
(5) during the second quarter of 2016, the Company recorded a non-cash adjustment to increase the valuation allowance against its u.S. net deferred income tax assets.
(6) during the fourth quarter of 2012, the Company recorded a non-cash tax gain associated with the recognition of certain u.S. deferred tax assets from the reversal of its u.S. deferred tax valuation allowance and the recognition of certain u.S. research and development tax credits.
(7) during the fourth quarter of 2012, the Company recorded an impairment charge of approximately $22.4 million with respect to goodwill and certain other identifiable intangible assets associated with the Company’s Chinese harvesting business.
the above notes are more fully described in the Company’s audited Consolidated Financial Statements and notes to its Consolidated Financial Statements, which are included in the Company’s Annual Report on Form 10-k.
20 AGCO 2016 AnnuAl RepoRt
sElEctED Financial Data

years Ended december 31, 2016 2015 2014net sales $ 7,410.5 $ 7,467.3 $ 9,723.7Cost of goods sold 5,895.0 5,906.7 7,657.4
Gross profit 1,515.5 1,560.6 2,066.3Selling, general and administrative expenses 867.9 852.3 995.4engineering expenses 296.1 282.2 337.0Restructuring expenses 11.9 22.3 46.4Amortization of intangibles 51.2 42.7 41.0
income from operations 288.4 361.1 646.5interest expense, net 52.1 45.4 58.4other expense, net 31.4 36.3 49.1income before income taxes and equity in net earnings of affiliates 204.9 279.4 539.0income tax provision 92.2 72.5 187.7income before equity in net earnings of affiliates 112.7 206.9 351.3equity in net earnings of affiliates 47.5 57.1 52.9net income 160.2 264.0 404.2net (income) loss attributable to noncontrolling interests (0.1) 2.4 6.2net income attributable to AGCo Corporation and subsidiaries $ 160.1 $ 266.4 $ 410.4net income per common share attributable to AGCo Corporation and subsidiaries:
Basic $ 1.97 $ 3.06 $ 4.39diluted $ 1.96 $ 3.06 $ 4.36
Cash dividends declared and paid per common share $ 0.52 $ 0.48 $ 0.44weighted average number of common and common equivalent shares outstanding:
Basic 81.4 87.0 93.4diluted 81.7 87.1 94.2
the Consolidated Statements of operations should be read in conjunction with the Company’s Management’s discussion and Analysis of Financial Condition and Results of operations and the Company’s audited Consolidated Financial Statements and the accompanying notes to Consolidated Financial Statements, which are included in the Company’s Annual Report on Form 10-k.
2016 AnnuAl RepoRt AGCO 21
consoliDatED statEMEnts oF oPERations(in millions, except per share data)

december 31, 2016 2015ASSETSCurrent Assets:
Cash and cash equivalents $ 429.7 $ 426.7Accounts and notes receivable, net 890.4 836.8 inventories, net 1,514.8 1,423.4 other current assets 330.8 211.4
total current assets 3,165.7 2,898.3property, plant and equipment, net 1,361.3 1,347.1investment in affiliates 414.9 392.9deferred tax assets 99.7 100.7other assets 143.1 136.5intangible assets, net 607.3 507.7Goodwill 1,376.4 1,114.5total assets $ 7,168.4 $ 6,497.7 LiAbiLiTiES ANd STOCKHOLdERS’ EQuiTyCurrent liabilities:
Current portion of long-term debt $ 85.4 $ 89.0Senior term loan – 217.2Accounts payable 722.6 625.6Accrued expenses 1,160.8 1,106.9other current liabilities 176.1 146.7
total current liabilities 2,144.9 2,185.4long-term debt, less current portion and debt issuance costs 1,610.0 925.2pensions and postretirement health care benefits 270.0 233.9deferred tax liabilities 112.4 86.4other noncurrent liabilities 193.9 183.5
total liabilities 4,331.2 3,614.4
Commitments and contingencies STOCKHOLdERS’ EQuiTy:AGCo Corporation stockholders’ equity:
preferred stock; $0.01 par value, 1,000,000 shares authorized, no shares issued or outstanding in 2016 and 2015 – –Common stock; $0.01 par value, 150,000,000 shares authorized, 79,465,393 and 83,814,809 shares issued and outstanding at december 31, 2016 and 2015, respectively 0.8 0.8Additional paid-in capital 103.3 301.7Retained earnings 4,113.6 3,996.0Accumulated other comprehensive loss (1,441.6) (1,460.2)
total AGCo Corporation stockholders’ equity 2,776.1 2,838.3noncontrolling interests 61.1 45.0
total stockholders’ equity 2,837.2 2,883.3
total liabilities and stockholders’ equity $ 7,168.4 $ 6,497.7
the Consolidated Balance Sheets should be read in conjunction with the Company’s Management’s discussion and Analysis of Financial Condition and Results of operations and the Company’s audited Consolidated Financial Statements and the accompanying notes to Consolidated Financial Statements, which are included in the Company’s Annual Report on Form 10-k.
22 AGCO 2016 AnnuAl RepoRt
consoliDatED BalancE sHEEts(in millions, except share amounts)
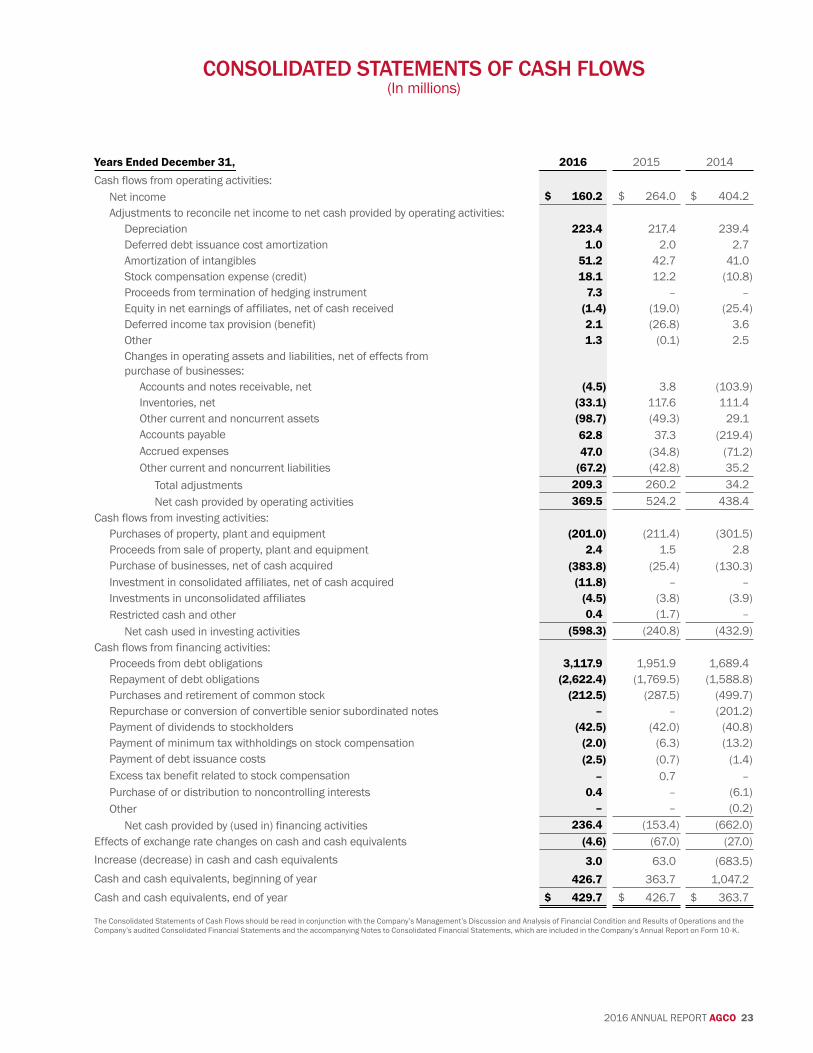
years Ended december 31, 2016 2015 2014Cash flows from operating activities:
net income $ 160.2 $ 264.0 $ 404.2Adjustments to reconcile net income to net cash provided by operating activities:
depreciation 223.4 217.4 239.4deferred debt issuance cost amortization 1.0 2.0 2.7Amortization of intangibles 51.2 42.7 41.0Stock compensation expense (credit) 18.1 12.2 (10.8)proceeds from termination of hedging instrument 7.3 – –equity in net earnings of affiliates, net of cash received (1.4) (19.0) (25.4)deferred income tax provision (benefit) 2.1 (26.8) 3.6other 1.3 (0.1) 2.5Changes in operating assets and liabilities, net of effects from purchase of businesses:
Accounts and notes receivable, net (4.5) 3.8 (103.9)inventories, net (33.1) 117.6 111.4other current and noncurrent assets (98.7) (49.3) 29.1Accounts payable 62.8 37.3 (219.4)Accrued expenses 47.0 (34.8) (71.2)other current and noncurrent liabilities (67.2) (42.8) 35.2
total adjustments 209.3 260.2 34.2net cash provided by operating activities 369.5 524.2 438.4
Cash flows from investing activities:purchases of property, plant and equipment (201.0) (211.4) (301.5)proceeds from sale of property, plant and equipment 2.4 1.5 2.8purchase of businesses, net of cash acquired (383.8) (25.4) (130.3)investment in consolidated affiliates, net of cash acquired (11.8) – –investments in unconsolidated affiliates (4.5) (3.8) (3.9)Restricted cash and other 0.4 (1.7) –
net cash used in investing activities (598.3) (240.8) (432.9)Cash flows from financing activities:
proceeds from debt obligations 3,117.9 1,951.9 1,689.4Repayment of debt obligations (2,622.4) (1,769.5) (1,588.8)purchases and retirement of common stock (212.5) (287.5) (499.7)Repurchase or conversion of convertible senior subordinated notes – – (201.2)payment of dividends to stockholders (42.5) (42.0) (40.8)payment of minimum tax withholdings on stock compensation (2.0) (6.3) (13.2)payment of debt issuance costs (2.5) (0.7) (1.4)excess tax benefit related to stock compensation – 0.7 –purchase of or distribution to noncontrolling interests 0.4 – (6.1)other – – (0.2)
net cash provided by (used in) financing activities 236.4 (153.4) (662.0)effects of exchange rate changes on cash and cash equivalents (4.6) (67.0) (27.0)increase (decrease) in cash and cash equivalents 3.0 63.0 (683.5)Cash and cash equivalents, beginning of year 426.7 363.7 1,047.2Cash and cash equivalents, end of year $ 429.7 $ 426.7 $ 363.7
the Consolidated Statements of Cash Flows should be read in conjunction with the Company’s Management’s discussion and Analysis of Financial Condition and Results of operations and the Company’s audited Consolidated Financial Statements and the accompanying notes to Consolidated Financial Statements, which are included in the Company’s Annual Report on Form 10-k.
2016 AnnuAl RepoRt AGCO 23
consoliDatED statEMEnts oF casH Flows(in millions)
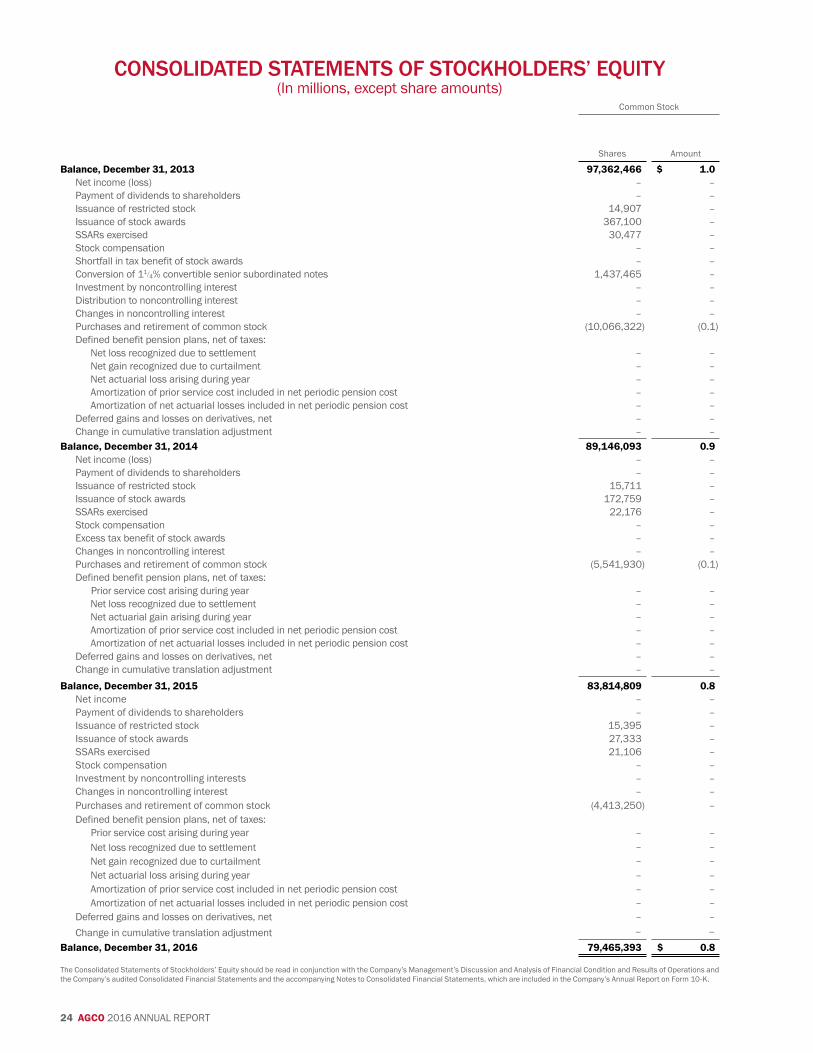
Common Stock Accumulated other Comprehensive loss
Shares Amount
Additional paid-in Capital
Retained earnings
defined Benefit pension
plans
Cumulative translation Adjustment
deferred (losses) Gains on
derivatives
Accumulated other
Comprehensive loss
noncontrolling interests
total Stockholders’
equitytemporary
equity
balance, december 31, 2013 97,362,466 $ 1.0 $ 1,117.9 $ 3,402.0 $ (206.4) $ (304.1) $ (0.2) $ (510.7) $ 34.6 $ 4,044.8 $ – net income (loss) – – – 410.4 – – – – 0.1 410.5 (6.3)payment of dividends to shareholders – – – (40.8) – – – – – (40.8)issuance of restricted stock 14,907 – 0.9 – – – – – – 0.9issuance of stock awards 367,100 – (11.8) – – – – – – (11.8)SSARs exercised 30,477 – (1.2) – – – – – – (1.2)Stock compensation – – (11.7) – – – – – – (11.7)Shortfall in tax benefit of stock awards – – (0.2) – – – – – – (0.2)Conversion of 11/4% convertible senior subordinated notes 1,437,465 – – – – – – – – – investment by noncontrolling interest – – – – – – – – 16.1 16.1distribution to noncontrolling interest – – – – – – – – (2.4) (2.4)Changes in noncontrolling interest – – (11.8) – – – – – – (11.8) 6.6purchases and retirement of common stock (10,066,322) (0.1) (499.6) – – – – – – (499.7)defined benefit pension plans, net of taxes:
net loss recognized due to settlement – – – – 0.4 – – 0.4 – 0.4net gain recognized due to curtailment – – – – (0.4) – – (0.4) – (0.4)net actuarial loss arising during year – – – – (54.8) – – (54.8) – (54.8)Amortization of prior service cost included in net periodic pension cost – – – – 0.6 – – 0.6 – 0.6Amortization of net actuarial losses included in net periodic pension cost – – – – 7.3 – – 7.3 – 7.3
deferred gains and losses on derivatives, net – – – – – – 0.1 0.1 – 0.1Change in cumulative translation adjustment – – – – – (349.0) – (349.0) – (349.0) (0.3)
balance, december 31, 2014 89,146,093 0.9 582.5 3,771.6 (253.3) (653.1) (0.1) (906.5) 48.4 3,496.9 – net income (loss) – – – 266.4 – – – – (2.4) 264.0payment of dividends to shareholders – – – (42.0) – – – – – (42.0)issuance of restricted stock 15,711 – 0.8 – – – – – – 0.8issuance of stock awards 172,759 – (5.6) – – – – – – (5.6)SSARs exercised 22,176 – (0.7) – – – – – – (0.7)Stock compensation – – 11.4 – – – – – – 11.4excess tax benefit of stock awards – – 0.7 – – – – – – 0.7Changes in noncontrolling interest – – – – – – – – 1.1 1.1purchases and retirement of common stock (5,541,930) (0.1) (287.4) – – – – – – (287.5)defined benefit pension plans, net of taxes: prior service cost arising during year – – – – (4.7) – – (4.7) – (4.7)
net loss recognized due to settlement – – – – 0.2 – – 0.2 – 0.2net actuarial gain arising during year – – – – 2.1 – – 2.1 – 2.1Amortization of prior service cost included in net periodic pension cost – – – – 0.4 – – 0.4 – 0.4Amortization of net actuarial losses included in net periodic pension cost – – – – 6.3 – – 6.3 – 6.3
deferred gains and losses on derivatives, net – – – – – – (1.9) (1.9) – (1.9)Change in cumulative translation adjustment – – – – – (556.1) – (556.1) (2.1) (558.2)
balance, december 31, 2015 83,814,809 0.8 301.7 3,996.0 (249.0) (1,209.2) (2.0) (1,460.2) 45.0 2,883.3 – net income – – – 160.1 – – – – 0.1 160.2payment of dividends to shareholders – – – (42.5) – – – – – (42.5)issuance of restricted stock 15,395 – 0.8 – – – – – – 0.8issuance of stock awards 27,333 – (0.9) – – – – – – (0.9)SSARs exercised 21,106 – (0.9) – – – – – – (0.9)Stock compensation – – 17.3 – – – – – – 17.3investment by noncontrolling interests – – – – – – – – 12.2 12.2Changes in noncontrolling interest – – (2.2) – – – – – 2.2 –purchases and retirement of common stock (4,413,250) – (212.5) – – – – – – (212.5)defined benefit pension plans, net of taxes: prior service cost arising during year – – – – (2.6) – – (2.6) – (2.6)
net loss recognized due to settlement – – – – 0.4 – – 0.4 – 0.4net gain recognized due to curtailment – – – – (0.1) – – (0.1) – (0.1)net actuarial loss arising during year – – – – (62.9) – – (62.9) – (62.9)Amortization of prior service cost included in net periodic pension cost – – – – 1.1 – – 1.1 – 1.1Amortization of net actuarial losses included in net periodic pension cost – – – – 8.6 – – 8.6 – 8.6
deferred gains and losses on derivatives, net – – – – – – (6.7) (6.7) – (6.7)Change in cumulative translation adjustment – – – – – 80.8 – 80.8 1.6 82.4
balance, december 31, 2016 79,465,393 $ 0.8 $ 103.3 $ 4,113.6 $ (304.5) $ (1,128.4) $ (8.7) $ (1,441.6) $ 61.1 $ 2,837.2 $ –
the Consolidated Statements of Stockholders’ equity should be read in conjunction with the Company’s Management’s discussion and Analysis of Financial Condition and Results of operations and the Company’s audited Consolidated Financial Statements and the accompanying notes to Consolidated Financial Statements, which are included in the Company’s Annual Report on Form 10-k.
24 AGCO 2016 AnnuAl RepoRt
consoliDatED statEMEnts oF stockHolDERs’ Equity(in millions, except share amounts)

Common Stock Accumulated other Comprehensive loss
Shares Amount
Additional paid-in Capital
Retained earnings
defined Benefit pension
plans
Cumulative translation Adjustment
deferred (losses) Gains on
derivatives
Accumulated other
Comprehensive loss
noncontrolling interests
total Stockholders’
equitytemporary
equity
balance, december 31, 2013 97,362,466 $ 1.0 $ 1,117.9 $ 3,402.0 $ (206.4) $ (304.1) $ (0.2) $ (510.7) $ 34.6 $ 4,044.8 $ – net income (loss) – – – 410.4 – – – – 0.1 410.5 (6.3)payment of dividends to shareholders – – – (40.8) – – – – – (40.8)issuance of restricted stock 14,907 – 0.9 – – – – – – 0.9issuance of stock awards 367,100 – (11.8) – – – – – – (11.8)SSARs exercised 30,477 – (1.2) – – – – – – (1.2)Stock compensation – – (11.7) – – – – – – (11.7)Shortfall in tax benefit of stock awards – – (0.2) – – – – – – (0.2)Conversion of 11/4% convertible senior subordinated notes 1,437,465 – – – – – – – – – investment by noncontrolling interest – – – – – – – – 16.1 16.1distribution to noncontrolling interest – – – – – – – – (2.4) (2.4)Changes in noncontrolling interest – – (11.8) – – – – – – (11.8) 6.6purchases and retirement of common stock (10,066,322) (0.1) (499.6) – – – – – – (499.7)defined benefit pension plans, net of taxes:
net loss recognized due to settlement – – – – 0.4 – – 0.4 – 0.4net gain recognized due to curtailment – – – – (0.4) – – (0.4) – (0.4)net actuarial loss arising during year – – – – (54.8) – – (54.8) – (54.8)Amortization of prior service cost included in net periodic pension cost – – – – 0.6 – – 0.6 – 0.6Amortization of net actuarial losses included in net periodic pension cost – – – – 7.3 – – 7.3 – 7.3
deferred gains and losses on derivatives, net – – – – – – 0.1 0.1 – 0.1Change in cumulative translation adjustment – – – – – (349.0) – (349.0) – (349.0) (0.3)
balance, december 31, 2014 89,146,093 0.9 582.5 3,771.6 (253.3) (653.1) (0.1) (906.5) 48.4 3,496.9 – net income (loss) – – – 266.4 – – – – (2.4) 264.0payment of dividends to shareholders – – – (42.0) – – – – – (42.0)issuance of restricted stock 15,711 – 0.8 – – – – – – 0.8issuance of stock awards 172,759 – (5.6) – – – – – – (5.6)SSARs exercised 22,176 – (0.7) – – – – – – (0.7)Stock compensation – – 11.4 – – – – – – 11.4excess tax benefit of stock awards – – 0.7 – – – – – – 0.7Changes in noncontrolling interest – – – – – – – – 1.1 1.1purchases and retirement of common stock (5,541,930) (0.1) (287.4) – – – – – – (287.5)defined benefit pension plans, net of taxes: prior service cost arising during year – – – – (4.7) – – (4.7) – (4.7)
net loss recognized due to settlement – – – – 0.2 – – 0.2 – 0.2net actuarial gain arising during year – – – – 2.1 – – 2.1 – 2.1Amortization of prior service cost included in net periodic pension cost – – – – 0.4 – – 0.4 – 0.4Amortization of net actuarial losses included in net periodic pension cost – – – – 6.3 – – 6.3 – 6.3
deferred gains and losses on derivatives, net – – – – – – (1.9) (1.9) – (1.9)Change in cumulative translation adjustment – – – – – (556.1) – (556.1) (2.1) (558.2)
balance, december 31, 2015 83,814,809 0.8 301.7 3,996.0 (249.0) (1,209.2) (2.0) (1,460.2) 45.0 2,883.3 – net income – – – 160.1 – – – – 0.1 160.2payment of dividends to shareholders – – – (42.5) – – – – – (42.5)issuance of restricted stock 15,395 – 0.8 – – – – – – 0.8issuance of stock awards 27,333 – (0.9) – – – – – – (0.9)SSARs exercised 21,106 – (0.9) – – – – – – (0.9)Stock compensation – – 17.3 – – – – – – 17.3investment by noncontrolling interests – – – – – – – – 12.2 12.2Changes in noncontrolling interest – – (2.2) – – – – – 2.2 –purchases and retirement of common stock (4,413,250) – (212.5) – – – – – – (212.5)defined benefit pension plans, net of taxes: prior service cost arising during year – – – – (2.6) – – (2.6) – (2.6)
net loss recognized due to settlement – – – – 0.4 – – 0.4 – 0.4net gain recognized due to curtailment – – – – (0.1) – – (0.1) – (0.1)net actuarial loss arising during year – – – – (62.9) – – (62.9) – (62.9)Amortization of prior service cost included in net periodic pension cost – – – – 1.1 – – 1.1 – 1.1Amortization of net actuarial losses included in net periodic pension cost – – – – 8.6 – – 8.6 – 8.6
deferred gains and losses on derivatives, net – – – – – – (6.7) (6.7) – (6.7)Change in cumulative translation adjustment – – – – – 80.8 – 80.8 1.6 82.4
balance, december 31, 2016 79,465,393 $ 0.8 $ 103.3 $ 4,113.6 $ (304.5) $ (1,128.4) $ (8.7) $ (1,441.6) $ 61.1 $ 2,837.2 $ –
the Consolidated Statements of Stockholders’ equity should be read in conjunction with the Company’s Management’s discussion and Analysis of Financial Condition and Results of operations and the Company’s audited Consolidated Financial Statements and the accompanying notes to Consolidated Financial Statements, which are included in the Company’s Annual Report on Form 10-k.
2016 AnnuAl RepoRt AGCO 25

FoRwaRD-looking statEMEnts
this annual report includes forward-looking statements, including the statements in the Chairman’s Message and other statements in this report regarding market demand, strategic initiatives, commitments and their effects, and general economic conditions. these statements are subject to risks that could cause actual results to differ materially from those suggested by the statements, including:
Our financial results depend entirely upon the agricultural industry, and factors that adversely affect the agricultural industry generally, including declines in the general economy, increases in farm input costs, lower commodity prices and changes in the availability of credit for our retail customers, will adversely affect us. the poor performance of the general economy has adversely impacted our sales and may continue to have an adverse impact on our sales in the future, the extent of which we are unable to predict, and there can be no assurance that our results will not continue to be affected by the weakness in global economic conditions. our success depends on the introduction of new products, which requires substantial expenditures and may not be well received in the marketplace.
We face significant competition, and if we are unable to compete successfully against other agricultural equipment manufacturers, we would lose customers and our revenues and profitability would decline.
Most of our sales depend on the retail customers obtaining financing, and any disruption in their ability to obtain financing, whether due to economic downturns or otherwise, will result
in the sale of fewer products by us. A large portion of the retail sales of our products is financed by our retail finance joint ventures with Rabobank, and any difficulty on Rabobank’s part to fund the venture would adversely impact sales if our customers would be required to utilize other retail financing providers. we depend on suppliers for raw materials, components, and parts for our products, and any failure by our suppliers to provide products as needed, or by us to promptly address supplier issues, will adversely impact our ability to timely and efficiently manufacture and sell products.
A majority of our sales and manufacturing takes place outside the united States, and, as a result, we are exposed to risks related to foreign laws, taxes, economic conditions, labor supply and relations, political conditions, and governmental policies. these risks may delay or reduce our realization of value from our international operations.
volatility with respect to currency exchange rates and interest rates can adversely affect our reported results of operations and the competitiveness of our products. we are subject to extensive environmental laws and regulations, and our compliance with, or our failure to comply with, existing or future laws and regulations could delay production of our products or otherwise adversely affect our business.
We are subject to raw material price fluctuations, which can adversely affect our manufacturing costs.
we disclaim any obligation to update forward-looking statements except as required by law.
26 AGCO 2016 AnnuAl RepoRt

sHaREHolDER inFoRMation
corporate Headquarters4205 River Green parkwayduluth, Georgia 30096 u.S.+1-770-813-9200
transfer agent & RegistrarComputershare trust Company, n.A. 211 Quality Circle, Suite 210College Station, texas 77845 u.S.+1-800-962-4284
stock ExchangeAGCo Corporation common stock (trading symbol is “AGCo”) is traded on the new york Stock exchange.
independent Registered Public accounting FirmkpMG llpAtlanta, Georgia u.S.
Form 10-kThe Form 10-K Annual Report filed with the Securities and exchange Commission is available in the “investors” Section of our corporate website (www.AGCocorp.com), under the heading “SeC Filings,” or upon request from the investor Relations department at our corporate headquarters.
annual Meetingthe annual meeting of the Company’s stockholders will be held at 9:00 a.m. et on April 27, 2017 at the offices of AGCo Corporation, 4205 River Green parkway, duluth, Georgia 30096 u.S.
Performance graphthe graph shown above is a line graph presentation of the Company’s cumulative stockholder returns on an indexed basis as compared to the S&p Mid-Cap 400 index and a self-constructed peer group of the companies listed in footnote 1 to the performance graph (“peer Group”). Returns for the Company in the graph are not necessarily indicative of future performance.
Assumes $100 invested on january 1, 2011. Assumes dividends reinvested. year ending december 31, 2016.(1) Based on information for a self-constructed peer group of companies that includes: Caterpillar inc., Cnh industrial nv,
Cummins inc., deere & Company, eaton Corporation plc., ingersoll-Rand plc., navistar international Corporation, PACCAR Inc., Parker-Hannifin Corporation, and Terex Corporation.
AGCO Corporation
Custom Peer Group
S&P Midcap 400 Index
Comparison of Cumulative Total Return
US$
250
200
150
100
50
02011 2012 2013 2014 2015 2016
Paper made fromresponsible sources
C002256
Follow us on twitter @AGCocorp
2016 AnnuAl RepoRt AGCO 27

GloBAl RECOGNiTiON
in 2016, AGCo’S innovAtive leAdeRShip wAS ReCoGniZed inteRnAtionAlly
with GloBAl induStRy AwARdS
Red dot deSiGn AwARd 2016, eAMe*
the Fendt 1000 vario and the valtra t234 were both recognized in the Red dot Award category “product design.” it is one of the largest and most respected design competitions in the world, attracting more than 5,200 products from 57 countries last year.
iF deSiGn AwARd 2016, eAMethe Fendt 1000 vario tractor’s contemporary design was recognized with the iF design Award Gold. the competition, organized by iF international Forum design Gmbh, is one of the world’s most celebrated and valued design competitions that welcomes over 5,000 submissions from 70 countries every year.
Good deSiGn AwARd, eAMethe valtra t Series won the Good deSiGn™ Award for new consumer products globally for design, functionality and innovativeness by the Chicago Athenaeum Museum of Architecture and design in cooperation with the european Centre for design and Architecture.
MAnuFACtuRinG leAdeRShip AwARdS, nA**
AGCo was presented with the 2016 “internet of things in Manufacturing leadership” award by Frost & Sullivan’s Manufacturing leadership Council. the Manufacturing leadership Awards honor organizations and individuals that are shaping the future of global manufacturing.
FACtoRy oF the yeAR, eAMethe Beauvais, France tractor manufacturing facility won the Factory of the year 2016 award from L’Usine Nouvelle, the leading industrial magazine in France, over a wide range of other industries from within France.
eXpoRt GRAnd pRiX AwARdS, eAMethe Beauvais, France tractor manufacturing facility won the Foreign exporter Award (le prix de l’exportateur etranger) at the export Grand prix Awards given by BFM Business, France’s economics tv and Radio news channel. the award recognizes the plant’s major contribution to the country’s economy.
SeCuRe Supply ChAin CeRtiFiCAte, eAMeAGCo was awarded the newly introduced “Secure Supply Chain” benchmark certificate by the Association for Supply Chain Management, procurement and logistics (BMe), europe’s leading supply chain association.
28 AGCO 2016 AnnuAl RepoRt
* eAMe = europe/Africa/Middle east **nA = north America

© 2017 AGCO CorporationAll rights reserved. incorporated in Delaware. An Equal Opportunity Employer. AGCO®, Fendt®, GSi®, massey Ferguson®, valtra® and their respective logos as well as corporate and product identity used herein are trademarks of AGCO or its subsidiaries and may not be used without permission. Challenger® is a registered trademark of Caterpillar, inc. and may not be used without permission.

For a truly interactive experience either online or on your mobile device, please view our annual report at: ar2016.AGCOcorp.com
4205 River Green Parkway Duluth, Georgia 30096 U.S. +1-770-813-9200
www.AGCOcorp.com