Embed Size (px)
Citation preview

Paper ID #14900
After Lab Ends: How Students Analyze and Interpret Experimental Data
Dr. Bridget M. Smyser, Northeastern University
Dr. Smyser is an Associate Academic Specialist and the Lab Director of the Mechanical and IndustrialEngineering.
Miss Sahar Tariq, Northeastern University
Mechanical Engineer from Bangladesh
c©American Society for Engineering Education, 2016

After Lab Ends: How students analyze and interpret
experimental data
High-level skills in analysis, scientific argument, and data presentation are desired outcomes of
engineering laboratory classes. Students are asked to present data in a way that supports their
conclusions and provides estimates of the accuracy of their answers. Although students are
specifically asked to perform certain analysis tasks, and can explain what these tasks should be,
they often fail to correctly interpret or make inferences from their data. The goal of this study is
to examine the processes that students use to interpret and analyze experimental data, from the
time they finish their lab experiments until they turn in their lab reports. A survey was
administered to students who had completed a laboratory course in Measurements and Analysis
in which they were asked to describe the steps they took to analyze and present experimental
data. They were also asked to identify how often they took certain desired actions, such as
estimating uncertainties, comparing data to the literature, performing statistical analysis, and
other commonly accepted best practices for data analysis. In addition, past student lab reports
and experimental design projects were examined for evidence of these best practices.
Results show a distinct disconnect between the actions students are asked to take, the actions
students described in their narratives, and the behaviors exhibited in student work. Students
tended to overestimate how often they examined data for consistency, anticipated results from
theory, and justified corrections or adjustments to the data, although they recognized the value of
these actions. Certain behaviors were strongly correlated with high grades. For example, students
who described their calculation methods in detail showed a positive correlation of greater than
0.75 between this behavior and their lab report grades. In addition, there was a strong positive
correlation between the total number of best practices demonstrated in student work and high
grades, with correlation values greater than 0.74 in all cases. These results suggest that students,
on their own, will tend to underutilize high-level behaviors. To further internalize these
behaviors, students need to be asked explicitly to use the accepted best practices, even with
junior and senior level students. There is also evidence that students treat lab reports as extended
homework assignments with a single correct answer, which prevents them from exhibiting high-
level data analysis skills. Based on the results of this work, interventions are being developed to
give students practice with explaining data processing, and additional exposure to open-ended
problems.
Introduction
Laboratory experiments have long been an essential part of the engineering experience1. ABET
student outcome (b) specifically requires students to develop “an ability to design and conduct
experiments, as well as to analyze and interpret data”. Other outcomes emphasize teamwork,
communication, and skill building, all of which can be effectively taught in a lab environment.2
The benefits of lab work include learning hands on practical skills, observation and deduction
skills, and how to connect theoretical knowledge to empirical work. Established best practices
include pre-lab activities, hands-on laboratory time, and post-lab activities including data
analysis and report writing.3

Lab report writing is particularly valuable for building a wide range of skills at different levels of
abstraction. 4 Low level skills include chronological discussion of work performed, definition of
key terms, and listing of equipment used and similar tasks. Medium level skills such as
classification, comparison and contrast, and the ability to summarize information require the
students to examine data more closely. These skills require practice to develop, which is another
benefit of laboratory work. However, high level skills are the most desirable for professional and
graduate work. High level skills in scientific and academic argument and analysis require
students to make inferences from their data, relate their data to previously published results, and
use their data in order to justify their conclusions.5 Since lab reports typically require tasks such
as statistical data analysis, graphical presentation of results, and uncertainty analysis, they
become an excellent medium to assess the development of these high level skills.
A variety of methods have been employed to teach writing skills and related data analysis skills.
The Science Writing Heuristic6 is a method of guided inquiry that leads students to reflect on
what they are learning and ask a series of standard questions about their data and observations.
This has been shown to improve lab report writing in some cases, and can boost higher level
thinking. Report writing has also been improved by using peer review and revision to target poor
grammar and spelling as well as technical issues.7 Electronic lab notebooks have been used to
improve the ability of students to analyze their data and keep track of design decisions, which
could be particularly helpful for experimental design activities.8 Lab reports have been written in
groups, or even during lab, in order to improve both the mechanics of report writing and the
quality of the results through peer interaction and modeling from the instructor.9 The majority of
these methods concentrate heavily on the writing aspect of lab reports, but tend to spend less
time on data analysis.
In addition to these methods, standard textbooks on measurement and analysis techniques
typically contain chapters on report writing and/or data analysis. A survey of several of the most
common textbooks revealed common themes.10,11,12,13,14,15 All of the textbooks surveyed gave
extensive information on statistical data analysis and measurement uncertainty, and all of them
discussed graphical data presentations. Not all of the books discuss report writing; however those
that do discuss the standard sections of a report (abstracts, introduction, etc.) tend to agree on the
need for background research and the comparison of results to theory. The books that do not
discuss report writing tend to focus on the details of data presentation such as explaining data
processing and calculation methods and examining data for consistency during the process of
gathering data. It is very difficult to find textbooks that treat both technical report writing and
data presentation in the same amount of detail.
Different types of labs can be used to promote different levels of skills in conjunction with the
data analysis and report writing schemes. Expository or ‘cookbook’ style labs have step by step
procedures that are provided, often with blank tables provided for data recording, and generally
have a predetermined outcome. These types of labs do not generally require high level skills to
accomplish. Open inquiry labs require students to create their own procedure, have less direction,
and tend to have undetermined outcomes. Inquiry labs require higher level analysis, evaluation,
and judging skills, but can be difficult to administer and grade. Guided inquiry, or discovery,
labs provide students with a procedure and have a predetermined outcome, but require students
to discover principles with little instructor guidance. This can require students to use high level
skills, but can also lead to failure if students do not have the background to discover what they

‘should’ discover. Problem-based labs have predetermined outcomes but allow students to
develop their own path toward the solution. The problems are often simple, but students have the
opportunity to develop higher order skills in evaluation in the process.16 Although each type of
lab has benefits and drawbacks, it seems clear that if higher ordered skills are desired then the
preference should be for open-ended labs.
The goal of all these writing schemes and laboratory instruction styles is to get students to
acquire valid data, analyze it properly, use it to support their conclusions, and report those
conclusions clearly. The survey of the literature resulted in the following list of behaviors that
students need to exhibit in order to accomplish these goals:
Examine data for consistency
Perform statistical analysis of data where appropriate
Estimate uncertainties in results
Anticipate results from theory
Compare data to previous work or literature
Explain routine data processing
Justify any adjustments or corrections to procedures
Present data in tabular or graphical form
Describe calculation methods
Although students are asked to exhibit these behaviors either implicitly or explicitly, students
may or may not truly internalize what they need to do. In particular, tasks relating to interpreting
or making inferences from data can be neglected in favor of more straightforward tasks such as
computation or graphing data. The goal of this study is to identify what students think are the
necessary steps to take after lab ends in order to properly make use of their experimental data,
and to look at the disconnect between what students think they do, what the instructor asks them
to do, and what is actually evident in their work.
Methodology
The course in this study is a junior level lab course titled Measurement and Analysis with
Thermal Science Application. This is a required course for mechanical engineering students. In
addition to three 65 minute lectures a week there is one two-hour lab section. Students work in
instructor selected lab groups to perform seven experiments over the course of the term. These
labs are designed to be progressively more open-ended in nature. As part of their pre-lab
homework assignments students are required to develop data tables, write procedures, choose
sensors, and demonstrate sample calculations. In previous terms all seven lab reports were
written by individual students. Recently due to increasing student numbers, policies were
changed so that the first three lab reports are still individually written, but the last four lab reports
are group reports. Each lab group also does a term long group project in which they design,
execute, and report on an experiment of their choosing, using borrowed lab equipment and
working during open lab times.
The current labs and the project were developed prior to the current study. The requirements
given for each lab and the project were analyzed to determine whether or not the existing
assignments explicitly asked for the desired behaviors determined from the literature review. The

results, listed below in Table 1, show that all of the desired behaviors were requested explicitly
in a minimum of two assignments, with six of the nine behaviors expected in all labs and the
project.
Table 1: Expected behaviors mapped to assignments in Measurements and Analysis
Expected Behavior Relative Assignments
Examine data for consistency Labs 1-7, Project
Statistical analysis of data Lab 2, Project
Estimate uncertainties in results Labs 1-7, Project
Anticipate results from theory Labs 1-3, 5, 7, Project
Compare data to previous work or literature Labs 2, 4-7, Project
Explain routine data process Labs 1-7, Project
Justify any necessary adjustments or corrections Labs 1-7, Project
Present tables or graphs of data Labs 1-7, Project
Describe calculation methods Labs 1-7, Project
It is important to note that the exact wording of the lab handouts is not as listed above, although
the desired results are the same. Examples of two of the labs are found in Appendix B.
In order to determine student attitudes toward data analysis and processing, a survey was
developed and administered anonymously to students who had previously taken the course. A
total of 21 students responded to the survey. The survey questions are given in Appendix A.
Three open ended questions asked students to describe the steps they took to analyze their data,
explain how they understood the idea of justifying their conclusions with data, and how they
dealt with anomalous data. In addition, the respondents were asked how often they engaged in
the desired behaviors while writing lab reports. Students were also asked how long they spent
writing up lab reports, and how soon they started lab reports after lab ended. The results of this
survey were analyzed to determine whether the open-ended responses described any of the
desired behaviors, and whether those results matched the later question on how often they
engaged in desired behaviors.
In addition to the survey, past lab reports were subjected to close reading to look for evidence of
the desired behaviors. Lab reports had been originally graded by teaching assistants with controls
and rubrics in place to ensure equitable grading between the different graders. Individually
written lab reports were considered separately from group lab reports. Identifiers such as student
names were stripped from the reports before they were analyzed by someone other than the
course instructor. Past project reports were analyzed similarly. Each instance of a behavior was
counted individually. The number of instances of each type of behavior found was correlated
with the final grade as was the total overall number of behaviors.
Results
Survey results
Surveys were administered to students who had previously completed the Measurements and
Analysis lab course. There were 21 total respondents. The responses to the open-ended question

“Describe in your own words the steps you take to analyze your data and write your lab report,
from the time you leave lab until the time you hand in your report” were examined for evidence
of the desired behaviors. The percentage of the respondents describing each behavior was
tabulated and is shown in Table 2. Table 2 also shows the results of the question where students
were presented explicitly with the behaviors and asked to rate how often they take these actions
when analyzing data and writing lab reports. This data highlights the difference between what
students describe in their own words and what they claim to do when presented with a list of
desired behaviors. In general, there seems to be a disconnect between the behaviors students
have internalized after several years of schooling, and the behaviors students recognize as
valuable in their data analysis.
Table 2: Results from survey questions: “Describe the steps you take to analyze your data from
the time you leave lab" and "How often do you take these actions?"
How often do you take these actions? (n=21)
% % % %
Behaviors discussed in steps taken
Respondents answering ‘Never’
Respondents answering ‘Sometimes’
Respondents answering ‘Often’
Examine data for consistency 43 0 14 86
Statistical analysis of data where appropriate
5 0 52 48
Estimate uncertainties in results 0 0 57 43
Anticipate results from theory 10 0 24 76
Compare data to previous work or literature
10 24 48 29
Explain routine data processing such as calibration
10 5 62 33
Justify any necessary adjustments or corrections
19 0 10 90
Present tables or graphs of data 33 0 10 90
Describe calculation methods 67 0 19 81
Figure 1 below shows a graphical comparison of the percentage of respondents who indicated
that they often took each behavior compared to the behaviors noted in the open ended question.
Students clearly recognize the value of various data analysis behavior, and believe that they use
these behaviors while analyzing their data. At the same time, they are unable to articulate these
behaviors on their own for the most part. Some high level behaviors that are extremely important
for senior level and graduate work, such as estimating uncertainties and comparing data to
existing literature, are not practiced by the students to any great extent.

Figure 1: Comparison between behaviors described in narrative responses and behaviors reported
as being taken often.
Many responses to the open-ended questions focused on the mechanics of report writing, rather
than data analysis tasks. A typical response is shown here:
“1. Look for outliers in the data 2. Go over instructions/procedure of lab report 3. Do
calculations and statistics 4. Analyze data 5. Check relevancy with goal and purpose of
lab 6. Formulate results (in outline) 7. Write intro, abstract, procedure, and data 8. Put
results and analysis (with graphs and charts) 9. Answer questions 10. Attach appendix 11.
Proofread 12. Check the results and analysis section 13. Clean the formatting 14. Print
15. Hand in!”
Many students saw data analysis as a step by step process, and many did number the steps. There
was also a lot of focus on finding the ‘correct’ answer, treating lab analysis in a similar manner
to a homework set. Another subset of students focused primarily on graphing as the primary task
in data analysis, as exemplified by the following response:
“I put all my data into excel and then make scatter plots. I create trendlines and equations
to look for trends in the data.”
These students focused heavily on the tools for data analysis, such as Excel or Matlab, rather
than the tasks of data analysis.
Responses to the question “If an assignment tells you to use data to justify your answers, how
would you describe what that means to a freshman student?” showed few insights. A typical
response tends to be fairly obvious:
0
10
20
30
40
50
60
70
80
90
100
Examine datafor
consistency
Statisticalanalysis ofdata whereappropriate
Estimateuncertainties
in results
Anticipateresults from
theory
Comparedata to
previouswork or
literature
Explainroutine dataprocessing
such ascalibration
Justify anynecessary
adjustmentsor corrections
Presenttables orgraphs of
data
Describecalculationmethods
% of Respondents
% Often % Behaviors discussed in steps taken

“Use the data that was gathered in class and provided to you to support that the theories
represented by your answers are true.”
However, one particularly insightful comment discussed the idea that laboratory data is not
necessarily always predictable:
“I think that at the beginning of freshman year a student has not yet grasped the fact that
very rarily [sic] is data perfect.”
Another open response question asked students to “Describe the steps you take when you
encounter data that seems wrong. Do you discount it, talk to someone else, etc.?” A student’s
response to anomalous data has been shown to evolve as their maturity and higher level skills
develop.17 Many of the responses clearly indicate the view that there is one correct answer that
the lab should generate, and the student’s job is to get data that supports that one correct answer:
“If possible, I try to obtain the data again to hopefully get normal results. If not, I usually
speak to others to see if we are in the same boat.”
Other respondents show evidence that the student has learned and retained skills for dealing with
anomalous data:
“1. Ask the TA 2. Repeat the experiment and collect more data 3. Compare with other
groups 4. Neglect if it’s an outlier (I believe this is taught in Measurements class)”
Finally, a few students seemed to truly value what can be learned from ‘wrong data’:
“If the experiment was done correctly, all data collected is good data (i.e. it should never
be discounted). This seemingly-wrong data can be mentioned in the discussion section of
the report, and talked about at-length as to why it seems wrong. Information like this can
actually be the most useful data out there, as it provides avenues for new learning.”
The results of the final multiple choice questions on the survey are presented in Figures 2 and 3.
The majority of students tend to wait three or more days before they start analyzing their lab
data. This might be significant, particularly if students fail to maintain proper notes and lab
notebooks. The majority of students spend from 4-6 hours on writing lab reports. If students are
expected to do background research and theoretical modeling, this may or may not be enough
time for the in-depth work needed.

Figure 2: Survey responses to the question "How soon after lab ends do you start analyzing
data?"
Figure 3: Survey responses to the question "How long do you typically spend on a lab report?"
Lab report analysis
Between 7 and 9 lab reports were examined for each of the first 6 lab experiments in the course.
The identifying information and scores were removed prior to being critically read by someone
other than the course instructor. The number of instances of each behavior was noted. Figure 4
shows the distribution of the behaviors across the labs. As listed in the Methodology section,
certain behaviors were explicitly required in some labs but not in others. It is interesting to note
that some behaviors were shown even when not explicitly requested. For example, lab 3 does not
explicitly ask for comparison to previous work from the literature, however it was noted in 10%
0.00%
10.00%
20.00%
30.00%
40.00%
50.00%
60.00%
Same day Next day Within 3 days postlab
More than 3 dayspost lab
How soon after lab ends do you start analyzing data?
% of Respondents
0.00%
10.00%
20.00%
30.00%
40.00%
50.00%
60.00%
1-2 hours 2-4 hours 4-6 hours 6+ hours
How long do you typicallyspend on a lab report?
% of Respondents

of the lab reports. Conversely, not all lab reports demonstrated behaviors that were explicitly
requested.
Figure 4: Comparison of behaviors exhibited in the lab reports for the first six lab experiments.
Table 3 shows an example of the results of the textual analysis for Lab 1. The total number of
behaviors exhibited by each student was summed. Both the number of instances of each
individual behavior and the total number of behaviors were examined using the Pearson Product-
Moment Correlation Coefficient implemented with the Excel correlation analysis. This
procedure was repeated for all 6 sets of lab reports. Also included in the table is whether or not
various behaviors were specifically required in the lab handout. Although it may seem obvious
that students who perform more of the requested behaviors would have a higher grade, it is
important to note that some students are performing behaviors that are not explicitly asked for,
and some students are doing the bare minimum in terms of using these key skills. It is also
interesting that some of the behaviors are more highly correlated with high scores than others,
while there is one negative correlation and one behavior that was shown on none of the student
papers.
0
20
40
60
80
100
120
Examine datafor
consistency
Statisticalanalysis ofdata whereappropriate
Estimateuncertainties
in results
Anticipateresults from
theory
Compare datato previous
work orliterature
Explainroutine dataprocessing
such ascalibrationcorrections
Justify anynecessary
adjustmentsor corrections
Presenttables orgraphs of
data
Describecalculationmethods
% of labs examined demonstrating desired behaviors
% Lab 1 % Lab 2 % Lab 3 % Lab 4 % Lab 5 % Lab 6

Table 3: Results of textual analysis for Lab 1. Grades are based on a 100-point scale.
Grade
Examine
data for
consistency
Statistical
analysis of data where
appropriate
Estimate
uncertainties
in results
Anticipate
results from
theory
Compare data to
previous
work or literature
Explain
routine data
processing such as
calibration
corrections
Justify any necessary
adjustments
or corrections
Present
tables or graphs
of data
Describe
calculation
methods
Total Behaviors
76 0 0 0 1 0 1 0 6 0 8
73 0 1 0 0 0 0 0 6 0 7
100 2 0 0 0 0 1 0 6 1 10
83 0 0 0 0 0 0 0 5 0 5
94 0 0 1 0 0 3 1 4 3 12
66 2 0 0 0 0 0 0 4 0 6
50 1 0 0 0 0 0 0 3 0 4
100 3 1 1 0 0 2 0 8 2 17
Correlation 0.27 0.22 0.59 -0.10 0 0.69 0.32 0.66 0.70 0.80
Required? Yes Yes Yes Yes Yes Yes Yes
Table 4 summarizes the correlation coefficients for all 6 sets of lab reports, along with the
average correlation coefficient for each behavior. With one exception, all labs showed a strong
positive correlation between the total number of behaviors demonstrated and the report grade.
‘Presenting tables or graphs of data’ and ‘statistical analysis of data’ both showed moderately
strong correlations of 0.51. Three behaviors had a correlation value between 0.46-0.48: ‘describe
calculation methods’, ‘estimate uncertainties in results’, and ‘explain routine data processing
such as calibration corrections’. Weak positive correlations were seen with ‘justifying
adjustments or corrections’ and ‘examining data for consistency’. An interesting result is that
there was almost no effect for the behaviors ‘anticipate results from theory’ and ‘compare data to
previous work or literature’. This may point to either a weakness in the curriculum in reinforcing
these behaviors, or a lack of maturity and understanding on the part of the students at this point
in their academic careers. One lab that stands out is Lab 6. This had a very low positive
correlation for the total number of behaviors, correlations that were not significant for most
behaviors, and had one moderately negative correlation (-0.35) between grade and ‘explain
routine data processing such as calibration corrections’. It is unclear why exactly the results of
this lab were so different than the others. Another unanticipated result was the highly negative
correlation (-0.76) between grade and ‘anticipate results from theory’ for lab 5.

Table 4: Pearson’s correlation coefficient between individual behaviors and grade, as well as the
correlation between total behaviors exhibited and grade.
Examine data for
consistency
Statistical
analysis of
data where appropriate
Estimate uncertainties
in results
Anticipate
results
from theory
Compare
data to previous
work or
literature
Explain
routine
data processing
such as
calibration corrections
Justify any
necessary adjustments
or
corrections
Present
tables or
graphs of data
Describe calculation
methods
Total
Behaviors
Lab 1 0.27 0.22 0.59 -0.10 0.00 0.69 0.32 0.66 0.70 0.80
Lab 2 -0.03 0.86 0.84 0.51 0.48 0.48 0.28 0.30 0.75 0.74
Lab 3 0.30 0.79 0.49 0.46 0.00 0.68 0.11 0.13 0.87 0.78
Lab 4 0.64 0.13 0.43 0.42 0.00 0.41 0.35 0.84 0.22 0.85
Lab 5 0.28 0.89 0.47 -0.76 0.00 0.83 0.66 0.89 0.44 0.92
Lab 6 0.08 0.18 0.00 0.00 0.00 -0.35 0.12 0.25 -0.09 0.17
Average 0.25 0.51 0.47 0.09 0.08 0.46 0.31 0.51 0.48 0.71
Project Results
The term project in Measurements and Analysis requires students to work in teams to develop an
experiment, perform it, and then analyze and report the results. All of the desired behaviors are
explicitly requested in the project requirements. A total of 37 reports were examined for
evidence of the desired behaviors, results of which are shown in Table 5. Only one moderately
strong correlation was seen – for the behavior ‘estimate uncertainties in results’. Estimating
uncertainties is a concept that students historically find difficult in this course, and it makes sense
that students who can master the most difficult concepts will perform at a higher level and earn
higher grades. However, other than this one behavior, all of the correlations were weakly
positive for the individual behaviors, although there was a strong positive correlation with the
total number of behaviors.
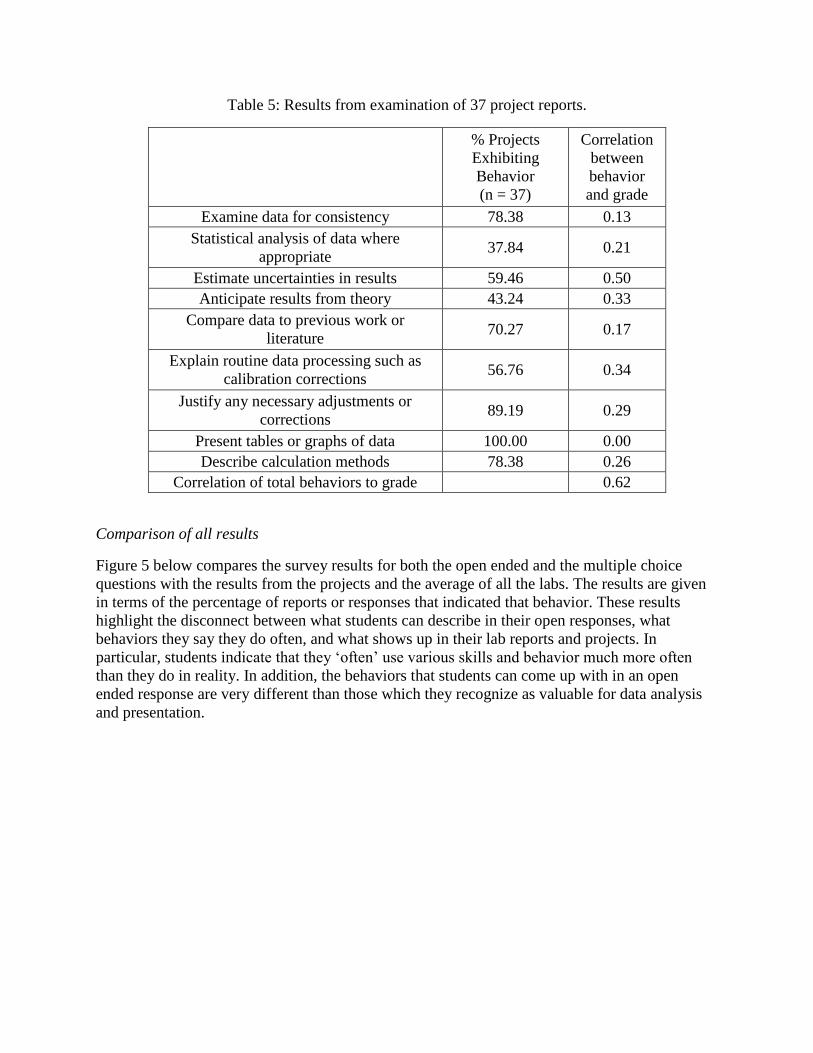
Table 5: Results from examination of 37 project reports.
% Projects
Exhibiting
Behavior
(n = 37)
Correlation
between
behavior
and grade
Examine data for consistency 78.38 0.13
Statistical analysis of data where
appropriate 37.84 0.21
Estimate uncertainties in results 59.46 0.50
Anticipate results from theory 43.24 0.33
Compare data to previous work or
literature 70.27 0.17
Explain routine data processing such as
calibration corrections 56.76 0.34
Justify any necessary adjustments or
corrections 89.19 0.29
Present tables or graphs of data 100.00 0.00
Describe calculation methods 78.38 0.26
Correlation of total behaviors to grade 0.62
Comparison of all results
Figure 5 below compares the survey results for both the open ended and the multiple choice
questions with the results from the projects and the average of all the labs. The results are given
in terms of the percentage of reports or responses that indicated that behavior. These results
highlight the disconnect between what students can describe in their open responses, what
behaviors they say they do often, and what shows up in their lab reports and projects. In
particular, students indicate that they ‘often’ use various skills and behavior much more often
than they do in reality. In addition, the behaviors that students can come up with in an open
ended response are very different than those which they recognize as valuable for data analysis
and presentation.

Figure 5: Combined results from survey, labs, and projects
Discussion
Students in Measurements and Analysis are typically in the fourth year of a five year program.
At this point in their curriculum, they have already had at least two previous lab courses, and are
often co-registered in a third lab course. In addition, they have already taken the Technical
Writing in the Discipline course, which is a technical writing course offered by the English
department specifically designed to teach engineers best practices for writing reports and
research papers. It is therefore expected that students should be reasonably proficient in
presenting their results in written form. It is clear from their narrative descriptions in the survey
that they have not necessarily internalized the entire data reporting process. Descriptions focus
heavily on writing tasks and calculation tasks, but tend to forget the higher order tasks of
scientific and academic argument. The tasks which are more concrete, such as graphing,
calculating, and following standard writing schemes stick in students’ minds as the key tasks in
processing lab data. It is particularly interesting that Measurements and Analysis deliberately
contains progressively more open ended lab experiments, designed to exercise these higher level
skills.
Students seem to recognize the value of some of these higher level behaviors based on the ‘often-
sometimes-never’ questions on the survey. However, there were two behaviors that various
students said they ‘never’ take: comparing data to previous work or literature, and explaining
routine data processing such as calibration corrections. Explaining routine data processing may
be neglected due to the student mindset that ‘professors know the right answer’. If students
believe that the professor has all the answers, it may seem unnecessary to explain routine tasks.
0
20
40
60
80
100
120
Examine datafor
consistency
Statisticalanalysis ofdata whereappropriate
Estimateuncertainties
in results
Anticipateresults from
theory
Comparedata to
previouswork or
literature
Explainroutine dataprocessing
such ascalibrationcorrections
Justify anynecessary
adjustmentsor
corrections
Presenttables orgraphs of
data
Describecalculationmethods
Comparison of what students report vs. evidence in lab reports
% Often (From Survey) % Behaviors Described (in Steps Taken) % Projects % Lab average
However, in several cases there were positive correlations between student grades and the
number of times they explained the routine tasks. Comparing data to previous work is rarely
done, even in cases where it is required. For example, in one of the labs, students are asked to
look up typical values for heat transfer coefficients and compare their experimental results.
Students will do this on the homework, but will rarely discuss the comparison in the lab reports.
This could be the result of unclear lab handout wording, or a lack of reinforcement in class.
However, even on the project, where this behavior is explicitly and specifically asked for, only
70% of the projects compared their results to literature values or compared their experiments to
previous work. Students seem to struggle with seeing their projects as small research projects,
rather than as an extended homework assignment. Anecdotally, one of the authors has noticed
that senior students also struggle with literature reviews in capstone design, which is clearly a
research project, potentially pointing to a weakness in the technical writing curriculum that
should be addressed.
The positive correlation between total number of desired behaviors and final grade seems
obvious at first. However, it should be noted that in several cases, some of the strongest
correlations are for behaviors that are not explicitly required, but are performed by some students
as general good practices. Moreover, students who used these behaviors at many points in the
report, rather than giving isolated answers to specific questions, seemed to earn higher grades
and demonstrate more understanding of the material. The best lab reports integrate all the
discussion questions into a comprehensive whole, rather than answering questions in isolation
like a homework assignment. Although having a list of specific questions that need answering
does make grading easier for the teaching assistants and provides clear goals for the students, it
may cause students to have a checklist mentality, rather than thinking about data processing and
analysis as a holistic process.
Conclusions
The results of this study show a disconnect between what students should do, what students think
they do, and what they actually produce in their lab reports. Positive correlations exist between
the total number of behaviors and final grade, but not all behaviors are created equal. Behaviors
that force students to closely examine their data, present it graphically, and describe their
calculations are associated with higher grades. The correlations between grades and individual
behaviors vary from lab to lab. Open ended lab assignments tend to lead to high level behaviors,
but only if students are coached to see lab reports as research projects, rather than homework
assignments. Even at the junior or senior level, students need explicit instruction in what is
expected in terms of connecting their data to theory and previous work. Future studies are
planned to develop effective interventions to promote these high level behaviors. In addition, the
current work has only examined individually written lab reports. It would be interesting to see if
lab reports written in groups are more or less likely to demonstrate the desired high level
behaviors. Finally, future lab handouts will be more explicit in asking for the desired behaviors,
and the introductory lectures for the term will be revised to discuss the higher level analysis
needed for laboratory work.
Acknowledgements
The authors would like to gratefully acknowledge Michael Fried of the Northeastern University
Center for Advancing Teaching and Learning through Research for his assistance in developing
and administering the survey.
References
1 Lyle D. Feisel and Albert J. Rosa, “The Role of the Laboratory in Undergraduate Engineering Education”, Journal
of Engineering Education, Vol. 94, No. 1, 2005 2 Criteria for Accrediting Engineering Programs 2015-2016, ABET Engineering Accreditation Commission,
http://www.abet.org/wp-content/uploads/2015/05/E001-15-16-EAC-Criteria-03-10-15.pdf 3 Norman Reid and Iqbal Shah, “The role of laboratory work in university chemistry”, Chemistry Education
Research and Practice, Vol. 8, No. 2, 2007 4 Lois C. Rosenthal, “Writing Across the Curriculum: Chemistry Lab Reports”, J. Chem. Ed, Vol. 64, No. 12, 1987 5 Malcolm Kiniry and Ellen Stranski, “Sequencing Expository Writing: A Recursive Approach”, College
Composition and Communication, Vol. 36, No. 2, 1985 6 K.A. Burke and Thomas J. Greenbowe, “Implementing the Science Writing Heuristic in the Chemistry
Laboratory”, Journal of Chemical Education, Vol. 83, No. 7, 2006 7 Ronald K. Gratz, “Improving Lab Report Quality by Model Analysis, Peer Review, and Revision”, Journal of
College Science Teaching, Vol. 19, No. 5, 1990 8 Amit Janardhan Nimunkar, John P. Puccinelli, Matthew S. Bollom, and Willis J. Tompkins, “Using Guided Design
Instruction to Motivate BME Sophomore Students to Learn Multidisciplinary Engineering Skills”, Proceedings of
the American Society for Engineering Education Annual Conference, Indianapolis, IN 2014 9 Tarlok S. Aurora, “Enhancing Learning by Writing Laboratory Reports in Class”, Journal of Faculty Development,
Vol. 24, No. 1, 2010 10 Alan S. Morris and Reza Langari, Measurement and Instrumentation: Theory and Application, Elsevier, Inc., 2012 11 Thomas G. Beckwith, Roy D. Marangoni, and John H. Lienhard V, Mechanical Measurements, 6th Edition,
Pearson Prentice Hall, 2007 12 Richard S. Figliola and Donald E. Beasley, Theory and Design for Mechanical Measurements, 6th Edition, John
Wiley & Sons, 2015 13 Patrick F. Dunn, Measurement and Data Analysis for Engineering and Science, 3rd Edition, CRC Press, 2014 14 Anthony J. Wheeler and Ahmad R. Ganji, Introduction to Engineering Experimentation, 3rd Edition, Prentice Hall,
2010 15 J.P. Holman, Experimental Methods for Engineers, 8th Edition, McGraw Hill, 2012 16 Daniel S. Domin, “A Review of Laboratory Insruction Styles”, Journal of Chemical education, Vol. 76, No.4,
1999 17 Clark A. Chinn and William F. Brewer, “The Role of Anomalous Data in Knowledge Acquisition: A Theoretical
Framework and Implications for Science Instruction”, Review of Educational Research, Vol. 63, No. 1, 1993

Appendix A: Survey Questions
Survey questions for study of student data analysis:
1) Describe in your own words the steps you take to analyze your data and write your lab
report, from the time you leave lab until the time you hand in the report.
2) If an assignment tells you to “use data to justify your answers”, how would you describe
what that means to a freshman student?
3) Describe the steps you take when you encounter data that seems wrong. Do you discount
it, talk to someone else, etc.?
4) The following is a list of possible actions that you could take while writing a lab report
and analyzing data. Please indicate whether you take these actions often, sometimes, or never
when you are writing lab reports:
o Examine data for consistency (Often/Sometimes/Never)
o Statistical analysis of data where appropriate (Often/Sometimes/Never)
o Estimate uncertainties in results (Often/Sometimes/Never)
o Anticipate results from theory (Often/Sometimes/Never)
o Compare data to previous work or literature (Often/Sometimes/Never)
o Explain routine data processing such as calibration corrections
(Often/Sometimes/Never)
o Justify any necessary adjustments or corrections (Often/Sometimes/Never)
o Present tables or graphs of data (Often/Sometimes/Never)
o Describe calculation methods (Often/Sometimes/Never)
5) How soon after a lab experiment do you start writing your lab report?
a) Same day
b) Next day
c) Within 3 days post lab
d) More than 3 days post lab
6) How long do you typically spend writing up a lab report?
a) 1-2 hours
b) 2-4 hours
c) 4-6 hours
d) 6+ hours

Appendix B: Examples of Lab Handouts (Abridged)
NORTHEASTERN UNIVERSITY
DEPARTMENT OF MECHANICAL AND INDUSTRIAL ENGINEERING
ME 4506-MEASUREMENT AND ANALYSIS
Lab 2: Temperature Measurement
1 Objectives:
The primary goals of this experiment are:
1. To compare the static and dynamic behavior of the following temperature measurement
devices:
a. Liquid in glass thermometers
b. K-type thermocouples
c. Resistance Temperature Detectors (RTDs)
d. Thermistors
2. To create calibration curves for these devices
3. To determine the time constants for these devices
4. To accurately determine the temperature of an unknown temperature bath
Lab Procedure
Be sure that you bring at least one copy of the VI with you per group. Your group will lose
5 points on each person’s lab report if you do not bring a VI that can read thermocouple
data. Connect the sensors to the DAQ as instructed in the LabView class.
Constructing Calibration Curves
1. . You will need to establish standard temperature environments to build your calibration
curves. The environments will be room temperature, a steam point bath, an ice bath, and
a fixed temperature bath.
a. The steam point bath is constructed by filling a flask 2/3 with water and placing it
onto a hot plate. When it comes to a slow rolling boil, lightly place a stopper with
a thermometer into the opening of the flask. The thermometer needs to be in the
middle of the volume of water, and not in contact with the bottom or sides of the
flask. Do not push the stopper into the neck of the flask tightly – it needs to
be slightly loose to avoid bursting the flask.

b. The ice point bath is constructed by making a 50/50 mixture of ice and water in a
large beaker. The crushed ice is available from the ice maker in the lab.
c. The 50°C fixed temperature bath will be set up by the teaching assistants.
2. Using the liquid in glass thermometer, record the temperature of the ice point bath, the
fixed temperature bath, room temperature, and the steam point bath. This will serve as the
standard temperature.
3. Measure the 4 temperature environments (ice point, room temperature, steam point, and
fixed temperature) using the K-type thermocouple. The VI you created should give you a
voltage reading, a temperature reading and a standard deviation of that reading. Record
all three of these numbers on the data sheet you made in the pre-lab. Do not take readings
in any particular order – randomize the temperature environments to ensure that you are
not getting false trends.
4. Measure the 4 temperature environments with the thermistor, recording both the
temperature and the resistance measurements. Randomize the temperature environments
to ensure that you are not getting false trends.
5. Measure the 4 temperature environments with the RTD, recording the temperature
measurements. Randomize the temperature environments to ensure that you are not
getting false trends
Measuring time constants
6. Place all three temperature devices (thermocouple, RTD, and thermistor) into the ice
water bath for at least 3 minutes.
7. Start the LabView VI before removing the devices from the ice bath. Plunge the devices
as quickly as possible into the boiling water bath. Record the time until all three devices
have reached their maximum temperature. Stop the VI and save the time vs. temperature
data for each device.
Note: You can do each device separately, or all three simultaneously, whichever your group
finds easiest to do.
Measuring the unknown bath
8. There are two unknown temperature baths in the lab. Use all three devices to measure the
temperature of one of the unknown baths.
9. Record the number of your unknown bath and report this on your lab report.
Results and Analysis
Remember to clearly label all axes, caption all figures and tables, and to clearly indicate units.
You must present and clearly explain all the equations you use.
Results
1. Present your raw calibration data for the static calibration measurements in an organized,
well labeled table. Discuss any trends, errors, or unusual results.
2. Plot the calibration data for each of your devices, comparing your standard temperature to
the measured temperature.
3. For the K-type thermocouple, plot measured voltage vs. measured temperature. Fit the
curve to a second order polynomial and show the equation and the R2 value on the
graph.
4. Using the method outlined in lecture and discussed in the pre-lab homework, determine
the sensitivity of your thermocouple at 25 and 45 °C.
5. For the thermistor, plot 1/T vs ln(Resistance) for your measured data. Fit the curve to a
linear fit and show the equation and the R2 value on the graph.
6. Using the method outlined in section 1.1.3, determine β for your thermistor.
7. Plot the dynamic temperature data for each device as time vs. temperature. For
comparison, place all three raw data sets on the same graph.
8. Using the method described in section 1.2, determine the time constant and the 90% rise
times for each of the devices. Provide the necessary data in either tabular or graphical
form, and explain what equations you used, defining all constants. Note: If your bath
was not at exactly 100 °C, use the actual high temperature of your bath for best
accuracy.
9. In a table, provide the unknown temperature bath readings for all three devices, along
with the expected error as determined from the manufacturer’s accuracy specs. Indicate
clearly which value you believe to be the most accurate.
Analysis questions
1. Discuss the accuracy, sensitivity, and precision of the thermocouple during static
measurements. Does the thermocouple perform better in some temperature ranges than
others? Does the calibration data make sense compared with the stated accuracy from the
manufacturer?
2. Based on the thermistor behavior, is this an n-type or p-type thermistor? How does its
accuracy compare with the manufacturer’s specs? Did your β value as calculated from
your data match the β value given from the manufacturer? If it didn’t, why do you think
this is so?
3. Based on the static calibration data, which device seems most accurate? Use your data to
justify your choice.
4. Given the raw time vs. temperature data for the dynamic measurements, which device
responds the fastest to a step change? Explain why you think this is so, based on how the
different devices work.
5. Did the time constants and 90% rise times you calculated match with the data? If they
were different than what was expected, explain why you think this is so. Based on this
information, which device would you choose for dynamic measurements?
6. Which device provided the best answer for the unknown, and how do you know? Which
device was least accurate, and why? If you were unable to decide which answer was the
best, explain what limitations in the experiment made this so.
7. If you had to choose one instrument for both static and dynamic measurements, which
would it be, and why?
8. Explain what data you would need and what procedure would be required in order to
establish a 95% confidence interval for your answer for the unknown bath.
9. You used the liquid in glass thermometer for your standard measurement. Was this the
best choice? Why or why not?
Deliverables
The results for this lab should be written up in a memo format of no more than three pages of
text, not counting images, data, and calculations. All the questions above must be addressed to
get full credit. Please refer to the Lab Report Format document on Blackboard for the correct
report format and other details. In particular remember that there must be an introduction that
briefly explains the purpose and theory of the experiment. The report is due 1 week after your lab
meets, submitted using the Turnitin function via Blackboard.

NORTHEASTERN UNIVERSITY
DEPARTMENT OF MECHANICAL AND INDUSTRIAL ENGINEERING
ME 4506-MEASUREMENT AND ANALYSIS
Lab 5: Heat Transfer Coefficient of a Cylinder in Crossflow
2 Objectives:
The primary goals of this experiment are:
1. To measure power input into a cylindrical heater in order to determine heat flux
2. To measure air speed and determine the Reynolds number of the flow
3. To determine the average heat transfer coefficient and how it varies with flow rate and
temperature difference
4. To determine the relationship between Reynolds number and Nusselt number for this heat
transfer situation
Lab Procedure
General Notes: Heater temperature will be read using LabView, with a similar setup to what
you used in Lab 2, using a K-type thermocouple. We will be measuring voltage and current with
voltmeters. The spec sheet is available at:
http://www.instrumart.com/assets/Extech_EX300series_DataSheet.pdf. We will be measuring
wind speed and wind temperature with an environmental meter, details of which can be found
here: http://www.instrumart.com/assets/Extech-EN300-datasheet.pdf. Please note that the heater
gets very hot, very quickly. Take care not to bump into the heater during your experiment, and
make sure the thermocouple is securely fixed in place and the heater is secure on the ring stand
before starting. Some of the power supplies output voltage and current directly, others will
need voltage and current measured with separate voltmeters. You may need to adjust your
procedure accordingly.
1. Measure the dimensions of the cylindrical heater.
2. Determine where you are going to put the thermocouple probe on the cylinder. Fix the
thermocouple wire and the cylinder in place using the lab stand and wire or electrical
tape. It is important to make sure the thermocouple is actually measuring the temperature
of the cylinder. The other end of the thermocouple should be connected to a voltmeter.
3. The heater should be connected to a power supply. Verify all connections.
4. Turn the fan on and use the variac to adjust it to a low speed. Use the anemometer to
record the air temperature at the outflow of the fan, as well as the wind speed in m/s.

5. Turn on the power supply and adjust it to approximately 10 V. Start recording the
temperature in LabView, watching for when the temperature stabilizes.
6. Record voltage, current, air temperature, final heater temperature, and wind speed.
Remember, if your power supply does not automatically output voltage and current
you will need to measure it with separate voltmeters.
7. Continue increasing the power in whatever increments you choose. Record all the
measurements listed in part 6 at each new voltage. Wait for the temperature to
stabilize for 3-5 minutes before taking the heater reading.
8. Reduce the voltage back down to approximately 10V and increase the wind speed.
Repeat parts 6 and 7.
9. Repeat part 8 for as many wind speeds as you can before you run out of time. Remember:
Hold the wind speed constant, increase voltage through the range, then reduce the voltage
again and repeat at a higher wind speed.
Results
1. Determine the surface area of the cylinder.
2. In a well labeled table, present the data gathered for flow rate, power input, and final
temperature. Be sure to state units. In addition, calculate the heat transfer coefficient, the
Reynolds number, the Prandtl number, and the Nusselt number for each set of
experimental conditions. In your write up, explain what equations you used and define all
variables and constants clearly.
3. Plot heat transfer per unit area (q/A) vs. ΔT for each flow rate. You should have a curve
on the graph for each flow rate. Be sure to add the trendlines and R2 values for each data
set.
4. Plot the heat transfer coefficient vs. ΔT for each flow rate. You should have a curve on
the graph for each flow rate. Be sure to add the trendlines and R2 values for each data set.
Analysis
1. Use Table 1 or a heat transfer text to determine the expected relationship between the
Nusselt number and the Reynolds number for this heat transfer situation. Compare this
relationship to your experimental data. Did you see a similar relationship? If it is
different, how do you explain this? You may want to plot the theoretical equation vs.
your actual data for comparison.
2. Does equation 5 or equation 6 work better with your data? Explain.
3. Was the air flow upstream of the cylinder laminar, turbulent, or undetermined, based on
the Reynolds number? Did the situation change at any point? If so, why do you think it
did?
4. Were there any assumptions you had to make to use the equations presented? List them
and explain whether they were valid assumptions or not. Consider both fluid properties
and properties of the heater.
5. Is the heat transfer coefficient dependent on temperature difference? Explain why or why
not.
6. Discuss how the heat flux varies with air flow and with temperature difference, using
your experimental data.
7. Perform an uncertainty analysis on the heat transfer coefficient. What is the uncertainty in
the heat transfer coefficient based on the combined uncertainties of the power, area, and
temperature measurements?
8. Which of the devices used in the experiment is the most accurate? Which is the most
precise? Which has the greatest sensitivity? How can you tell?
Deliverables
The results for this lab should be written up in a memo format of no more than three pages of
text, plus additional pages for images, data, and calculations. All the questions above must be
addressed to get full credit. Please refer to the Lab Report Format document on Blackboard for
the correct report format and other details. In particular remember that there must be an
introduction that briefly explains the purpose and theory of the experiment. The report is due 1
week after your lab meets, submitted using Turnitin via Blackboard.


![INDEX [] · o Calculate, analyze, and interpret measurement system capability using repeatability and ... Risk management • Process MonitoringFailure Mode Effect Analysis (FMEA)](https://img.dokumen.tips/doc/110x75/5e8914ee45dad3458c15b0f0/index-o-calculate-analyze-and-interpret-measurement-system-capability-using.jpg)