Embed Size (px)
Citation preview
MAQUASSI HILLS
LOCAL MUNICIPALITY
ANNUAL FINANCIAL STATEMENTS
FOR THE YEAR ENDED
30 JUNE 2012

ACCOUNTING POLICIES
Maquassi Hills Local Municipality
for the year ended 30 June 2012

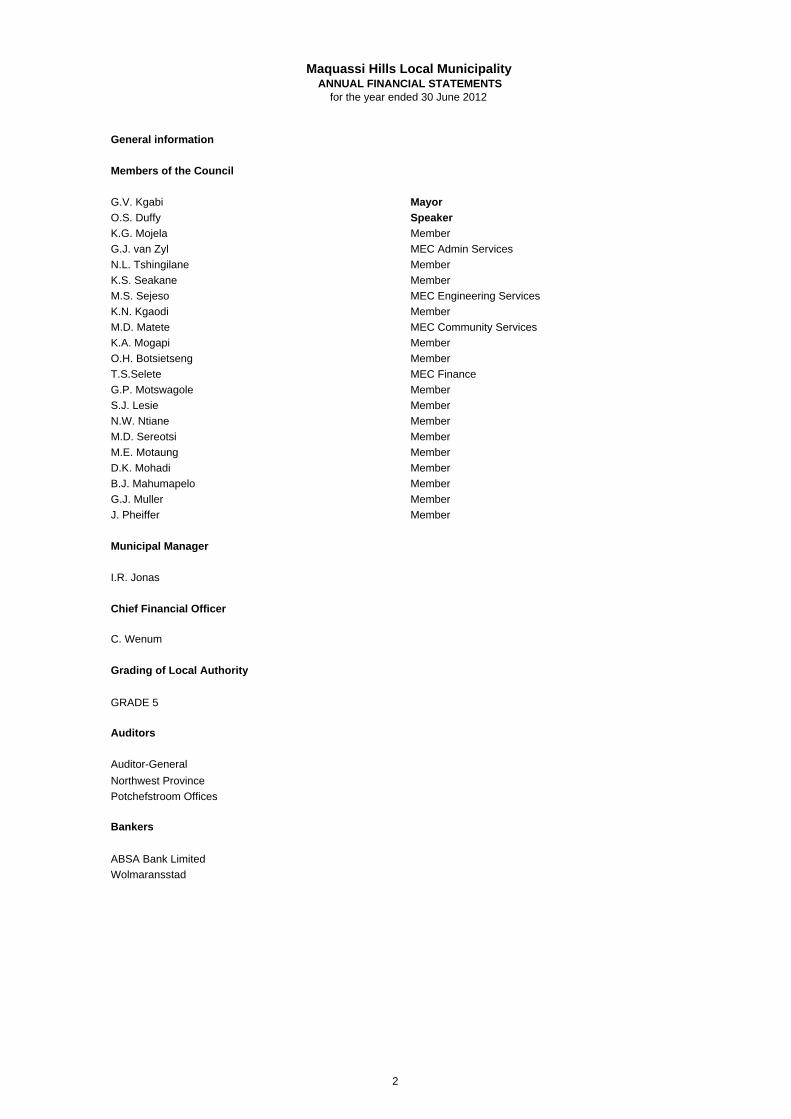
General information
Members of the Council
G.V. Kgabi Mayor
O.S. Duffy Speaker
K.G. Mojela Member
G.J. van Zyl MEC Admin Services
N.L. Tshingilane Member
K.S. Seakane Member
M.S. Sejeso MEC Engineering Services
K.N. Kgaodi Member
M.D. Matete MEC Community Services
K.A. Mogapi Member
O.H. Botsietseng Member
T.S.Selete MEC Finance
G.P. Motswagole Member
S.J. Lesie Member
N.W. Ntiane Member
M.D. Sereotsi Member
M.E. Motaung Member
D.K. Mohadi Member
B.J. Mahumapelo Member
G.J. Muller Member
J. Pheiffer Member
Municipal Manager
I.R. Jonas
Chief Financial Officer
C. Wenum
Grading of Local Authority
GRADE 5
Auditors
Auditor-General
Northwest Province
Potchefstroom Offices
Bankers
ABSA Bank Limited
Wolmaransstad
Maquassi Hills Local Municipality
for the year ended 30 June 2012ANNUAL FINANCIAL STATEMENTS
2

General information (continued)
Registered Office:
Physical address:
Postal address:
Telephone number:
Fax number:
E-mail address:
Maquassi Hills LoANNUAL FINANCI
for the year ende
3

19 Krugerstreet, Wolmaransstad
19 Kruger Street
Wolmaranstad
2630
Private Bag X3
Wolmaransstad
2630
(018) 596 1067
(018) 596 1555 or (018) 596 2436
ocal MunicipalityIAL STATEMENTSed 30 June 2012
4

Index Page
General information 2-3
Approval of annual financial statements 4
Statement of Financial Position 5
Statement of Financial Performance 6
Statement of Changes in Net Assets 7
Cash Flow Statement 8
Accounting Policies 9-30
Notes to the Annual Financial Statements 31-62
Appendix A: Schedule of External Loans 63
Appendix B: Analysis of Property, Plant and Equipment 64-67
Appendix C: Actual versus Budget 68
Appendix D: Supply chain management deviations 69
Appendix E: Investments Schedule 70
for the year ended 30 June 2011
Maquassi Hills Local MunicipalityANNUAL FINANCIAL STATEMENTS
1

Approval of annual financial statements
I.R. Jonas MA.History, HDE, PHD Public ManagementMunicipal Manager:
DATE:………………………………………..
Maquassi Hills Local Municipality
__________________________________________________________________
for the year ended 30 June 2012ANNUAL FINANCIAL STATEMENTS
I am responsible for the preparation of these annual financial statements, which are set out on pages 1 to 7, in terms of Section 126(1) of the Municipal Finance Management Act and which I have signed on behalf of the Municipality.I certify that the salaries, allowances and benefits of Councillors, loans made to Councillors, if any, and payments made to Councillors for loss of office, if any, as disclosed in note 26 of these annual financial statements are within the upper limits of the framework envisaged in Section 219 of the Constitution, read with the Remuneration of Public Officer Bearers Act and the Minister of Provincial and Local Government’s determination in accordance with this Act.
4
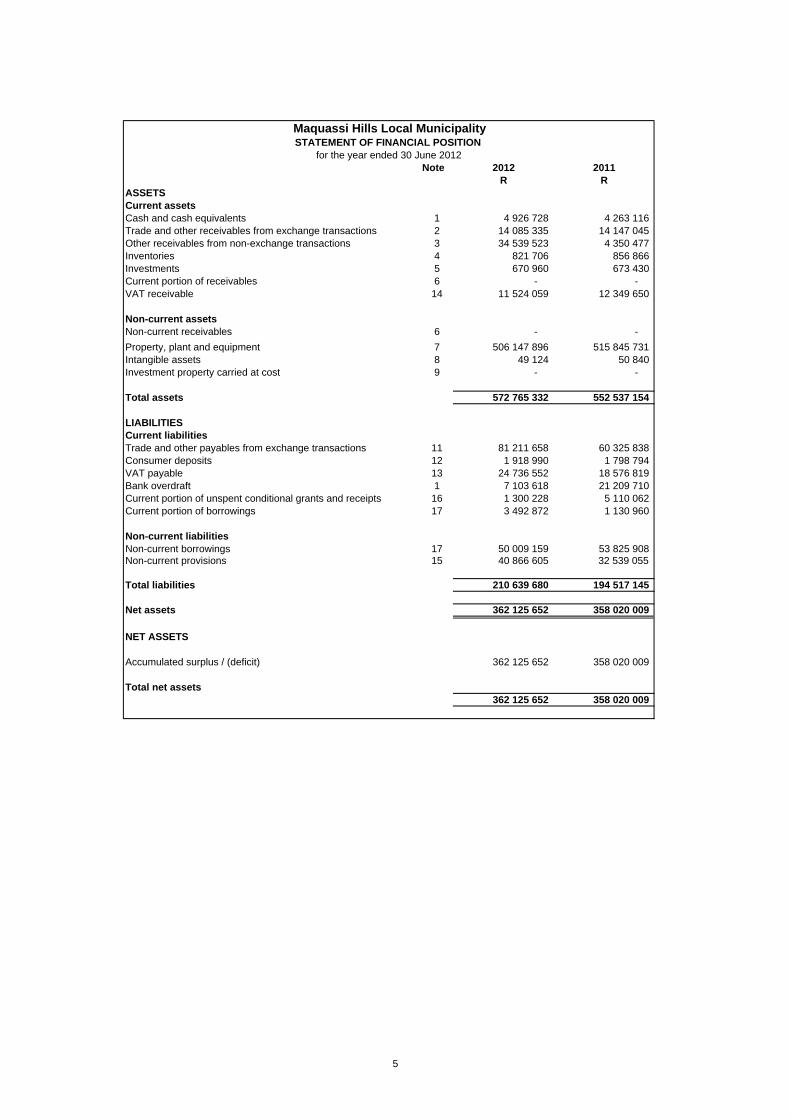
Note 2012 2011R R
ASSETSCurrent assetsCash and cash equivalents 1 4 926 728 4 263 116 Trade and other receivables from exchange transactions 2 14 085 335 14 147 045 Other receivables from non-exchange transactions 3 34 539 523 4 350 477 Inventories 4 821 706 856 866 Investments 5 670 960 673 430 Current portion of receivables 6 - - VAT receivable 14 11 524 059 12 349 650
Non-current assetsNon-current receivables 6 - -
Property, plant and equipment 7 506 147 896 515 845 731 Intangible assets 8 49 124 50 840 Investment property carried at cost 9 - -
Total assets 572 765 332 552 537 154
LIABILITIESCurrent liabilitiesTrade and other payables from exchange transactions 11 81 211 658 60 325 838 Consumer deposits 12 1 918 990 1 798 794 VAT payable 13 24 736 552 18 576 819 Bank overdraft 1 7 103 618 21 209 710 Current portion of unspent conditional grants and receipts 16 1 300 228 5 110 062 Current portion of borrowings 17 3 492 872 1 130 960
Non-current liabilitiesNon-current borrowings 17 50 009 159 53 825 908 Non-current provisions 15 40 866 605 32 539 055
Total liabilities 210 639 680 194 517 145
Net assets 362 125 652 358 020 009
NET ASSETS
Accumulated surplus / (deficit) 362 125 652 358 020 009
Total net assets362 125 652 358 020 009
for the year ended 30 June 2012
Maquassi Hills Local MunicipalitySTATEMENT OF FINANCIAL POSITION
5

Note 2012 2011R R
RevenueProperty rates 18 18 619 911 19 163 696 Service charges 19 93 769 067 84 504 890 Rental of facilities and equipment 20 211 087 333 003 Interest earned - external investments 21 670 220 681 038 Interest earned - outstanding receivables 22 14 425 971 12 222 069 Fines 3 026 987 6 659 132 Dividends 1 699 10 940 Licences and permits 9 916 387 8 854 783 Government grants and subsidies 23 107 661 242 122 505 803 Other income 24 1 380 233 1 283 484
Total revenue 249 682 803 256 218 839
ExpensesEmployee related costs 25 45 893 002 47 760 140 Remuneration of councillors 26 6 203 747 4 409 588 Debt impairment 54 227 461 50 554 103 Depreciation and amortisation expense 27 25 654 484 24 801 791 Repairs and maintenance 2 906 684 2 092 174 Finance costs 28 9 120 591 5 666 715 Bulk purchases 29 53 460 778 44 168 410 Contracted services 30 5 222 252 7 185 722 General expenses 31 41 969 204 37 236 829
Total expenses 244 658 203 223 875 471
Gain / (loss) on sale of assets 32 (918 960) (791 924)
Surplus / (deficit) for the period 4 105 640 31 551 444
Maquassi Hills Local MunicipalitySTATEMENT OF FINANCIAL PERFORMANCE
for the year ended 30 June 2012
6
2012 2011
R R
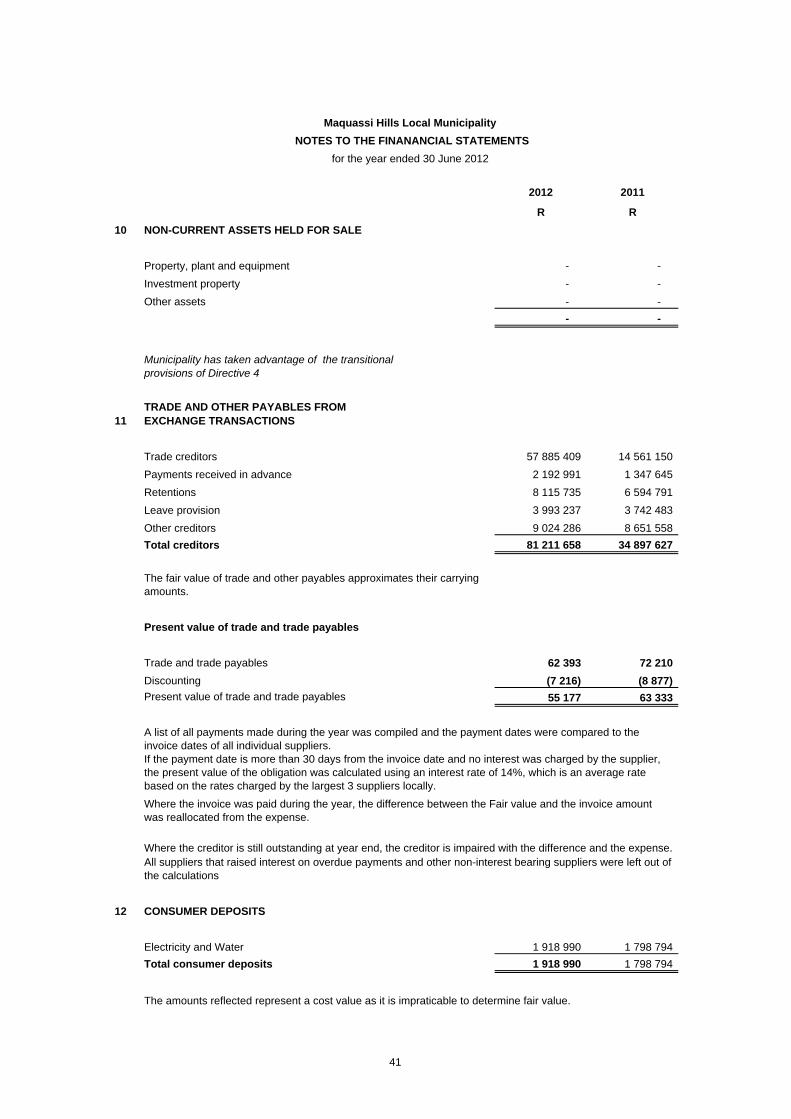
10 NON-CURRENT ASSETS HELD FOR SALE
Property, plant and equipment - -
Investment property - -
Other assets - -
- -
11TRADE AND OTHER PAYABLES FROM EXCHANGE TRANSACTIONS
Trade creditors 57 885 409 14 561 150
Payments received in advance 2 192 991 1 347 645
Retentions 8 115 735 6 594 791
Leave provision 3 993 237 3 742 483
Other creditors 9 024 286 8 651 558
Total creditors 81 211 658 34 897 627
Present value of trade and trade payables
Trade and trade payables 62 393 72 210
Discounting (7 216) (8 877)
Present value of trade and trade payables 55 177 63 333
12 CONSUMER DEPOSITS
Electricity and Water 1 918 990 1 798 794
Total consumer deposits 1 918 990 1 798 794
The amounts reflected represent a cost value as it is impraticable to determine fair value.
Maquassi Hills Local Municipality
NOTES TO THE FINANANCIAL STATEMENTS
for the year ended 30 June 2012
A list of all payments made during the year was compiled and the payment dates were compared to the invoice dates of all individual suppliers.
Municipality has taken advantage of the transitional provisions of Directive 4
The fair value of trade and other payables approximates their carrying amounts.
If the payment date is more than 30 days from the invoice date and no interest was charged by the supplier, the present value of the obligation was calculated using an interest rate of 14%, which is an average rate based on the rates charged by the largest 3 suppliers locally.
Where the creditor is still outstanding at year end, the creditor is impaired with the difference and the expense.All suppliers that raised interest on overdue payments and other non-interest bearing suppliers were left out of the calculations
Where the invoice was paid during the year, the difference between the Fair value and the invoice amount was reallocated from the expense.
41
2012 2011
R R
Maquassi Hills Local Municipality
NOTES TO THE FINANANCIAL STATEMENTS
for the year ended 30 June 2012
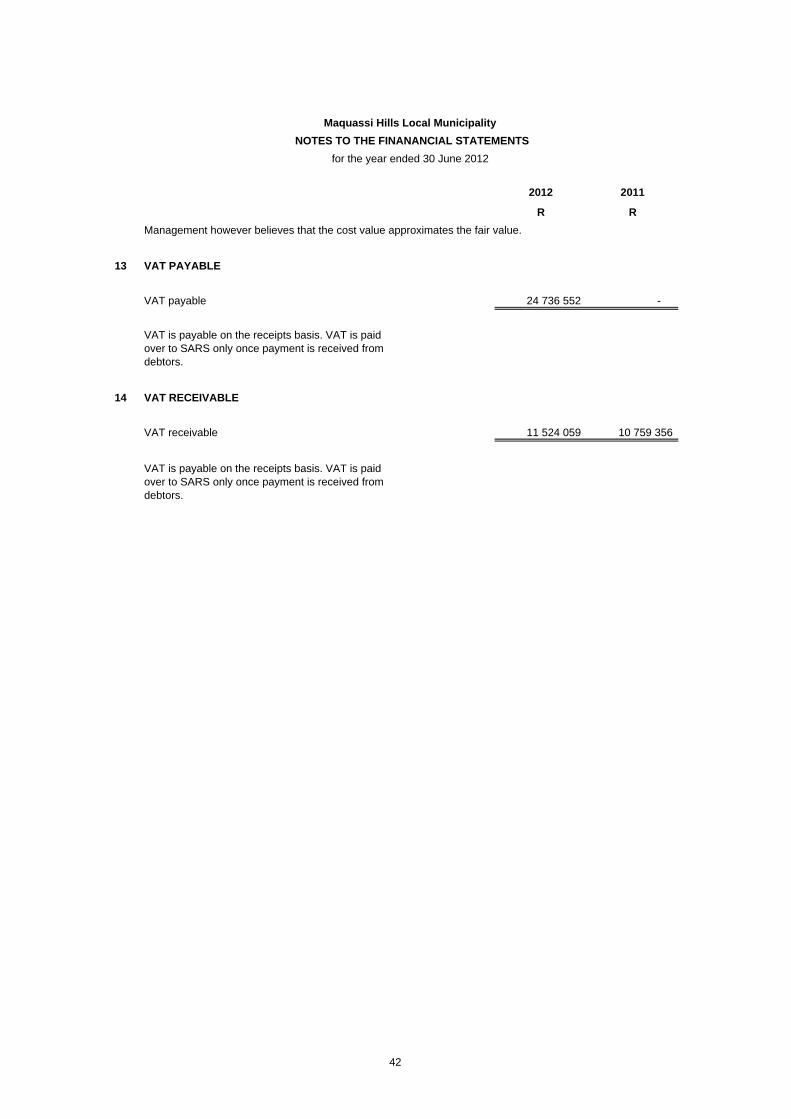
Management however believes that the cost value approximates the fair value.
13 VAT PAYABLE
VAT payable 24 736 552 -
VAT is payable on the receipts basis. VAT is paid over to SARS only once payment is received from debtors.
14 VAT RECEIVABLE
VAT receivable 11 524 059 10 759 356
VAT is payable on the receipts basis. VAT is paid over to SARS only once payment is received from debtors.
42

2012 2011
R R
Maquassi Hills Local Municipality
NOTES TO THE FINANANCIAL STATEMENTS
for the year ended 30 June 2012
15 PROVISION
Provision for rehabilitation of landfill sites (19 732 250)
Provision for long-service awards 1 999 116 1 650 267
Provision for post-employment health care benefits 19 135 239 12 877 400
Total Non-Current Provisions 1 402 105 14 527 667
16 UNSPENT CONDITIONAL GRANTS AND RECEIPTS
Unspent Conditional Grants from other spheres of Government
Municipal Infrastructure Grant - 3 546 237
Dr Kenneth Kaunda District Municipality - -
Finance Management Grant (1) 339 476
Provincial Government Library Grant 1 150 260 621 476
Provincial Gazette Disaster Grant - -
DWAF Bulk Water 2 2
DBSA Grant (IT System) - -
Provincial Government Bulk Water (PIG) - 513 555
DWAF Water Demand - -
DBSA Water Demand - -
Municipal Systems Improvement Grant - 89 316
EPWP Roads 149 967 -
Total Unspent Conditional Grants and Receipts 1 300 228 5 110 062
Non-current unspent conditional grants and receipts - - Current portion of unspent conditional grants and receipts 1 300 228 5 110 062
The provision for rehabilitation of landfill sites relates to the legal obligation to rehabilitate landfill sites used for waste disposal. A report was compiled after the landfill sites were visited and inspected. This report was done onhand of the Guideline Document for the Evaluation of the quatum of closure related financial provision and Section B: working manual for the assessment of the quantum and annexures. The net present value is calculated as the present value of the future obligation, and discounted at a rate of 9.5543%
The net present value (NPV) amount of the previous year is deducted from the NPV amount of the following year to indicate the movement per annum, which include the capital as well as the interest factor
See Note 23 for reconciliation of grants and receipts. These amounts are invested in ring-fenced investments until utilised.
43
2012 2011
R R
Maquassi Hills Local Municipality
NOTES TO THE FINANANCIAL STATEMENTS
for the year ended 30 June 2012
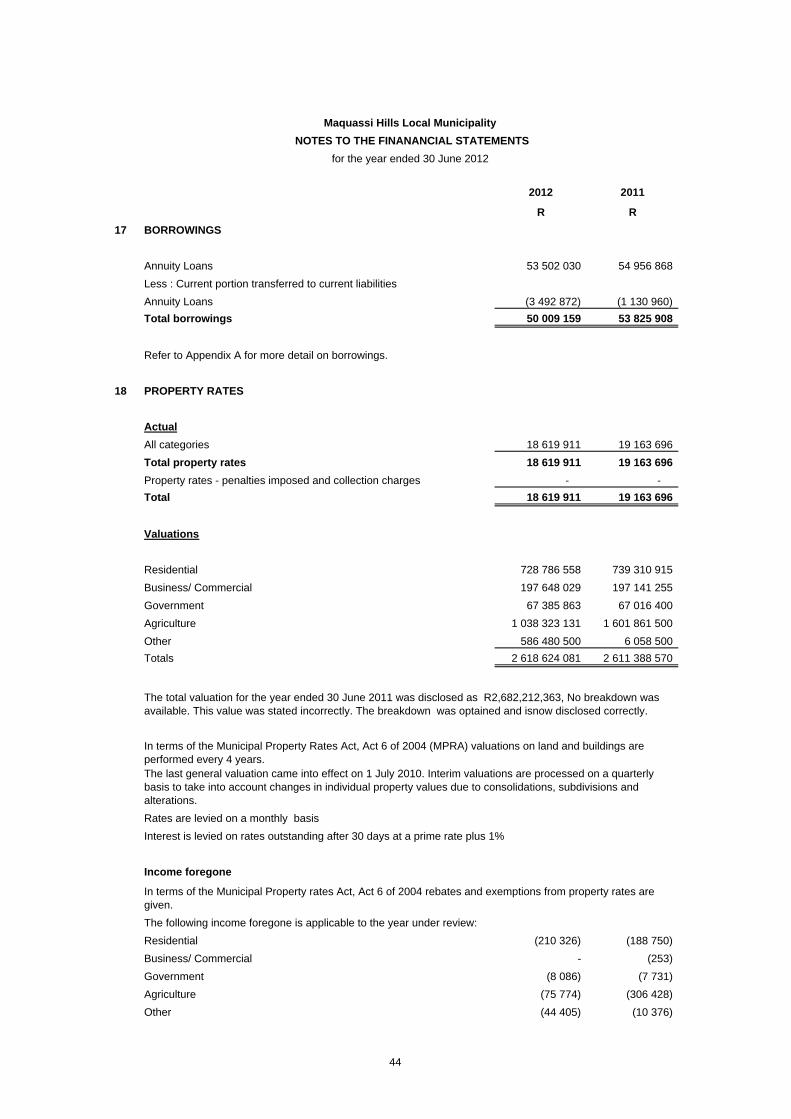
17 BORROWINGS
Annuity Loans 53 502 030 54 956 868
Less : Current portion transferred to current liabilities
Annuity Loans (3 492 872) (1 130 960)
Total borrowings 50 009 159 53 825 908
Refer to Appendix A for more detail on borrowings.
18 PROPERTY RATES
Actual
All categories 18 619 911 19 163 696
Total property rates 18 619 911 19 163 696
Property rates - penalties imposed and collection charges - -
Total 18 619 911 19 163 696
Valuations
Residential 728 786 558 739 310 915
Business/ Commercial 197 648 029 197 141 255
Government 67 385 863 67 016 400
Agriculture 1 038 323 131 1 601 861 500
Other 586 480 500 6 058 500
Totals 2 618 624 081 2 611 388 570
Rates are levied on a monthly basis
Interest is levied on rates outstanding after 30 days at a prime rate plus 1%
Income foregone
The following income foregone is applicable to the year under review:
Residential (210 326) (188 750)
Business/ Commercial - (253)
Government (8 086) (7 731)
Agriculture (75 774) (306 428)
Other (44 405) (10 376)
In terms of the Municipal Property rates Act, Act 6 of 2004 rebates and exemptions from property rates are given.
The total valuation for the year ended 30 June 2011 was disclosed as R2,682,212,363, No breakdown was available. This value was stated incorrectly. The breakdown was optained and isnow disclosed correctly.
In terms of the Municipal Property Rates Act, Act 6 of 2004 (MPRA) valuations on land and buildings are performed every 4 years.The last general valuation came into effect on 1 July 2010. Interim valuations are processed on a quarterly basis to take into account changes in individual property values due to consolidations, subdivisions and alterations.
44
2012 2011
R R
Maquassi Hills Local Municipality
NOTES TO THE FINANANCIAL STATEMENTS
for the year ended 30 June 2012
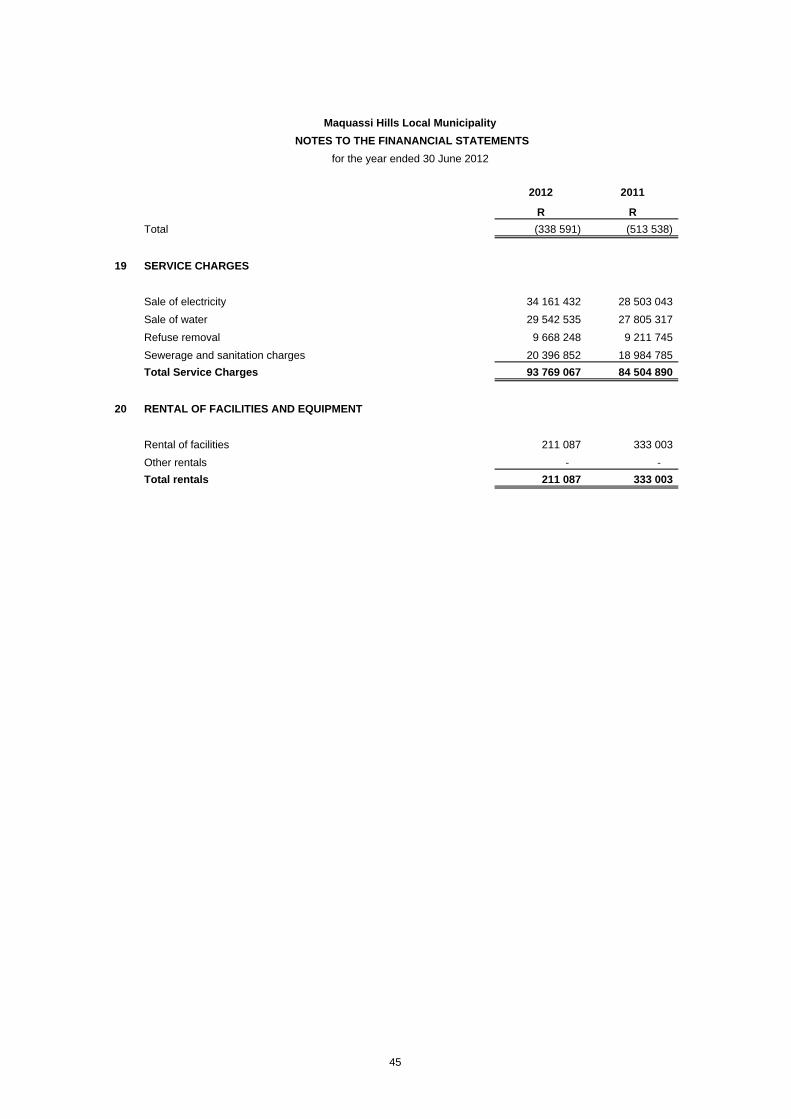
Total (338 591) (513 538)
19 SERVICE CHARGES
Sale of electricity 34 161 432 28 503 043
Sale of water 29 542 535 27 805 317
Refuse removal 9 668 248 9 211 745
Sewerage and sanitation charges 20 396 852 18 984 785
Total Service Charges 93 769 067 84 504 890
20 RENTAL OF FACILITIES AND EQUIPMENT
Rental of facilities 211 087 333 003
Other rentals - -
Total rentals 211 087 333 003
45
2012 2011
R R
Maquassi Hills Local Municipality
NOTES TO THE FINANANCIAL STATEMENTS
for the year ended 30 June 2012
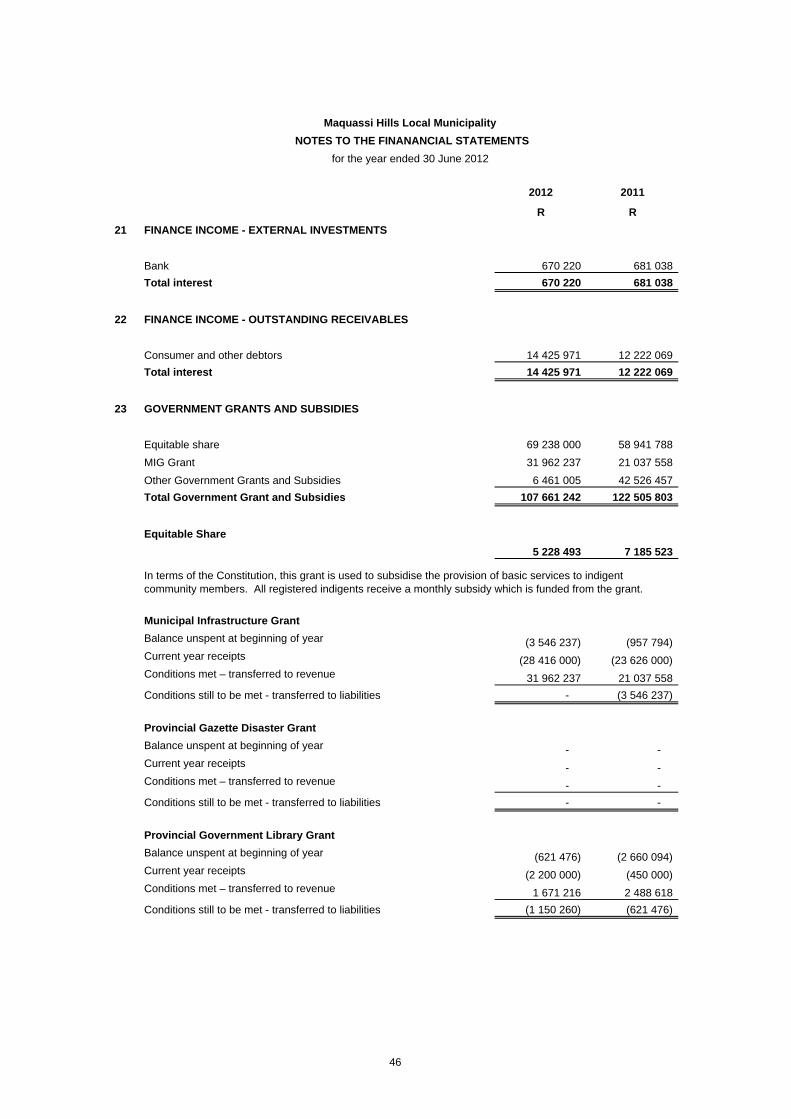
21 FINANCE INCOME - EXTERNAL INVESTMENTS
Bank 670 220 681 038
Total interest 670 220 681 038
22 FINANCE INCOME - OUTSTANDING RECEIVABLES
Consumer and other debtors 14 425 971 12 222 069
Total interest 14 425 971 12 222 069
23 GOVERNMENT GRANTS AND SUBSIDIES
Equitable share 69 238 000 58 941 788
MIG Grant 31 962 237 21 037 558
Other Government Grants and Subsidies 6 461 005 42 526 457
Total Government Grant and Subsidies 107 661 242 122 505 803
Equitable Share
5 228 493 7 185 523
Municipal Infrastructure Grant
Balance unspent at beginning of year (3 546 237) (957 794) Current year receipts (28 416 000) (23 626 000) Conditions met – transferred to revenue 31 962 237 21 037 558
Conditions still to be met - transferred to liabilities - (3 546 237)
Provincial Gazette Disaster Grant
Balance unspent at beginning of year - - Current year receipts - - Conditions met – transferred to revenue - -
Conditions still to be met - transferred to liabilities - -
Provincial Government Library Grant
Balance unspent at beginning of year (621 476) (2 660 094) Current year receipts (2 200 000) (450 000) Conditions met – transferred to revenue 1 671 216 2 488 618
Conditions still to be met - transferred to liabilities (1 150 260) (621 476)
In terms of the Constitution, this grant is used to subsidise the provision of basic services to indigent community members. All registered indigents receive a monthly subsidy which is funded from the grant.
46
2012 2011
R R
Maquassi Hills Local Municipality
NOTES TO THE FINANANCIAL STATEMENTS
for the year ended 30 June 2012
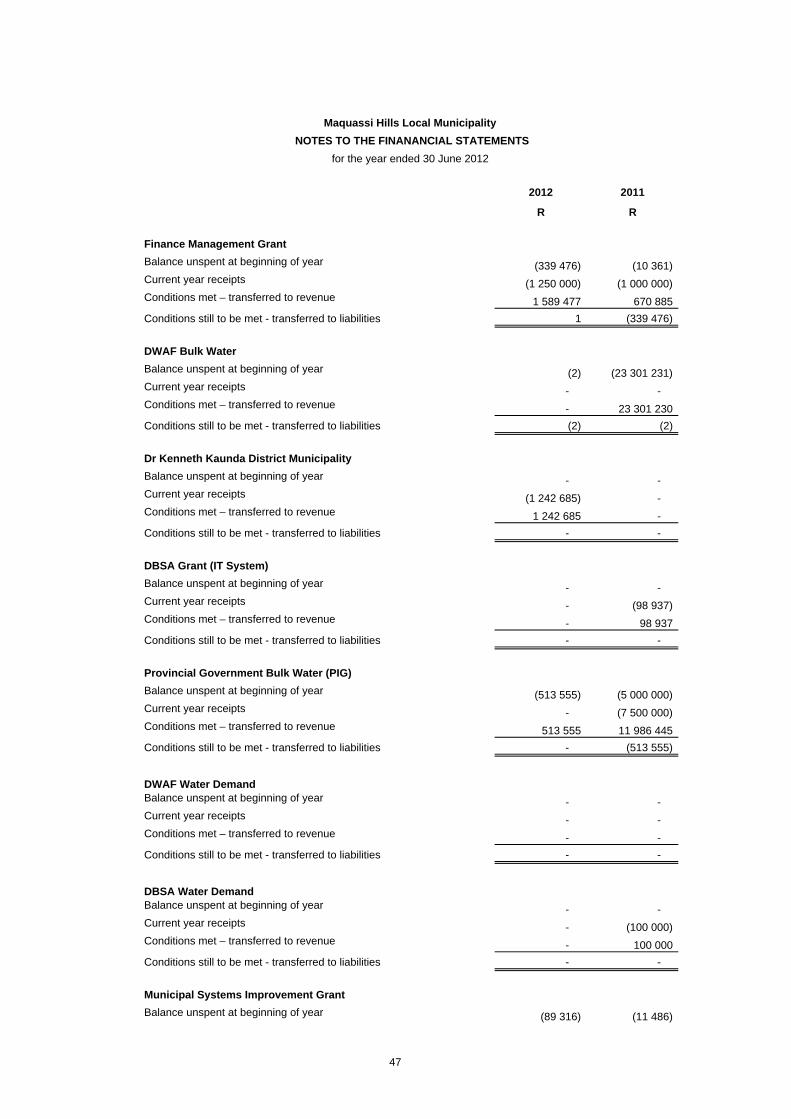
Finance Management Grant
Balance unspent at beginning of year (339 476) (10 361) Current year receipts (1 250 000) (1 000 000) Conditions met – transferred to revenue 1 589 477 670 885
Conditions still to be met - transferred to liabilities 1 (339 476)
DWAF Bulk Water
Balance unspent at beginning of year (2) (23 301 231) Current year receipts - - Conditions met – transferred to revenue - 23 301 230
Conditions still to be met - transferred to liabilities (2) (2)
Dr Kenneth Kaunda District Municipality
Balance unspent at beginning of year - - Current year receipts (1 242 685) - Conditions met – transferred to revenue 1 242 685 -
Conditions still to be met - transferred to liabilities - -
DBSA Grant (IT System)
Balance unspent at beginning of year - - Current year receipts - (98 937) Conditions met – transferred to revenue - 98 937
Conditions still to be met - transferred to liabilities - -
Provincial Government Bulk Water (PIG)
Balance unspent at beginning of year (513 555) (5 000 000) Current year receipts - (7 500 000) Conditions met – transferred to revenue 513 555 11 986 445
Conditions still to be met - transferred to liabilities - (513 555)
DWAF Water DemandBalance unspent at beginning of year - - Current year receipts - - Conditions met – transferred to revenue - -
Conditions still to be met - transferred to liabilities - -
DBSA Water DemandBalance unspent at beginning of year - - Current year receipts - (100 000) Conditions met – transferred to revenue - 100 000
Conditions still to be met - transferred to liabilities - -
Municipal Systems Improvement Grant
Balance unspent at beginning of year (89 316) (11 486)
47
2012 2011
R R
Maquassi Hills Local Municipality
NOTES TO THE FINANANCIAL STATEMENTS
for the year ended 30 June 2012
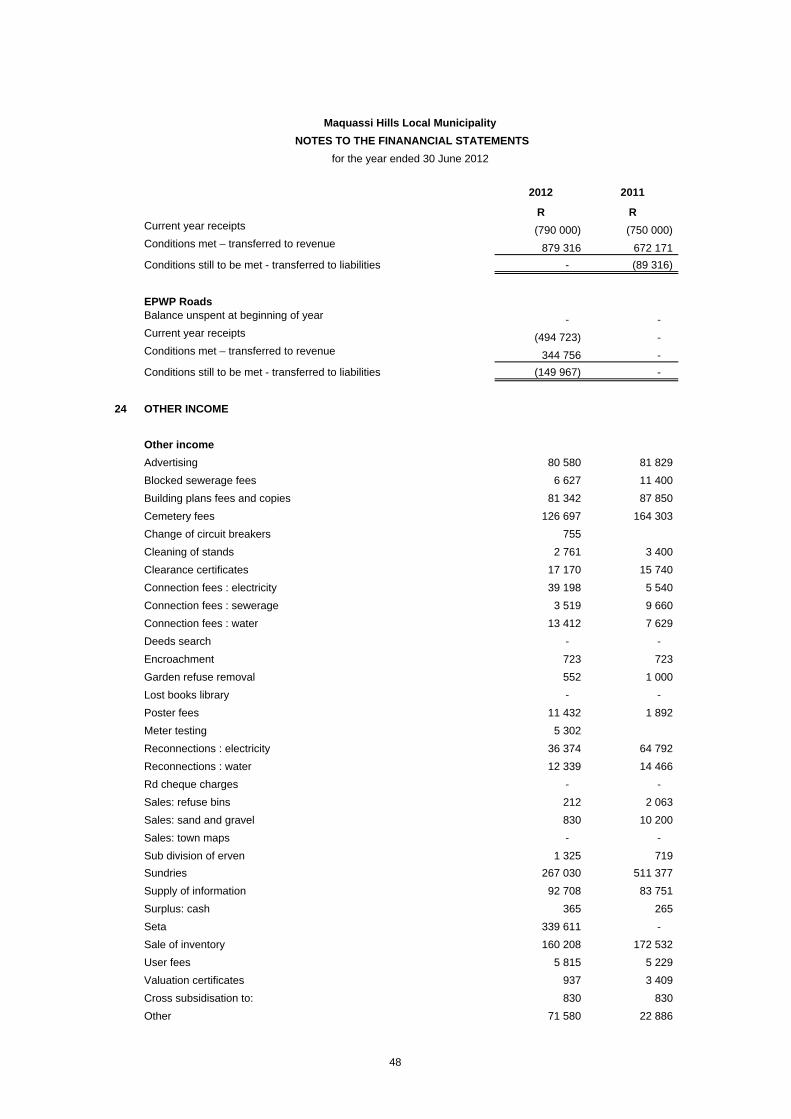
Current year receipts (790 000) (750 000) Conditions met – transferred to revenue 879 316 672 171
Conditions still to be met - transferred to liabilities - (89 316)
EPWP RoadsBalance unspent at beginning of year - - Current year receipts (494 723) - Conditions met – transferred to revenue 344 756 -
Conditions still to be met - transferred to liabilities (149 967) -
24 OTHER INCOME
Other income
Advertising 80 580 81 829
Blocked sewerage fees 6 627 11 400
Building plans fees and copies 81 342 87 850
Cemetery fees 126 697 164 303
Change of circuit breakers 755
Cleaning of stands 2 761 3 400
Clearance certificates 17 170 15 740
Connection fees : electricity 39 198 5 540
Connection fees : sewerage 3 519 9 660
Connection fees : water 13 412 7 629
Deeds search - -
Encroachment 723 723
Garden refuse removal 552 1 000
Lost books library - -
Poster fees 11 432 1 892
Meter testing 5 302
Reconnections : electricity 36 374 64 792
Reconnections : water 12 339 14 466
Rd cheque charges - -
Sales: refuse bins 212 2 063
Sales: sand and gravel 830 10 200
Sales: town maps - -
Sub division of erven 1 325 719
Sundries 267 030 511 377
Supply of information 92 708 83 751
Surplus: cash 365 265
Seta 339 611 -
Sale of inventory 160 208 172 532
User fees 5 815 5 229
Valuation certificates 937 3 409
Cross subsidisation to: 830 830
Other 71 580 22 886
48
2012 2011
R R
Maquassi Hills Local Municipality
NOTES TO THE FINANANCIAL STATEMENTS
for the year ended 30 June 2012
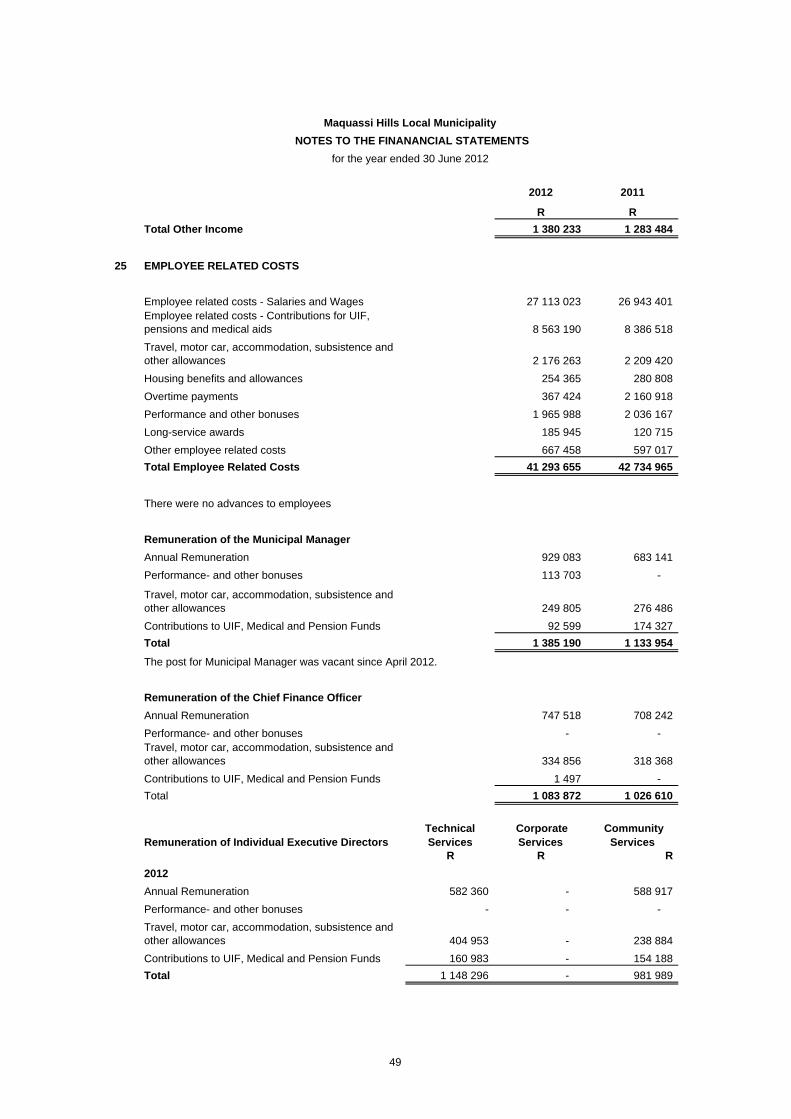
Total Other Income 1 380 233 1 283 484
25 EMPLOYEE RELATED COSTS
Employee related costs - Salaries and Wages 27 113 023 26 943 401 Employee related costs - Contributions for UIF, pensions and medical aids 8 563 190 8 386 518
Travel, motor car, accommodation, subsistence and other allowances 2 176 263 2 209 420
Housing benefits and allowances 254 365 280 808
Overtime payments 367 424 2 160 918
Performance and other bonuses 1 965 988 2 036 167
Long-service awards 185 945 120 715
Other employee related costs 667 458 597 017
Total Employee Related Costs 41 293 655 42 734 965
There were no advances to employees
Remuneration of the Municipal Manager
Annual Remuneration 929 083 683 141
Performance- and other bonuses 113 703 -
Travel, motor car, accommodation, subsistence and other allowances 249 805 276 486
Contributions to UIF, Medical and Pension Funds 92 599 174 327
Total 1 385 190 1 133 954
The post for Municipal Manager was vacant since April 2012.
Remuneration of the Chief Finance Officer
Annual Remuneration 747 518 708 242
Performance- and other bonuses - - Travel, motor car, accommodation, subsistence and other allowances 334 856 318 368
Contributions to UIF, Medical and Pension Funds 1 497 -
Total 1 083 872 1 026 610
Remuneration of Individual Executive DirectorsTechnical Services
Corporate Services
Community Services
R R R
2012
Annual Remuneration 582 360 - 588 917
Performance- and other bonuses - - -
Travel, motor car, accommodation, subsistence and other allowances 404 953 - 238 884
Contributions to UIF, Medical and Pension Funds 160 983 - 154 188
Total 1 148 296 - 981 989
49
2012 2011
R R
Maquassi Hills Local Municipality
NOTES TO THE FINANANCIAL STATEMENTS
for the year ended 30 June 2012
Technical Services
Corporate Services
Community Services
R R R
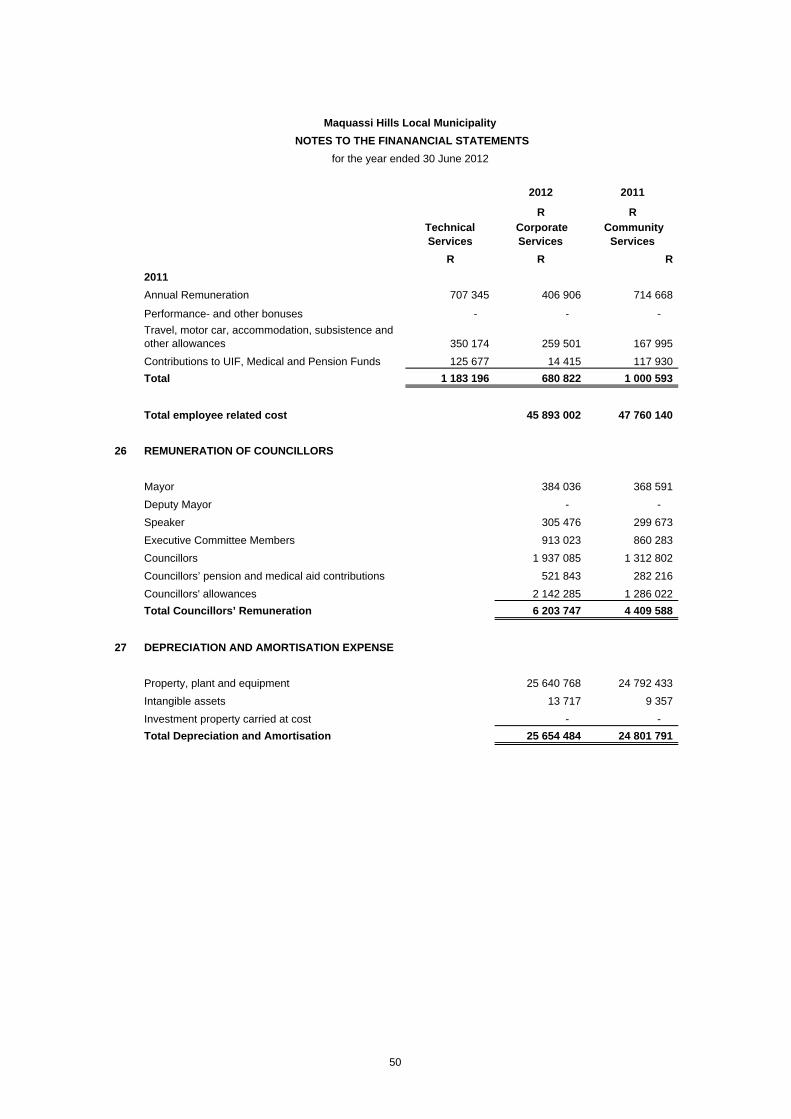
2011
Annual Remuneration 707 345 406 906 714 668
Performance- and other bonuses - - -
Travel, motor car, accommodation, subsistence and other allowances 350 174 259 501 167 995
Contributions to UIF, Medical and Pension Funds 125 677 14 415 117 930
Total 1 183 196 680 822 1 000 593
Total employee related cost 45 893 002 47 760 140
26 REMUNERATION OF COUNCILLORS
Mayor 384 036 368 591
Deputy Mayor - -
Speaker 305 476 299 673
Executive Committee Members 913 023 860 283
Councillors 1 937 085 1 312 802
Councillors’ pension and medical aid contributions 521 843 282 216
Councillors' allowances 2 142 285 1 286 022
Total Councillors’ Remuneration 6 203 747 4 409 588
27 DEPRECIATION AND AMORTISATION EXPENSE
Property, plant and equipment 25 640 768 24 792 433
Intangible assets 13 717 9 357
Investment property carried at cost - -
Total Depreciation and Amortisation 25 654 484 24 801 791
50
2012 2011
R R
Maquassi Hills Local Municipality
NOTES TO THE FINANANCIAL STATEMENTS
for the year ended 30 June 2012
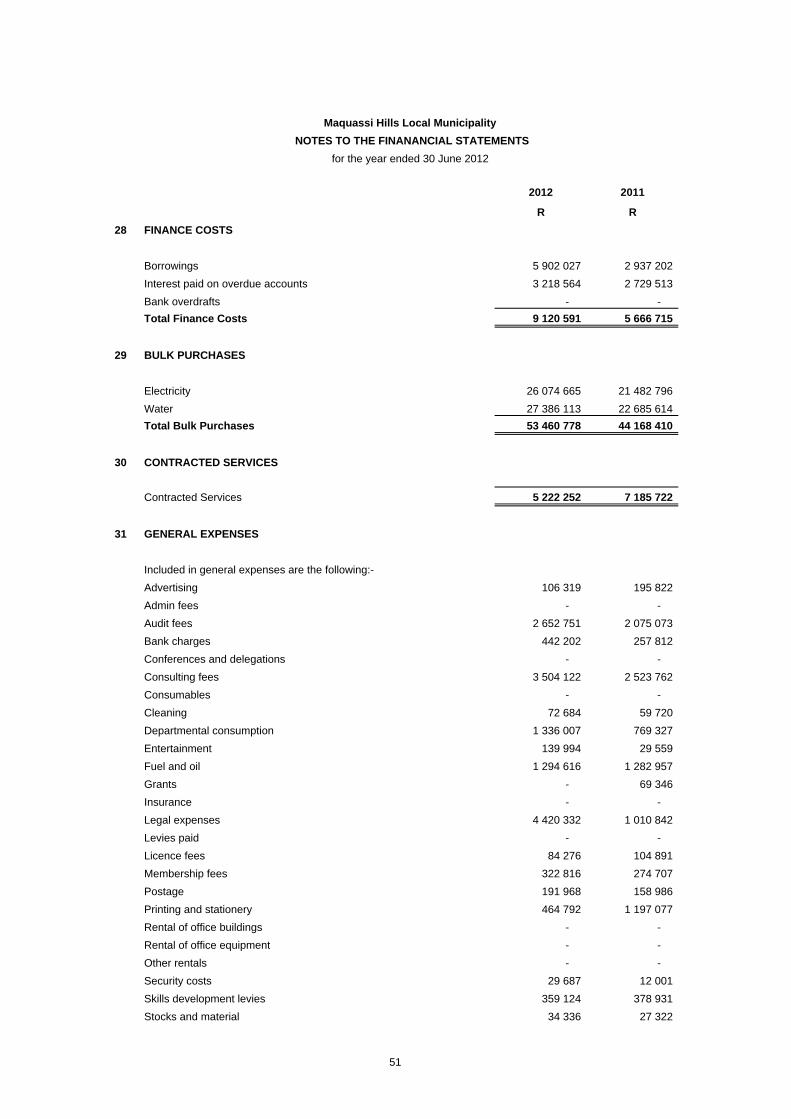
28 FINANCE COSTS
Borrowings 5 902 027 2 937 202
Interest paid on overdue accounts 3 218 564 2 729 513
Bank overdrafts - -
Total Finance Costs 9 120 591 5 666 715
29 BULK PURCHASES
Electricity 26 074 665 21 482 796
Water 27 386 113 22 685 614
Total Bulk Purchases 53 460 778 44 168 410
30 CONTRACTED SERVICES
Contracted Services 5 222 252 7 185 722
31 GENERAL EXPENSES
Included in general expenses are the following:-
Advertising 106 319 195 822
Admin fees - -
Audit fees 2 652 751 2 075 073
Bank charges 442 202 257 812
Conferences and delegations - -
Consulting fees 3 504 122 2 523 762
Consumables - -
Cleaning 72 684 59 720
Departmental consumption 1 336 007 769 327
Entertainment 139 994 29 559
Fuel and oil 1 294 616 1 282 957
Grants - 69 346
Insurance - -
Legal expenses 4 420 332 1 010 842
Levies paid - -
Licence fees 84 276 104 891
Membership fees 322 816 274 707
Postage 191 968 158 986
Printing and stationery 464 792 1 197 077
Rental of office buildings - -
Rental of office equipment - -
Other rentals - -
Security costs 29 687 12 001
Skills development levies 359 124 378 931
Stocks and material 34 336 27 322
51
2012 2011
R R
Maquassi Hills Local Municipality
NOTES TO THE FINANANCIAL STATEMENTS
for the year ended 30 June 2012
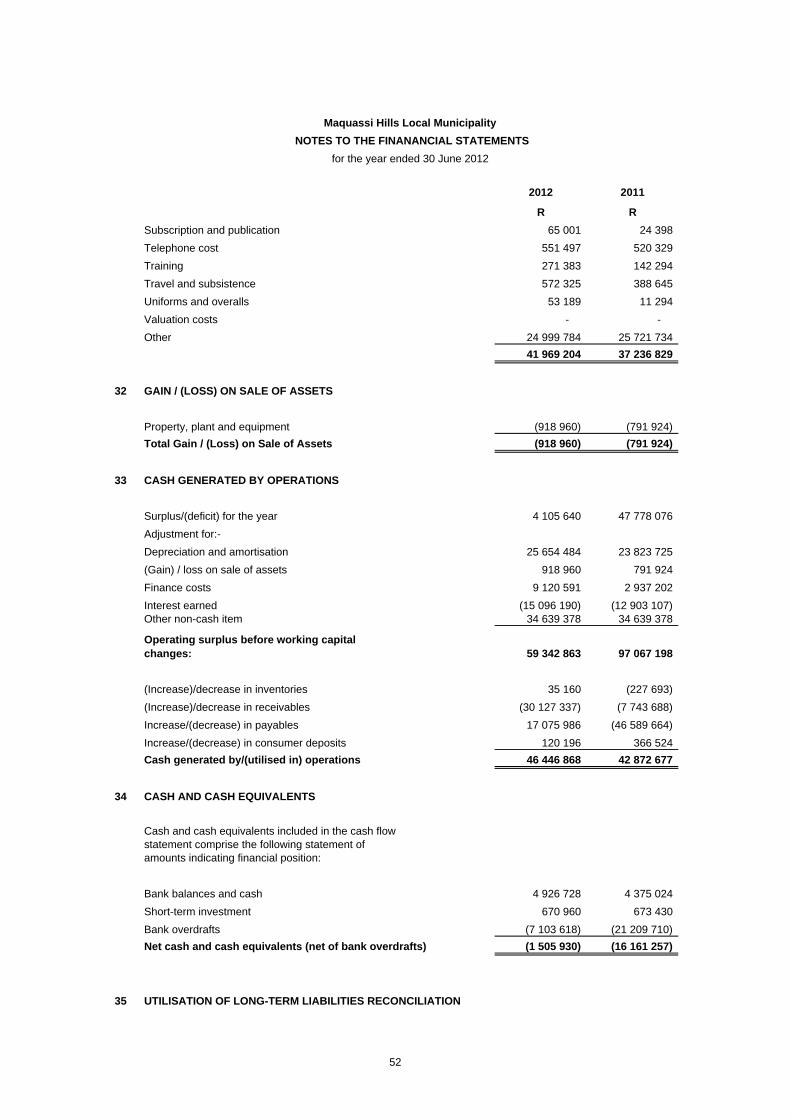
Subscription and publication 65 001 24 398
Telephone cost 551 497 520 329
Training 271 383 142 294
Travel and subsistence 572 325 388 645
Uniforms and overalls 53 189 11 294
Valuation costs - -
Other 24 999 784 25 721 734
41 969 204 37 236 829
32 GAIN / (LOSS) ON SALE OF ASSETS
Property, plant and equipment (918 960) (791 924)
Total Gain / (Loss) on Sale of Assets (918 960) (791 924)
33 CASH GENERATED BY OPERATIONS
Surplus/(deficit) for the year 4 105 640 47 778 076
Adjustment for:-
Depreciation and amortisation 25 654 484 23 823 725
(Gain) / loss on sale of assets 918 960 791 924
Finance costs 9 120 591 2 937 202
Interest earned (15 096 190) (12 903 107) Other non-cash item 34 639 378 34 639 378
Operating surplus before working capital changes: 59 342 863 97 067 198
(Increase)/decrease in inventories 35 160 (227 693)
(Increase)/decrease in receivables (30 127 337) (7 743 688)
Increase/(decrease) in payables 17 075 986 (46 589 664)
Increase/(decrease) in consumer deposits 120 196 366 524
Cash generated by/(utilised in) operations 46 446 868 42 872 677
34 CASH AND CASH EQUIVALENTS
Cash and cash equivalents included in the cash flow statement comprise the following statement of amounts indicating financial position:
Bank balances and cash 4 926 728 4 375 024
Short-term investment 670 960 673 430
Bank overdrafts (7 103 618) (21 209 710)
Net cash and cash equivalents (net of bank overdrafts) (1 505 930) (16 161 257)
35 UTILISATION OF LONG-TERM LIABILITIES RECONCILIATION
52
2012 2011
R R
Maquassi Hills Local Municipality
NOTES TO THE FINANANCIAL STATEMENTS
for the year ended 30 June 2012
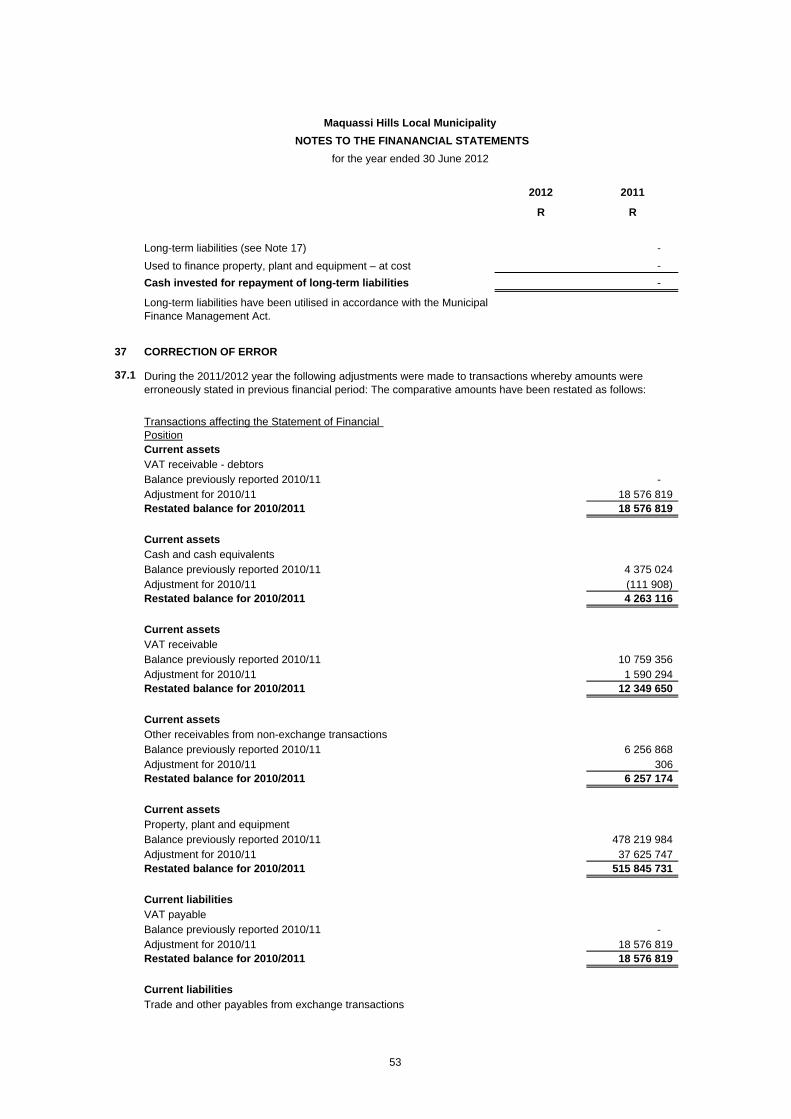
Long-term liabilities (see Note 17) -
Used to finance property, plant and equipment – at cost -
Cash invested for repayment of long-term liabilities -
37 CORRECTION OF ERROR
37.1
Transactions affecting the Statement of Financial PositionCurrent assetsVAT receivable - debtorsBalance previously reported 2010/11 - Adjustment for 2010/11 18 576 819 Restated balance for 2010/2011 18 576 819
Current assetsCash and cash equivalentsBalance previously reported 2010/11 4 375 024 Adjustment for 2010/11 (111 908) Restated balance for 2010/2011 4 263 116
Current assetsVAT receivable Balance previously reported 2010/11 10 759 356 Adjustment for 2010/11 1 590 294 Restated balance for 2010/2011 12 349 650
Current assetsOther receivables from non-exchange transactionsBalance previously reported 2010/11 6 256 868 Adjustment for 2010/11 306 Restated balance for 2010/2011 6 257 174
Current assetsProperty, plant and equipmentBalance previously reported 2010/11 478 219 984 Adjustment for 2010/11 37 625 747 Restated balance for 2010/2011 515 845 731
Current liabilitiesVAT payableBalance previously reported 2010/11 - Adjustment for 2010/11 18 576 819 Restated balance for 2010/2011 18 576 819
Current liabilitiesTrade and other payables from exchange transactions
During the 2011/2012 year the following adjustments were made to transactions whereby amounts were erroneously stated in previous financial period: The comparative amounts have been restated as follows:
Long-term liabilities have been utilised in accordance with the Municipal Finance Management Act.
53
2012 2011
R R
Maquassi Hills Local Municipality
NOTES TO THE FINANANCIAL STATEMENTS
for the year ended 30 June 2012
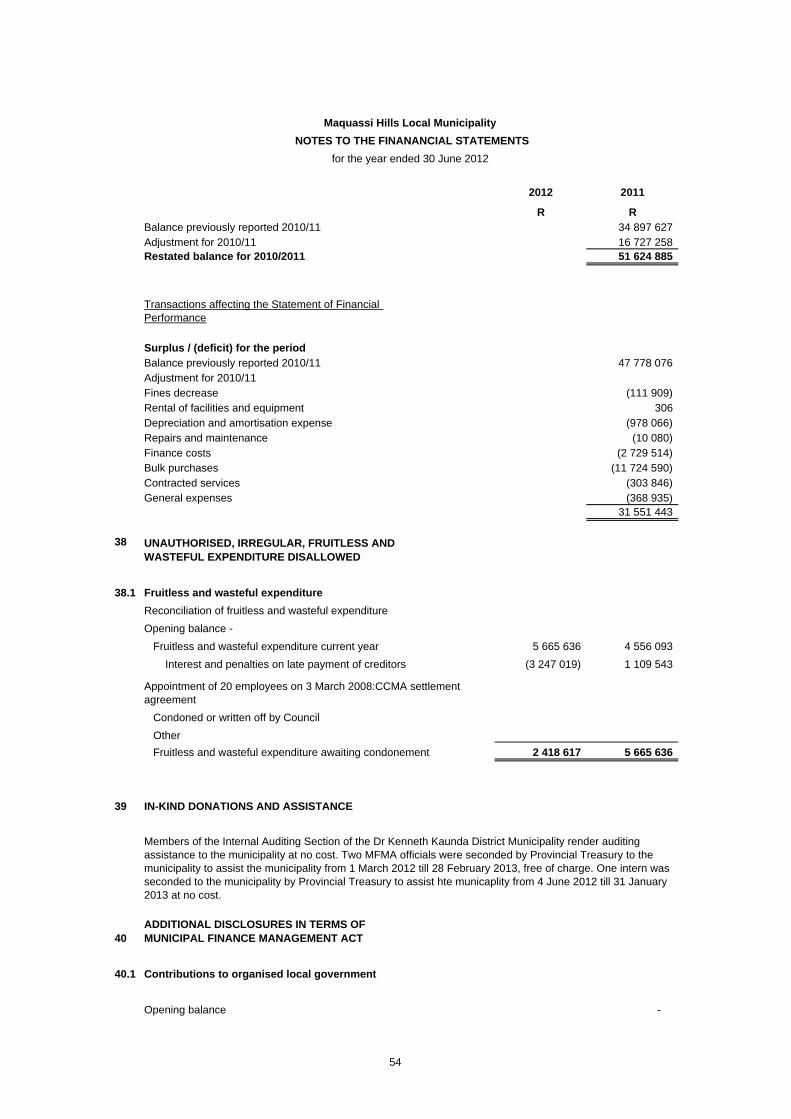
Balance previously reported 2010/11 34 897 627 Adjustment for 2010/11 16 727 258 Restated balance for 2010/2011 51 624 885
Transactions affecting the Statement of Financial Performance
Surplus / (deficit) for the periodBalance previously reported 2010/11 47 778 076 Adjustment for 2010/11Fines decrease (111 909) Rental of facilities and equipment 306 Depreciation and amortisation expense (978 066) Repairs and maintenance (10 080) Finance costs (2 729 514) Bulk purchases (11 724 590) Contracted services (303 846) General expenses (368 935)
31 551 443
38 UNAUTHORISED, IRREGULAR, FRUITLESS AND WASTEFUL EXPENDITURE DISALLOWED
38.1 Fruitless and wasteful expenditure
Reconciliation of fruitless and wasteful expenditure
Opening balance -
Fruitless and wasteful expenditure current year 5 665 636 4 556 093
Interest and penalties on late payment of creditors (3 247 019) 1 109 543
Condoned or written off by Council
Other
Fruitless and wasteful expenditure awaiting condonement 2 418 617 5 665 636
39 IN-KIND DONATIONS AND ASSISTANCE
40ADDITIONAL DISCLOSURES IN TERMS OF MUNICIPAL FINANCE MANAGEMENT ACT
40.1 Contributions to organised local government
Opening balance -
Members of the Internal Auditing Section of the Dr Kenneth Kaunda District Municipality render auditing assistance to the municipality at no cost. Two MFMA officials were seconded by Provincial Treasury to the municipality to assist the municipality from 1 March 2012 till 28 February 2013, free of charge. One intern was seconded to the municipality by Provincial Treasury to assist hte municaplity from 4 June 2012 till 31 January 2013 at no cost.
Appointment of 20 employees on 3 March 2008:CCMA settlement agreement
54

2012 2011
R R
Maquassi Hills Local Municipality
NOTES TO THE FINANANCIAL STATEMENTS
for the year ended 30 June 2012
Council subscriptions - SALGA 108 667 108 667
Amount paid - current 108 667 108 667
Amount paid - previous years
Balance unpaid (included in payables) - -
55
2012 2011
R R
Maquassi Hills Local Municipality
NOTES TO THE FINANANCIAL STATEMENTS
for the year ended 30 June 2012
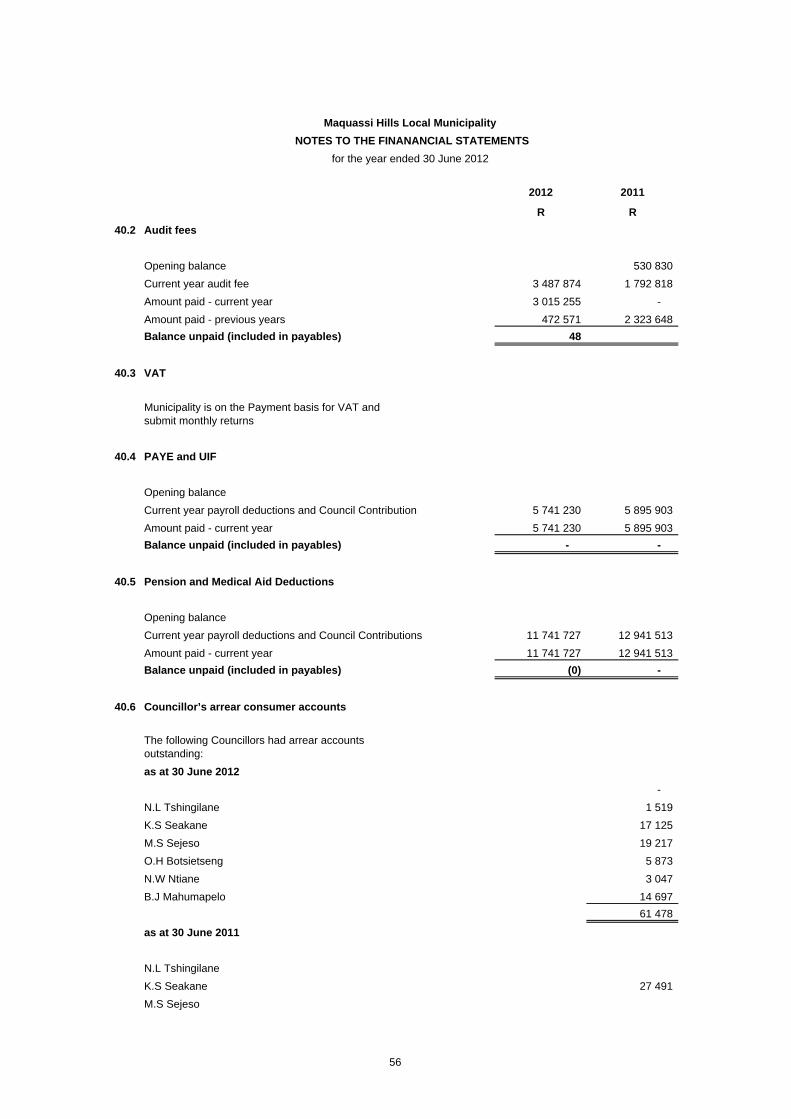
40.2 Audit fees
Opening balance 530 830
Current year audit fee 3 487 874 1 792 818
Amount paid - current year 3 015 255 -
Amount paid - previous years 472 571 2 323 648
Balance unpaid (included in payables) 48
40.3 VAT
Municipality is on the Payment basis for VAT and submit monthly returns
40.4 PAYE and UIF
Opening balance
Current year payroll deductions and Council Contribution 5 741 230 5 895 903
Amount paid - current year 5 741 230 5 895 903
Balance unpaid (included in payables) - -
40.5 Pension and Medical Aid Deductions
Opening balance
Current year payroll deductions and Council Contributions 11 741 727 12 941 513
Amount paid - current year 11 741 727 12 941 513
Balance unpaid (included in payables) (0) -
40.6 Councillor’s arrear consumer accounts
The following Councillors had arrear accounts outstanding:
as at 30 June 2012
-
N.L Tshingilane 1 519
K.S Seakane 17 125
M.S Sejeso 19 217
O.H Botsietseng 5 873
N.W Ntiane 3 047
B.J Mahumapelo 14 697
61 478
as at 30 June 2011
N.L Tshingilane
K.S Seakane 27 491
M.S Sejeso
56

2012 2011
R R
Maquassi Hills Local Municipality
NOTES TO THE FINANANCIAL STATEMENTS
for the year ended 30 June 2012
O.H Botsietseng 7 014
N.W Ntiane 1 202
B.J Mahumapelo 31 351
67 057
57

2012 2011
R R
Maquassi Hills Local Municipality
NOTES TO THE FINANANCIAL STATEMENTS
for the year ended 30 June 2012
41 CAPITAL COMMITMENTS
Commitments in respect of capital expenditure
- Approved and contracted for 38 493 089 87 165 295
Infrastructure 35 249 237 86 637 795
Community 3 243 852 140 000
Heritage
Other - 387 500
- Approved but not yet contracted for 9 152 116 2 214 916
Infrastructure 4 829 865 1 767 000
Community 3 070 800 50 000
Heritage
Other 1 251 451 397 916
Total 47 645 205 89 380 211
This expenditure will be financed from:
- External Loans - -
- MIG 30 444 877 42 857 292
- DBSA - -
- Government Grants 4 200 345 13 192 500
- Own resources 7 099 983 31 530 419
- District Council Grants 5 900 000 1 800 000
47 645 205 89 380 211
42 LEASE LIABILITY
Municipality as Lessee
Operating Leases: Office equipment
Present value of minimum lease
payments
Straightlined present value of minimum lease
payments
Amounts payable under operating leases
30 June 2012
Within one year 381 634 341 367
Within two to five years 86 732 77 859
After 5 years - -
468 366 419 226
The funder: District Muicipality was directly responsible for the procurment of relevant assets and all contracts and procurement documentation are done and with the District Municipality. Maquassi Hills Local Municipality was only the beneficiary
58
2012 2011
R R
Maquassi Hills Local Municipality
NOTES TO THE FINANANCIAL STATEMENTS
for the year ended 30 June 2012
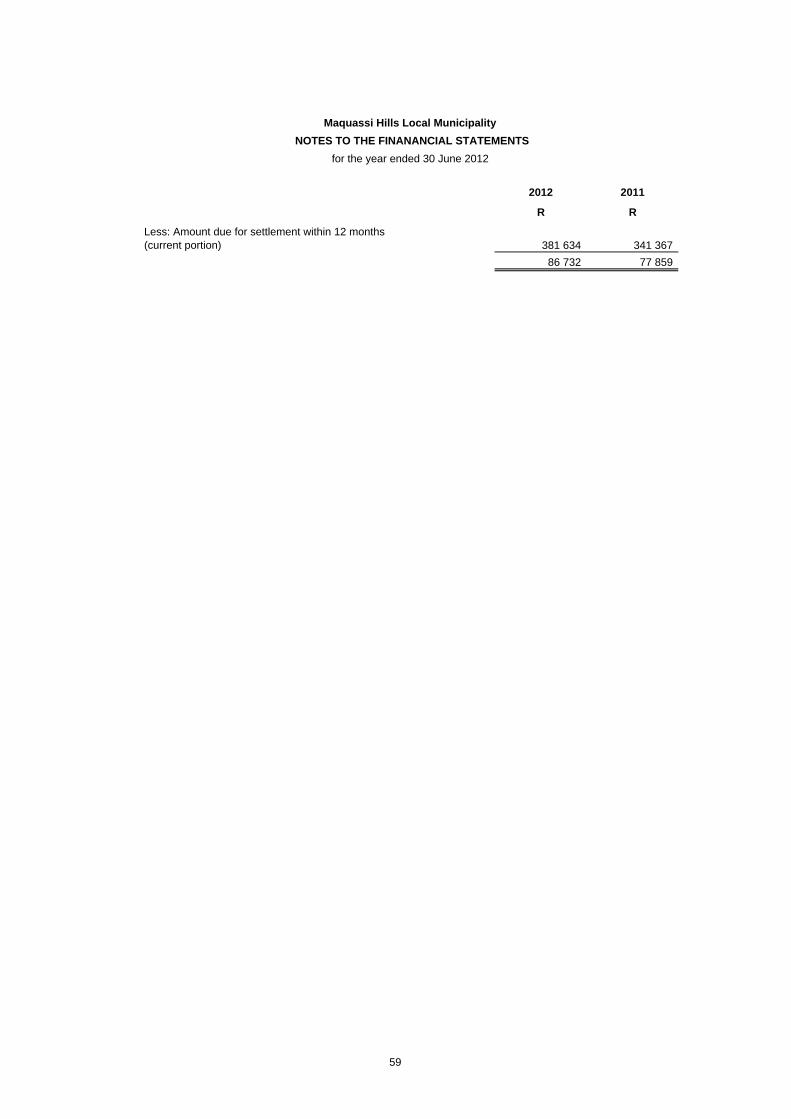
Less: Amount due for settlement within 12 months (current portion) 381 634 341 367
86 732 77 859
59
2012 2011
R R
Maquassi Hills Local Municipality
NOTES TO THE FINANANCIAL STATEMENTS
for the year ended 30 June 2012
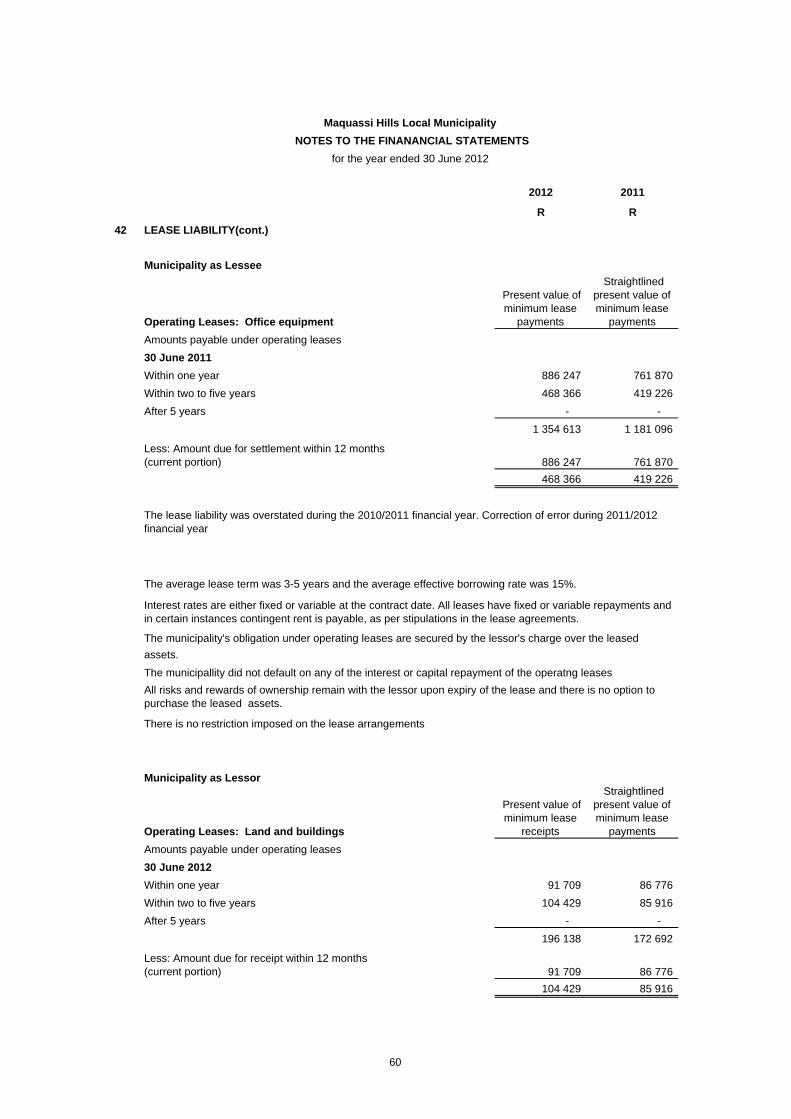
42 LEASE LIABILITY(cont.)
Municipality as Lessee
Operating Leases: Office equipment
Present value of minimum lease
payments
Straightlined present value of minimum lease
payments
Amounts payable under operating leases
30 June 2011
Within one year 886 247 761 870
Within two to five years 468 366 419 226
After 5 years - -
1 354 613 1 181 096
Less: Amount due for settlement within 12 months (current portion) 886 247 761 870
468 366 419 226
Municipality as Lessor
Operating Leases: Land and buildings
Present value of minimum lease
receipts
Straightlined present value of minimum lease
payments
Amounts payable under operating leases
30 June 2012
Within one year 91 709 86 776
Within two to five years 104 429 85 916
After 5 years - -
196 138 172 692
Less: Amount due for receipt within 12 months (current portion) 91 709 86 776
104 429 85 916
The municipality's obligation under operating leases are secured by the lessor's charge over the leased
There is no restriction imposed on the lease arrangements
assets.
The municipallity did not default on any of the interest or capital repayment of the operatng leases
All risks and rewards of ownership remain with the lessor upon expiry of the lease and there is no option to purchase the leased assets.
The lease liability was overstated during the 2010/2011 financial year. Correction of error during 2011/2012 financial year
The average lease term was 3-5 years and the average effective borrowing rate was 15%.
Interest rates are either fixed or variable at the contract date. All leases have fixed or variable repayments and in certain instances contingent rent is payable, as per stipulations in the lease agreements.
60
2012 2011
R R
Maquassi Hills Local Municipality
NOTES TO THE FINANANCIAL STATEMENTS
for the year ended 30 June 2012
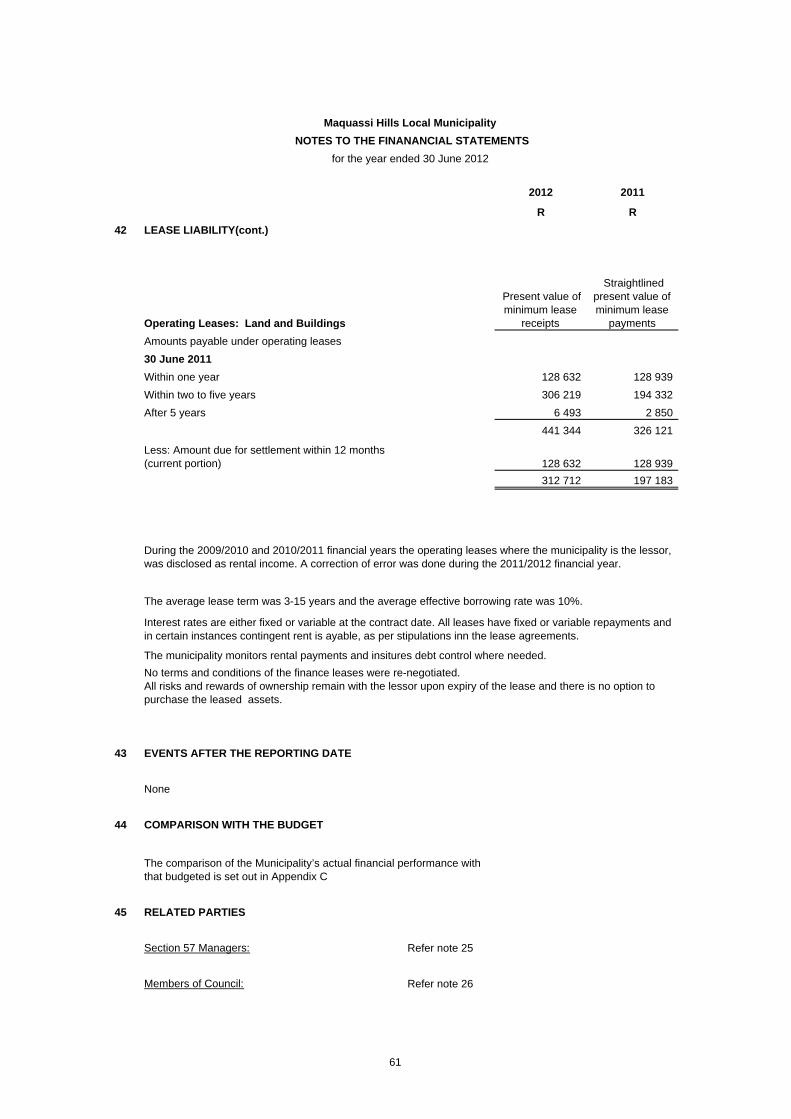
42 LEASE LIABILITY(cont.)
Operating Leases: Land and Buildings
Present value of minimum lease
receipts
Straightlined present value of minimum lease
payments
Amounts payable under operating leases
30 June 2011
Within one year 128 632 128 939
Within two to five years 306 219 194 332
After 5 years 6 493 2 850
441 344 326 121
Less: Amount due for settlement within 12 months (current portion) 128 632 128 939
312 712 197 183
43 EVENTS AFTER THE REPORTING DATE
None
44 COMPARISON WITH THE BUDGET
45 RELATED PARTIES
Section 57 Managers: Refer note 25
Members of Council: Refer note 26
The comparison of the Municipality’s actual financial performance with that budgeted is set out in Appendix C
No terms and conditions of the finance leases were re-negotiated.
The municipality monitors rental payments and insitures debt control where needed.
The average lease term was 3-15 years and the average effective borrowing rate was 10%.
Interest rates are either fixed or variable at the contract date. All leases have fixed or variable repayments and in certain instances contingent rent is ayable, as per stipulations inn the lease agreements.
All risks and rewards of ownership remain with the lessor upon expiry of the lease and there is no option to purchase the leased assets.
During the 2009/2010 and 2010/2011 financial years the operating leases where the municipality is the lessor, was disclosed as rental income. A correction of error was done during the 2011/2012 financial year.
61
2012 2011
R R
Maquassi Hills Local Municipality
NOTES TO THE FINANANCIAL STATEMENTS
for the year ended 30 June 2012
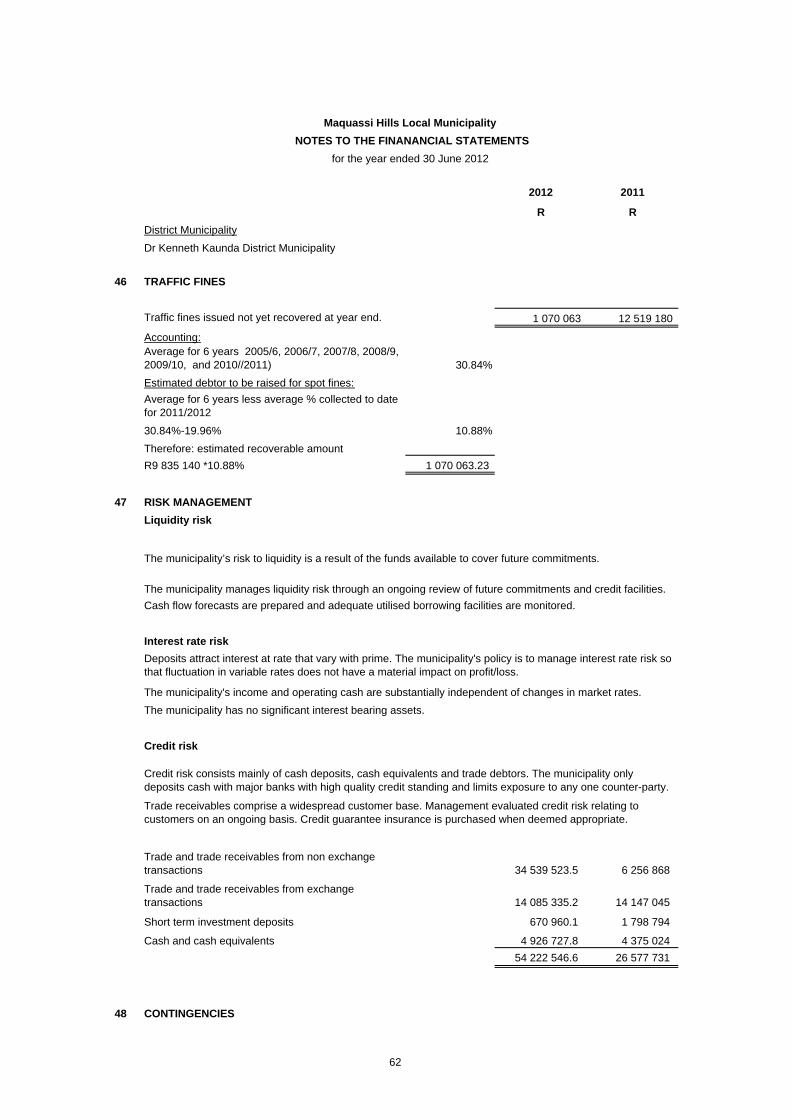
District Municipality
Dr Kenneth Kaunda District Municipality
46 TRAFFIC FINES
Traffic fines issued not yet recovered at year end. 1 070 063 12 519 180
Accounting:Average for 6 years 2005/6, 2006/7, 2007/8, 2008/9, 2009/10, and 2010//2011) 30.84%
Estimated debtor to be raised for spot fines:
Average for 6 years less average % collected to date for 2011/2012
30.84%-19.96% 10.88%
Therefore: estimated recoverable amount
R9 835 140 *10.88% 1 070 063.23
47 RISK MANAGEMENT
Liquidity risk
Interest rate risk
Credit risk
Trade and trade receivables from non exchange transactions 34 539 523.5 6 256 868
Trade and trade receivables from exchange transactions 14 085 335.2 14 147 045
Short term investment deposits 670 960.1 1 798 794
Cash and cash equivalents 4 926 727.8 4 375 024
54 222 546.6 26 577 731
48 CONTINGENCIES
The municipality has no significant interest bearing assets.
The municipality’s risk to liquidity is a result of the funds available to cover future commitments.
The municipality manages liquidity risk through an ongoing review of future commitments and credit facilities.
Cash flow forecasts are prepared and adequate utilised borrowing facilities are monitored.
Trade receivables comprise a widespread customer base. Management evaluated credit risk relating to customers on an ongoing basis. Credit guarantee insurance is purchased when deemed appropriate.
Credit risk consists mainly of cash deposits, cash equivalents and trade debtors. The municipality only deposits cash with major banks with high quality credit standing and limits exposure to any one counter-party.
Deposits attract interest at rate that vary with prime. The municipality's policy is to manage interest rate risk so that fluctuation in variable rates does not have a material impact on profit/loss.
The municipality's income and operating cash are substantially independent of changes in market rates.
62

2012 2011
R R
Maquassi Hills Local Municipality
NOTES TO THE FINANANCIAL STATEMENTS
for the year ended 30 June 2012
Contingent liability
Request for representation from legal council regarding litigation and claims
49 WORLD CUP EXPENDITURE
2010 FIFA world cup expenditure for the year:
Number of tickets acquired -
Publicity costs, security expenses, entertainments, meals, travelling and accommodation expense none
Total none -
52 EMPLOYEE BENEFITS
Post-employment Health Care Benefits
Opening accrued liability 12 877 400 11 534 171
Current-service cost 750 864 687 510
Interest Cost 1 167 826 1 045 323
Contributions (benefits paid) (417 915) (389 604)
Total annual expense 1 500 775 1 343 229
Actuarial loss / gain 4 757 064
Closing accrued liability 19 135 239 12 877 400
The Projected Unit Credit Method has been used to value the liabilities
Key assumptions
Key financial assumptions
Assumption 2 012 2 011
Discount rate 8.07% 9.22%
Health care host inflation rate 7.10% 7.27%
Net effective discount rate 90.00% 1.82%
Key demographic assumptions
Assumption 2 012 2 011
Average retirement age 60 60
Continuation of membership at retirement 90% 90%
Proportion assumed married at retirement 90% 90%
Proportion of eligible current non-member employee joining the scheme by retirement 20% 20%
Mortality during employment SA 85 - 90 SA 85 - 90
Mortality post retirement PA90-1 PA90-1
Withdrawal from service (sample annual rates) Age Females Males
20 24.00% 16.00%
30 15.00% 10.00%
40 6.00% 6.00%
50 2.00% 2.00%
>55 0.00% 0.00%
20 24.00%
2011/2012
63
2012 2011
R R
Maquassi Hills Local Municipality
NOTES TO THE FINANANCIAL STATEMENTS
for the year ended 30 June 2012
30
40
50
>55
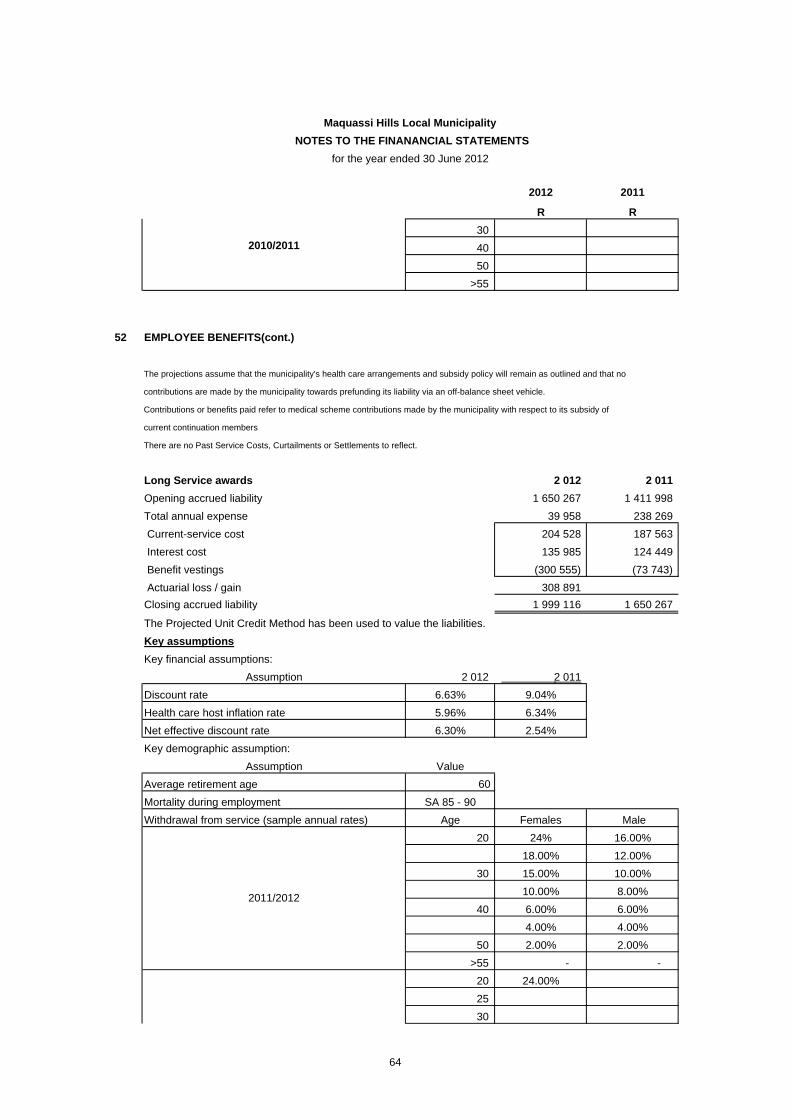
52 EMPLOYEE BENEFITS(cont.)
The projections assume that the municipality's health care arrangements and subsidy policy will remain as outlined and that no
contributions are made by the municipality towards prefunding its liability via an off-balance sheet vehicle.
Contributions or benefits paid refer to medical scheme contributions made by the municipality with respect to its subsidy of
current continuation members
There are no Past Service Costs, Curtailments or Settlements to reflect.
Long Service awards 2 012 2 011
Opening accrued liability 1 650 267 1 411 998
Total annual expense 39 958 238 269
Current-service cost 204 528 187 563
Interest cost 135 985 124 449
Benefit vestings (300 555) (73 743)
Actuarial loss / gain 308 891
Closing accrued liability 1 999 116 1 650 267
The Projected Unit Credit Method has been used to value the liabilities.
Key assumptions
Key financial assumptions:
Assumption 2 012 2 011
Discount rate 6.63% 9.04%
Health care host inflation rate 5.96% 6.34%
Net effective discount rate 6.30% 2.54%
Key demographic assumption:
Assumption Value
Average retirement age 60
Mortality during employment SA 85 - 90
Withdrawal from service (sample annual rates) Age Females Male
20 24% 16.00%
18.00% 12.00%
30 15.00% 10.00%
10.00% 8.00%
40 6.00% 6.00%
4.00% 4.00%
50 2.00% 2.00%
>55 - -
20 24.00%
25
30
2010/2011
2011/2012
64

2012 2011
R R
Maquassi Hills Local Municipality
NOTES TO THE FINANANCIAL STATEMENTS
for the year ended 30 June 2012
35
40
45
50
55
The projections assume that the LSA arrangements will remain as outlined and that all the actuarial assumptions made are borne
out of practice. In addition, it is assumed that no contributions are made by the Employer towards prefunding its liability via an
off-balance sheet vehicle.
There are no Past Service Costs, Curtailments or Settlements to reflect.
Full detail of actuarial valuation is available.
54 WATER DISTRIBUTION LOSS
Distribution losses relate to unaccounted for water. These losses mainly arise from illigal connections, errors in billing,bridging of meters by consumers and ageing infrastructure. The total percentage loss for water is 47.67% (36.97 % for 2011) The total percentage loss for electricity is 14.0%.
2010/2011
65

Maquassi Hills Local MunicipalitySTATEMENT OF CHANGES IN NET ASSETS
for the year ended 30 June 2012
Government Grant Reserve
Capitalisation Reserve
Capital Replacement Reserve
Housing Development Fund Total: Reserves
Accumulated Surplus/(Deficit) Total: Net Assets Total: Net Assets
Note R R R R R R R R
Balance at 30 June 2010 344 154 469 510 962 - 667 131 345 332 562 (10 271 956) 335 060 606 (10 271 956) Changes in accounting policy 36 - - - Correction of prior period error 37 - (8 592 042) (8 592 042) (17 184 083) Restated balance 344 154 469 510 962 - 667 131 345 332 562 (18 863 998) 326 468 564 (18 863 998) Surplus / (deficit) on revaluation of property of property, plant and equipment - - - Property plant and equipment purchases 58 870 284 (3 043 516) 55 826 768 (55 826 768) - (55 826 768) Depreciation (18 019 941) (50 667) (18 070 609) 18 070 609 - 18 070 609 Sale of asset (790 583) (790 583) 790 583 - 790 583 Depreciation on sale of asset - - - - Net gains and losses not recognised in the statement of financial performance - - - - Adjustment accumulated surplus/(deficit)-employee benefits - - Transfers to / from accumulated surplus/(deficit) 3 043 516 3 043 516 (3 043 516) - (3 043 516) Surplus / (deficit) for the period - 31 551 442 31 551 444 31 551 442 Balance at 30 June 2011 384 214 229 460 295 - 667 131 385 341 654 (27 321 647) 358 020 009 (27 321 647) Surplus / (deficit) on revaluation of property of property, plant and equipment - - - Property plant and equipment purchases 31 260 227 (12 475 558) 18 784 669 (18 784 669) - (18 784 669) Depreciation (19 002 586) (50 667) (19 053 253) 19 053 253 - 19 053 253 Sale of asset (905 437) (905 437) 905 437 - 905 437 Depreciation on sale of asset - - - Net gains and losses not recognised in the statement of financial performance - - - Transfers to / from accumulated surplus/(deficit) 12 475 558 12 475 558 (12 475 558) - (12 475 558) Surplus / (deficit) for the period - 4 105 643 4 105 643 4 105 643 Balance at 30 June 2012 395 566 432 409 628 - 667 131 396 643 190 (34 517 540) 362 125 652 (34 517 540)
7

8

Note 2012 2011R R
CASH FLOWS FROM OPERATING ACTIVITIESReceipts 289 649 820 289 649 820
Sales of goods and services 54 980 367 54 980 367 Grants 107 661 242 122 505 803 Interest received 670 220 681 038 Other receipts 126 337 992 111 482 612
Payments 252 960 532 246 777 143 Employee costs 52 169 728 52 169 728 Suppliers 191 670 213 191 670 213 Interest paid 9 120 591 2 937 202
Net cash flows from operating activities 33 36 689 288 42 872 677
CASH FLOWS FROM INVESTING ACTIVITIESPurchase of fixed assets (14 380 811) (84 095 507)
Proceeds from sale of fixed assets - - Net cash flows from investing activities (14 380 811) (84 095 507)
CASH FLOWS FROM FINANCING ACTIVITIESProceeds from borrowings - 4 730 631 Repayment of borrowings (1 095 267) (8 567 027) Net cash flows from financing activities (1 095 267) (3 836 396)
Net increase / (decrease) in net cash and cash equivalents 21 213 210 (45 059 225) Net cash and cash equivalents at beginning of period (16 161 256) 28 897 969 Net cash and cash equivalents at end of period 34 5 051 954 (16 161 256)
Maquassi Hills Local MunicipalityCASH FLOW STATEMENT
for the year ended 30 June 2012
8
9
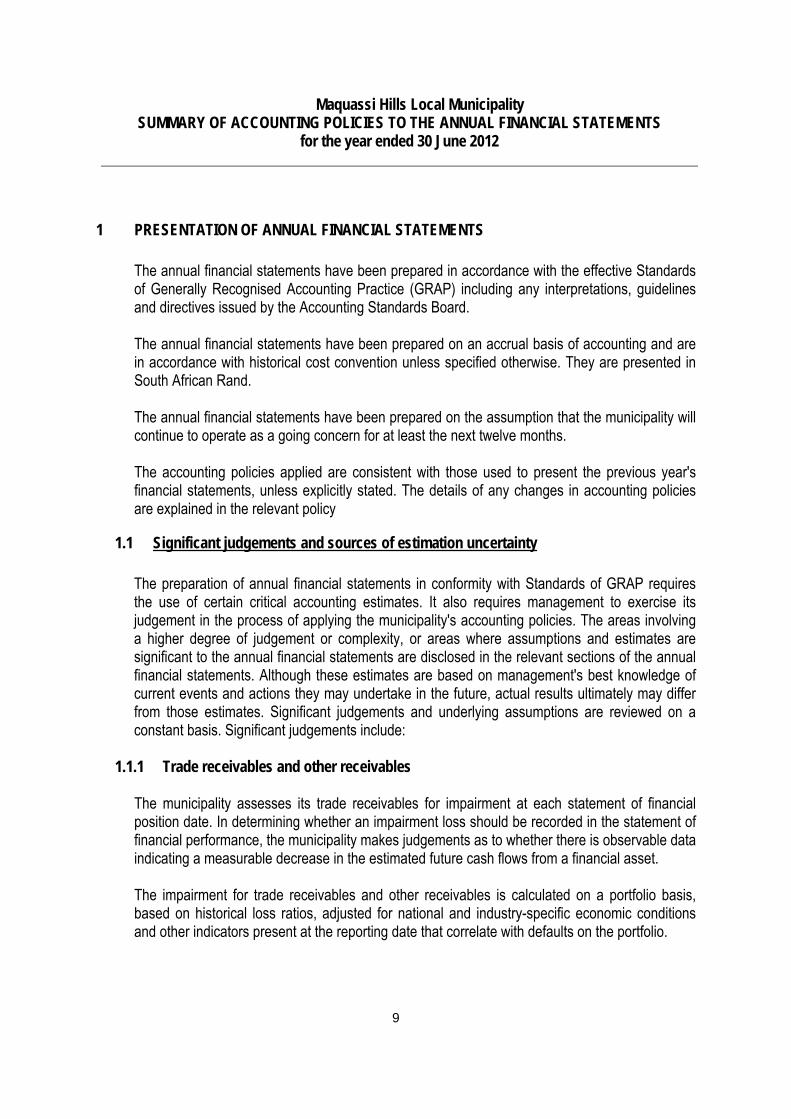
Maquassi Hills Local Municipality SUMMARY OF ACCOUNTING POLICIES TO THE ANNUAL FINANCIAL STATEMENTS
for the year ended 30 June 2012
1 PRESENTATION OF ANNUAL FINANCIAL STATEMENTS The annual financial statements have been prepared in accordance with the effective Standards of Generally Recognised Accounting Practice (GRAP) including any interpretations, guidelines and directives issued by the Accounting Standards Board.
The annual financial statements have been prepared on an accrual basis of accounting and are in accordance with historical cost convention unless specified otherwise. They are presented in South African Rand. The annual financial statements have been prepared on the assumption that the municipality will continue to operate as a going concern for at least the next twelve months. The accounting policies applied are consistent with those used to present the previous year's financial statements, unless explicitly stated. The details of any changes in accounting policies are explained in the relevant policy
1.1 Significant judgements and sources of estimation uncertainty
The preparation of annual financial statements in conformity with Standards of GRAP requires the use of certain critical accounting estimates. It also requires management to exercise its judgement in the process of applying the municipality's accounting policies. The areas involving a higher degree of judgement or complexity, or areas where assumptions and estimates are significant to the annual financial statements are disclosed in the relevant sections of the annual financial statements. Although these estimates are based on management's best knowledge of current events and actions they may undertake in the future, actual results ultimately may differ from those estimates. Significant judgements and underlying assumptions are reviewed on a constant basis. Significant judgements include:
1.1.1 Trade receivables and other receivables The municipality assesses its trade receivables for impairment at each statement of financial position date. In determining whether an impairment loss should be recorded in the statement of financial performance, the municipality makes judgements as to whether there is observable data indicating a measurable decrease in the estimated future cash flows from a financial asset. The impairment for trade receivables and other receivables is calculated on a portfolio basis, based on historical loss ratios, adjusted for national and industry-specific economic conditions and other indicators present at the reporting date that correlate with defaults on the portfolio.
10
1.1.2 Available-for-sale financial assets
In determining whether available-for-sale assets need to be impaired, significant judgement is necessary. In making this judgement, the municipality evaluates, among other factors, the duration and extent to which the fair value of an investment is less than its cost; and the financial health of and near-term business outlook for the investee, including factors such as industry and sector performance, changes in technology and operational and financing cash flow.
1.1.3 Allowance for slow moving, damaged and obsolete stock
An allowance to write stock down to the lower of cost or net realisable value. Management has made estimates of the selling price and direct cost to self on certain inventory items. The write down is included in the operation surplus note.
1.1.4 Fair value estimation
The municipality uses a variety of methods and makes assumptions that are based on market conditions existing at the end of each reporting period. Quoted market prices or dealer quotes for similar instruments are used for long-term debt The carrying value less impairment provision of trade receivables and payables are assumed to approximate their fair values. The fair value of financial liabilities for disclosure purposes is estimated by discounting the future contractual cash flows at the current market interest rate that is available to the municipality for similar financial instruments.
1.1.5 Impairment testing The recoverable amounts of cash-generating units and individual assets have been determined based on the higher of value-in-use calculations and fair values less costs to sell. These calculations require the use of estimates and assumptions. It is reasonably possible that the fair value assumption may change which may then impact our estimations and may then require a material adjustment to the carrying value of goodwill and tangible assets. The Municipality reviews and tests the carrying value of assets when events or changes in circumstances suggest that the carrying amount may not be recoverable. Assets are grouped at the lowest level for which identifiable cash flows are largely independent of cash flows of other assets and liabilities. If there are indications that impairment may have occurred, estimates are prepared of expected future cash flows for each group of assets. Expected future cash flows used to determine the value in use of goodwill and tangible assets are inherently uncertain and could materially change over time.
1.1.6 Provisions
Provisions were raised and management determined an estimate based on the information available.
Provisions are measured at management’s best estimate of the expenditure required to settle the obligation at the reporting date, and are discounted to present value where the effect is material.
11
Provisions (cont.) Assumptions were used in determining the provision for rehabilitation of landfill sites. Landfill areas are rehabilitated over years and assumptions were made that the areas may stay the same in size for a number of years. The increase in the restoration provision due to passage of time is recognised as borrowing cost in the statement of financial performance. The estimates are discounted at a pre-tax discount rate that reflects current market assessments of the time value of money
1.1.7 Contingencies Contingencies recognised in the current year required estimates and judgements. Additional disclosure of these contingencies is included in the relevant note.
1.1.8 Allowance for credit losses
On trade and other receivables an impairment loss is recognised in surplus and deficit when there is objective evidence that it is impaired. The impairment is measured as the difference between the carrying amount and the present value of estimated future cash flows computed at initial recognition.
1.1.9 Effective interest rate
The municipality uses the interest rate utilised by the municipality for any respective month when performing billing, which rate is prime plus 1% to discount future cash flows.
1.1.10 Post-retirement benefits
The present value of the post retirement obligation depends on a number of factors that are determined on an actuarial basis using a number of assumptions. The assumptions used in determining the net cost (income) include the discount rate. Any changes in these assumptions will impact on the carrying amount of post retirement obligations. The municipality determines the appropriate discount rate at the end of each year. This is the interest rate that should be used to determine the present value of estimated future cash outflows expected to be required to settle the pension obligations. In determining the appropriate discount rate, the municipality considers the interest rates of high-quality corporate bonds that are denominated in the currency in which the benefits will be paid, and that have terms to maturity approximating the terms of the related pension liability. Other key assumptions for pension obligations are based on current market conditions.
1.2 Investment property
Investment property is property (land or a building - or part of a building - or both) held to earn rentals or for capital appreciation or both, rather than for:
• use in the production or supply of goods or services or for • administrative purposes, or • sale in the ordinary course of operations

12
Investment Property (cont.) Investment property is recognised as an asset when, it is probable that the future economic benefits or service potential that are associated with the investment property will flow to the municipality, and the cost or fair value of the investment property can be measured reliably.
Investment property is recognised at fair value. The fair value of investment property reflects market conditions at the reporting date.
Fair value is determined by a certified property valuer on an annual basis.
A gain or loss arising from a change in fair value is included in net surplus or deficit for the period in which it arises.
If the fair value of investment property under construction is not determinable, it is measured at cost until the earlier of the date it becomes determinable or construction is complete.
Where investment property is acquired at no cost or for a nominal cost, its cost is its fair value as at the date of acquisition.
If the fair value of investment property under construction is not determinable, it is measured at cost until the earlier of the date it becomes determinable or construction is complete.
Compensation from third parties for investment property that was impaired, lost or given up is recognised in surplus or deficit when the compensation becomes receivable
1.3 Property, plant and equipment
Property, plant and equipment are tangible non-current assets (including infrastructure assets) that are held for use in the production or supply of goods or services, are owner-occupied and are expected to be used during more than one period.
Property, plant and equipment are recognised as an asset when:
• It is probable that future economic benefits or service potential associated with the item will flow to the municipality; and
• The cost of the item can be measured reliably.
Property, plant and equipment are measured at cost, less accumulated depreciation and any impairment losses.. Land is not depreciated as it is deemed to have an indefinite life.
The cost of an item of property, plant and equipment acquired in exchange for a non-monetary asset, or a combination of monetary and non-monetary assets is measured at its fair value. If the acquired item could not be measured at its fair value; its cost is measured at the carrying amount of the asset given up. The cost of an item of property, plant and equipment comprises of its purchase price, including other costs attributable to bring the asset to the location and condition necessary for it to be
13
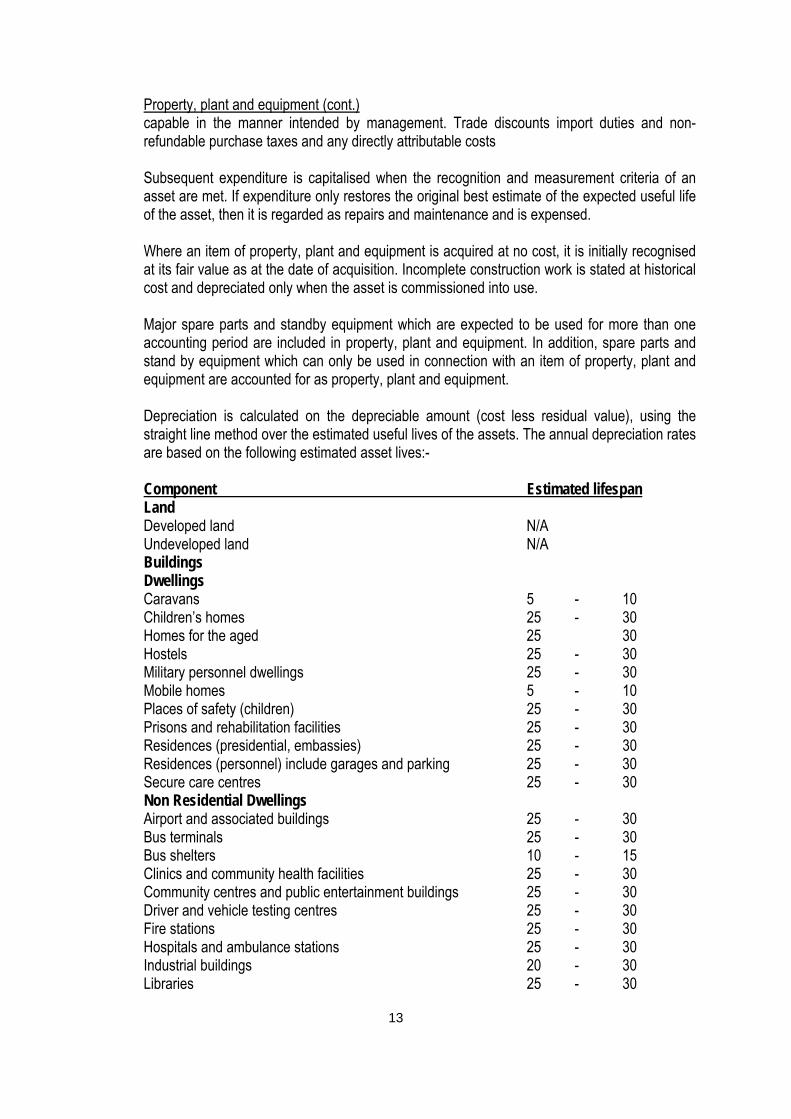
Property, plant and equipment (cont.) capable in the manner intended by management. Trade discounts import duties and non-refundable purchase taxes and any directly attributable costs
Subsequent expenditure is capitalised when the recognition and measurement criteria of an asset are met. If expenditure only restores the original best estimate of the expected useful life of the asset, then it is regarded as repairs and maintenance and is expensed. Where an item of property, plant and equipment is acquired at no cost, it is initially recognised at its fair value as at the date of acquisition. Incomplete construction work is stated at historical cost and depreciated only when the asset is commissioned into use. Major spare parts and standby equipment which are expected to be used for more than one accounting period are included in property, plant and equipment. In addition, spare parts and stand by equipment which can only be used in connection with an item of property, plant and equipment are accounted for as property, plant and equipment. Depreciation is calculated on the depreciable amount (cost less residual value), using the straight line method over the estimated useful lives of the assets. The annual depreciation rates are based on the following estimated asset lives:- Component Estimated lifespan Land Developed land N/A Undeveloped land N/A Buildings Dwellings Caravans 5 - 10 Children’s homes 25 - 30 Homes for the aged 25 30 Hostels 25 - 30 Military personnel dwellings 25 - 30 Mobile homes 5 - 10 Places of safety (children) 25 - 30 Prisons and rehabilitation facilities 25 - 30 Residences (presidential, embassies) 25 - 30 Residences (personnel) include garages and parking 25 - 30 Secure care centres 25 - 30 Non Residential Dwellings Airport and associated buildings 25 - 30 Bus terminals 25 - 30 Bus shelters 10 - 15 Clinics and community health facilities 25 - 30 Community centres and public entertainment buildings 25 - 30 Driver and vehicle testing centres 25 - 30 Fire stations 25 - 30 Hospitals and ambulance stations 25 - 30 Industrial buildings 20 - 30 Libraries 25 - 30

14
Mortuaries 25 - 30 Office buildings (including air conditioning systems) 25 - 30 Public parking (covered and open) 25 - 30 Stadiums 25 - 30 Taxi ranks 10 - 15 Warehouses (storage facilities, including data) 25 - 30 Other Structures (Infrastructure Assets) Electricity Cooling towers 25 - 30 Mains 15 - 20 Meters Prepaid 10 - 20 Credit 20 - 25 Power stations Coal 50 - 60 Supply/reticulation 15 - 25 Transformers 25 - 60 Lines Underground 25 - 45 Overhead 20 - 30 Cables 25 - 45 Substations 20 - 60 Switchgear 20 - 30 Outdoor 20 - 30 GIS 15 - 30 Indoor 30 - 40 Electrical panels 3 - 5 Telemetry 7 - 15 Roads (Roads, Pavements, Bridges & Storm Water) Bridges Bridges - Concrete 60 - 80 Bridges – Steel 40 - 50 Bridges - Timber 25 - 40 Pedestrian Bridges - Concrete 60 - 80 Bridges – Steel 40 - 50 Bridges – Timber 25 - 40 Reinforced retaining walls Earth 10 - 15 Concrete 25 - 30 Expansion and construction joints 15 - 20 Storm Water Culverts 25 - 40 Concrete 40 - 60 Armco 25 - 40 Drains Earthworks 80 - 100 Concrete lining 25 - 50
15
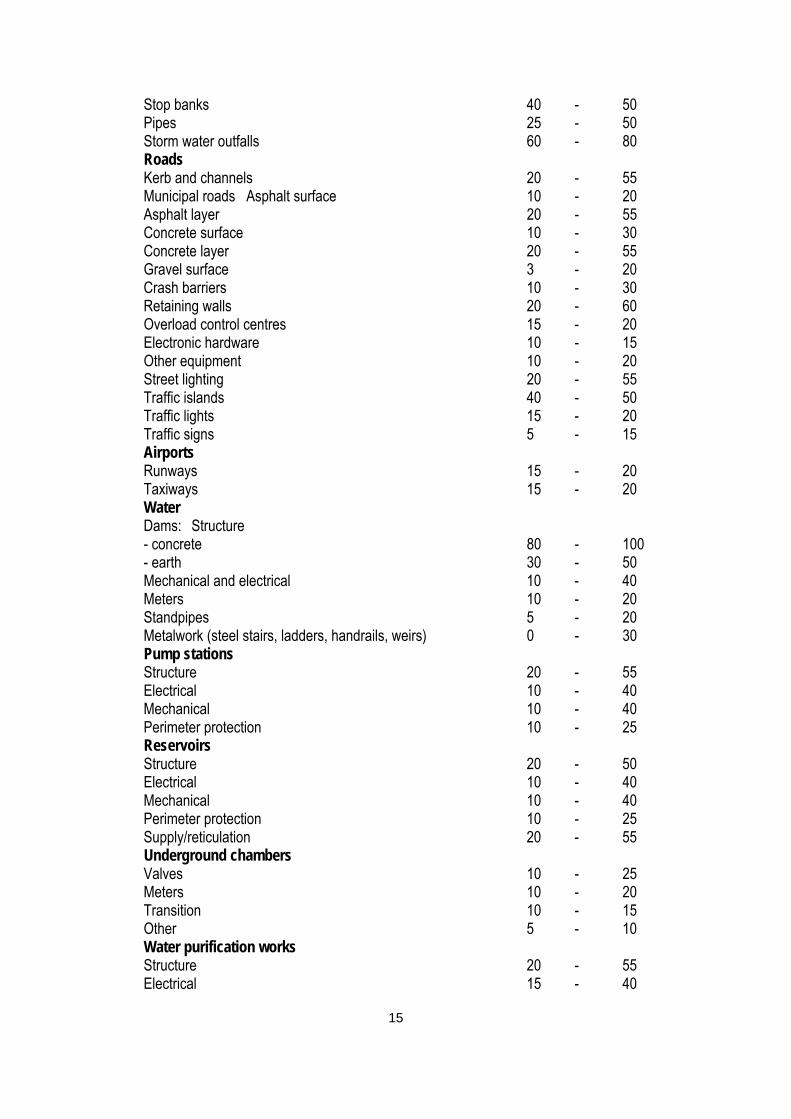
Stop banks 40 - 50 Pipes 25 - 50 Storm water outfalls 60 - 80 Roads Kerb and channels 20 - 55 Municipal roads Asphalt surface 10 - 20 Asphalt layer 20 - 55 Concrete surface 10 - 30 Concrete layer 20 - 55 Gravel surface 3 - 20 Crash barriers 10 - 30 Retaining walls 20 - 60 Overload control centres 15 - 20 Electronic hardware 10 - 15 Other equipment 10 - 20 Street lighting 20 - 55 Traffic islands 40 - 50 Traffic lights 15 - 20 Traffic signs 5 - 15 Airports Runways 15 - 20 Taxiways 15 - 20 Water Dams: Structure - concrete 80 - 100 - earth 30 - 50 Mechanical and electrical 10 - 40 Meters 10 - 20 Standpipes 5 - 20 Metalwork (steel stairs, ladders, handrails, weirs) 0 - 30 Pump stations Structure 20 - 55 Electrical 10 - 40 Mechanical 10 - 40 Perimeter protection 10 - 25 Reservoirs Structure 20 - 50 Electrical 10 - 40 Mechanical 10 - 40 Perimeter protection 10 - 25 Supply/reticulation 20 - 55 Underground chambers Valves 10 - 25 Meters 10 - 20 Transition 10 - 15 Other 5 - 10 Water purification works Structure 20 - 55 Electrical 15 - 40
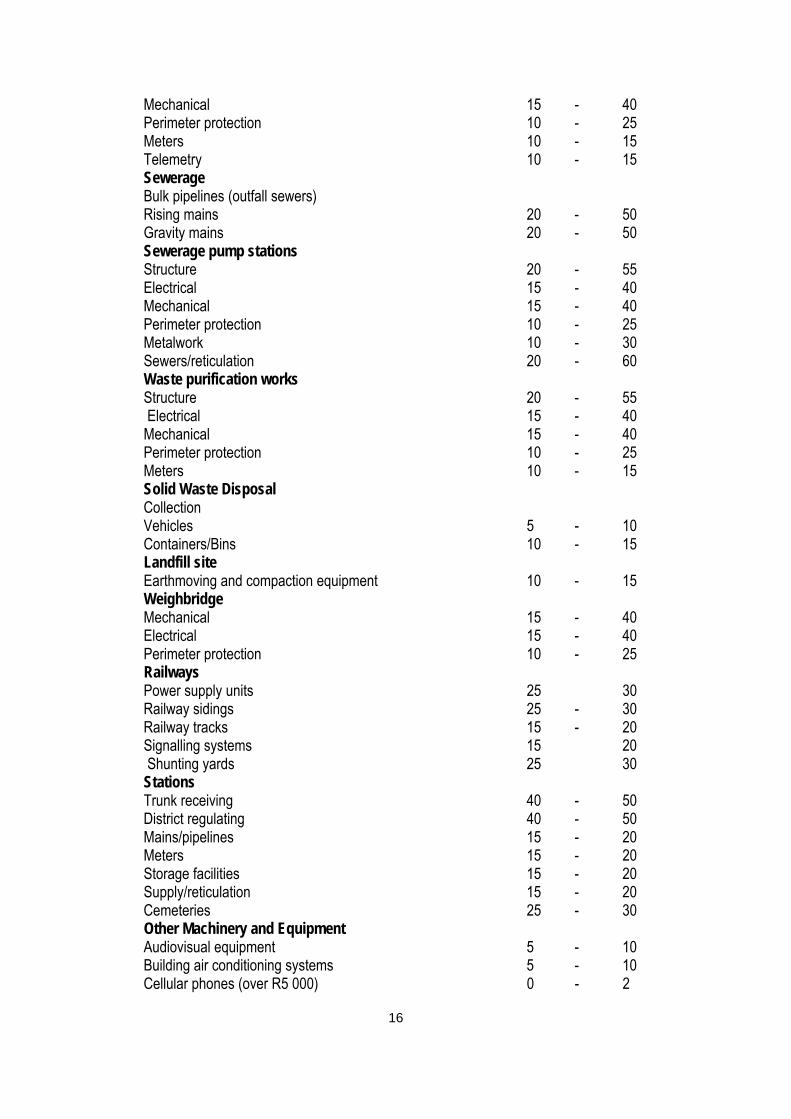
16
Mechanical 15 - 40 Perimeter protection 10 - 25 Meters 10 - 15 Telemetry 10 - 15 Sewerage Bulk pipelines (outfall sewers) Rising mains 20 - 50 Gravity mains 20 - 50 Sewerage pump stations Structure 20 - 55 Electrical 15 - 40 Mechanical 15 - 40 Perimeter protection 10 - 25 Metalwork 10 - 30 Sewers/reticulation 20 - 60 Waste purification works Structure 20 - 55 Electrical 15 - 40 Mechanical 15 - 40 Perimeter protection 10 - 25 Meters 10 - 15 Solid Waste Disposal Collection Vehicles 5 - 10 Containers/Bins 10 - 15 Landfill site Earthmoving and compaction equipment 10 - 15 Weighbridge Mechanical 15 - 40 Electrical 15 - 40 Perimeter protection 10 - 25 Railways Power supply units 25 30 Railway sidings 25 - 30 Railway tracks 15 - 20 Signalling systems 15 20 Shunting yards 25 30 Stations Trunk receiving 40 - 50 District regulating 40 - 50 Mains/pipelines 15 - 20 Meters 15 - 20 Storage facilities 15 - 20 Supply/reticulation 15 - 20 Cemeteries 25 - 30 Other Machinery and Equipment Audiovisual equipment 5 - 10 Building air conditioning systems 5 - 10 Cellular phones (over R5 000) 0 - 2

17
Cellular routers 3 - 5 Domestic equipment (non kitchen appliances)) 3 - 5 Electric wire and power distribution equipment (compressors, generators & allied equipment) 5 - 7 Emergency/rescue equipment 5 - 10 Elevator systems 15 - 20 Farm/Agricultural equipment 5 - 15 Fire Fighting equipment 3 - 5 Fencing 5 - 25 Gardening equipment 2 - 4 Irrigation equipment 10 - 15 Kitchen appliances 5 - 10 Laboratory equipment - Agricultural 5 - 7
- Medical testing 5 - 7 - Roads and transport 5 - 7
Laundry equipment and industrial sewing machines 10 - 15 Learning, training support and library material 5 - 10 Machines for metallurgy 5 - 10 Machines for mining and quarrying 5 - 10 Machines for textile production 10 - 15 Medical and allied equipment 5 - 10 Music instruments 10 - 15 Photographic equipment 5 - 10 Pumps, plumbing, purification and sanitation equipment 5 - 10 Radio equipment 5 - 7 Road construction and maintenance equipment 10 - 15 Saddles and other tack 5 - 7 Security equipment/systems/ materials - Fixed 3 - 5 - Movable 3 - 5 Sport and recreational equipment 5 - 10 Survey equipment 5 - 7 Telecommunication equipment 3 - 10 Tents, flags and accessories 5 - 10 Woodworking machinery and equipment 5 - 10 Workshop equipment and loose tools - Fixed 5 - 10 - Movable 3 - 5 Furniture And Office Equipment Advertising boards 3 - 5 Air conditioners (individual fixed & portable) 3 - 5 Cutlery and crockery 5 - 10 Domestic and hostel furniture 10 - 15 Linen and soft furnishings 5 - 10 Office equipment (including fax machines) 5 - 7 Office furniture 5 - 7 Paintings, sculptures, ornaments (home and office) 5 - 10 Computer Equipment Computer hardware including operating systems 3 - 5 Networks 5 - 10 Transport Assets
18
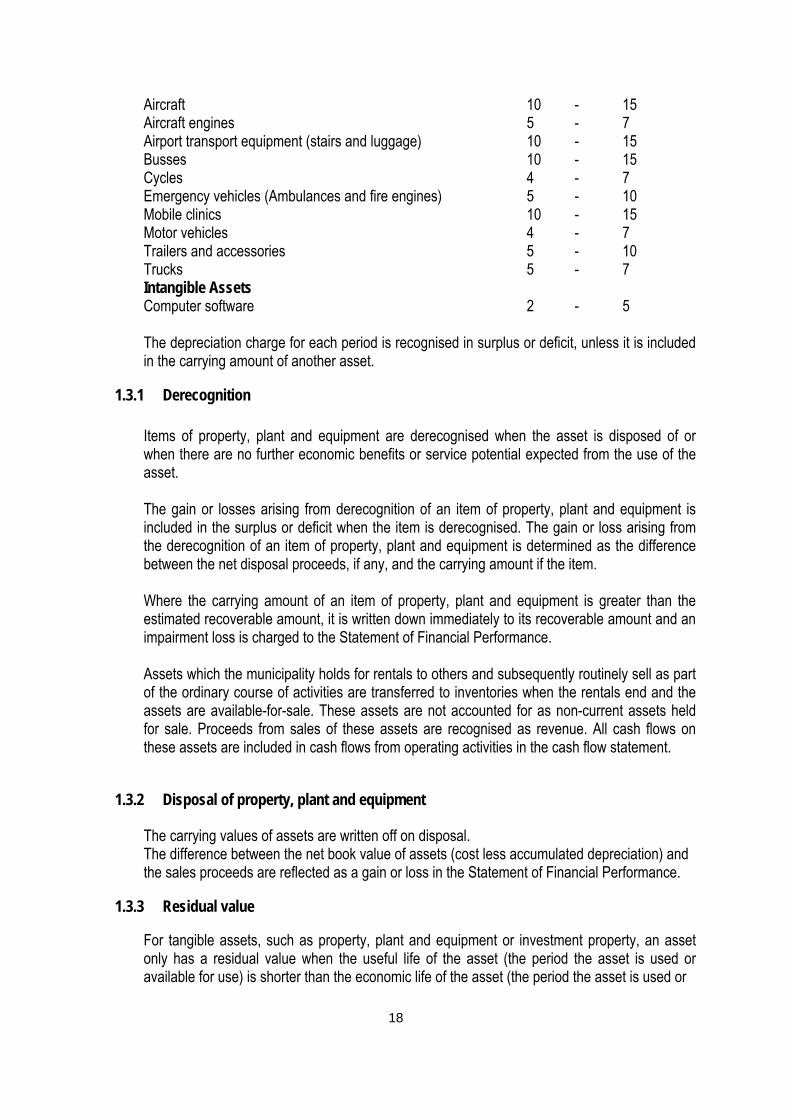
Aircraft 10 - 15 Aircraft engines 5 - 7 Airport transport equipment (stairs and luggage) 10 - 15 Busses 10 - 15 Cycles 4 - 7 Emergency vehicles (Ambulances and fire engines) 5 - 10 Mobile clinics 10 - 15 Motor vehicles 4 - 7 Trailers and accessories 5 - 10 Trucks 5 - 7 Intangible Assets Computer software 2 - 5
The depreciation charge for each period is recognised in surplus or deficit, unless it is included in the carrying amount of another asset.
1.3.1 Derecognition
Items of property, plant and equipment are derecognised when the asset is disposed of or when there are no further economic benefits or service potential expected from the use of the asset.
The gain or losses arising from derecognition of an item of property, plant and equipment is included in the surplus or deficit when the item is derecognised. The gain or loss arising from the derecognition of an item of property, plant and equipment is determined as the difference between the net disposal proceeds, if any, and the carrying amount if the item. Where the carrying amount of an item of property, plant and equipment is greater than the estimated recoverable amount, it is written down immediately to its recoverable amount and an impairment loss is charged to the Statement of Financial Performance. Assets which the municipality holds for rentals to others and subsequently routinely sell as part of the ordinary course of activities are transferred to inventories when the rentals end and the assets are available-for-sale. These assets are not accounted for as non-current assets held for sale. Proceeds from sales of these assets are recognised as revenue. All cash flows on these assets are included in cash flows from operating activities in the cash flow statement.
1.3.2 Disposal of property, plant and equipment
The carrying values of assets are written off on disposal. The difference between the net book value of assets (cost less accumulated depreciation) and the sales proceeds are reflected as a gain or loss in the Statement of Financial Performance.
1.3.3 Residual value
For tangible assets, such as property, plant and equipment or investment property, an asset only has a residual value when the useful life of the asset (the period the asset is used or available for use) is shorter than the economic life of the asset (the period the asset is used or
19
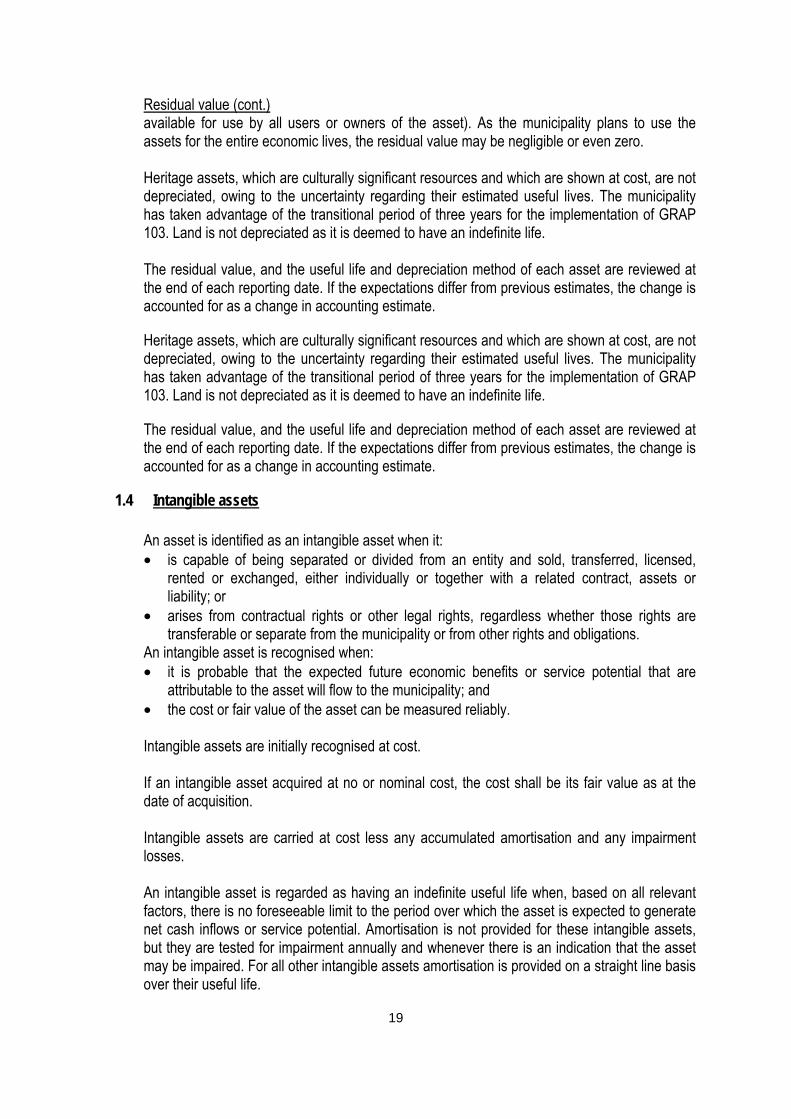
Residual value (cont.) available for use by all users or owners of the asset). As the municipality plans to use the assets for the entire economic lives, the residual value may be negligible or even zero. Heritage assets, which are culturally significant resources and which are shown at cost, are not depreciated, owing to the uncertainty regarding their estimated useful lives. The municipality has taken advantage of the transitional period of three years for the implementation of GRAP 103. Land is not depreciated as it is deemed to have an indefinite life.
The residual value, and the useful life and depreciation method of each asset are reviewed at the end of each reporting date. If the expectations differ from previous estimates, the change is accounted for as a change in accounting estimate.
Heritage assets, which are culturally significant resources and which are shown at cost, are not depreciated, owing to the uncertainty regarding their estimated useful lives. The municipality has taken advantage of the transitional period of three years for the implementation of GRAP 103. Land is not depreciated as it is deemed to have an indefinite life.
The residual value, and the useful life and depreciation method of each asset are reviewed at the end of each reporting date. If the expectations differ from previous estimates, the change is accounted for as a change in accounting estimate.
1.4 Intangible assets
An asset is identified as an intangible asset when it: • is capable of being separated or divided from an entity and sold, transferred, licensed,
rented or exchanged, either individually or together with a related contract, assets or liability; or
• arises from contractual rights or other legal rights, regardless whether those rights are transferable or separate from the municipality or from other rights and obligations.
An intangible asset is recognised when: • it is probable that the expected future economic benefits or service potential that are
attributable to the asset will flow to the municipality; and • the cost or fair value of the asset can be measured reliably.
Intangible assets are initially recognised at cost.
If an intangible asset acquired at no or nominal cost, the cost shall be its fair value as at the date of acquisition. Intangible assets are carried at cost less any accumulated amortisation and any impairment losses. An intangible asset is regarded as having an indefinite useful life when, based on all relevant factors, there is no foreseeable limit to the period over which the asset is expected to generate net cash inflows or service potential. Amortisation is not provided for these intangible assets, but they are tested for impairment annually and whenever there is an indication that the asset may be impaired. For all other intangible assets amortisation is provided on a straight line basis over their useful life.
20
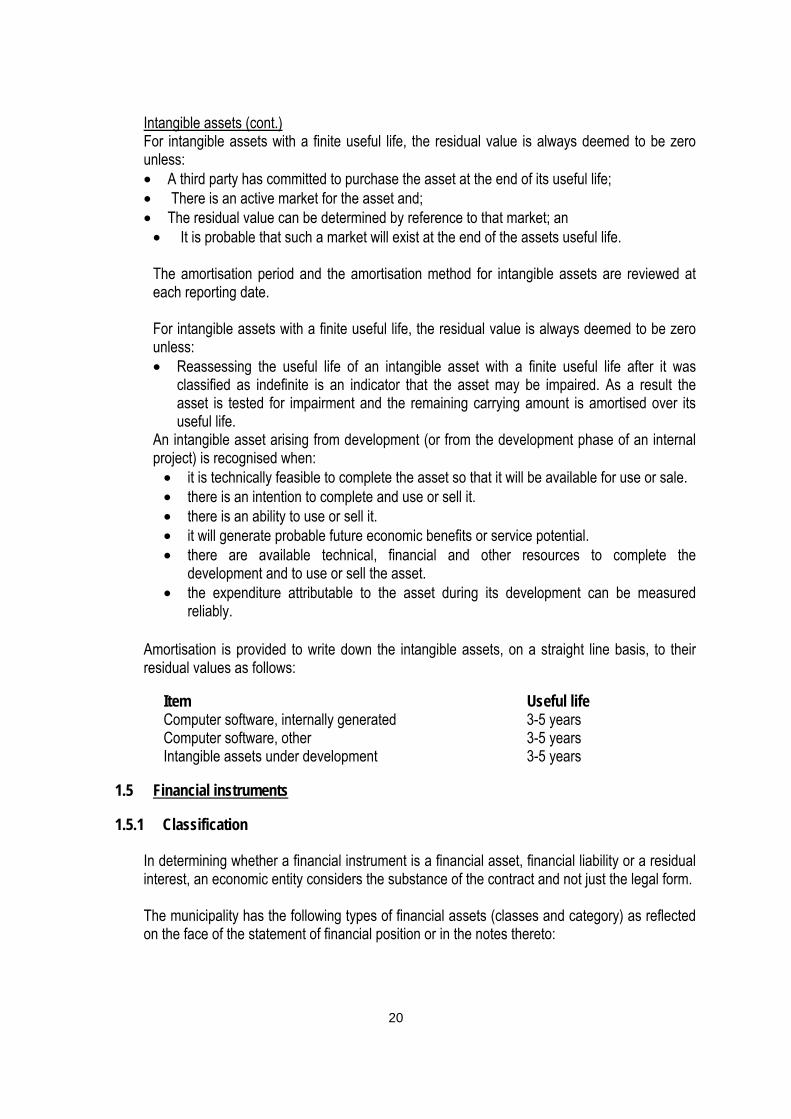
Intangible assets (cont.) For intangible assets with a finite useful life, the residual value is always deemed to be zero unless: • A third party has committed to purchase the asset at the end of its useful life; • There is an active market for the asset and; • The residual value can be determined by reference to that market; an
• It is probable that such a market will exist at the end of the assets useful life. The amortisation period and the amortisation method for intangible assets are reviewed at each reporting date.
For intangible assets with a finite useful life, the residual value is always deemed to be zero unless: • Reassessing the useful life of an intangible asset with a finite useful life after it was
classified as indefinite is an indicator that the asset may be impaired. As a result the asset is tested for impairment and the remaining carrying amount is amortised over its useful life.
An intangible asset arising from development (or from the development phase of an internal project) is recognised when:
• it is technically feasible to complete the asset so that it will be available for use or sale. • there is an intention to complete and use or sell it. • there is an ability to use or sell it. • it will generate probable future economic benefits or service potential. • there are available technical, financial and other resources to complete the
development and to use or sell the asset. • the expenditure attributable to the asset during its development can be measured
reliably.
Amortisation is provided to write down the intangible assets, on a straight line basis, to their residual values as follows:
Item Useful life Computer software, internally generated 3-5 years Computer software, other 3-5 years Intangible assets under development 3-5 years
1.5 Financial instruments
1.5.1 Classification
In determining whether a financial instrument is a financial asset, financial liability or a residual interest, an economic entity considers the substance of the contract and not just the legal form. The municipality has the following types of financial assets (classes and category) as reflected on the face of the statement of financial position or in the notes thereto:

21
Classification (cont.) Class Category Cash and cash equivalents Financial asset measured at amortised cost Trade and other receivables from non-exchange transactions Financial asset measured at amortised cost Consumer debtors Financial asset measured at amortised cost Long term receivables Financial asset measured at amortised cost The municipality has the following types of financial liabilities (classes and category) as reflected on the face of the statement of financial position or in the notes thereto: Class Category Borrowings Financial liability measured at amortised cost Trade and other payables Financial liability measured at amortised cost Consumer deposits Financial liability measured at fair value
1.5.2 Initial recognition and measurement
Financial assets and financial liabilities are initially recognised at fair value. Where an economic entity subsequently measures financial assets and financial liabilities at amortised cost or cost, transactions costs are included in the cost of the asset or liability. Financial assets and financial liabilities are subsequently measured either at fair value or, amortised cost or cost. A financial instrument is valued at fair value if it is: • a derivative; • a combined instrument designated at fair value, i.e. an instrument that includes a derivative
and a non-derivative host contract; • held-for-trading; • a non-derivative instrument with fixed or determinable payments that is designated at initial
recognition to be measured at fair value; • an investment in a residual interest for which fair value can be measured reliably; and • other instruments that do not meet the definition of financial instruments at amortised cost
or cost. A financial liability is derecognised when the obligation is extinguished. Exchanges of debt instruments between a borrower and a lender are treated as the extinguishment of an existing liability and the recognition of a new financial liability. Where an economic entity modifies the term of an existing financial liability, it is also treated as the extinguishment of an existing liability and the recognition of a new liability. A financial asset and financial liability are not offset ted in the statement of financial position unless a legal right of set-off exists, and the parties intend to settle on a net basis.
1.5.3 Impairment of financial assets
The municipality assesses at the end of each reporting period whether there is any objective evidence that a financial asset or group of financial assets is impaired.
22
1.5.3.1 Financial assets measured at amortised cost:
If there is objective evidence that an impairment loss on financial assets measured at amortised cost has been incurred, the amount of the loss is measured as the difference between the asset’s carrying amount and the present value of estimated future cash flows (excluding future credit losses that have not been incurred) discounted at the financial asset’s original effective interest rate. The carrying amount of the asset is reduced directly OR through the use of an allowance account. The amount of the loss is recognised in surplus or deficit. If, in a subsequent period, the amount of the impairment loss decreases and the decrease can be related objectively to an event occurring after the impairment was recognised, the previously recognised impairment loss is reversed directly OR by adjusting an allowance account. The reversal does not result in a carrying amount of the financial asset that exceeds what the amortised cost would have been had the impairment not been recognised at the date the impairment is reversed. The amount of the reversal is recognised in surplus or deficit.
1.5.3.2 Financial assets measured at cost: If there is objective evidence that an impairment loss has been incurred on an investment in a residual interest that is not measured at fair value because its fair value cannot be measured reliably, the amount of the impairment loss is measured as the difference between the carrying amount of the financial asset and the present value of estimated future cash flows discounted at the current market rate of return for a similar financial asset. Such impairment losses are not reversed. The municipality derecognises a financial asset when the contractual rights to the cash flows from the asset expire, or it transfers the rights to receive the contractual cash flows on the financial asset in a transaction in which substantially all the risks and rewards of ownership of the financial asset are transferred. Any interest in transferred financial assets that is created or retained by the municipality is recognised as a separate asset or liability The municipality classifies its non-derivative financial assets into the following categories: • Held-to-maturity financial assets; and • Loans and receivables.
1.5.4 Investments
Investments, fixed deposits and short-term deposits invested in registered commercial banks, are categorised as either held-to-maturity where the criteria for that categorisation are met, or as loans and receivables, and are measured at amortised cost
1.6 Trade and other receivables
1.6.1 Loans and receivables
Loans and receivables are financial assets with fixed or determinable payments that are not quoted in an active market. Such assets are recognised initially at fair value plus any directly attributable transaction costs. Subsequent to initial recognition, loans and receivables are measured at amortised cost using the effective interest method, less any impairment losses.
23
Loans and receivables (cont.) Appropriate allowances for estimated irrecoverable amounts are recognised in surplus or deficit when there is objective evidence that the asset is impaired. Significant financial difficulties of the debtor, probability that the debtor will enter bankruptcy or financial reorganization, and default or delinquency in payments are considered indicators that the trade receivable is impaired. The allowance recognised is measured as the difference between the asset's carrying amount and the present value of estimated future cash flows discounted at the effective interest rate computed at initial recognition
1.7 Trade and other payables
Trade payables are initially measured at fair value, and are subsequently measured at amortised cost, using the effective interest rate method.
1.8 Cash and cash equivalents
1.8.1 Bank overdraft and borrowings
Bank overdrafts and borrowings are initially measured at fair value, and are subsequently measured at amortised cost, using the effective interest rate method. Any difference between the proceeds (net of transaction costs) and the settlement or redemption of borrowings is recognised over the term of the borrowings.
1.8.2 Held to maturity investments
The municipality considers evidence of impairment for loans and receivables and held-to-maturity investment securities at both a specific asset and collective level. All individually significant receivables and held-to-maturity investments are assessed for specific impairment
These financial assets are initially measured at fair value plus direct transaction costs.
At subsequent reporting dates these are measured at amortised cost using the effective interest rate method, less any impairment loss recognised to reflect irrecoverable amounts. An impairment loss is recognised in surplus or deficit when there is objective evidence that the asset is impaired, and is measured as the difference between the investment’s carrying amount.and the present value of estimated future cash flows discounted at the effective interest rate computed at initial recognition. Impairment losses are reversed in subsequent periods when an increase in the investment's recoverable amount can be related objectively to an event occurring after the impairment was recognised, subject to the restriction that the carrying amount of the investment at the date the impairment is reversed shall not exceed what the amortised cost would have been had the impairment not been recognised.
Financial assets that the municipality has the positive intention and ability to hold to maturity are classified as held to maturity.
All individually significant loans and receivables and held-to-maturity investments found not to be specifically impaired are then collectively assessed for any impairment that has been incurred but not yet identified. Loans and receivables and held-to-maturity investments that are not individually significant are collectively assessed for impairment by grouping together loans and receivables and held-to-maturity investments with similar risk characteristics.
24
1.8.3 Financial liabilities and equity instruments
Financial liabilities are classified according to the substance of contractual agreements entered into. Trade and other payables are stated at their nominal value. Equity instruments are recorded at the amount received, net of direct issue costs.
1.8.4 Gains and losses
A gain or loss arising from a change in a financial asset or financial liability is recognised as follows:
• A gain or loss on a financial asset or financial liability classified as at fair value through
surplus or deficit is recognised in surplus or deficit; • A gain or loss on an available-for-sale financial asset is recognised directly in net assets,
through the statement of changes in net assets, until the financial asset is derecognised, at which time the cumulative gain or loss previously recognised in net assets is recognised in surplus or deficit; and
• For financial assets and financial liabilities carried at amortised cost, a gain or loss is recognised in surplus or deficit when the financial asset or financial liability is derecognised or impaired.
1.9 Derecognition
1.9.1 Impairment of financial assets
The municipality assesses at each Statement of Financial Position date whether a financial asset or group of financial assets is impaired.
1.10 Leases
A lease is classified as a finance lease if it transfers substantially all the risks and rewards incidental to ownership.
A lease is classified as an operating lease if it does not transfer substantially all the risks and rewards incidental to ownership.
1.10.1 Operating leases – lessor
Operating lease revenue is recognised as revenue on a straight-line basis over the lease term. Initial direct costs incurred in negotiating and arranging operating leases are added to the carrying amount of the leased asset and recognised as an expense over the lease term on the same basis as the lease revenue. The aggregate cost of incentives is recognised as a reduction of rental revenue over the lease term on a straight-line basis. The aggregate benefit of incentives is recognised as a reduction of rental expense over the
25
Operating leases – lessor (cont.) lease term on a straight-line basis. Income for leases is disclosed under revenue in statement of financial performance
1.10.2 Operating leases – lessee
Operating lease payments are recognised as an expense on a straight-line basis over the lease term. The difference between the amounts recognised as an expense and the contractual payments are recognised as an operating lease asset or liability. Operating lease revenue is recognised as revenue on a straight-line basis over the lease term. Initial direct costs incurred in negotiating and arranging operating leases are added to the carrying amount of the leased asset and recognised as an expense over the lease term on the same basis as the lease revenue. The aggregate cost of incentives is recognised as a reduction of rental revenue over the lease term on a straight-line basis. The aggregate benefit of incentives is recognised as a reduction of rental expense over the lease term on a straight-line basis. Income for leases is disclosed under revenue in the statement of financial performance.
1.11 Inventories
Inventories include consumable stores, maintenance materials, spare parts for plant and equipment, work in progress and land and property held for sale. Cost is determined by the first-in- first out method and comprises all costs of purchases, costs of development, costs of conversion and other costs incurred in bringing the inventories to their present location and condition. Inventories are stated at the lower of cost and current replacement cost. Current replacement cost represents the cost the municipality would incur to acquire the asset on the reporting date. Where inventories are acquired at cost, or for nominal consideration, their costs are their fair value as at the date of acquisition.
Inventories are initially measured at cost except where inventories are acquired at no cost, or for nominal consideration, then their costs are their fair value as at the date of acquisition. Subsequently inventories are measured at the lower of cost and net realisable value. Inventories are measured at the lower of cost and current replacement cost where they are held for; • distribution at no charge or for a nominal charge; or • consumption in the production process of goods to be distributed at no charge or for a
nominal charge.
Net realisable value is the estimated selling price in the ordinary course of operations less the estimated costs of completion and the estimated costs necessary to make the sale, exchange or distribution.
26
Inventory (cont.) Current replacement cost is the cost the municipality incurs to acquire the asset on the reporting date. The cost of inventories comprises of all costs of purchase, costs of conversion and other costs incurred in bringing the inventories to their present location and condition. Redundant and slow moving inventories are identified and written down from cost to net realisable value with regard to their estimated economic or realisable values. Consumables are written down with regard to their age, condition and utility. Unsold properties for the purpose of resale are accounted for as inventory. When inventories are sold, the carrying amounts of those inventories are recognised as an expense in the period in which the related revenue is recognised. If there is no related revenue, the expenses are recognised when the goods are distributed, or related services are rendered. The amount of any write-down of inventories to net realisable value and all losses of inventories are recognised as an expense in the period the write-down or loss occurs. The amount of any reversal of any write-down of inventories, arising from an increase in net realisable value, is recognised as a reduction in the amount of. inventories recognised as an expense in the period in which the reversal occurs.
1.12 Employee benefits
1.12.1 Short-term employee benefits
The cost of short-term employee benefits, (those payable within 12 months after the service is rendered, such as paid vacation leave and sick leave, bonuses, and non-monetary benefits such as medical care), are recognised in the period in which the service is rendered and are not discounted. The expected cost of compensated absences is recognised as an expense as the employees render services that increase their entitlement or, in the case of non-accumulating absences, when the absence occurs.
1.12.2 Other post retirement obligations
The municipality provides post-retirement health care benefits, to retirees. The entitlement to post-retirement health care benefits is based on the employee remaining in service up to retirement age and the completion of a minimum service period. The expected costs of these benefits are accrued over the period of employment. Independent qualified actuaries carry out valuations of these obligations.
1.13 Provisions and contingencies
Provisions are recognised when: • the municipality has a present obligation as a result of a past event;
27
Provisions and contingencies (cont.) • it is probable that an outflow of resources embodying economic benefits or service
potential will be required to settle the obligation; and • a reliable estimate can be made of the obligation. The amount of a provision is the best estimate of the expenditure expected to be required to settle the present obligation at the reporting date.
Where the effect of time value of money is material, the amount of a provision is the present value of the expenditures expected to be required to settle the obligation. The discount rate is a pre-tax rate that reflects current market assessments of the time value of money and the risks specific to the liability. Provisions are reviewed at each reporting date and adjusted to reflect the current best estimate. Provisions are reversed if it is no longer probable that an outflow of resources embodying economic benefits or service potential will be required, to settle the obligation. Where discounting is used, the carrying amount of a provision increases in each period to reflect the passage of time. This increase is recognised as an interest expense. Discounting of consumer debtors is not calculated as the municipality is levying interest at prime plus 1% with default in payment after 30 days A provision is used only for expenditures for which the provision was originally recognised. If an entity has a contract that is onerous, the present obligation (net of recoveries) under the contract is recognised and measured as a provision. No obligation arises as a consequence of the sale or transfer of an operation until the municipality is committed to the sale or transfer, that is, there is a binding agreement. After their initial recognition, contingent liabilities recognised in business combinations that are recognised separately are subsequently measured at the higher of: • the amount that would be recognised as a provision; and • the amount initially recognised less cumulative amortisation.
Contingent assets and contingent liabilities are not recognised. Contingencies are disclosed in the relevant note.
1.14 Revenue from exchange transactions
Revenue is the gross inflow of economic benefits or service potential during the reporting period when those inflows result in an increase in net assets, other than increases relating to contributions from owners. An exchange transaction is one in which the municipality receives assets or services, or has liabilities extinguished, and directly gives approximately equal value (primarily in the form of goods, services or use of assets) to the other party in exchange.

28
Revenue from exchange transactions (cont.) Fair value is the amount for which an asset could be exchanged, or a liability settled, between knowledgeable, willing parties in an arm's length transaction.
1.14.1 Measurement
Revenue is measured at the fair value of the consideration received or receivable, net of trade discounts and volume rebates
1.14.1.1 Sale of goods
Revenue from the sale of goods is recognised when all the following conditions have been satisfied: • the municipality has transferred to the purchaser the significant risks and rewards of
ownership of the goods; • the municipality retains neither continuing managerial involvement to the degree usually
associated with ownership nor effective control over the goods sold; • the amount of revenue can be measured reliably; • it is probable that the economic benefits or service potential associated with the transaction
will flow to the municipality; and • the costs incurred or to be incurred in respect of the transaction can be measured reliably.
1.14.1.2 Rendering of services
When the outcome of a transaction involving the rendering of services can be estimated reliably, revenue associated with the transaction is recognised by reference to the stage of completion of the transaction at the reporting date. The outcome of a transaction can be estimated reliably when all the following conditions are satisfied: • the amount of revenue can be measured reliably; • it is probable that the economic benefits or service potential associated with the transaction
will flow to the municipality; • the stage of completion of the transaction at the reporting date can be measured reliably;
and • the costs incurred for the transaction and the costs to complete the transaction can be
measured reliably.
When the outcome of the transaction involving the rendering of services cannot be estimated reliably, revenue is recognised only to the extent of the expenses recognised that are recoverable. Service revenue is recognised by reference to the stage of completion of the transaction at the reporting date. Stage of completion is determined by: • surveys of work performed; • services performed to date as a percentage of total services to be performed; • the proportion that costs incurred to date bear to the total estimated costs of the
transaction. Revenue arising from application of the approved tariff of charges is recognised when the relevant service is rendered by applying the relevant gazetted tariff. This includes the issuing of

29
Rendering of services (cont.) licenses and permits.
1.14.1.3 Interest, royalties and dividends
Revenue arising from the use by others of entity assets yielding interest, royalties and dividends is recognised when: • It is probable that the economic benefits or service potential associated with the transaction
will flow to the municipality, and • The amount of the revenue can be measured reliably.
Interest is recognised in surplus or deficit, using the effective interest rate method. Dividends or their equivalents are recognised, in surplus or deficit, when the municipality's right to receive payment has been established. Service fees included in the price of the product are recognised as revenue over the period during which the service is performed.
1.15 Revenue from non-exchange transactions
Non-exchange transactions are defined as transactions where the entity receives value from another entity without directly giving approximately equal value in exchange. Revenue is the gross inflow of economic benefits or service potential during the reporting period when those inflows result in an increase in net assets, other than increases relating to contributions from owners. Fair value is the amount for which an asset could be exchanged, or a liability settled, between knowledgeable, willing parties in an arm's length transaction.
1.15.1 Measurement
Revenue is measured at the fair value of the consideration received or receivable, net of trade discounts and volume rebates.
1.15.1.1 Rates, including collection charges and penalties interest
Revenue from rates, including collection charges and penalty interest, is recognised when: • it is probable that the economic benefits or service potential associated with the transaction
will flow to the municipality; • the amount of the revenue can be measured reliably; and • there has been compliance with the relevant legal requirements.
Changes to property values during a reporting period are valued by a suitably qualified valuator and adjustments are made to rates revenue, based on a time proportion basis. Adjustments to rates revenue already recognised are processed or additional rates revenue is recognised.
30
1.15.1.2 Fines
Revenue from the issuing of fines is recognised when: • it is probable that the economic benefits or service potential associated with the transaction
will flow to the municipality; and • the amount of the revenue can be measured reliably.
Fines constitute both spot fines and summonses. Revenue from spot fines and summonses is recognised when payment is received, together with an estimate of spot fines and summonses that will be received based on past experience of amounts collected.
1.15.1.3 Government grants
Government grants are recognised as revenue when: • it is probable that the economic benefits or service potential associated with the transaction
will flow to the municipality, • the amount of the revenue can be measured reliably, and • to the extent that there has been compliance with any restrictions associated with the
grant.
The municipality assesses the degree of certainty attached to the flow of future economic benefits or service potential on the basis of the available evidence. Certain grants payable by one level of government to another are subject to the availability of funds. Revenue from these grants is only recognised when it is probable that the economic benefits or service potential associated with the transaction will flow to the entity. An announcement at the beginning of a financial year that grants may be available for qualifying entities in accordance with an agreed programme may not be sufficient evidence of the probability of the flow. Revenue is then only recognised once evidence of the probability of the flow of funds becomes available. Restrictions on government grants may result in such revenue being recognised on a time proportion basis. Where there is no restriction on the period, such revenue is recognised on receipt or when the Act becomes effective, which-ever is earlier. When government remit grants on a re-imbursement basis, revenue is recognised when the qualifying expense has been incurred and to the extent that any other restrictions have been complied with.
1.15.1.4 Other grants and donations
Other grants and donations are recognised as revenue when: • it is probable that the economic benefits or service potential associated with the transaction
will flow to the municipality; • the amount of the revenue can be measured reliably; and • to the extent that there has been compliance with any restrictions associated with the
grant.
If goods in-kind are received without conditions attached, revenue is recognised immediately. If conditions are attached, a liability is recognised, which is reduced and revenue recognised as the conditions are satisfied.
31
1.16 Borrowing costs
All the other borrowing costs are recognized as an expense in the period in which they are incurred. Borrowing costs that are directly attributable to the acquisition, construction or production of a qualifying asset are capitalised as part of the cost of that asset until such time as the asset is ready for its intended use. The amount of borrowing costs eligible for capitalisation is determined as follows: • Actual borrowing costs on funds specifically borrowed for the purpose of obtaining a
qualifying asset less any investment income on the temporary investment of those borrowings.
• Weighted average of the borrowing costs applicable to the Group on funds generally borrowed for the purpose of obtaining a qualifying asset.
1.17 Comparative figures
When the presentation or classification of items in the annual financial statements is amended, prior period comparative amounts are restated. The nature and reason for the reclassification is disclosed. Where accounting errors have been identified in the current year, the correction is made retrospectively as far as is practicable, and the prior year comparatives are restated accordingly. Where there has been a change in accounting policy in the current year, the adjustment is made retrospectively as far as is practicable, and the prior year comparatives are restated accordingly
1.18 Unauthorised expenditure
Unauthorised expenditure means: • �overspending of a vote or a main division within a vote; and �expenditure not in
accordance with the purpose of a vote or, in the case of a main division, not in accordance with the purpose of the main division.
All expenditure relating to unauthorised expenditure is recognised as an expense in the statement of financial performance in the year that the expenditure was incurred. The expenditure is classified in accordance with the nature of the expense, and where recovered, it is subsequently accounted for as revenue in the statement of financial performance.
1.19 Fruitless and wasteful expenditure
Fruitless expenditure means expenditure which was made in vain and would have been avoided had reasonable care been exercised. All expenditure relating to fruitless and wasteful expenditure is recognised as an expense in the statement of financial performance in the year that the expenditure was incurred. The expenditure is classified in accordance with the nature of the expense and where recovered, it is subsequently accounted for as revenue in the statement of financial performance.
32
1.20 Irregular expenditure
Irregular expenditure is expenditure other than unauthorised expenditure, incurred in contravention of, or that is not in accordance with a requirement of any applicable legislation. Irregular expenditure that was incurred and identified during the current financial year and which was not condoned by the National Treasury or the relevant authority is recorded appropriately in the irregular expenditure register. If liability for the irregular expenditure can be attributed to a person, a debt account is created if such a person is liable in law. Immediate steps are thereafter taken to recover the amount from the person concerned. If recovery is not possible, the accounting officer or accounting authority may write off the amount as debt impairment and disclose such in the relevant note to the financial statements. The irregular expenditure register is updated accordingly.
1.21 Offsetting
Assets, liabilities, revenue and expenses have not been offset, except when offsetting is required or permitted by a Standard of Generally Recognised Accounting Practice (GRAP).
1.22 Investments
Where the carrying amount of an investment is greater than the estimated recoverable amount, it is written down immediately to its recoverable amount and an impairment loss is charged to the statement of financial performance.
1.23 Conditional grants and receipts
Revenue received from conditional grants, donations and funding are recognised as revenue to the extent that the municipality has complied with any of the criteria, conditions or obligations embodied in the agreement. To the extent that the criteria, conditions or obligations have not been met a liability is recognised.
The annual financial statements and the budget are on the same basis of accounting, therefore a comparison with the budgeted amounts for the reporting period have been included in the annual financial statements.
1.24 Events after reporting date
Events after the reporting date are defined as favourable and unfavourable events that occur between the reporting date and the date the annual financial statements are authorised for issue. The date of authorisation for issue is the date on which the Accounting Officer signs off the annual financial statements. Two types of events can be identified:
• those that provide evidence of conditions that existed at the reporting date (adjusting events after the reporting date):and
• those that are Indicative of conditions that arose after the reporting date (non-adjusting events after the reporting date)
33
1.25 Related parties
Related parties are considered to be related if one party has the ability to control the other party or exercise significant influence over the other party in making financial and operating decisions or if the related party entity and another entity are subject to common control.
Related parties include: • Key management personnel, close members of the family of key management personnel
and councillors
In considering each possible related party relationship, attention is directed to the substance of the relationship, and not merely the legal form.
Key management personnel include all directors or members of the municipal council of the reporting entity where that council has jurisdiction. The council, together with the Municipal Manager and Section 57 employees has authority and responsibility to plan and control the activities of the municipality, to manage the resources and for the overall achievement of municipal objectives. Therefore, key management personnel will include the Municipal Manager, Deputy Municipal Managers and Chief Financial Officer of the municipality
1.26 Risk Management
The maximum exposure to credit risk at the reporting date is the fair value of each class of loan mentioned above. The municipality does not hold any collateral as security beside that of consumer deposits.
1.26.1 Capital risk management
There have been no changes to what the municipality manages as capital, the strategy for capital maintenance or externally imposed capital requirements from the previous year.
1.26.2 Financial risk management
The municipality’s activities expose it to a variety of financial risks: local economic environment, market forces, cash flow interest rate risk and price risk, credit risk and liquidity risk.
1.26.3 Liquidity risk management
The municipality’s risk to liquidity is a result of the funds available to cover future commitments. The municipality manages liquidity risk through an on-going review of future commitments and credit facilities.
1.26.4 Interest rate risk management
As the municipality has no significant interest-bearing assets, the municipality’s income and operating cash flows are substantially independent of changes in market interest rates.

34
1.26.5 Credit risk management
Credit risk consists mainly of cash deposits, cash equivalents, derivative financial instruments and trade debtors. The municipality only deposits cash with major banks with high quality credit standing and limits exposure to any one counter-party. Trade receivables comprise a widespread customer base. Management evaluated credit risk relating to customers on an on-going basis. The main risk is represented by the deterioration of on-time collection of property taxes and service charges.

2012 2011R R
1 CASH AND CASH EQUIVALENTS
Cash and cash equivalents consist of the following:Cash on hand 7 282 7 282 Cash at bank 4 919 446 4 367 742
4 926 728 4 375 024
The Municipality has the following bank accounts: -
Current Account (Primary Bank Account)
ABSA Bank LimitedAccount No. 4055605473Branch Code:634540
Cash book balance at beginning of year (21 209 710) (9 593 188)
Cash book balance at end of year (7 103 618) (21 209 710)
Bank statement balance at beginning of year 1 945 727 293 696
Bank statement balance at end of year 851 129..02 1 945 727
Current Account (Other Account)(TMT)
ABSA Bank LimitedAccount No. 4061545689Branch Code:634540
Cash book balance at beginning of year 196 028 381 297
Cash book balance at end of year 546 740 196 028
Bank statement balance at beginning of year 381 297 381 297
Bank statement balance at end of year 259 405 381 297
Current Account (Other Account)(Bank Account Traffic)
ABSA Bank LimitedAccount No. 4050989969Branch Code:634540
Cash book balance at beginning of year 1 820 516 1 112 674
Cash book balance at end of year 2 247 589 1 820 516
Bank statement balance at beginning of year 912 488 363 654
Bank statement balance at end of year 1 441 433 912 488
Current Account (Other Account)(PMU)
ABSA Bank LimitedAccount No. 4064023765Branch Code:634540
Cash book balance at beginning of year 385 274 4 564 214
Cash book balance at end of year 49 535 385 274
Bank statement balance at beginning of year 193 641 4 892 082
Bank statement balance at end of year 49 535 193 641
Current Account (Other Account)(Future Development)
ABSA Bank Limited
NOTES TO THE FINANANCIAL STATEMENTSfor the year ended 30 June 2012
Maquassi Hills Local Municipality
31

2012 2011R R
NOTES TO THE FINANANCIAL STATEMENTSfor the year ended 30 June 2012
Maquassi Hills Local Municipality
Account No. 40644584280Branch Code:634540
Cash book balance at beginning of year 702 094 709 888
Cash book balance at end of year 7 981 702 094
Bank statement balance at beginning of year 1 098 8 888
Bank statement balance at end of year 7 981 1 098
Current Account (Other Account)(Housing Project)
ABSA Bank LimitedAccount No. 4062582537Branch Code:634540
Cash book balance at beginning of year 2 896 2 087 902
Cash book balance at end of year - 2 896
Bank statement balance at beginning of year 2 896 2 087 902
Bank statement balance at end of year - 2 896
Current Account (Other Account)(Housing Development Fund)
ABSA Bank LimitedAccount No. 4055636965Branch Code:634540
Cash book balance at beginning of year 27 251 27 551
Cash book balance at end of year 26 800 27 251
Bank statement balance at beginning of year 27 251 27 551
Bank statement balance at end of year 26 800 27 251
Current Account (Other Account)(Tswelelang Housing)
Fist National BankAccount No. 54311117765Branch Code:240638
Cash book balance at beginning of year 620 818 621 139
Cash book balance at end of year 619 984 620 818
Bank statement balance at beginning of year 620 818 621 139
Bank statement balance at end of year 619 983 620 818
Current Account (Other Account)(Kgakala Housing)
ABSA Bank LimitedAccount No. 4049678703Branch Code:634540
Cash book balance at beginning of year 98 806 98 477
Cash book balance at end of year 97 717 98 806
Bank statement balance at beginning of year 98 806 98 477
Bank statement balance at end of year 97 717 98 806
1 CASH AND CASH EQUIVALENTS(cont.)
Current Account (Other Account)
32
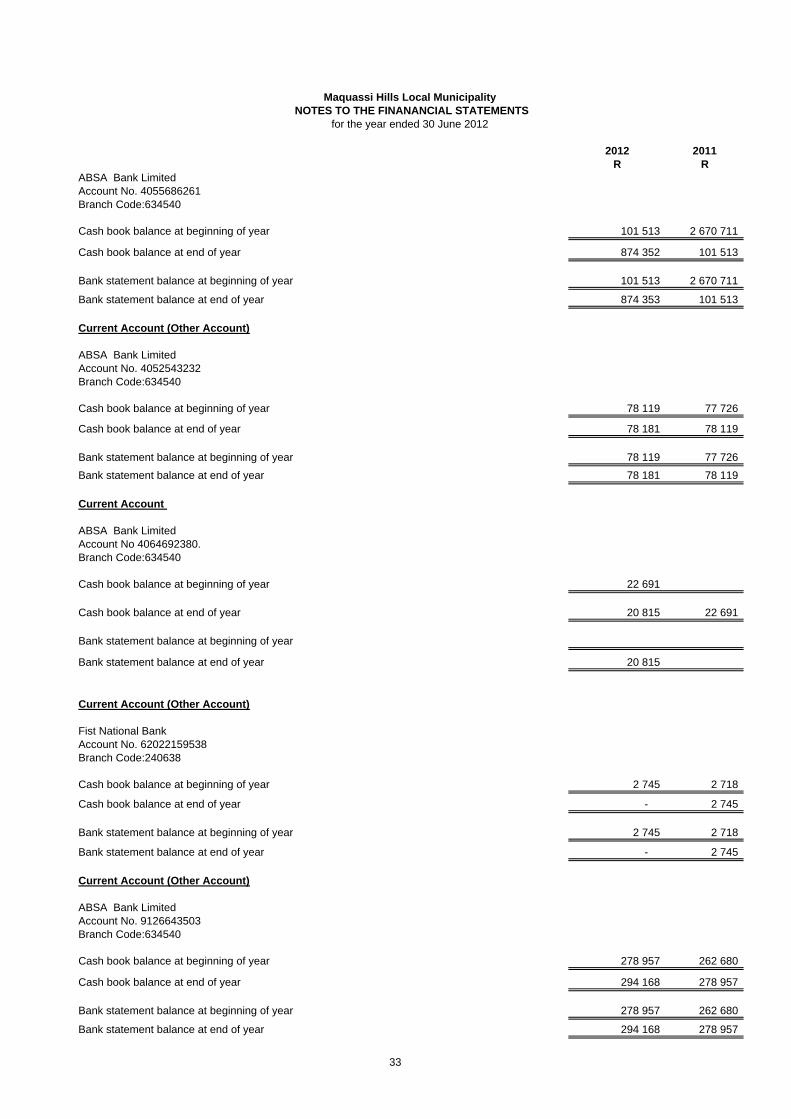
2012 2011R R
NOTES TO THE FINANANCIAL STATEMENTSfor the year ended 30 June 2012
Maquassi Hills Local Municipality
ABSA Bank LimitedAccount No. 4055686261Branch Code:634540
Cash book balance at beginning of year 101 513 2 670 711
Cash book balance at end of year 874 352 101 513
Bank statement balance at beginning of year 101 513 2 670 711
Bank statement balance at end of year 874 353 101 513
Current Account (Other Account)
ABSA Bank LimitedAccount No. 4052543232Branch Code:634540
Cash book balance at beginning of year 78 119 77 726
Cash book balance at end of year 78 181 78 119
Bank statement balance at beginning of year 78 119 77 726
Bank statement balance at end of year 78 181 78 119
Current Account
ABSA Bank LimitedAccount No 4064692380. Branch Code:634540
Cash book balance at beginning of year 22 691
Cash book balance at end of year 20 815 22 691
Bank statement balance at beginning of year
Bank statement balance at end of year 20 815
Current Account (Other Account)
Fist National BankAccount No. 62022159538Branch Code:240638
Cash book balance at beginning of year 2 745 2 718
Cash book balance at end of year - 2 745
Bank statement balance at beginning of year 2 745 2 718
Bank statement balance at end of year - 2 745
Current Account (Other Account)
ABSA Bank LimitedAccount No. 9126643503Branch Code:634540
Cash book balance at beginning of year 278 957 262 680
Cash book balance at end of year 294 168 278 957
Bank statement balance at beginning of year 278 957 262 680
Bank statement balance at end of year 294 168 278 957
33
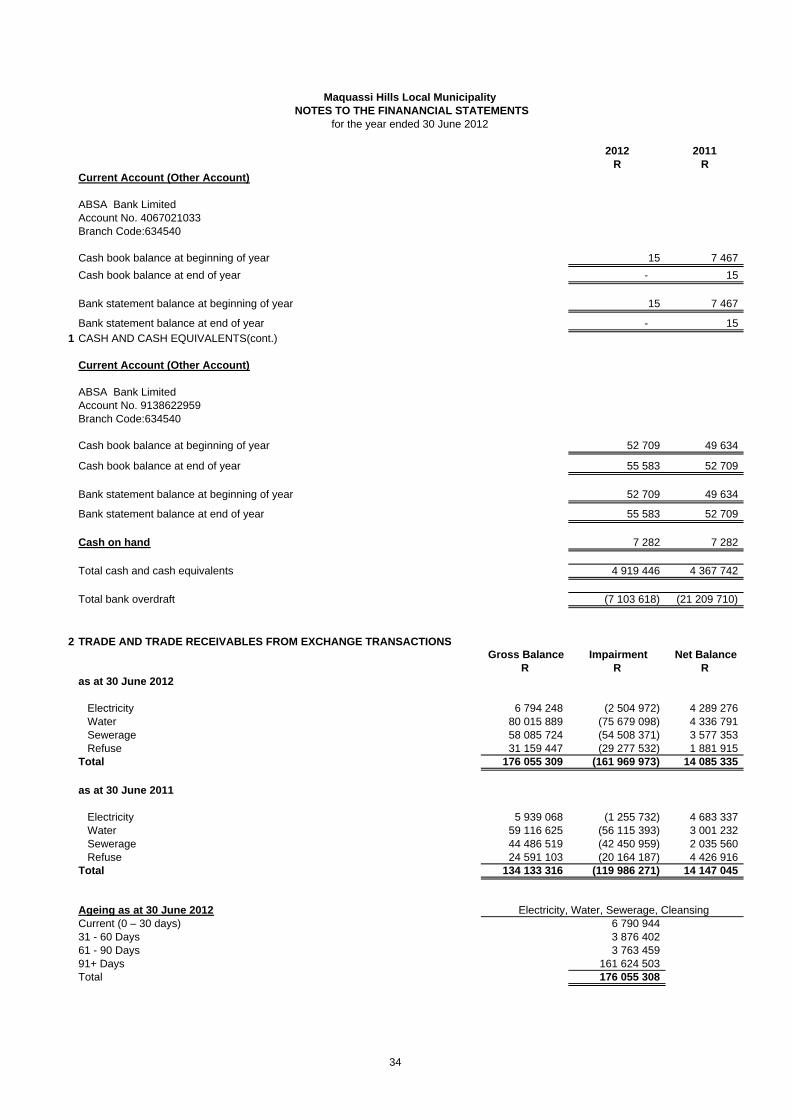
2012 2011R R
NOTES TO THE FINANANCIAL STATEMENTSfor the year ended 30 June 2012
Maquassi Hills Local Municipality
Current Account (Other Account)
ABSA Bank LimitedAccount No. 4067021033Branch Code:634540
Cash book balance at beginning of year 15 7 467
Cash book balance at end of year - 15
Bank statement balance at beginning of year 15 7 467
Bank statement balance at end of year - 15
1 CASH AND CASH EQUIVALENTS(cont.)
Current Account (Other Account)
ABSA Bank LimitedAccount No. 9138622959Branch Code:634540
Cash book balance at beginning of year 52 709 49 634
Cash book balance at end of year 55 583 52 709
Bank statement balance at beginning of year 52 709 49 634
Bank statement balance at end of year 55 583 52 709
Cash on hand 7 282 7 282
Total cash and cash equivalents 4 919 446 4 367 742
Total bank overdraft (7 103 618) (21 209 710)
2 TRADE AND TRADE RECEIVABLES FROM EXCHANGE TRANSACTIONS Gross Balance Impairment Net Balance
R R Ras at 30 June 2012
Electricity 6 794 248 (2 504 972) 4 289 276 Water 80 015 889 (75 679 098) 4 336 791 Sewerage 58 085 724 (54 508 371) 3 577 353 Refuse 31 159 447 (29 277 532) 1 881 915 Total 176 055 309 (161 969 973) 14 085 335
as at 30 June 2011
Electricity 5 939 068 (1 255 732) 4 683 337 Water 59 116 625 (56 115 393) 3 001 232 Sewerage 44 486 519 (42 450 959) 2 035 560 Refuse 24 591 103 (20 164 187) 4 426 916 Total 134 133 316 (119 986 271) 14 147 045
Ageing as at 30 June 2012Current (0 – 30 days) 6 790 944 31 - 60 Days 3 876 402 61 - 90 Days 3 763 459 91+ Days 161 624 503 Total 176 055 308
Electricity, Water, Sewerage, Cleansing
34
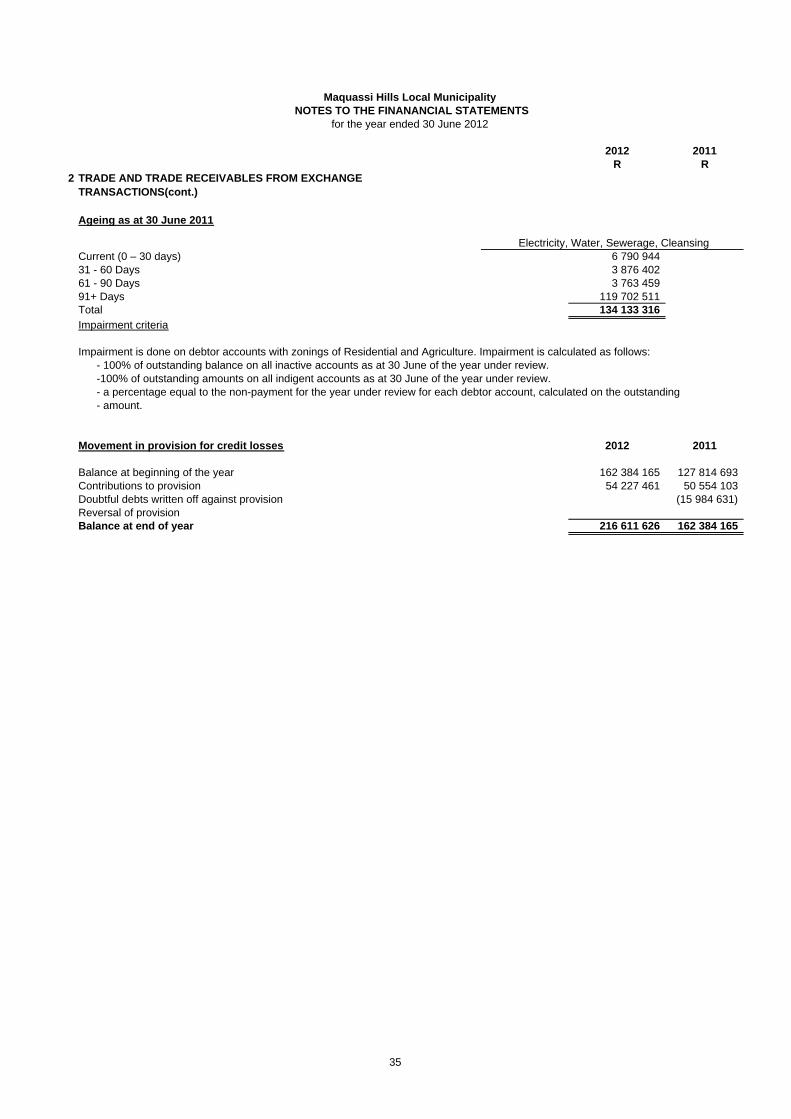
2012 2011R R
NOTES TO THE FINANANCIAL STATEMENTSfor the year ended 30 June 2012
Maquassi Hills Local Municipality
2 TRADE AND TRADE RECEIVABLES FROM EXCHANGE TRANSACTIONS(cont.)
Ageing as at 30 June 2011
Current (0 – 30 days) 6 790 944 31 - 60 Days 3 876 402 61 - 90 Days 3 763 459 91+ Days 119 702 511 Total 134 133 316
Impairment criteria
Impairment is done on debtor accounts with zonings of Residential and Agriculture. Impairment is calculated as follows:- 100% of outstanding balance on all inactive accounts as at 30 June of the year under review.-100% of outstanding amounts on all indigent accounts as at 30 June of the year under review.- a percentage equal to the non-payment for the year under review for each debtor account, calculated on the outstanding- amount.
Movement in provision for credit losses 2012 2011
Balance at beginning of the year 162 384 165 127 814 693 Contributions to provision 54 227 461 50 554 103 Doubtful debts written off against provision (15 984 631) Reversal of provisionBalance at end of year 216 611 626 162 384 165
Electricity, Water, Sewerage, Cleansing
35

2012 2011R R
NOTES TO THE FINANANCIAL STATEMENTSfor the year ended 30 June 2012
Maquassi Hills Local Municipality
3 TRADE AND TRADE RECEIVABLES FROM NON -EXCHANGE TRANSACTIONS
as at 30 June 2012 Gross Balances Impairment Net Balance
Subsidies 1 107 947 1 107 947 Other debtors - billing 64 999 096 (37 113 653) 27 885 443 Other debtors 2 092 564 2 092 564 Property rates 20 981 569 (17 528 000) 3 453 569 Total Other Debtors 89 181 176 (54 641 653) 34 539 523
As at 30 June 2011
Subsidies 1 107 947 1 107 947 Other debtors - billing 32 700 294 (32 373 234) 327 060 Other debtors 1 610 615 (1 000 000) 610 615 Property rates 16 303 336 (14 020 965) 2 282 371 Prepaid expenses 22 483 22 483 Total Other Debtors 51 744 676 (47 394 199) 4 350 477
4 INVENTORIES
Opening balance of inventories:Consumable, maintenance and spare parts stores - at cost 856 866 629 173 Additions:Consumable, maintenance and spare parts stores 888 731 1 360 971 Issued (expensed):Consumable, maintenance and spare parts stores (923 891) (1 133 278) Closing balance of inventories:Consumable, maintenance and spare parts stores 821 706 856 866
5 INVESTMENTS
Collateral - 19 549 Call investments 670 960 653 881 Total Investments (for detail see Appendix E) 670 960 673 430
6 NON-CURRENT RECEIVABLES
Housing selling scheme loans - - Other non-current receivables - -
- - Less : Current portion transferred to current receivables - - Housing selling scheme loans - - Other non-current receivables - -
Total - -
36

7 PROPERTY, PLANT AND EQUIPMENT
Reconciliation of Carrying ValueLand Buildings Infrastructure Community Heritage Other Assets Finance lease
assetsR R R R R R R
as at 1 July 2011 15 987 797 32 022 177 430 515 952 797 843 - 9 660 070 - Cost/Revaluation 18 921 996 36 925 795 513 242 032 997 304 - 21 486 000 - Correction of error Change in accounting policyAccumulated depreciation and impairment losses (2 934 199) (4 903 618) (82 726 080) (199 461) - (11 825 930) -
Acquisitions - 3 518 187 9 323 477 - - 1 539 147 - Capital under Construction - 4 216 575 57 798 370 - - - - Depreciation (978 066) (1 244 110) (20 993 689) (33 243) - (2 391 659) -
Carrying value of disposals - - - - - (916 182) - Cost/Revaluation - - - - - (1 618 485) - Accumulated depreciation and impairment losses - - - - - 702 303 -
Impairment loss/Reversal of impairment loss - - - - - - - Transfers - - (7 360 597) - - - - Other movements* - (6 099 416) (19 214 737) - - - -
as at 30 June 2012 15 009 731 32 413 414 450 068 776 764 600 - 7 891 376 - Cost/Revaluation 18 921 996 38 561 142 553 788 545 997 304 - 21 406 662 - Accumulated depreciation and impairment losses (3 912 266) (6 147 729) (103 719 769) (232 704) - (13 515 286) -
Maquassi Hills Local MunicipalityNOTES TO THE FINANANCIAL STATEMENTS
for the year ended 30 June 2012
Refer to Appendix B for more detail on property, plant and equipment
37
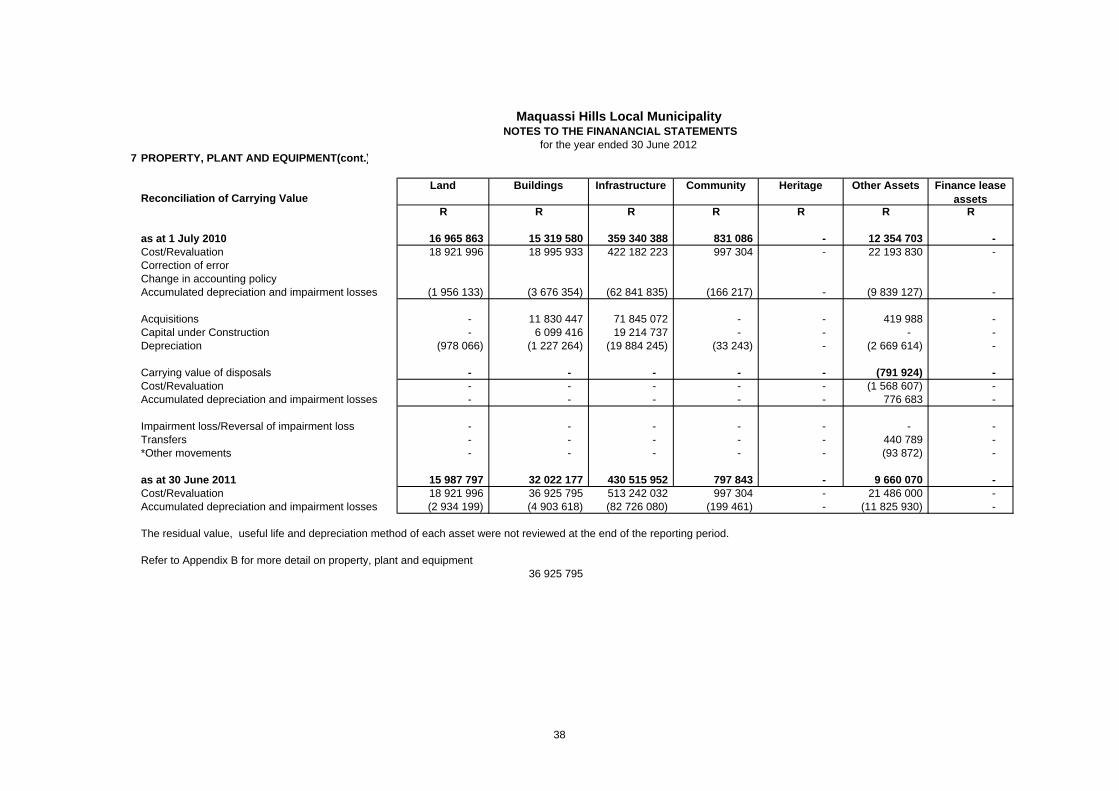
7 PROPERTY, PLANT AND EQUIPMENT(cont.)
Reconciliation of Carrying ValueLand Buildings Infrastructure Community Heritage Other Assets Finance lease
assetsR R R R R R R
as at 1 July 2010 16 965 863 15 319 580 359 340 388 831 086 - 12 354 703 - Cost/Revaluation 18 921 996 18 995 933 422 182 223 997 304 - 22 193 830 - Correction of error Change in accounting policy Accumulated depreciation and impairment losses (1 956 133) (3 676 354) (62 841 835) (166 217) - (9 839 127) -
Acquisitions - 11 830 447 71 845 072 - - 419 988 - Capital under Construction - 6 099 416 19 214 737 - - - - Depreciation (978 066) (1 227 264) (19 884 245) (33 243) - (2 669 614) -
Carrying value of disposals - - - - - (791 924) - Cost/Revaluation - - - - - (1 568 607) - Accumulated depreciation and impairment losses - - - - - 776 683 -
Impairment loss/Reversal of impairment loss - - - - - - - Transfers - - - - - 440 789 - *Other movements - - - - - (93 872) -
as at 30 June 2011 15 987 797 32 022 177 430 515 952 797 843 - 9 660 070 - Cost/Revaluation 18 921 996 36 925 795 513 242 032 997 304 - 21 486 000 - Accumulated depreciation and impairment losses (2 934 199) (4 903 618) (82 726 080) (199 461) - (11 825 930) -
The residual value, useful life and depreciation method of each asset were not reviewed at the end of the reporting period.
36 925 795 Refer to Appendix B for more detail on property, plant and equipment
Maquassi Hills Local MunicipalityNOTES TO THE FINANANCIAL STATEMENTS
for the year ended 30 June 2012
38

Total
R
488 983 839 591 573 128
- -
(102 589 289)
14 380 811 62 014 945
(25 640 768)
(916 182) (1 618 485)
702 303
- (7 360 597)
(25 314 153)
506 147 896 633 675 649
(127 527 753)
39
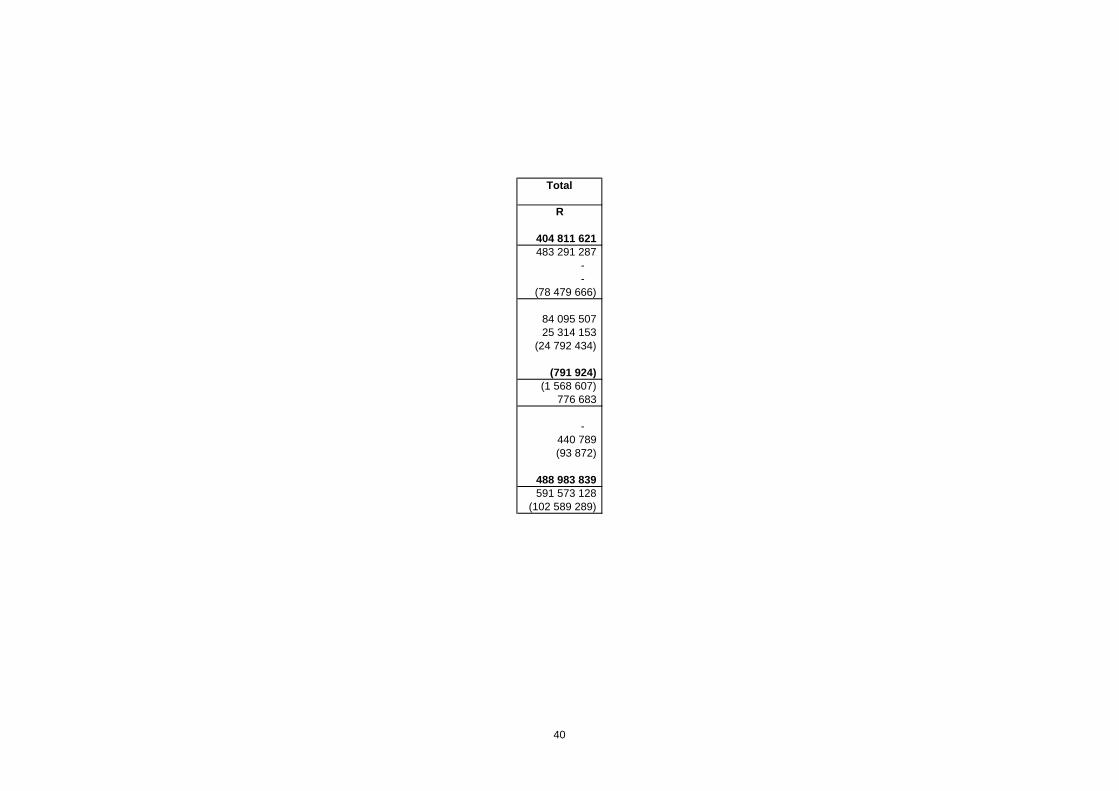
Total
R
404 811 621 483 291 287
- -
(78 479 666)
84 095 507 25 314 153
(24 792 434)
(791 924) (1 568 607)
776 683
- 440 789 (93 872)
488 983 839 591 573 128
(102 589 289)
40

8 INTANGIBLE ASSETS
Reconciliation of carrying value Computer Software Other*R R
as at 1 July 2011 50 840 - Cost 695 694 - Correction of error Change in accounting policy Accumulated amortisation and impairment losses (644 854) -
Acquisitions 14 778 - Amortisation (13 717) -
Carrying value of disposals (2 778) - Cost (4 364) - Accumulated amortisation 1 585 -
Impairment loss/Reversal of impairment loss - - Transfers - - Other movements - -
as at 30 June 2012 49 124 - Cost 706 109 - Accumulated amortisation and impairment losses (656 985) -
Reconciliation of carrying value Computer Software Other*R R
as at 1 July 2010 378 437 - Cost 1 107 806 - Correction of error Change in accounting policy Accumulated amortisation and impairment losses (729 369) -
Acquisitions 28 677 - Amortisation (9 357) -
Carrying value of disposals - - Cost - - Accumulated amortisation - -
Impairment loss/Reversal of impairment loss - - Transfers (440 789) - Other movements 93 872 -
as at 30 June 2011 50 840 - Cost 695 694 - Accumulated amortisation and impairment losses (644 854) -
The residual value, useful life and depreciation method of each asset were not reviewed at the end of the r
Maquassi Hills Local MunicipalityNOTES TO THE FINANANCIAL STATEMENTS
for the year ended 30 June 2012
39
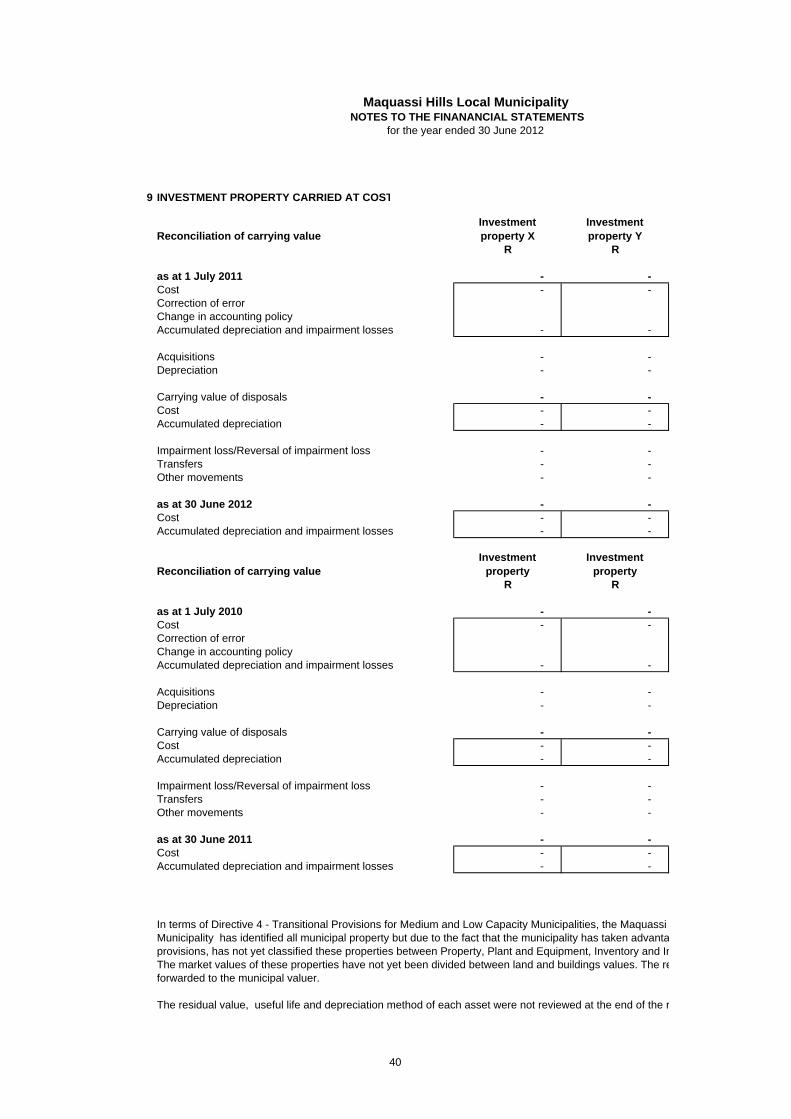
Maquassi Hills Local MunicipalityNOTES TO THE FINANANCIAL STATEMENTS
for the year ended 30 June 2012
9 INVESTMENT PROPERTY CARRIED AT COST
Reconciliation of carrying valueInvestment property X
Investment property Y
R R
as at 1 July 2011 - - Cost - - Correction of error Change in accounting policy Accumulated depreciation and impairment losses - -
Acquisitions - - Depreciation - -
Carrying value of disposals - - Cost - - Accumulated depreciation - -
Impairment loss/Reversal of impairment loss - - Transfers - - Other movements - -
as at 30 June 2012 - - Cost - - Accumulated depreciation and impairment losses - -
Reconciliation of carrying valueInvestment
propertyInvestment
propertyR R
as at 1 July 2010 - - Cost - - Correction of error Change in accounting policy Accumulated depreciation and impairment losses - -
Acquisitions - - Depreciation - -
Carrying value of disposals - - Cost - - Accumulated depreciation - -
Impairment loss/Reversal of impairment loss - - Transfers - - Other movements - -
as at 30 June 2011 - - Cost - - Accumulated depreciation and impairment losses - -
The residual value, useful life and depreciation method of each asset were not reviewed at the end of the r
In terms of Directive 4 - Transitional Provisions for Medium and Low Capacity Municipalities, the Maquassi Municipality has identified all municipal property but due to the fact that the municipality has taken advantaprovisions, has not yet classified these properties between Property, Plant and Equipment, Inventory and InThe market values of these properties have not yet been divided between land and buildings values. The reforwarded to the municipal valuer.
40
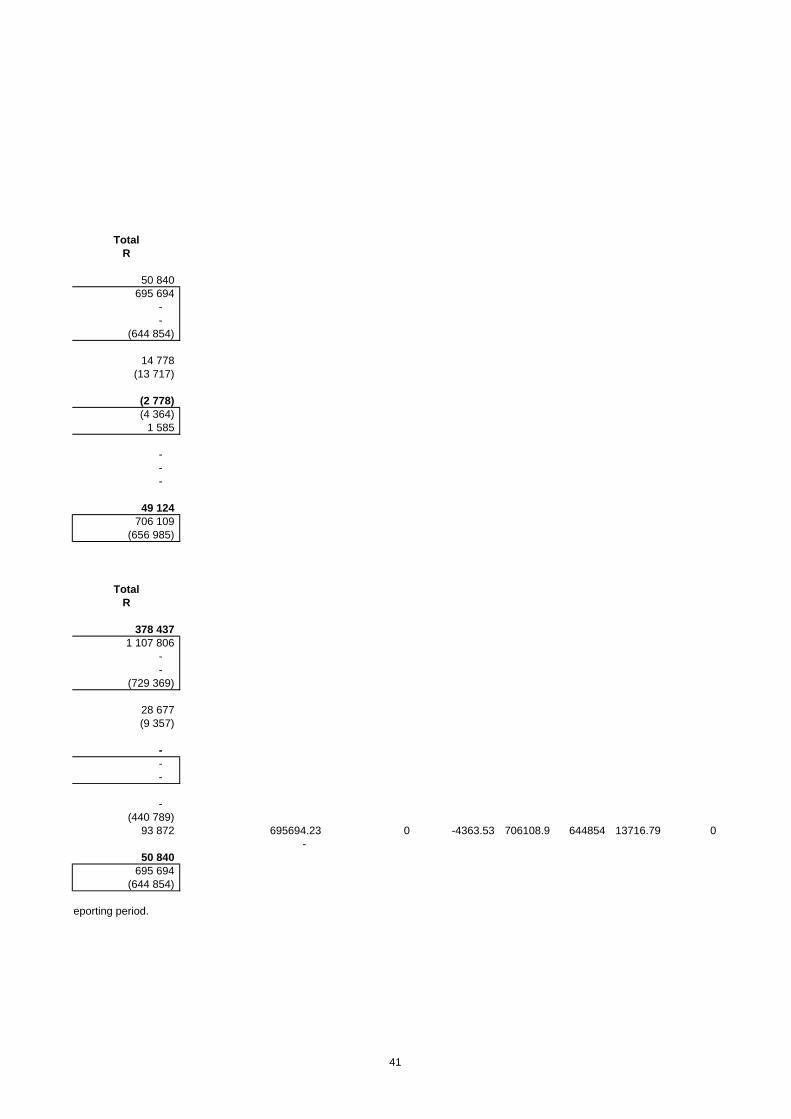
TotalR
50 840 695 694
- -
(644 854)
14 778 (13 717)
(2 778) (4 364)
1 585
- - -
49 124 706 109
(656 985)
TotalR
378 437 1 107 806
- -
(729 369)
28 677 (9 357)
- - -
- (440 789)
93 872 695694.23 0 -4363.53 706108.9 644854 13716.79 0-
50 840 695 694
(644 854)
reporting period.
41
TotalR
- - - - -
- -
- - -
- - -
- - -
TotalR
- - - - -
- -
- - -
- - -
- - -
reporting period.
Hills Local age of the transitional nvestment Property. equest will be
42

0 -1585.42 656985.4 49123.53 0 0 0 0 0 0 706108.9
43

44

No. DeviationContract
valueService Provider Reason for deviation
Request date
Approval date Department
1
2
3
4
5 As per Register fo irregular expenditure
6
11
12
Total value: -
APPENDIX DMaquassi Hills Municipality
SUPPLY CHAIN DEVIATIONSfor the year ended 30 June 2012
69
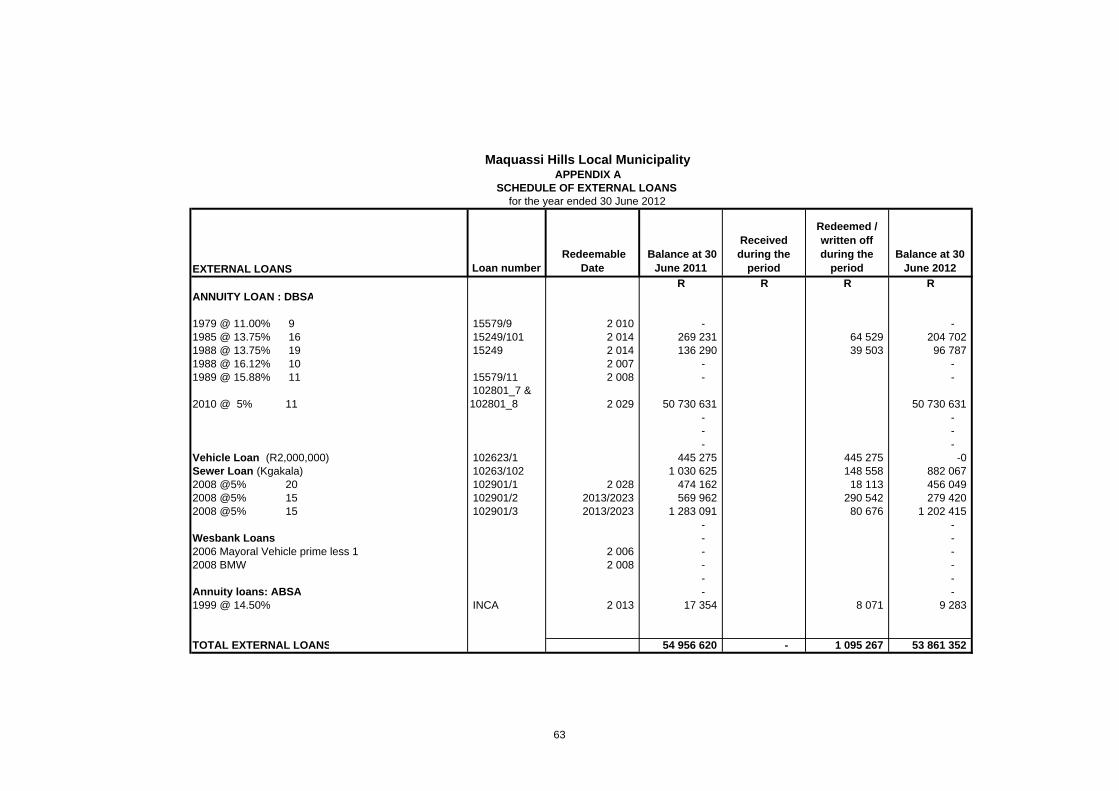
EXTERNAL LOANS Loan number Redeemable
Date Balance at 30
June 2011
Received during the
period
Redeemed / written off during the
periodBalance at 30
June 2012
R R R RANNUITY LOAN : DBSA
1979 @ 11.00% 9 15579/9 2 010 - - 1985 @ 13.75% 16 15249/101 2 014 269 231 64 529 204 702 1988 @ 13.75% 19 15249 2 014 136 290 39 503 96 787 1988 @ 16.12% 10 2 007 - - 1989 @ 15.88% 11 15579/11 2 008 - -
2010 @ 5% 11 102801_7 & 102801_8 2 029 50 730 631 50 730 631
- - - - - -
Vehicle Loan (R2,000,000) 102623/1 445 275 445 275 -0 Sewer Loan (Kgakala) 10263/102 1 030 625 148 558 882 067 2008 @5% 20 102901/1 2 028 474 162 18 113 456 049 2008 @5% 15 102901/2 2013/2023 569 962 290 542 279 420 2008 @5% 15 102901/3 2013/2023 1 283 091 80 676 1 202 415
- - Wesbank Loans - - 2006 Mayoral Vehicle prime less 1 2 006 - - 2008 BMW 2 008 - -
- - Annuity loans: ABSA - - 1999 @ 14.50% INCA 2 013 17 354 8 071 9 283
TOTAL EXTERNAL LOANS 54 956 620 - 1 095 267 53 861 352
APPENDIX ASCHEDULE OF EXTERNAL LOANS
Maquassi Hills Local Municipality
for the year ended 30 June 2012
63
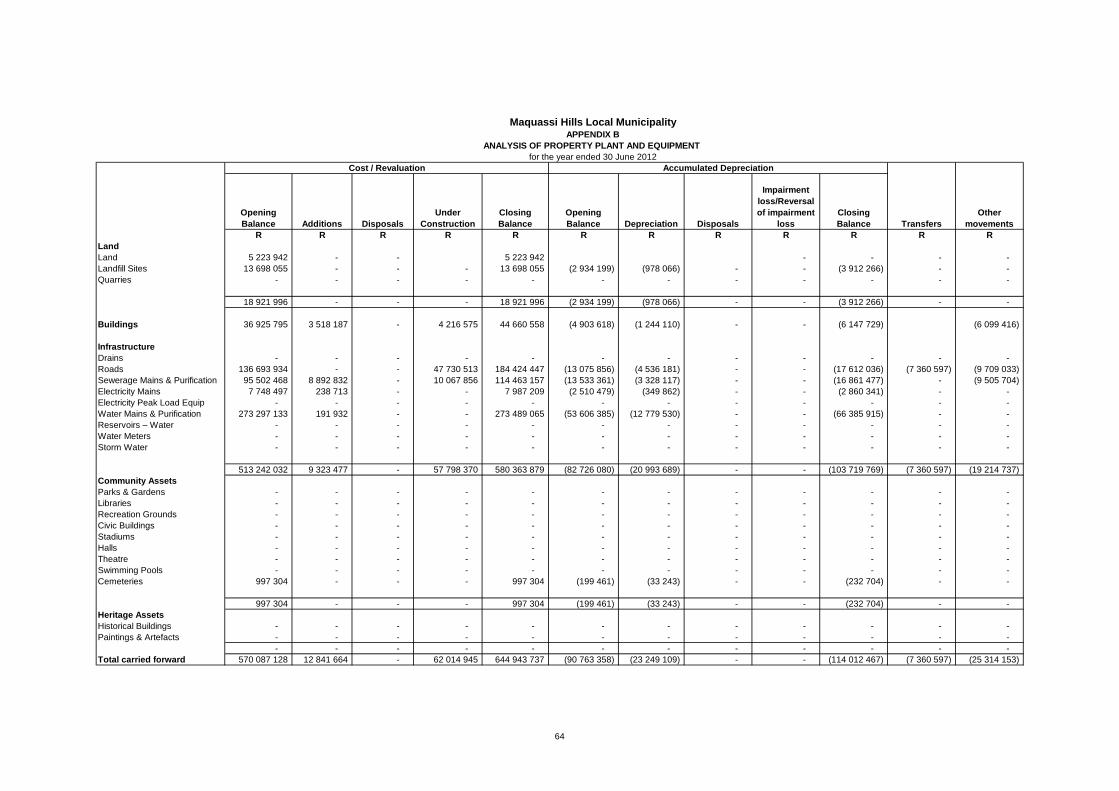
Opening Balance Additions Disposals
Under Construction
Closing Balance
Opening Balance Depreciation Disposals
Impairment loss/Reversal of impairment
lossClosing Balance
R R R R R R R R R R R RLandLand 5 223 942 - - 5 223 942 - - - - Landfill Sites 13 698 055 - - - 13 698 055 (2 934 199) (978 066) - - (3 912 266) - - Quarries - - - - - - - - - - - -
18 921 996 - - - 18 921 996 (2 934 199) (978 066) - - (3 912 266) - -
Buildings 36 925 795 3 518 187 - 4 216 575 44 660 558 (4 903 618) (1 244 110) - - (6 147 729) (6 099 416)
InfrastructureDrains - - - - - - - - - - - - Roads 136 693 934 - - 47 730 513 184 424 447 (13 075 856) (4 536 181) - - (17 612 036) (7 360 597) (9 709 033) Sewerage Mains & Purification 95 502 468 8 892 832 - 10 067 856 114 463 157 (13 533 361) (3 328 117) - - (16 861 477) - (9 505 704) Electricity Mains 7 748 497 238 713 - - 7 987 209 (2 510 479) (349 862) - - (2 860 341) - - Electricity Peak Load Equip - - - - - - - - - - - - Water Mains & Purification 273 297 133 191 932 - - 273 489 065 (53 606 385) (12 779 530) - - (66 385 915) - - Reservoirs – Water - - - - - - - - - - - - Water Meters - - - - - - - - - - - - Storm Water - - - - - - - - - - - -
513 242 032 9 323 477 - 57 798 370 580 363 879 (82 726 080) (20 993 689) - - (103 719 769) (7 360 597) (19 214 737) Community AssetsParks & Gardens - - - - - - - - - - - - Libraries - - - - - - - - - - - - Recreation Grounds - - - - - - - - - - - - Civic Buildings - - - - - - - - - - - - Stadiums - - - - - - - - - - - - Halls - - - - - - - - - - - - Theatre - - - - - - - - - - - - Swimming Pools - - - - - - - - - - - - Cemeteries 997 304 - - - 997 304 (199 461) (33 243) - - (232 704) - -
997 304 - - - 997 304 (199 461) (33 243) - - (232 704) - - Heritage AssetsHistorical Buildings - - - - - - - - - - - - Paintings & Artefacts - - - - - - - - - - - -
- - - - - - - - - - - - Total carried forward 570 087 128 12 841 664 - 62 014 945 644 943 737 (90 763 358) (23 249 109) - - (114 012 467) (7 360 597) (25 314 153)
Cost / Revaluation Accumulated Depreciation
Maquassi Hills Local MunicipalityAPPENDIX B
ANALYSIS OF PROPERTY PLANT AND EQUIPMENT for the year ended 30 June 2012
TransfersOther
movements
64
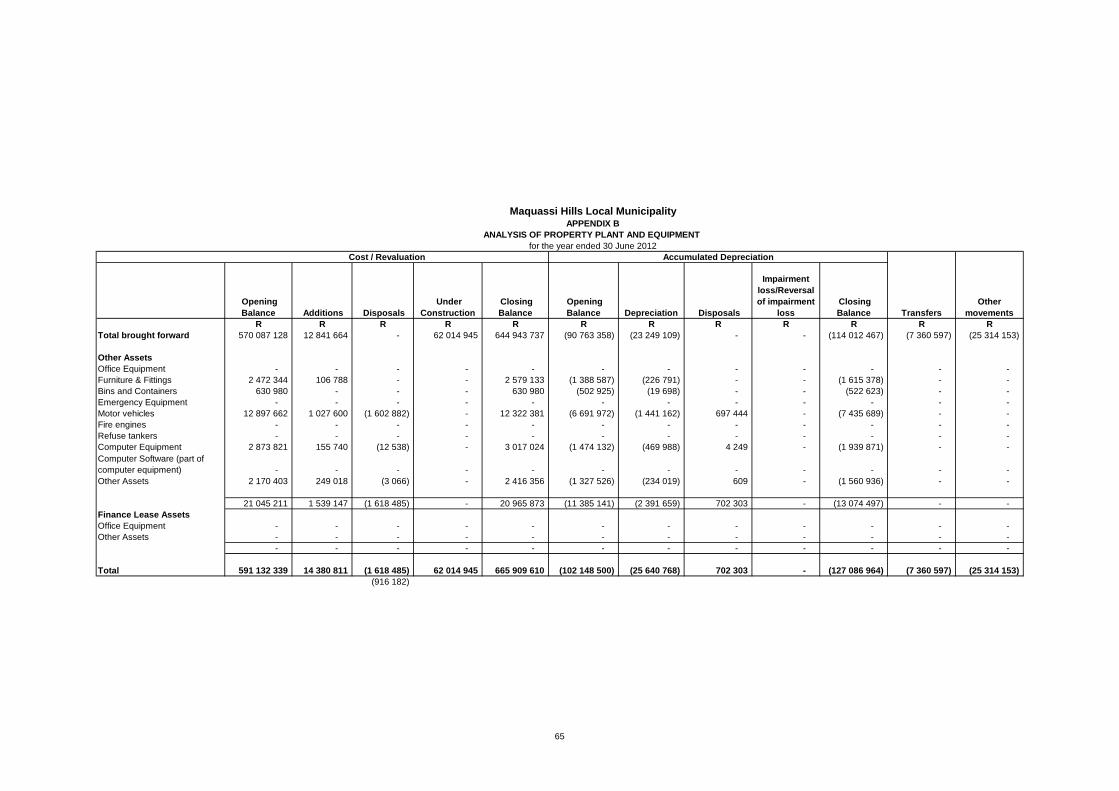
Opening Balance Additions Disposals
Under Construction
Closing Balance
Opening Balance Depreciation Disposals
Impairment loss/Reversal of impairment
loss Closing Balance
R R R R R R R R R R R RTotal brought forward 570 087 128 12 841 664 - 62 014 945 644 943 737 (90 763 358) (23 249 109) - - (114 012 467) (7 360 597) (25 314 153)
Other AssetsOffice Equipment - - - - - - - - - - - - Furniture & Fittings 2 472 344 106 788 - - 2 579 133 (1 388 587) (226 791) - - (1 615 378) - - Bins and Containers 630 980 - - - 630 980 (502 925) (19 698) - - (522 623) - - Emergency Equipment - - - - - - - - - - - - Motor vehicles 12 897 662 1 027 600 (1 602 882) - 12 322 381 (6 691 972) (1 441 162) 697 444 - (7 435 689) - - Fire engines - - - - - - - - - - - - Refuse tankers - - - - - - - - - - - - Computer Equipment 2 873 821 155 740 (12 538) - 3 017 024 (1 474 132) (469 988) 4 249 - (1 939 871) - - Computer Software (part of computer equipment) - - - - - - - - - - - - Other Assets 2 170 403 249 018 (3 066) - 2 416 356 (1 327 526) (234 019) 609 - (1 560 936) - -
21 045 211 1 539 147 (1 618 485) - 20 965 873 (11 385 141) (2 391 659) 702 303 - (13 074 497) - - Finance Lease AssetsOffice Equipment - - - - - - - - - - - - Other Assets - - - - - - - - - - - -
- - - - - - - - - - - -
Total 591 132 339 14 380 811 (1 618 485) 62 014 945 665 909 610 (102 148 500) (25 640 768) 702 303 - (127 086 964) (7 360 597) (25 314 153) (916 182)
TransfersOther
movements
Maquassi Hills Local MunicipalityAPPENDIX B
ANALYSIS OF PROPERTY PLANT AND EQUIPMENT for the year ended 30 June 2012
Cost / Revaluation Accumulated Depreciation
65
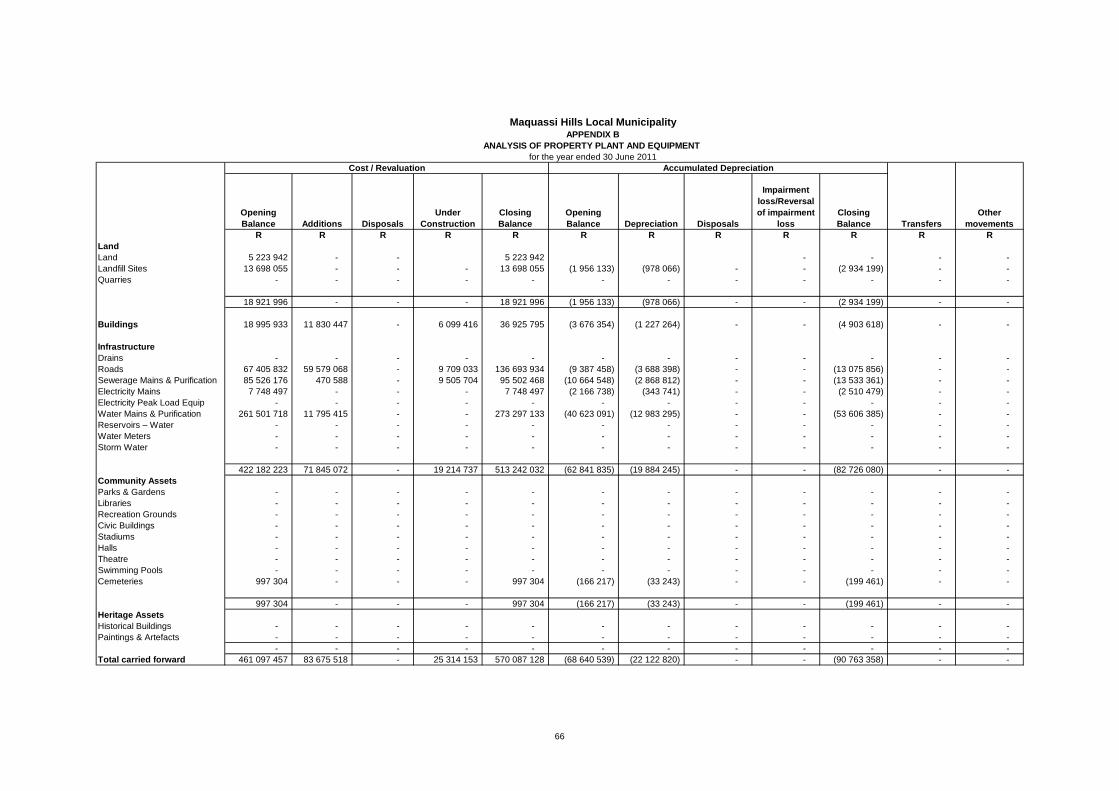
Opening Balance Additions Disposals
Under Construction
Closing Balance
Opening Balance Depreciation Disposals
Impairment loss/Reversal of impairment
lossClosing Balance
R R R R R R R R R R R RLandLand 5 223 942 - - 5 223 942 - - - - Landfill Sites 13 698 055 - - - 13 698 055 (1 956 133) (978 066) - - (2 934 199) - - Quarries - - - - - - - - - - - -
18 921 996 - - - 18 921 996 (1 956 133) (978 066) - - (2 934 199) - -
Buildings 18 995 933 11 830 447 - 6 099 416 36 925 795 (3 676 354) (1 227 264) - - (4 903 618) - -
InfrastructureDrains - - - - - - - - - - - - Roads 67 405 832 59 579 068 - 9 709 033 136 693 934 (9 387 458) (3 688 398) - - (13 075 856) - - Sewerage Mains & Purification 85 526 176 470 588 - 9 505 704 95 502 468 (10 664 548) (2 868 812) - - (13 533 361) - - Electricity Mains 7 748 497 - - - 7 748 497 (2 166 738) (343 741) - - (2 510 479) - - Electricity Peak Load Equip - - - - - - - - - - - - Water Mains & Purification 261 501 718 11 795 415 - - 273 297 133 (40 623 091) (12 983 295) - - (53 606 385) - - Reservoirs – Water - - - - - - - - - - - - Water Meters - - - - - - - - - - - - Storm Water - - - - - - - - - - - -
422 182 223 71 845 072 - 19 214 737 513 242 032 (62 841 835) (19 884 245) - - (82 726 080) - - Community AssetsParks & Gardens - - - - - - - - - - - - Libraries - - - - - - - - - - - - Recreation Grounds - - - - - - - - - - - - Civic Buildings - - - - - - - - - - - - Stadiums - - - - - - - - - - - - Halls - - - - - - - - - - - - Theatre - - - - - - - - - - - - Swimming Pools - - - - - - - - - - - - Cemeteries 997 304 - - - 997 304 (166 217) (33 243) - - (199 461) - -
997 304 - - - 997 304 (166 217) (33 243) - - (199 461) - - Heritage AssetsHistorical Buildings - - - - - - - - - - - - Paintings & Artefacts - - - - - - - - - - - -
- - - - - - - - - - - - Total carried forward 461 097 457 83 675 518 - 25 314 153 570 087 128 (68 640 539) (22 122 820) - - (90 763 358) - -
Maquassi Hills Local Municipality
Transfers
APPENDIX BANALYSIS OF PROPERTY PLANT AND EQUIPMENT
for the year ended 30 June 2011Cost / Revaluation Accumulated Depreciation
Other movements
66
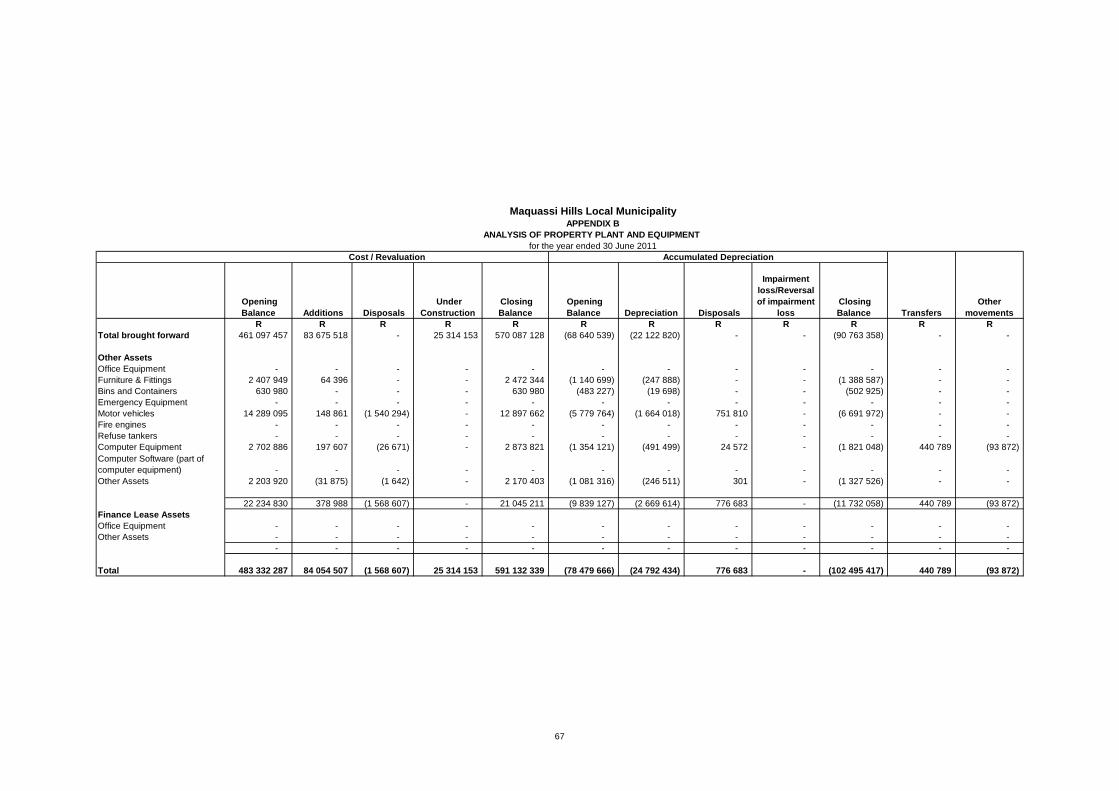
Opening Balance Additions Disposals
Under Construction
Closing Balance
Opening Balance Depreciation Disposals
Impairment loss/Reversal of impairment
loss Closing Balance
R R R R R R R R R R R RTotal brought forward 461 097 457 83 675 518 - 25 314 153 570 087 128 (68 640 539) (22 122 820) - - (90 763 358) - -
Other AssetsOffice Equipment - - - - - - - - - - - - Furniture & Fittings 2 407 949 64 396 - - 2 472 344 (1 140 699) (247 888) - - (1 388 587) - - Bins and Containers 630 980 - - - 630 980 (483 227) (19 698) - - (502 925) - - Emergency Equipment - - - - - - - - - - - - Motor vehicles 14 289 095 148 861 (1 540 294) - 12 897 662 (5 779 764) (1 664 018) 751 810 - (6 691 972) - - Fire engines - - - - - - - - - - - - Refuse tankers - - - - - - - - - - - - Computer Equipment 2 702 886 197 607 (26 671) - 2 873 821 (1 354 121) (491 499) 24 572 - (1 821 048) 440 789 (93 872) Computer Software (part of computer equipment) - - - - - - - - - - - - Other Assets 2 203 920 (31 875) (1 642) - 2 170 403 (1 081 316) (246 511) 301 - (1 327 526) - -
22 234 830 378 988 (1 568 607) - 21 045 211 (9 839 127) (2 669 614) 776 683 - (11 732 058) 440 789 (93 872) Finance Lease AssetsOffice Equipment - - - - - - - - - - - - Other Assets - - - - - - - - - - - -
- - - - - - - - - - - -
Total 483 332 287 84 054 507 (1 568 607) 25 314 153 591 132 339 (78 479 666) (24 792 434) 776 683 - (102 495 417) 440 789 (93 872)
Cost / Revaluation Accumulated Depreciation
TransfersOther
movements
ANALYSIS OF PROPERTY PLANT AND EQUIPMENT for the year ended 30 June 2011
Maquassi Hills Local MunicipalityAPPENDIX B
67
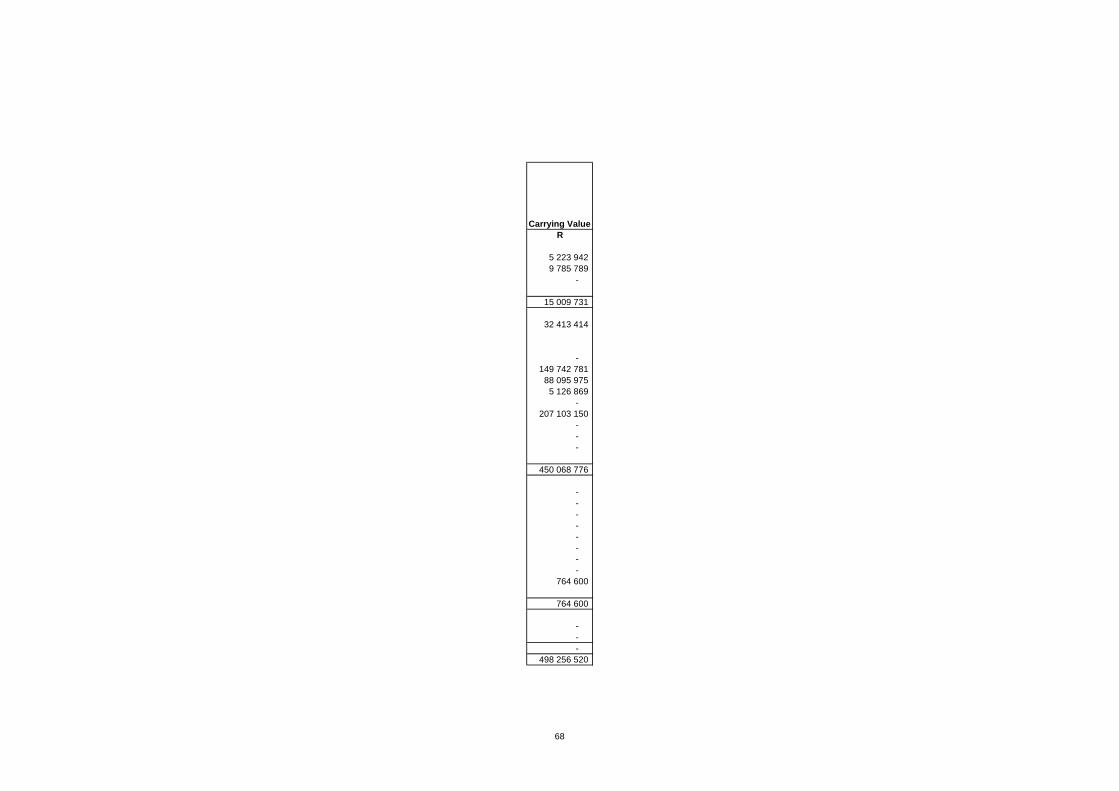
R
5 223 942 9 785 789
-
15 009 731
32 413 414
- 149 742 781
88 095 975 5 126 869
- 207 103 150
- - -
450 068 776
- - - - - - - -
764 600
764 600
- - -
498 256 520
Carrying Value
68
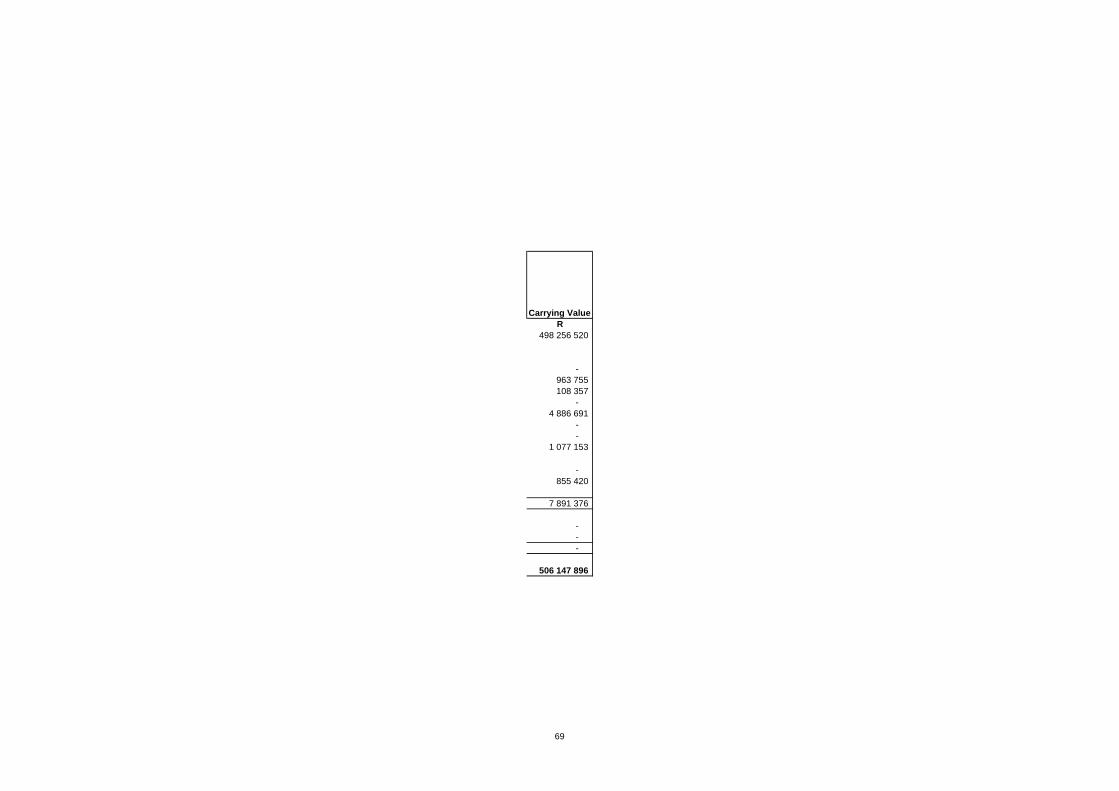
R498 256 520
- 963 755 108 357
- 4 886 691
- -
1 077 153
- 855 420
7 891 376
- - -
506 147 896
Carrying Value
69

R
5 223 942 10 763 855
-
15 987 797
32 022 177
- 123 618 078
81 969 108 5 238 018
- 219 690 748
- - -
430 515 952
- - - - - - - -
797 843
797 843
- - -
479 323 769
Carrying Value
70

R479 323 769
- 1 083 758
128 055 -
6 205 690 - -
1 399 690
- 842 877
9 660 070
- - -
488 983 839
Carrying Value
71
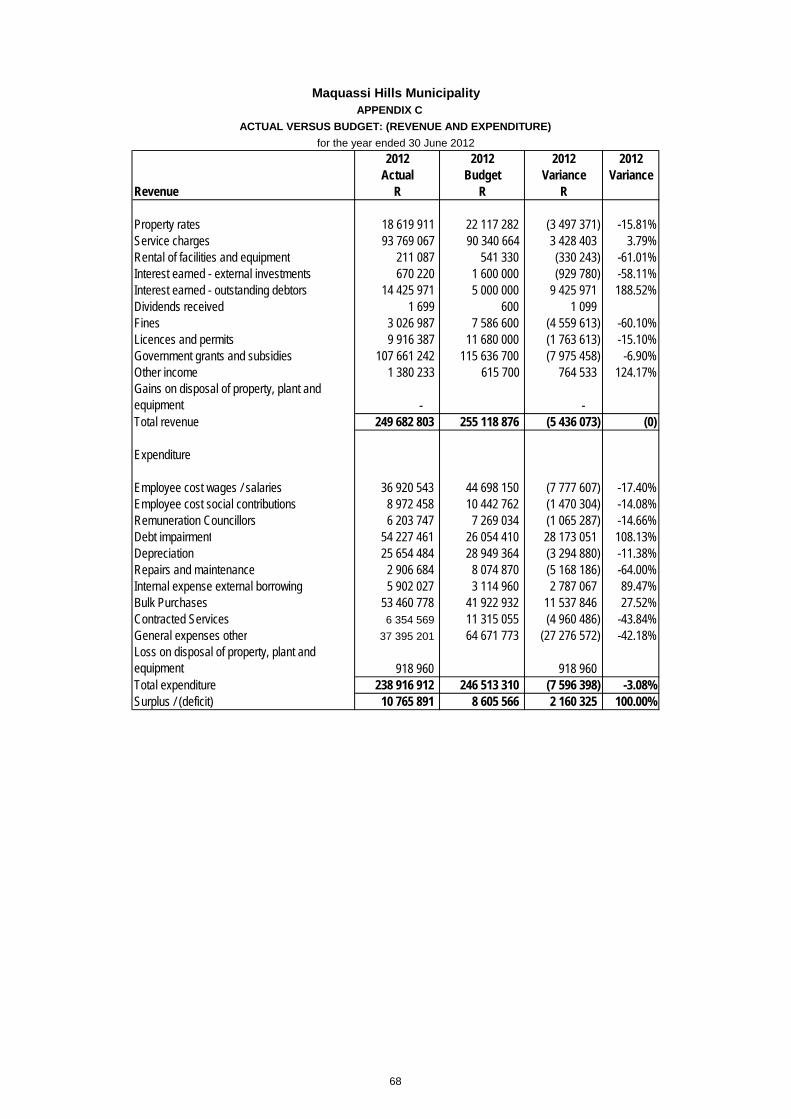
APPENDIX C
2012 2012 2012 2012Actual Budget Variance Variance
Revenue R R R
Property rates 18 619 911 22 117 282 (3 497 371) -15.81%Service charges 93 769 067 90 340 664 3 428 403 3.79%Rental of facilities and equipment 211 087 541 330 (330 243) -61.01%Interest earned - external investments 670 220 1 600 000 (929 780) -58.11%Interest earned - outstanding debtors 14 425 971 5 000 000 9 425 971 188.52%Dividends received 1 699 600 1 099 Fines 3 026 987 7 586 600 (4 559 613) -60.10%Licences and permits 9 916 387 11 680 000 (1 763 613) -15.10%Government grants and subsidies 107 661 242 115 636 700 (7 975 458) -6.90%Other income 1 380 233 615 700 764 533 124.17%Gains on disposal of property, plant and equipment - - Total revenue 249 682 803 255 118 876 (5 436 073) (0)
Expenditure
Employee cost wages / salaries 36 920 543 44 698 150 (7 777 607) -17.40%Employee cost social contributions 8 972 458 10 442 762 (1 470 304) -14.08%Remuneration Councillors 6 203 747 7 269 034 (1 065 287) -14.66%Debt impairment 54 227 461 26 054 410 28 173 051 108.13%Depreciation 25 654 484 28 949 364 (3 294 880) -11.38%Repairs and maintenance 2 906 684 8 074 870 (5 168 186) -64.00%Internal expense external borrowing 5 902 027 3 114 960 2 787 067 89.47%Bulk Purchases 53 460 778 41 922 932 11 537 846 27.52%Contracted Services 6 354 569 11 315 055 (4 960 486) -43.84%General expenses other 37 395 201 64 671 773 (27 276 572) -42.18%Loss on disposal of property, plant and equipment 918 960 918 960 Total expenditure 238 916 912 246 513 310 (7 596 398) -3.08%Surplus / (deficit) 10 765 891 8 605 566 2 160 325 100.00%
for the year ended 30 June 2012
Maquassi Hills Municipality
ACTUAL VERSUS BUDGET: (REVENUE AND EXPENDITURE)
68
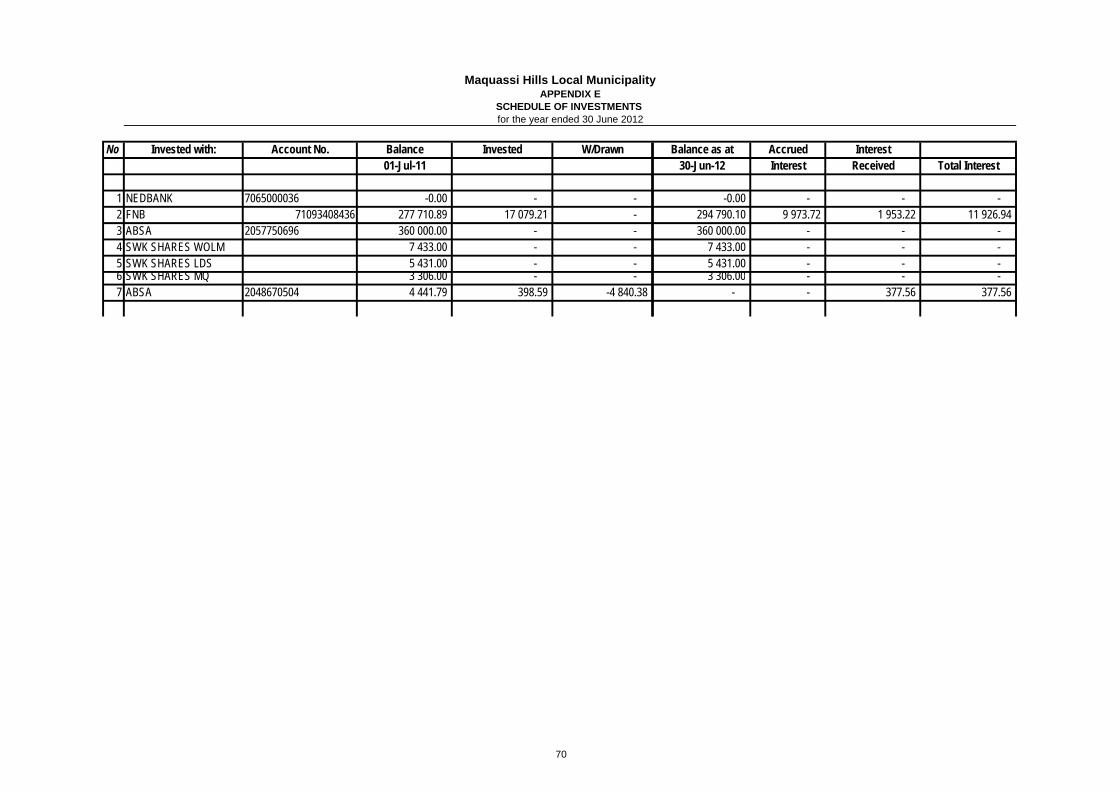
No Invested with: Account No. Balance Invested W/Drawn r Balance as at Accrued Interest01-Jul-11 30-Jun-12 Interest Received Total Interest
1 NEDBANK 7065000036 -0.00 - - -0.00 - - - 2 FNB 71093408436 277 710.89 17 079.21 - 294 790.10 9 973.72 1 953.22 11 926.94 3 ABSA 2057750696 360 000.00 - - 360 000.00 - - - 4 SWK SHARES WOLM 7 433.00 - - 7 433.00 - - - 5 SWK SHARES LDS 5 431.00 - - 5 431.00 - - - 6 SWK SHARES MQ 3 306.00 - - 3 306.00 - - - 7 ABSA 2048670504 4 441.79 398.59 -4 840.38 - - 377.56 377.56
Maquassi Hills Local Municipality
SCHEDULE OF INVESTMENTS for the year ended 30 June 2012
APPENDIX E
70