Embed Size (px)
Citation preview

African Development Bank 2005
Journal statistique africain
African Statistical Journal
November / Novembre 2005
Volume 1
AFDB-1-69.indd 1 11/1/05 8:17:49 PM

African Development Bank 20052
Contents
Foreword . . . . . . . . . . . . . . . . . . . . . . . . . . . . . . . . . . . . . . . . . . . . . . . . . . . . . . . . . . . . . . . . . . . . . . . . . . . . . . . . . . . . . . . . . . . . . . . . . . . . . . . . . . . . . . . . . . . .4
Preface . . . . . . . . . . . . . . . . . . . . . . . . . . . . . . . . . . . . . . . . . . . . . . . . . . . . . . . . . . . . . . . . . . . . . . . . . . . . . . . . . . . . . . . . . . . . . . . . . . . . . . . . . . . . . . . . . . . . . .8
1. Relevance of the National Strategy for the Development of Statistics (NSDS) Approach to Statistical Development in Africa . . . . . . . . . . . . . . . . . . . . . . . .12
Antoine Simonpietri and Tony Williams
2. Using the GDDS to Build Statistical Capacity in Africa . . . . . . . . . . . . . . . . . . . . . . . . . . . . . . . . . . . . . . . . . . . . . . . . . . . . . . . . . . . . . . . . . . . . . . . . . . . . . .18
Graham Eele and Oliver Chinganya
3. Strengthening Statistical Capacity in African Countries under the Framework of the International Comparison Program for Africa (ICP-Africa) . . . . . . . . . .30
Charles Leyeka Lufumpa and Michel Mouyelo-Katoula
4. Statistics South Africa in transition: Reflections on a Decade of Statistical Practice (1994-2004) . . . . . . . . . . . . . . . . . . . . . . . . . . . . . . . . . . . . . . . . . . . . . .48
Pali Lehohla
5. A Case and Some Actions for Improving Statistical Advocacy in Poor Developing Countries . . . . . . . . . . . . . . . . . . . . . . . . . . . . . . . . . . . . . . . . . . . . . . . . . .70
Ben Kiregyera
6. Experience with GPS Equipment in Measuring Crop Areas: The Case of Uganda . . . . . . . . . . . . . . . . . . . . . . . . . . . . . . . . . . . . . . . . . . . . . . . . . . . . . . . . . . .90
E.S.K. Muwanga-Zake and J.B. Magezi-Apuuli
7. Preparation for Egypt’s Population and Housing Census: Data Processing Challenges . . . . . . . . . . . . . . . . . . . . . . . . . . . . . . . . . . . . . . . . . . . . . . . . . . . . .104
Bahy El-Din Abdel-hamid Mortagy and Nevine Nagu-ib Hegazy
8. General Data Dissemination System (GDDS) Project for Anglophone Africa . . . . . . . . . . . . . . . . . . . . . . . . . . . . . . . . . . . . . . . . . . . . . . . . . . . . . . . . . . . . .114
Oliver J.M Chinganya
9. SADC / World Bank Project on Statistical Capacity Building for Poverty Reduction Strategies . . . . . . . . . . . . . . . . . . . . . . . . . . . . . . . . . . . . . . . . . . . . . . . .116
Helena Nthibe
10. Communauté Economique des Etats de l’Afrique de l’Ouest : Activités statistiques du Secrétariat Exécutif de la CEDEAO relatives au
renforcement des capacités des Etats membres . . . . . . . . . . . . . . . . . . . . . . . . . . . . . . . . . . . . . . . . . . . . . . . . . . . . . . . . . . . . . . . . . . . . . . . . . . . . . . . . . .120
Akou Adjogou
11. Statistical Training at the Institute of Statistics and Applied Economics, Makerere University . . . . . . . . . . . . . . . . . . . . . . . . . . . . . . . . . . . . . . . . . . . . . . .124
Jonathan Odwee
Editorial Policy . . . . . . . . . . . . . . . . . . . . . . . . . . . . . . . . . . . . . . . . . . . . . . . . . . . . . . . . . . . . . . . . . . . . . . . . . . . . . . . . . . . . . . . . . . . . . . . . . . . . . . . . . . . . . .132
AFDB-1-69.indd 2 11/1/05 8:30:17 PM


African Development Bank 20058
Preface
The need for more reliable and timely statistical information has taken on a higher profile in recent years in response to the increased emphasis placed on the results-based agenda which includes specific sectoral programs, the Poverty Reduction Strategies (PRSPs) that countries are designing and implementing, Millennium Development Goals (MDGs) which countries have signed up to and other national development plans. This agenda requires clear, unambiguous and systematic measure-ment and reporting on achievement of outputs, outcomes and impact of development policies and programs. The results-based agenda which is data intensive has brought to bare longstanding statistical capacity and data quality issues, and cre-ated a new urgency for improving statistical systems in Africa.
Some of the issues that have hindered improvement of statistical systems in Africa include, inter alia, lack of or limited awareness about the role of statistics to society; weak links between data producers, users and policy makers; limited gov-ernment commitment to and investment in statistical development; quick fix and piece-meal approaches to statistical de-velopment which have sacrificed long-term planning and capacity building for meeting short-term data needs; limited co-ordination and synergy in statistical production; limited management, data analysis and communication skills in statistical agencies; and inadequate teaching of official statistics in training institutions.
These inadequacies have translated into inability by national statistical systems to meet user needs for various purposes in-cluding evidence-based public policy analysis and design which requires that public policy decisions are informed by careful and rigorous analysis using sound and transparent statistics. This situation has also constrained decision-making at many levels and hindered informed public debate.
The African Statistical Journal is intended to foster improved communication and contact between analysts and policy mak-ers and data producers in Africa. It is being established also to serve as a research outlet and information sharing publica-tion among academic and practicing statisticians mainly in Africa.
The Journal aims to promote the understanding of statistical development in the African region and will, among other, things publish:
• articles on statistical methodologies with special emphasis on applications,• articles about best practices and lessons learned from the region,• opinions on issues of general interest to the statistical community in the African region,• notices and announcements on upcoming events, conferences, call for papers; recent statistical developments and any-
thing that may be of interest to the statistical community.
The Journal is bi-lingual and will be published bi-annually. It is expected that it will serve as a convenient volume for statis-tical reference at home, in schools and in professional work.
Dr. Charles Leyeka Lufumpa Professor Ben KIREGYERAManager, Statistics Division Development Information ConsultantsCo-Chair, ASJ Co-Chair, ASJAfrican Development Bank Group Uganda Bureau of StatisticsTunis, Tunisia Kampala, Uganda
AFDB-1-69.indd 8 11/1/05 8:17:50 PM

African Development Bank 200510
Préface
Le besoin en données fiables et disponible à temps a pris de l’ampleur ces dernières années en réponse à l’accent accru mis sur la mise en place du cadre de mesure des résultats qui comprend des programmes sectoriels spécifiques, les cadres stratégiques de réduction de la pauvreté (CSRP) en cours de conception et de mise en œuvre par les pays, les Objectifs du Millénaire pour le Développement (OMD), auxquels les pays ont souscrit, et d’autres plans nationaux de développement. Ce cadre exige la mise en place d’un dispositif clair, non ambigu et systématique de mesure et d’information sur les out-puts, les résultats et l’impact des politiques et programmes de développement. Le cadre de mesure des résultats qui exige un volume important de données a fait resurgir les questions pendantes concernant la qualité des données et les capacités statistiques, et a créé une urgence nouvelle d’amélioration des systèmes statistiques en Afrique.
Les pesanteurs qui ont entravé l’amélioration des systèmes statistiques en Afrique comprennent, entre autres : la prise de conscience inexistante ou limitée du rôle de la statistique dans la société; la faiblesse des relations entre les producteurs de données, les utilisateurs et les décideurs, l’engagement et l’investissement limités des gouvernements dans le développe-ment statistique ; les expédients et approches de développement statistique au coup par coup utilisés au détriment de la planification à long terme et du renforcement des capacités comme réponses aux besoins de données à court terme ; une coordination et une synergie limitées dans la production statistique ; les compétences limitées des agences statistiques dans les domaines de la gestion, de l’analyse des données et de la communication; et l’enseignement inadapté des statistiques officielles dans les institutions de formation.
Ces insuffisances se sont traduites par une incapacité pour la plupart des systèmes statistiques nationaux à satisfaire les besoins divers des utilisateurs y compris l’analyse et la conception de politiques basées sur les résultats qui exigent que les décisions de politique publique soient renseignées par des analyses minutieuses et rigoureuses basées sur des statistiques fiables conçues dans un cadre transparent. Cette situation a également limité la prise de décision à tous les niveaux et n’a pas favorisé l’établissement d’un débat public basé sur l’information.
Le Journal Statistique Africain (JSA) vise à stimuler la communication et à renforcer le contact entre les analystes, les décideurs et les producteurs de données en Afrique. Il a été conçu pour servir comme une publication de recherche et d’échanges d’informations entre les universitaires et les professionnels de la statistique principalement en Afrique.
Le Journal a pour objectif de favoriser la compréhension du développement statistique dans la région africaine et publie-ra entre autres:
• des articles sur les méthodologies statistiques avec un accent particulier sur leurs applications, • des articles sur les meilleures pratiques et les leçons tirées de la région, • des avis sur des questions d’intérêt général pour la communauté statistique de la région Afrique, • des informations et des annonces sur les prochains événements, les conférences, les appels à contribution, les dével-
oppements récents en matière statistique et tout autre aspect susceptible d’intéresser la communauté statistique.
Le Journal est bilingue et sera publié semestriellement. Il est conçu pour servir comme document de référence statistique à domicile, dans les écoles et dans le cadre professionnel.
AFDB-1-69.indd 10 11/1/05 8:17:50 PM

African Development Bank 2005 11
Préface
Dr. Charles Leyeka Lufumpa Chef de la division statistique Co-Président, JSA Groupe Banque Africaine de Développement Tunis, Tunisie
Professeur Ben KIREGYERA
Development Information ConsultantsCo-Président, JSA
Bureau des statistiques de l’Ouganda
Kampala, Ouganda
AFDB-1-69.indd 11 11/1/05 8:17:50 PM

African Development Bank 200512
1: Manager, PARIS21 Secretariat, Rue Andre Pascal, 75775, PARIS Cedex 16. e-mail address: contact@ paris21.org
2: Senior Advisor PARIS21 Secretariat Rue Andre Pascal, 75775, PARIS Cedex 16. e-mail address: contact@ paris21.org2
Summary The most compelling evidence of the relevance of the NSDS approach to Africa is that the approach was born in Africa. NS-DSs have their roots in the Addis Ababa Plan of Action for Statistical Development in Africa in the 1990s (AAPA). Making the transition to evidence-based policy-making and improving statistical systems can best be achieved through designing and implementing a demand-driven, user-fo-cused national statistical development plan. This was recog-nised by the au-thors of the Addis Ababa Plan and remains true today. An evaluation in 2001 of statistical development in Africa found that the AAPA had not achieved the scale of improvements needed in statistical capacity. Lessons have been learnt and NSDSs face both a more favourable and a more challenging environment for statistics. A good strat-egy, adequately funded and successfully implemented can lead to a step increase in the performance of the NSS and help those countries trapped in the vicious cycle of under funding and under performance to break free.
Key words
PARIS21, strategic planning, national statistical systems
1. Addis Ababa Plan of Action for Statistical Development in Africa in the 1990s and its implementation
The AAPA was prepared by the UN’s Economic Commission for Africa because, by the end of the 1980s, the level and quali-ty of statistics in most African countries had deteriorated over the previous decade due to a variety of factors. The objectives of AAPA were comprehensive, including to improve awareness of the importance of statistics among users and to improve the timeliness, quality and relevance of statistics produced in African countries. The AAPA stressed the need for demand-driven, user-focused national statistical development plans, referred to then as Needs Assessments and Strategy Develop-ment (NASD). The AAPA and subsequently a strategy for its implementation were adopted by the ECA Conference of Min-isters in May 1990 and April 1992 respectively.
An evaluation in 2001 of statistical development in Africa in the context of the Addis Ababa Plan of Action found that the AAPA and its strategy for implementation were both excellent and the Plan had many achievements against a background of new or heightened challenges for Africa, such as HIV/AIDS, poverty and conflict. But in many countries statistical systems remained weak and vulnerable with insufficient budgets, under-staffing and low staff morale; and with generally poor co-
Relevance of the National Strategy for theDevelopment of Statistics (NSDS) Approach
to Statistical Development in Africa
Antoine Simonpietri1 and Tony Williams2
AFDB-1-69.indd 12 11/1/05 8:17:50 PM

African Development Bank 2005 13
ordination and leadership of the national statistical system. In most cases no formal and systematic mechanisms had been established for assessing the requirements of data users.
The evaluation noted that:
• The Addis Plan had not been effectively followed up or publicised, popularised and owned by stakeholders within coun-tries and lacked government commitment
• Policy and decision-makers had not recognised the strategic importance of statistics and NSOs were largely margin-alised in national policy formulation
• A number of countries had produced national statistical development plans but generally these were not sufficient-ly flexible to address the new challenges and did not tackle institutional/organisational issues, or attract increased re-sources for statistical capacity building
• Although donor programmes played a key role in keeping important statistical activities running in a number of coun-tries, they focused mainly on immediate data needs rather than longer term statistical development and not all donor assistance had been well coordinated between donors
The evaluation team recommended:
• Persuading key stakeholders about the strategic importance of statistics in relation to African development, including through statistics “champions”, and making better linkages between statistics and development policy
• National statistical development plans should review legislation and consultation and coordination mechanisms as well as putting in place appropriate institutional and human resource policies and adequate financial and material resources
• Donor support for national efforts in building up systems and capacity should be driven by overall national development plans and provided through coordinated, predictable, simplified and harmonised financing
The evaluation team noted the potential for the Partnership in Statistics for Development in the 21st Century (PARIS21) to become a partner in developing an evidence-based culture for setting and monitoring policy and developing well-managed national statistical systems.
2. Higher profile of statistics
The late 1990s and the early part of the 21st century have been marked by the emergence of what is both a more favourable and a more challenging environment for statistics. Compared with the beginning of the 1990s, the decade targeted by the Ad-dis Plan, there is now greater emphasis, both by developing countries and by the international community, on evidence-based policy-making including the need to focus development efforts on measurable results. There is now stronger demand for statis-tics to provide a basis for measuring and monitoring the development goals, targets, and indicators set out in countries’ Poverty Reduction Strategies (PRSs) and in the internationally endorsed Millennium Development Goals (MDGs); and there is more focus generally on governance and accountability of governments, including by a more demanding media and civil society in Africa. In many countries, the processes of preparing PRSs or other national policy frameworks have provided an important op-portunity to identify data gaps and weaknesses and to highlight the priority areas where investment and improvements are needed. But, as observed in the evaluation of the Addis Plan, despite stronger demand, resources for statistical devel-
Relevance of the National Strategy for the Development of Statistics (NSDS) Approach to Statistical Development in Africa
AFDB-1-69.indd 13 11/1/05 8:17:51 PM
African Development Bank 200514
opment have not expanded sufficiently to meet those increased policy needs. National statistical systems are generally still not well equipped to meet these requirements; and the countries that need good statistics most are among those with the weakest information systems and least able to afford them. Careful decisions need to be made about how best to develop statistics most effectively and efficiently and reform is often required across the whole national statistical system. A strate-gic, prioritised and realistic approach is needed and the participatory approaches of Poverty Reduction Strategies provide valuable insights into how strategies for the development of statistics should be prepared and implemented. This was highlighted at the second international Roundtable on Managing for Development Results, held in Marrakech, Morocco, in February 2004, which stressed the importance of strategic approaches to statistical development, integrated with other major development concerns. The Marrakech Action Plan for Statistics set a target for all low income countries to have national strategies for the development of statistics by 2006 and to have started to implement them by the follow-ing year. The aim was to support the design, management, monitoring, and evaluation of national policy frameworks and to have high-quality, locally-produced data for the next major review of the MDGs in 2010.
3. Status of statistical strategies
Most countries already have a statistics plan in one form or another but, as observed by the AAPA evaluation, in most cases these were not sufficiently flexible to tackle new challenges and did not put in place the institutional/organisational chang-es, nor the increased resources needed to build capacity and sustain improvements in statistical systems and outputs. For instance, a baseline assessment of the status of statistical strategies in Anglophone Africa completed in May 2005 found that 15 out of 22 countries had a statistics strategy or master plan. But, despite the existence of the plans, the PRS review processes of most of the countries concerned still identified serious weaknesses in their statistical systems. Further analy-sis showed that fewer than half of the plans covered statistics produced by the key line ministries of health, education and agriculture. The baseline assessment also noted that most plans identified the need for reforms to statistical legislation and governance arrangements for statistical systems, and these take time to change.
4. National Strategies for the Development of Statistics (NSDSs)
The PARIS21 Secretariat has produced guidelines for national strategies that drew on the experience of African and inter-national partners, including from statistical improvement programmes such as implementation of the IMF’s General Data Dissemination System (GDDS) and through the design and implementation of national statistical development plans fund-ed for instance through the World Bank’s Trust Fund for Statistical Capacity Building and STATCAP, an IDA lending facility for statistical capacity building; as well as from national and bilateral donor supported programmes. The guidelines envis-age the development of an NSDS as a carefully managed, dynamic and consultative process. The process is often at least as important as the strategy itself in order to: raise the profile of statistics, involve stakeholders, build government and donor awareness and commitment to improving statistical services, build a shared vision and ownership of statistical improvement programmes, change perceptions and develop understanding of modern management practices. The design process will vary from country to country but typically the process starts with building political commitment and planning of the NSDS design process (a “road map”). This is followed by an assessment of the current situation with re-spect to user needs, existing statistical systems and outputs and organisational arrangements. This would be drawn upon
Antoine Simonpietri and Tony Williams
AFDB-1-69.indd 14 11/1/05 8:17:51 PM

African Development Bank 2005 15
to develop an agreed vision for the future of the national statistical system and strategies for how to achieve the vision, in-cluding action plans coupled with realistic assessments of resource needs, which fit within the PRS timetable and funding framework (where these exist).
A good strategy will take account of, and build upon, what is already in place and in progress in each country. In this way, the NSDS is not another initiative. It is a consolidation and strategic improvement of all existing activities. The NSDS can pro-vide the much-needed coherence framework, which may take many forms depending on the stage of development of each statistical system and their needs and perspectives. The value added of the NSDS approach is that it:
• Draws on existing best practice in statistical planning and improvement, covering the whole national statistical system, building on the UN Fundamental Principles for Official Statistics, good practice in technical cooperation, and existing statistical assessment and improvement processes
• Incorporates lessons learnt about inclusive, participatory development processes such as from the development of Pov-erty Reduction Strategies
• Follows best modern practice in organisational development and management
The NSDS approach looks at statistical capacity building through a development and management lens; and looks at devel-opment policy and optimal management practices through a statistical lens – all in pursuit of better development results.
Some countries have already demonstrated that statistics can be improved through a national strategy for the development of statistics that (a) covers the whole national statistical system, (b) is integrated into national policy and resource alloca-tion processes and (c) is included in the policy dialogue between developing countries and donors. Statistical capacity build-ing plans can cover the whole of the national statistical system or be sequenced to focus on specific areas of priority need. In some cases strategies have concentrated initially on organisational issues; others have been concerned with priority sub-ject areas such as poverty monitoring. But, however action plans are focused, the strategic planning process and priority setting should be positioned within the context of the whole national statistical system. One good example is Mozambique where, prior to the mid-1990s, development was held back by conflict. Mozambique has a strategic plan covering the pe-riod 2003-2007, which is linked closely to their national poverty reduction strategy (PARPA). Long-term donor-supported statistical development programmes have focused on the national statistical institute (INE) but with a wider perspective of supporting development of the whole national statistical system (SEN) through INE. Another is Uganda, where the initial focus was on firmly establishing the semi-autonomous Uganda Bureau of Statistics, which is now extending its corporate plan into a strategy for the entire statistical system.
5. Conclusion
The relevance to Africa of the NSDS approach is that this can make a key contribution in the transition to evidence-based policy-making and in improving national statistical systems. NSDSs are needed now in Africa at least as much as Needs As-sessments and Strategy Development (NASDs) were in 1990. Experience has demonstrated that a good strategy backed by government commitment and strong leadership, which is adequately funded and successfully implemented, will make a big difference to the perfor-mance of a national statistical system and help those countries locked in the vicious cycle of under funding and under performance to break free.
Relevance of the National Strategy for the Development of Statistics (NSDS) Approach to Statistical Development in Africa
AFDB-1-69.indd 15 11/1/05 8:17:51 PM

African Development Bank 200516
References
ECA (1990): Addis Ababa Plan of Action for Statistical Development in Africa in the 1990s
Enock Chinganda, ECA: Towards improving official statistics in Africa for the nternational Statistical Institute session in 1999.
ECA (2001): Assessment of the implementation of the Addis Ababa Plan of Action for Statistical Development in Africa in the 1990s (ECA/DISD/CODI.2/11).
Multilateral Development Banks (2004): The Marrakech Action Plan for Statis-tics, Second International Roundtable on Managing for Development Results.
PARIS21 Secretariat (2004): National Strategy for the Development of Statistics (NSDS) Documentation, www.paris21.org.
PARIS21 Secretariat (2005); Measuring up to the measurement problem, the role of statistics in evidence-based policy-making, prepared by Chris Scott, London
School of Economics
PARIS21 Secretariat (2005): Status of Statistical Strategies in Anglophone Africa, baseline study prepared by Mary Strode
Antoine Simonpietri and Tony Williams
AFDB-1-69.indd 16 11/1/05 8:17:51 PM

African Development Bank 2005 17
Relevance of the National Strategy for the Development of Statistics (NSDS) Approach to Statistical Development in Africa
AFDB-1-69.indd 17 11/1/05 8:17:51 PM

African Development Bank 200518
1: Senior Statistician, World Bank, [email protected]
2: IMF Resident Coordinator, GDDS Project, Kenya, [email protected]
Summary The General Data Dissemination System (GDDS) provides a broad framework for statistical development. It covers social and demographic as well as economic data sets and provides a focus on data quality and dissemination. Since its launch in 1997 it has proved to be a robust and flexible framework, not only for documenting current procedures and practices, but also to identify where improvements are needed. For many developing countries it has proved to be an important starting point for a more comprehensive and strategic approach to statistical development and capacity building. The paper discusses how, by participating in the GDDS, a number of developing countries have been able to build capacity and improve the availability of indicators generally. It also shows how the framework has provided a basis for strategic planning and identifies ways in which the synergy between participation in the GDDS and building sustained statistical capacity could be strengthened.
Key Words:
National strategies; Global monitoring; Standards; Poverty reduction strategies
1. The General Data Dissemination System
1.1. Background and History
The work by the International Monetary Fund to develop standards to guide countries in the compilation and dissemination of economic and financial statistics arose as a direct result of the financial crises of the mid-nineties. It was recognized that an important contributing factor to the crises was the lack of reliable, good quality, comprehensive statistics on the state of economies and the operations of financial and other markets that could be compared across regions and countries. The importance of good statistics in being able to identify, at an early stage, the potential for instability and turbulence in mar-kets and in indicating the need for intervention and action was clear. In 1995, therefore, the Fund’s Statistics Department under direction from the Executive Board started work on the development of standards to guide countries in their statisti-cal work and to help improve the quality and comparability of key economic and financial indicators.
From an early stage it was clear that a two-tier process would be needed. On the one hand, countries with relatively so-phisticated economic and financial systems and requiring access to international financial markets had specific needs. On the other hand, though, it was recognized that many counties, especially the least developed, did not have a well estab-lished statistical infrastructure and were unlikely to be able to access financial markets for some time to come. It was de-cided, therefore, to develop the Special Data Dissemination Standard (SDDS) for the first set of countries and this was ap-
Using the GDDS to build statistical capacity in Africa
Graham Eele1 and Oliver Chinganya2
AFDB-1-69.indd 18 11/1/05 8:17:51 PM

African Development Bank 2005 19
proved by the Executive Board at the end of March 1996. The second tier, entitled the General Data Dissemination System (GDDS), was formally approved about a year later.
The primary reference source setting out the structure and objectives of the system is the GDDS Document, (IMF, 2003). This has been updated from time to time to reflect changes and to ensure that the system remains relevant and useful. Reviews of the data standards are conducted at regular intervals and changes to the system are reflected in the Document and are ap-proved by the IMF’s Executive Board. Recent development include: extending coverage to data on external debt and debt ser-vicing in 2000; the launch of the GDDS web-site (IMF, 2004) in May 2000 to publish inform the public about a country’s par-ticipation and to provide information on current statistical practices and procedures; and, in 2003, to give explicit recognition to the Millennium Development Goal indicators3 and the development of appropriate statistical and monitoring systems.
1.2. Overview of the GDDS
The GDDS is a structured framework that countries participate in voluntarily. Its aim is to help countries improve the quali-ty of the data and indicators produced and disseminated by national statistical systems. While it includes recommendations on the methods and procedures to be used to collect and compile official statistics as well as on the frequency with which key indicators are disseminated, the crucial point is that participating countries themselves decide on their own priorities for development and on the pace at which they propose to implement the recommendations. Although participation in the GDDS is seen as a way for countries to develop their statistical systems so that they can achieve the special data dissemi-nation standards, it is recognized that not all countries will be able to or will want to migrate to the SDDS in the short to medium term. It is designed to be flexible and relevant to the needs of countries right at the beginning of developing a co-herent statistical system as well as those with much better developed institutions and data processes.
The GDDS is consistent with other frameworks and recommendations designed to support the development of statistical systems and the use of sound data collection, compilation and dissemination practices. It is, for example, fully consistent with the United Nation’s Fundamental Principles of Official Statistics (UNSD, 2003) and provides a practical way to put these into practice. It is also coordinated with the frameworks for economic and financial statistics, including the System for National Accounts (SNA).
To support the development of national statistical systems to meet the needs of economic management, the monitoring of poverty reduction strategies and international reporting, the GDDS focuses on three key areas: the quality of the data; dis-semination of statistics for public use; and the development of plans for improvement. Under the quality heading the main objective is to support the development of the systems that produce and disseminate statistics, in accordance with good prac-tice and international recommendations, where relevant. The emphasis is on the procedures and practices of the agencies collecting and compiling the data as well as the attributes of the indicators themselves. The inclusion of development plans ensures that the system is dynamic and is relevant as statistical systems change in line with changing demand. The empha-sis is three-fold, covering diagnosis of current methods and procedures, the formulation of action plans with specific time frames and tracking progress.
Using the GDDS to build statistical capacity in Africa
3: The GDDS now incorporates 23 of the 48 MDG indicators that are usually generated by national statistical systems and which come within the scope of the system
AFDB-1-69.indd 19 11/1/05 8:17:51 PM

African Development Bank 200520
As already indicated participation in the GDDS is voluntary and depends on three actions. First, countries indicate their for-mal commitment to using the GDDS as a framework for statistical development. Second, they nominate a country coordi-nator who works with Fund and Bank staff as well as the different agencies involved in the collection and compilation of official statistics. Third, countries prepare metadata, or detailed descriptions of their current statistical practices as well as plans for both short and longer-term improvements. These metadata are then published by the IMF on the Data Standards Bulletin Board.
The descriptions of current methods and practices as well as the plans for improvement are discussed in the GDDS in four dimensions that cover: data coverage, periodicity and timeliness; data quality; procedures to ensure the integrity of the data and to ensure the confidence of users; and access by the public. Data coverage includes economic, financial and socio-de-mographic data, and includes discussion of the broad frameworks used, where relevant, as well as core indicators. Econom-ic and financial data cover national accounts, central government operations, money and banking and the external sector. Socio-demographic data concerns statistics on population, health, education and poverty.
1.3. Comparing the SDDS and the GDDS
Although both the SDDS and GDDS were developed as part of the same response to the financial crises of the nineties and both are designed to promote the compilation and dissemination of better quality data for users, in practice there are im-portant differences and, over time, they have tended to fill different functions. First, the SDSS is a standard that countries have to meet before they can participate. Once countries are SDDS subscribers, they must maintain the prescribed standards and meet the requirements of the system, but there is no assumption of development beyond this. Further development in data quality, coverage and dissemination may well take place in response to demand from data users, but this is neither a requirement nor a component of participation. The GDDS, on the other hand, is specifically a system or a framework for the development of statistics. Countries may subscribe whatever their level of statistical development. Participating countries include those with relatively sophisticated and well developed statistical systems such as China and others, such as Angola and the Democratic Republic of the Congo, where statistical systems are rudimentary at best.
Second, as a standard, countries participating in the SDDS are required to meet the requirements for data compilation and dissemination in all sectors before they can subscribe. There is no possibility of countries deciding, for example, to concen-trate on improving real sector statistics at the expense of balance of payments data. By taking part in the GDDS, however, countries agree to develop their statistics in line with the overall framework, but the pace of change and the priority areas for development are decided in line with national priorities. A participating country with limited resources may decide, for example, to concentrate on the development of poverty statistics and delay the compilation of a producer price index.
Third, the plans for improvement in the different data categories are core components of the GDDS, which are not found in the SDDS. In particular, the plans represent specific improvements that countries would like to implement and also identify what additional resources may be required to put them into effect. Since the GDDS does not cover all data areas or all data producing agencies, these plans do not represent a comprehensive strategy for statistical development in a country. They do, however, indicate in a structured way what is being proposed in both the short and longer-term.
Fourth, the GDDS incorporates social and demographic statistics, while the SDDS focuses exclusively on economic and fi-nancial data. This reflects, of course, the different purposes of the two, with the SDDS being concerned with those data
Graham Eele and Oliver Chinganya
AFDB-1-69.indd 20 11/1/05 8:17:52 PM

African Development Bank 2005 21
items and underlying systems that are of most importance to financial markets. The key socio-demographic statistics in the GDDS, on the other hand, while not all-encompassing, nevertheless do cover most of the main data areas of interest and concern to users in developing countries. Data on population, health, education and poverty, for instance, cover a substan-tial proportion of those MDG indicators generated by national statistical systems as well as many of the indicators used to monitor the implementation of poverty reduction strategies.
1.4. Cooperation between the World Bank and the IMF
The inclusion of socio-demographic statistics in the GDDS has undoubtedly broadened the extent to which it can be used to support statistical development, but has required the IMF to cooperate closely with the World Bank both to develop the framework and to support its implementation. As the GDDS was being developed, an early decision was taken to bring the World Bank into the process, since the IMF did not have expertise in any of the socio-demographic data categories. Since 1999, the Bank has cooperated with the Fund, first to develop the framework and particularly the socio-demographic parts of the GDDS guide [2, op.cit] and second to provide both technical and, in some cases, financial support to countries inter-ested in participating, This has taken the form of ad-hoc arrangements responding to demand for assistance from countries and, more recently, in the development and implementation of joint sub-regional development projects.
1.5. The GDDS as a Framework for Statistical Development
Since its inception, the GDDS has proved to be popular, with more and more countries participating. By August 1, 2005, 79 countries were full participants in the GDDS and had posted their metadata. Table 1 shows the distribution of countries participating by World Bank region.
The flexibility of the GDDS and the utility to countries in subscribing is indicated by the level of participation as shown in Table 1. In sub-Saharan Africa for example, more than 80 per cent of countries participate, while in Latin America and the
Using the GDDS to build statistical capacity in Africa
Table 1: Distribution of GDDS and SDDS Subscribers by Region as of August 1, 2005
Number of Borrowing Countries
SDDS Subscribers GDDS Subscribers
Africa (Sub-Sahara) 47 1 39
East Asia and the Pacific 21 4 8
Europe and Central Asia 30 19 6
Latin America and the Caribbean 32 9 17
Middle East and North Africa 21 2 5
South Asia 8 1 4
Total 159 36 79
AFDB-1-69.indd 21 11/1/05 8:17:52 PM
African Development Bank 200522
Caribbean, a similar proportion subscribe to either the GDDS or the SDDS. In the least developed countries in particular, the GDDS seems to have been widely adopted as a framework to support the development of national statistical systems.
It seems to be the basic characteristics of the GDDS that make it such a useful statistical development tool. First it is flex-ible and can be used by countries at very different levels of development. Second, countries retain control of the develop-ment process. Third, while not covering all areas of statistical activity it does focus on a number of priority areas and fourth, it provides a mechanism for bringing together different data producing agencies and does not focus on the national statis-tical agency alone. The next two sections of the paper discuss how the GDDS has been used in practice as a component of a broad process of statistical development, especially in Commonwealth countries in sub-Saharan Africa.
2. Increasing Demand for Statistics
2.1. Global Monitoring and the MDGs
The past five years, since the end of the last century, have seen a substantial increase in the demand for data to monitor in-dicators of development. This increased demand has been generated from a number of sources, but overall it represents both a major challenge and a major opportunity for the statistics community in general and for the managers of statistical systems in developing countries in particular. A number of reviews of statistical performance in developing countries over the past ten to fifteen years have identified that many statistical systems, especially in less developed countries, are facing a vicious spiral of poor performance, inadequate demand for their outputs and reduced resources (World Bank, 2003 and UNECA, 2001). The key problem has been seen as the lack of sustained demand for the products of statistical systems especially from those parts of government that have to allocate resources for statistical activities (Eele, 1989). Processes that lead to an increase in demand, therefore, represent an important opportunity to break into the vicious cycle and address fundamental problems.
The United Nations Millennium Summit in 2000 and the resulting Millennium Declaration placed the need to monitor prog-ress at the core of the development and poverty reduction process. For the first time an unprecedented number of heads of state and governments committed themselves to a process to achieve eight development goals and to monitor and re-port on progress on a regular basis. The translation of the eight goals into 21 targets and 48 indicators immediately fo-cused a political spotlight on the statistical systems that were to generate the data for these indicators. Even though some of the indicators have to be estimated from international or developed country sources, national statistical systems remain the only viable source of information for the majority4. The emphasis on monitoring these indicators regularly and the po-litical attention given to progress reports, especially in 2005 and 2010, have highlighted both the data gaps and the need to invest in statistical capacity.
4: Of the 48 MDG indicators, 35 are normally based on data generated by national statistical systems, the other 13 are usually generated by international agencies
Graham Eele and Oliver Chinganya
AFDB-1-69.indd 22 11/1/05 8:17:52 PM

African Development Bank 2005 23
2.2. Monitoring Poverty Reduction Strategies
Within developing countries a number of processes have also created demand for good statistics and have presented an op-portunity to make the case for more sustained investment in statistics. Following the political campaign for enhanced debt reduction around the Millennium, the Highly Indebted Poor Countries (HIPC) initiative and the requirement for the least de-veloped countries to prepare and implement poverty reduction strategies created enhanced demand for statistics. The prep-aration of Poverty Reduction Strategy Papers (PRSPs) is a data intensive process (World Bank, 2002). Countries preparing a PRSP need to compile data for a baseline assessment, they also need to specify both indicators and monitoring mecha-nisms for annual progress reports. In many countries, the process of preparing the PRSP and the political attention given to the document highlighted weaknesses in statistical systems and allowed managers to make the case for increased resourc-es (Booth and Lucas, 2001 and World Bank and IMF, 2004).
Because poverty reduction strategies are broad policy statements covering programs and policy changes in many different sectors, the demand for data is also broad. The need for countries to identify indicators as well as specify and put in place mechanisms for monitoring and evaluation presents an opportunity for the managers of statistical systems to take a strate-gic view of the development and to link their plans directly to the PRSP (Zieschang, 2005).
2.3. The Results Agenda and the Marrakech Action Plan for Statistics
The focus on identifying indicators, compiling data on a regular basis and monitoring and evaluating the results of past action at international and national levels has come to be called the results agenda. Following the Monterrey Conference on Financ-ing for Development held in Mexico in 2002, there was a broad consensus that increased finance for development could be made available, but that developing countries and the international community more generally should adopt a much more results focused approach (United Nations, 2002). The international development banks in particular, have been leading this agenda, but it has been driven by a number of other processes, including the negotiations for the fourteenth replenishment of the International Development Association (IDA) and the recent Africa Commission report (Commission for Africa, 2005).
The results agenda places an explicit requirement on countries and development agencies to manage for results, to iden-tify how additional resources can be used most effectively and then to monitor outputs and especially outcomes. At the second roundtable on Managing for Development Results held in Morocco in 2004, the international statistical communi-ty discussed what additional things need to be done to support the results agenda, focusing in particular on the challenge of reporting on progress towards the MDGs by 2010. The participants in this meeting developed what has become to be known as the Marrakech Action Plan for Statistics or MAPS. MAPS aims to build on what has already been achieved, in-cluding the widespread participation in the GDDS, and identifies a specific action plan to be carried out between now and 2010. The plan has six components, three working to support national statistical capacity and three to strengthen interna-tional coordination and management. MAPS has been widely endorsed, by the UN Statistical Commission, by the Develop-ment Assistance Committee of the OECD, by the Partnership on Statistics for Development in the 21st Century (PARIS21), by the Africa Commission and by the executive boards of the international development banks. If fully funded and imple-mented, MAPS represents a step increase in resources for statistics over the next five years. The challenge is to make sure the program is implemented successfully and to bring together all the main initiatives supporting statistics in developing countries to deliver better data for development.
Using the GDDS to build statistical capacity in Africa
AFDB-1-69.indd 23 11/1/05 8:17:52 PM

African Development Bank 200524
3. Using the GDDS in Practice
3.1. GDDS and Statistical Development in Africa
Table 1 indicates that the rate of participation in the GDDS by sub-Saharan African countries has been particularly high. More than four fifths of all countries have already prepared and disseminated their metadata and some are updating these on a regular basis. In part, the high participation rate can be ascribed to special efforts by the IMF and the World Bank to encourage and support countries, especially in the metadata preparation stage. The regional approach, working with sub-regional organizations has proved to be particularly effective. Nevertheless, the fact that countries continue to participate actively does indicate that statistical managers find the GDDS useful and flexible enough to address issues in countries at very different stages of development.
One regional project that has proved successful in getting countries not only to participate in the GDDS, but also to use the framework actively to develop their statistical systems has worked with 15 Anglophone African countries of which 11 are members of the Commonwealth. The project has been financed by the United Kingdom and is implemented jointly by the IMF and the World Bank. Having started in 2002, the project has been extended and is now due to be completed by the end of April 2006. The overall objective is to support the more effective design, implementation, and monitoring of econom-ic policy and poverty reduction strategies by strengthening national statistical systems through participation in the GDDS. The initial phase of the project focused on the assessment of statistical systems and the compilation of the GDDS metada-ta. Subsequent activities have been concerned with providing technical assistance to assist countries to implement plans for improvement in the different data categories.
The project was reviewed at the end of 2003 and a further evaluation will be carried out at the beginning of 2006. Feed-back from participating countries so far indicates that the project is valued and seems to have been successful at least in delivering the outputs and, to a considerable extent in achieving its purpose. Specific outputs include: sustainable improve-ments in the quality of official data, and their access by the public; GDDS metadata being updated on a regular basis and being used to assess the performance of statistical systems; improved coordination among national statistics agencies and more effective allocation of financial and other resources; increased awareness of the value of quality data and their dis-semination on the part of data producers and data users, and more effective communication between these groups; coor-dinated strategies and/or plans in place to strengthen national statistical capacity in the medium and longer-terms; and im-proved regional cooperation on statistical issues.
As part of the project countries have been encouraged to integrate the GDDS into existing mechanisms and processes for the organization and coordination of statistical activities. Many countries have held GDDS workshops to bring together users and providers of statistics to discuss both technical and development issues. National workshops have proved to be useful forums for raising awareness of the importance of statistics and of the value of the metadata. Technical GDDS committees have also been established with representatives from the central statistical agency and other data producing organizations. These committees have been helpful in promoting cooperation and in some cases have now evolved into more permanent coordination structures.
The regional approach has also proved valuable in promoting regional cooperation and the sharing of experience and ex-pertise between countries. In one example, statisticians from Zambia were able to provide technical support to Botswana
Graham Eele and Oliver Chinganya
AFDB-1-69.indd 24 11/1/05 8:17:52 PM

African Development Bank 2005 25
in the processing of trade statistics. In another case, Lesotho, Namibia and Swaziland held a workshop to discuss the mea-surement of private capital flows within the balance of payments.
3.2. National Strategies for the Development of Statistics
An important component of the Marrakech Action Plan for Statistics is to assist all developing countries to prepare a nation-al strategy for the development of statistics (NSDS) by the end of 2006. The NSDS is an initiative of PARIS21 to promote an integrated and strategic approach to the development of statistical systems and investments in capacity. While the idea of strategic planning in statistics is not new [5, op. cit.], the aim of the initiative is to enable countries to assess existing sta-tistical capacity, identify both strengths and weaknesses, identify goals and targets, set priorities, identify resource require-ments, set out implementation plans, and set up mechanisms for reporting, accountability, monitoring and evaluation.
The NSDS approach builds on the experience of preparing and implementing poverty reduction strategies. The aim is for coun-tries to take control of their own statistical development, to initiate effective consultation processes to help identify data pri-orities and to mobilize resources around an effective and realistic implementation program that is integrated within existing budget management processes. Experience from the Anglophone African project and elsewhere indicates that participation in the GDDS can be an important starting point for countries looking to develop a strategic approach. The framework provides a way of putting the fundamental principles of official statistics into practice, the metadata provide a detailed and well struc-tured assessment of current statistical methods and procedures, the plans for improvement constitute the main components of the development program and the regular updating of the metadata provides a mechanism for public accountability.
4. Discussion and Conclusions
4.1. The Role of Standards in Building Statistical Capacity
The SDDS and the GDDS illustrate different approaches to the use of standards in building statistical capacity and helping countries improve the quality, availability and use of official statistics. Data quality is important to users, but in most circum-stances, they are unable to determine the quality of an indicator from an examination of the data alone. Additional infor-mation is needed, in the form of metadata or descriptions of the methods and procedures used to collect the data, classi-fy and compile the indicator and disseminate the results. Both the standards, by focusing on the role of metadata, help to provide information on data quality and hence improve the credibility and utility of the statistics, but the way in which this is done is different. For the SDDS, the role of the standard setting agency, in this case the IMF, is to provide an external and independent assessment of data quality and to reassure users that the data can be used with confidence.
The GDDS, on the other hand, provides a structured framework for improving statistics, setting targets in terms of data cover-age, quality and dissemination, but allowing countries to set their own priorities and time-scale for achieving them. Although users will not be able to assess the quality of a specific indicator, such as an estimate of the income poverty headcount, or the rate of inflation as measured by the consumer price index, simply from the knowledge that this country is a GDDS sub-scriber, they will have access to the metadata as well as the plans for improvement. The fact that a country has subscribed
Using the GDDS to build statistical capacity in Africa
AFDB-1-69.indd 25 11/1/05 8:17:53 PM

African Development Bank 200526
also provides a good indication that it is serious about improving statistics and that issues of data quality and dissemina-tion are seen as important.
One area where further development is required is to improve and strengthen the technical content of the metadata to en-sure that it reflects what is actually done in practice, documenting bad practice as well as good, but also identifying areas where data quality may be prejudiced. Compilers of the metadata need to keep in mind that the aim is not to show data producing agencies in a good light, but to provide accurate and relevant documentation that really does allow users to as-sess data quality in relation to their needs.
4.2. Improving the Governance of Statistics
An efficient and effective statistical system and the regular dissemination of official statistics that are seen as being reliable, of good quality and fit for purpose is an important component of good governance in any country. It is also important to recognize, however, that statistics, as a public good, are financed through tax revenues and as users of public finance, sta-tistical systems also have to be accountable and transparent themselves. Improving the governance of statistics is a topic that does not seem to be widely discussed. Many statistical managers seem to be very willing to measure just about any aspect of public sector activity, but seem to be curiously reluctant to apply the same discipline to the activities they have responsibility for.
Participation on the GDDS and especially updates of the metadata that are reviewed and made publicly available, therefore, can be an important way for data users not only to assess the quality of specific indicators, but also to review the perfor-mance of a statistical agency as a whole. In a number of countries the requirement to produce regular metadata updates is one of the performance indicators set out in their national strategies and implementation plans. The metadata, accessed through the IMF’s Data Standards Bulletin Board5 is also one of the ways that users and other stakeholders have of assess-ing improvements in data quality and accessibility.
If the GDDS data are to be actively used to assess capacity and progress in improving data quality, then it will be essential to ensure that the metadata are updated regularly and do reflect current procedures and practices. Countries participating in the GDDS re required to update their metadata regularly as and when major changes are implemented and at least once a year. An analysis of the metadata available on the DSBB6 indicates, for example, that only 20 per cent of countries have updated their metadata within the last 12 months, about one third last updated their metadata between one and two years ago, a further third last submitted updates between two and three years ago and just over one in ten have not updated their metadata for more than three years. Clearly if the GDDS is to be effective it is important that participating countries are en-couraged and supported to update their metadata on a regular basis. Now that the initial expansion phase is coming to an end and countries have been participating for a number of years, it could well be that the emphasis should move from en-couraging new countries to join to ensuring that information is accurate, complete and up to date.
5: http://dsbb.imf.org/Applications/web/gdds/gddshome/
6: The analysis was based on Table B for national accounts aggregates, but similar results are obtained using other tables.
Graham Eele and Oliver Chinganya
AFDB-1-69.indd 26 11/1/05 8:17:53 PM

African Development Bank 2005 27
4.3. Building Sustainable Capacity
It is clear that the GDDS will play a central role at the heart of the NSDS in most countries. In sub-Saharan Africa in particu-lar most countries are already subscribers and the work they have already done to compile metadata and to prepare plans for improvement provides a sound basis for strategic planning. The GDDS also fosters sound statistical practices with re-spect to the development, compilation and dissemination of economic, financial, and socio-demographic statistics. Partic-ular attention is paid to the needs of users, which are addressed through the dimensions relating to the quality, integrity, and public access to the data. Together, these GDDS priority areas constitute a solid basis on which to formulate long term policies for statistical development, which can be integrated directly into a strategic plan.
While the data covered by the GDDS are necessary for all countries, the system does not cover all data sets that are re-quired for a complete system of official statistics. However, the GDDS approach can be easily extended to other data sets and the integrity and access issues apply to all data producing agencies, so the overall approach in these areas can be seen as comprehensive. While it may not be possible to publish metadata on the DSBB for other data sets, it may well be useful for countries to apply the GDDS approach to data activities that are considered important locally.
A key feature of the GDDS is the promotion of statistical coordination within a country. The full data set in the system covers data produced by at least three, and often as many as ten, agencies. Countries are encouraged to establish GDDS commit-tees composed of representatives of all concerned agencies. The establishment of the GDDS has been cited in many coun-tries as a key tool in informing agencies what data are being compiled, where overlaps in data collection exist, and where efficiencies can be realised in compilation and dissemination.
Finally, by focusing on key data sets and on short and medium-term improvements, participation in the GDDS can help countries to build momentum for longer-term and wider-scale improvements. Building confidence among data users in the quality and utility of official statistics is an important part of breaking out of the vicious cycle and changing it into one of virtuous improvement.
References
IMF, (2003), The General Data Dissemination System, Washington D.C.
IMF, (2004), Guide to the General Data Dissemination System, Washington D.C.
United Nations Statistics Division, (2003), Handbook of Statistical Organization: The Operation and Organization of a Statistical Agency, Third edition, Series F, no. 88,
New York
World Bank, (2003), Building Statistical capacity to monitor Development Progress, Washington D.C.
UNECA, (2001), Assessment of the Addis Ababa Plan of Action for Statistical development in Africa in the 1990s, ECA/DISD/CODI.2/11, Addis Ababa
Eele, G., (1989) The Organization and Management of Statistical Services in Africa: Why Do They Fail?, World Development, Vol. 17, No 3, 431-438.
Using the GDDS to build statistical capacity in Africa
AFDB-1-69.indd 27 11/1/05 8:17:53 PM

African Development Bank 200528
World Bank, (2002), A Sourcebook for Poverty Reduction Strategies, Washington D.C.
Booth, D. and H. Lucas, (2001), Initial review of PRSP Documentation, DFID, London
World Bank and IMF, (2004), PRS Progress report: Progress in Implementation 2004, Washington D.C.
Zieschang, K. (2005), IMF Statistical Metadata Standards and Classifications: Enhancing the Effectiveness of Statistical Capacity Development, Paper presented at the Com-
monwealth Statisticians Conference, Cape Town, September 2005
United Nations, (2002), Outcome of the International
Conference on Financing for Development: report of the Secretary General, New York
Commission for Africa, (2005), Our Common Interest: Report of the Commission for Africa, London, Penguin Books
Graham Eele and Oliver Chinganya
AFDB-1-69.indd 28 11/1/05 8:17:53 PM

African Development Bank 2005 29
Using the GDDS to build statistical capacity in Africa
AFDB-1-69.indd 29 11/1/05 8:17:53 PM

African Development Bank 200530
1: Manager, Statistics Division, African Development Bank Group, BP 323-1002 Tunis Belvédère, Tunis, Tunisia, email: [email protected]
2: ICP-Coordinator, African Development Bank Group, BP 323-1002 Tunis Belvédère, Tunis, Tunisia, email: [email protected]
Summary
The African Development Bank Group has launched a continent-wide program involving 52 African countries aimed at strengthening their capacity to provide timely and reliable data for policy formulation, implementation and evaluation and monitoring of progress towards achieving Millennium Development Goals (MDGs) and Poverty Reduction Strategies (PRSs). It would also provide timely and reliable data that would be useful in the implementation of the NEPAD agenda and the Results–Based Management and Evaluation Systems for development effectiveness.
The Bank is implementing these activities under the umbrella of ICP-Africa which aims at maximizing the synergy between the ICP and national statistical programs in Africa. The ICP is a global statistical initiative aimed at generating purchas-ing power parity (PPP) estimates that facilitate cross-country comparisons of price levels, and economic aggregates in real terms. Unlike the ICP being implemented in the other regions of the world, the Bank is using ICP-Africa as a springboard for an expanded statistical capacity building program. Currently support for activities in the countries is being provided in the following 8 strategic areas: (i) implementation of core ICP activities, (ii) development of the Reference Framework for Statistical Development in Africa in collaboration with UNECA, Paris21 and the World Bank, (iii) assistance to African coun-tries in the development of their National Strategies for the Development of Statistics, (iv) implementation of a research study on PPP based poverty measurement, (v) implementation of an ADB/UNDP initiative on MDG monitoring and statis-tical literacy (vi) support to African countries in the implementation of the 1993 System of National Accounts, (vii) support to African countries for improving price statistics, and (viii) training of country professionals and students through Statisti-cal Training Centers and Universities.
Key Words:
African Development Bank, Statistical Capacity Building, International Comparison Program, ICP-Africa, Purchasing Power Parities, Prices, National Accounts.
1. Background
The ability of national statistical agencies to make available independent and politically neutral socio-economic information is critical for ensuring effective development policy formulation and implementation. Sound data helps ensure that official actions are taken on a sound basis. But, in many African countries, much of the key data needed to provide a satisfactory
Strengthening Statistical Capacity in African Countries under the Framework of the International
Comparison Program for Africa (ICP-Africa)
Charles Leyeka Lufumpa1 and Michel Mouyelo-Katoula2
AFDB-1-69.indd 30 11/1/05 8:17:53 PM

African Development Bank 2005 31
general overview of policy are unavailable. When available, in many cases, there is also an urgent need to improve the cov-erage, quality and timeliness of the relevant statistics.
Information gathered by the African Development Bank (ADB), the World Bank, the International Monetary Fund (IMF), the United Nations agencies as well as other specialized institutions indicate that many African countries are falling behind in providing reliable statistics for guiding government policy and decision-making. These translate into an inability to meet cor-responding data demands to support the effective monitoring of progress towards the achievement of Millennium Develop-ment Goals (MDGs) and to reach poverty reduction objectives.
For a deeper understanding of the problem, the ADB conducted statistical assessments of 49 African countries between De-cember 2002 and October 2003. The key objective was to make an in-depth review of the national statistical systems (NSSs) and take stock of the statistics compiled, with particular emphasis on national accounts and price statistics, and thus pro-vide a basis for designing an appropriate statistical assistance program for the Bank.
An analysis of the assessment reports showed that in several countries the minimum requirements with regard to compila-tion of timely and reliable socio-economic indicators were lacking. Generally research and methodology development are not given the priority they deserve in many National Statistical Offices (NSOs) in RMCs. This is compounded by the shortage of research skills in statistical methodologies. In addition, NSOs have tended to take shortcuts in resolving methodological problems by either using proxies or methods applied elsewhere (which may not be appropriate for the local situation), or to resort to externally conceived solutions.
NSOs in some countries do not have the necessary expertise to adapt to the new challenges, such as production of poverty and gender statistics necessary to address these challenges. This can be attributed in part to the curricula of statistical train-ing centers in Africa which normally do not include training in official statistics.
The statistical assessments also revealed that only a few countries in Africa have placed high priority on statistical produc-tion. In these countries, planners and decision-makers have realized the importance of statistical information and are exten-sively using statistics in evidence-based macro-economic management and policy-making as well as program monitoring and reporting. NSOs in these countries are given at least the minimum budgetary support for building statistical compo-nents in important national programs and raising the profile of statistics. Effective management of public affairs in RMCs would therefore require the sensitization of politicians, policy and decision-makers about the strategic importance of statis-tical data and information in development policy formulation and monitoring processes.
Many NSOs lack adequate human resources to maintain even basic routine activities. In a number of countries, this is due to the fact that qualified personnel cannot be attracted and retained in the statistical service because of poor terms and condi-tions of service or because there is a temporary ban on recruitment of civil servants including statistical personnel.
There is also a general shortage of skills in such key areas as national accounts, sampling, agricultural statistics, Gross Do-mestic Product (GDP) price data and data analysis and in new areas like energy statistics, environmental statistics and gender statistics. These skill shortages are due in large part to limited opportunities for specialized statistical training for many Africans. As a result, many NSOs lack the capacity to adapt to the new challenges and to meet the new demands for data. Moreover, in many countries visited, no strategy has been put in place to systematically assess, on a continuous ba-sis, changing requirements for data.
Strengthening Statistical Capacity in African Countries under the Framework of the International Comparison Program for Africa (ICP-Africa)
AFDB-1-69.indd 31 11/1/05 8:17:54 PM

African Development Bank 200532
Most national statistical systems in Africa are experiencing financial problems in varying degrees. In countries where statis-tics are not given high priority, severe and arbitrary cuts in the statistical budget are common. In many of these countries, donor funding has played a key role in keeping some important statistical activities running. There are for example countries where it was reported that 70-90 percent of the budgets of NSOs were supported by donors.
The assessments also indicated that not all NSOs have fixed buildings of their own that are adequate for their purposes. Al-most all the NSOs have a problem of shortage of equipment such as computers, photocopiers, printers and transportation. These problems adversely affect the performance of the offices.
Very few countries have built comprehensive and up-to-date databases for storage and easy retrieval of statistical data. Fail-ure to establish databases is attributed to shortage of equipment, computer skills and related problems.
In many countries, the quality of data series is below international standards: Coverage of important indicators like GDP and the Consumer Price Indices (CPI) remains limited; the accuracy of some data series is questionable including national accounts, labor and employment statistics, statistics on crops and livestock numbers, and such information as external trade statistics; data inconsistencies among sources are common particularly in countries with little or no co-ordination of sta-tistical programs; data desegregation is mostly inadequate; metadata on major statistical programs are not compiled due mainly to lack of training in handling metadata; many series being produced are not relevant to users’ needs; most of the statistics being released have unacceptable lag such that they are no more of use or are of little use when published; be-cause of lack of data banks/databases and inefficient dissemination strategies, most of the statistical series are not easily accessible thereby discouraging potential users of the products.
Furthermore, in many countries, laws governing statistical organization and activities, particularly the provision for coordi-nation, are often out of date and no longer reflect the new realities in the countries. This among other things has contrib-uted to the ineffectiveness of the national statistical systems.
The systems in Africa are essentially decentralized with line ministries compiling sector data and the NSOs acting as coor-dinating agencies. In a majority of the countries, however, the NSOs have failed to perform their function of coordinating the national statistical system due in large part to the fact that they are understaffed, under-resourced and over-stretched. With lack of co-ordination, the national statistical systems have continued to produce data that are often not consistent or comparable, and thus not reliable for development policy formulation and monitoring purposes.
In recognition of these statistical challenges in Africa, the ADB has decided to launch a broad statistical capacity building program involving 52 African countries. The program is being implemented under the auspices of the ICP-Africa activities which the Bank is coordinating. Under ICP, the Bank’s mandate is to organize and supervise the collection of price statistics in African countries to facilitate the generation of purchasing power parity (PPP) estimates necessary for cross-country com-parisons of price levels, and economic aggregates in real terms. Unlike the ICP programs in the other regions of the world, however, ICP-Africa is a much wider program with a key objective of strengthening the capacity of African countries to pro-vide timely and reliable data for policy formulation, implementation and evaluation and monitoring of progress towards achieving MDGs, Poverty Reduction Strategies (PRSs), the New Partnership for Africa’s Development (NEPAD) and Results–Based Management and Evaluation Systems for Development Effectiveness. The program is being implemented in partner-ship with the World Bank, the International Monetary Fund (IMF), the UK Department for International Development (DFID), the United Nations Economic Commission for Africa (UNECA), the United Nations Development Program (UNDP), Partner-
Charles Leyeka Lufumpa and Michel Mouyelo-katoula
AFDB-1-69.indd 32 11/1/05 8:17:54 PM

African Development Bank 2005 33
ship in Statistics in the 21st Century (PARIS21), African Capacity Building Foundation (ACBF), the French Institut National de la Statistique et des Etudes Economiques (INSEE-France) and the UK Office of National Statistics (ONS-UK) as well as vari-ous African sub-regional organizations and institutions.
The Bank’s current statistical capacity building activities can be categorized in the following 8 groups of activities which are aimed at strengthening statistical systems in 52 African countries:
• Core ICP activities;• Development of the Strategic Framework for Statistical Development in Africa;• Assistance to African countries in the development of their National Strategies for the Development of Statistics;• Research study on PPP based poverty measurement;• Implementation of an initiative on MDG Monitoring and Statistical Literacy in partnership with UNDP;• Support to African countries in the implementation of the 1993 System of National Accounts;• Streamlining and improvement of African countries systems of price statistics; and• Training of country professional and students through Statistical Training Centers and Universities
In terms of human resources and financial support to participating countries, and in order to facilitate implementation of the statistical capacity building program, the Bank has assembled a team comprising 12 professional statisticians, 9 research associates and four administrative assistants to manage the activities of ICP-Africa. In addition, consultants are called upon to assist the team on various aspects of the program for which supplementary expertise is needed.
The budget for undertaking ICP-Africa activities in 52 participating countries is about US$ 37.605 million for a three-year period up to 2007. The Bank Group is covering a sizeable portion (US$ 28.17 million) of the total cost. Other resources are from the World Bank (US$ 3 million over 3 years), DFID-UK (US$ 1 million), Norway (US$ 0.19 million), Indian Trust Fund (US$ 0.1 million), The African Capacity Building Foundation’s (ACBF – US$ 1 million), Japanese Authorities (US$ 0.665 mil-lion) and participating countries (US$ 3.48 million through their regular statistical budgets).
2. Current Bank Group Measures to Build Statistical Capacity in Africa
2.1 Implementation of Core ICP Activities
General Program Objectives
The ADB under its mandate as the Regional Coordinator of ICP – Africa, recognized the urgent need to go beyond the generation of PPPs for cross-country comparison of economic aggregates to include assistance to countries in meet-ing the demands of national governments and international organizations for relevant development data, which are of good quality and are available on a timely and regular basis. Under ICP – Africa, the ADB’s efforts are targeted towards not only increasing the ICP coverage of the countries in Africa but also providing technical and financial assistance to the participating countries for ICP related activities and towards capacity building particularly in national accounts and price statistics.
Strengthening Statistical Capacity in African Countries under the Framework of the International Comparison Program for Africa (ICP-Africa)
AFDB-1-69.indd 33 11/1/05 8:17:54 PM

African Development Bank 200534
The program therefore also aims to strengthen African countries to meet the urgent demand for reliable and timely data to support the monitoring of progress on the MDGs, PRSs, the NEPAD initiative and the Results-Based Management and Eval-uation system for development effectiveness.
ICP Specific Objectives
The ICP aims at producing estimates of price levels, expenditure values, and purchasing power parities (PPPs) that allow for cross-country comparisons of price levels, and economic aggregates in real terms. It stems from the recognition that mea-sures of economic aggregates based on exchange rates do not reflect differences in price levels between countries, and as such they are patently unsuitable for policy decisions, which in principle, should use PPP data that relates to volumes only and is free of price distortions.
Stages of PPP compilation
A PPP is defined as the ratio of the number of units of currency that would be required in a country B to purchase a bas-ket of goods and services, in relation to that which could be purchased in a country A. In a trivial case, where a single prod-uct is considered, the PPP of country A to B is calculated as the ratio of the price P(A) in country A to the price P(B) of the identical product in country B.
Considering several products, price ratios have to be calculated and aggregated in two stages. Firstly, the calculation of ba-sic (elementary) parities for each detailed and homogeneous group of products, and secondly, the aggregation of these ba-sic parities from the level of detailed groups to composite aggregates such as meat, clothing, food, household consumption, government consumption, machinery and equipment, construction and civil engineering, etc... While national average prices for selected goods and services are needed to derive basic parities, weights related to detailed GDP expenditure estimates are necessary to aggregate basic parities.
ICP Strategy
The ADB has formed a consortium of national, regional and international partners, with a view to identifying synergies, co-ordinating efforts, and pooling resources. This is critical for the successful implementation of sustainable region-wide statis-tical programs. In this context, ICP-Africa is being used as a regional platform to build effective partnerships at the national, regional and international levels. Notable strides have been made in forging partnerships with international and region-al organizations involved in statistical development in Africa, including the UK-DFID, Norwegian Agency for Development (NORAD), Japan, The World Bank, UNECA, IMF (IMF), UNDP, ACBF, World Health Organization (WHO), International Labor Organization (ILO), Food and Agriculture Organization of the United Nations (FAO), PARIS21, Economic and Statistical Ob-servatory for Sub-Saharan Africa (AFRISTAT), Southern African Development Community (SADC), Community of Eastern and Southern Africa (COMESA), Economic and Monetary Union of West Africa (UEMOA), and Economic Community of West Af-rican States (ECOWAS) which are all members of the ICP-Africa Governing Board.
Charles Leyeka Lufumpa and Michel Mouyelo-katoula
AFDB-1-69.indd 34 11/1/05 8:17:54 PM

African Development Bank 2005 35
The efforts of all the partners are geared towards conducting regional training workshops and providing financial and tech-nical support needed to accomplish ICP-Africa work at the country level. National statistical agencies are responsible for country level data collection and management of the program. At the sub-regional level, selected Sub-Regional Organiza-tions (SROs) – AFRISTAT, COMESA, ECOWAS and SADC – are responsible for managing activities in the countries for the price collection phase of the program. This includes adaptation of survey methodology to suit local conditions, training and field work. The SROs are helping to ensure that the statistical capacity building initiative optimally fits in with sub-region-al recommendations and programs applicable to their member states and would also use ICP and 1993-SNA as integrated tools for the assessment of their economic convergence. Through their participation in the program, SROs will be assisted in building up their internal capabilities for planning, executing and monitoring surveys since the production of PPP related input data at the country level is expected to be a regular exercise.
For this exercise to be made regular, country specific elements of the ICP-Africa strategy include (a) establishing the great-est possible synergy between the ICP data collection efforts and routine national statistical programs, (b) strengthening in-stitutional capacity through technical and managerial training and assistance, (c) providing financial, technical and material assistance, including hardware and software for data collection, verification, and processing, (d) creating and maintaining databases and improving the quality and timeliness of the publication and dissemination of the data, and (e) promoting the use of data for policy making and monitoring of progress.
Activities Undertaken Since the Inception of ICP in June 2002
The ADB started preparatory activities in June 2002 following the launching seminar of 2-4 December, 2002 in Addis-Aba-ba. Implementation of the program has been carried out in ten main stages: (a) continuation of preparatory activities; (b) statistical assessment of national statistical systems in participating countries; (c) development of methodologies related to special areas; (d) development of Structured Product Descriptions and the resulting list of household consumption items to be priced in the countries; (e) the preparation of field instruments and the development of survey catalogue and forms; (f) establishment of national coordination offices; (g) training of national coordination teams and sub-regional organizations in ADB procurement, disbursement and audit procedures (h) establishment of statistical co-operation at national, sub-re-gional and international levels; (i) organization of regional seminars and meetings; and (j) implementation of ICP field ac-tivities. Details of these program milestones are described in greater detail below. (a) Preparatory activities included: (i) the establishment of the ICP team at ADB charged with the handling of day-to-day
activities of the program, (ii) the drafting of guidelines for statistical pre-assessment of participating countries; (iii) se-curing the participation of 52 African countries, (iv) fund raising for the program.
(b) Statistical assessments were completed in 49 African countries to take stock of the prevailing circumstances, weaknesses
and strengths of the statistical systems in the countries with a view to identifying areas to be fostered through ICP. (c) The development of methodologies related to special areas included a pilot study on poverty PPPs and the treatment
of equipment goods and a pilot study on construction surveys: (i) The pilot study on poverty PPPs was launched by the Bank in collaboration with the World Bank with a view to fa-
cilitating regional and global poverty measurement. The preliminary results of the study were presented at the First
Strengthening Statistical Capacity in African Countries under the Framework of the International Comparison Program for Africa (ICP-Africa)
AFDB-1-69.indd 35 11/1/05 8:17:54 PM

African Development Bank 200536
Regional Seminar in May 2003 and work on this is still on-going. (ii) A paper on methodologies that could be used for collecting prices for machinery and equipment, as well as hous-
ing services (rents) was commissioned and prepared by the ICP global office with the ICP-Africa team and African countries collaborating in the development of the base-questionnaire.
(iii) A study on price and cost surveys related to construction and civil engineering, using baskets of construction com-ponents (BOCC), was commissioned by ADB and has been adopted for use in the global ICP exercise.
(d) Development of Structured Product Descriptions (SPDs) for household consumption items was carried out jointly by the ADB and participating countries with a view to facilitating the development of the item list and harmonization of item identification for price surveys in the countries. The SPD is a systematic method that entails the identification of price determining characteristics of products to be included in the basket of items to be priced. The ensuing list of 853 house-hold goods and services was finalized and submitted to the countries to enable them prepare for data collection.
(e) The preparation of field instruments and the development of survey catalogues and forms – Draft field manuals for su-
pervisors and price collectors were developed by the World Bank and amended to accommodate specific instructions relating to the questionnaire drawn up by the ADB. They also include quality control mechanism and procedures for regular status and progress reporting from the price collectors to the supervisors and to the national coordinator. The survey catalogues and forms to be used for data collection in the countries were prepared, printed and provided to the countries for further use in price surveys.
The Bank also recognized that obtaining reliable and accurate data for the ICP is the key to its acceptability and success. This depends largely on sound survey framework and data collection and validation in each country. Bearing in mind this important element, the ADB assisted all participating countries in developing country specific price survey frameworks that are used to (i) effectively carry out and monitor the implementation of ICP field data collection, and (ii) rationalize the inte-gration of ICP and CPI activities, i.e. ensure that activities related to Consumer Price Indices (CPIs) benefit from the imple-mentation of ICP. Through the framework development process, countries were able to prepare their work plan and time-frame; review alternative plans; determine their staff needs, including the number of data collectors and supervisors to be mobilized from current staff and full-time/part-time new recruits needed to implement the program; determine their train-ing needs and in most cases plan the necessary training programs. In addition, the framework was an occasion to discuss and agree on a regular communication system to facilitate regular feedback with field staff. The survey framework developed sampling guidelines for selecting outlets at which to price specific types of products. Since countries had no sampling frame(s) for price data collection, purposeful sampling procedures were recommended. Every ef-fort was made to maintain all the localities and retail outlets covered by CPI and to use the same price collectors and man-agement infrastructure. (f) National ICP coordination offices were established in all participating countries. They include a national coordinator,
a deputy coordinator and an administrative assistant. As price statistics and national accounts comprise the core of the ICP program, national coordinators and their deputies nominated by each country are required to have comple-mentary skills in these areas.
(g) Training of national coordination teams and sub-regional organizations in ADB procurement, disbursement and audit procedures: Financial assistance is a major contribution by the ADB to the countries participating in the ICP. In receiving and expending the funds the countries are required to strictly follow ADB’s procurement, disbursement and audit pro-
Charles Leyeka Lufumpa and Michel Mouyelo-katoula
AFDB-1-69.indd 36 11/1/05 8:17:54 PM
African Development Bank 2005 37
cedures. Countries received training on the Bank’s accounting procedures and rules through four sessions (Windhoek, Johannesburg, Yaoundé and Tunis). Each session was of a duration of three days. These were held between October 2003 and September 2004. The participants included over 200 officials from 51 countries, sub-regional organizations and statistical training centers.
(h) Statistical cooperation activities aimed at building partnerships in the ICP context included the Bank’s participation in technical task teams or programs managed by other institutions such as ECA, PARIS21, ECOWAS, UEMOA, AFRISTAT, SADC, and COMESA. As regards statistical development in the Africa Region, ADB is a founder member of the Forum on African Statistical Development (FASDEV). The Bank also formed partnerships with all major international, regional and sub-regional organizations involved in statistical development in Africa, with a view to furthering programs geared towards enhancing national statistical systems.
(i) Regional Seminars: Sixteen regional and sub-regional seminars and meetings have been organized over the past two years (2003-2005). The first ICP-Africa regional seminar was held in Addis-Ababa, from 19-23 May 2003 aimed at en-hancing the objectives and strategies of the program. It was followed by the first meeting of the ICP-Africa Governing Board held in Addis-Ababa, on 25 July 2003. Following decisions emanating from the Governing Board meeting, two additional ICP-Africa seminars were organized in Windhoek for SADC member countries (6-11 October, 2003) and all country national coordinators of the program (13-15 October, 2003). The 6-11 October seminar for SADC countries was intended to facilitate the incorporation of ICP methodological approaches into SADC programs while the 13-15 October seminar for all 51 countries covered the Bank’s procurement, disbursement and audit procedures.
The seminar on SPDs for food and clothing items and GDP breakdown took place from 3-17 December 2003 in Johannes-burg. The seminar brought together over 150 officials from 50 African countries and various international, regional and sub-regional organizations.
Another special parallel session, bringing together all the statistical training centers (STCs) in Africa, was organized during the seminar. The session discussed the role of STCs in fostering capacity building training activities within the ICP frame-work. Discussions focused on the best way to review STCs curricula and introduce ICP aspects into their programs and how to organize ICP short-term training modules.
A regional ICP-Africa seminar was held in Yaoundé, from 26 April to 4 May 2004. The seminar was attended by over 200 officials from 51 African countries, sub-regional and international organizations. The seminar was organized in three par-allel workshops. Firstly, for Directors of NSOs to review the reports of statistical assessments carried out by the ADB in their countries, with a view to formulating a synthesis of the problems facing NSOs and also to discuss contractual and disbursement issues relating to the implementation of ICP activities in their countries. Secondly, for ICP National Coordi-nators, Deputies and representatives of Statistical Training Institutes in Africa to discuss mainly the general framework of ICP price surveys, the list of household consumption items to be priced, the SPD approach and data collection for machin-ery, equipment, construction and civil engineering works; the supply and use tables and to review the master ICP-Africa classification and link tables. Thirdly, a parallel course on CPI and ICP methodologies was conducted jointly by the IMF and ADB for CPI statisticians from countries in Africa. In addition, the ICP-Africa Governing Board held a one-day meeting to review the progress of the work and to approve the work plans for the next year.
Strengthening Statistical Capacity in African Countries under the Framework of the International Comparison Program for Africa (ICP-Africa)
AFDB-1-69.indd 37 11/1/05 8:17:55 PM

African Development Bank 200538
At the end of the seminar, the Directors of NSOs from 51 countries issued a declaration, known as the “Yaoundé Declara-tion on Statistical Development in Africa”, in which they adopted ICP-Africa as the framework for statistical capacity build-ing in Africa and called upon the ADB, African countries, multilateral and bilateral institutions to work together towards the development of reliable statistical systems in Africa (See Annex).
The Bank organized a regional ICP-Africa seminar in Tunis from 20-24 September 2004, which was attended by all ICP Na-tional Coordinators from 51 participating African countries, sub-regional and international organizations. The main objec-tive of the seminar was to discuss key issues relating to the development of national survey frameworks, the main princi-ples to be followed in the organization of price collection as well as the validation of the list of specifications of household items to be priced in the countries. In addition, a parallel training workshop on the ICP ToolPack (a software developed by the World Bank to assist the countries in processing ICP data) was held to train trainers who were in turn be expected to instruct national price statisticians on the software during special training sessions at the sub-regional and country levels. A further five other seminars were organized in 2004 to train country officials on the use of the ICP ToolPack.
In 2005, a regional workshop was organized to mainly address issues pertaining to: (i) general aspects of quality control of price data; (ii) quality aspects of field experiences and training of field staff; (iii) quality of ICP-CPI integration; (iv) 1993-SNA as an integrated quality control framework. The workshop recommended that a series of sub-regional workshops had to be held to scrutinize data sets provided by the country using the set validation procedures. Five of them had to take place before September 2005.
The ADB is committed to the principle that the data received from the countries are of good quality. To achieve this, coun-tries are required to carry out edit and validation checks on their data before they are forwarded to ADB. At the ADB the data undergo a series of checks including the credibility of the average prices in relation to the prices reported by other countries. The results of ADB’s own edit and validation checks are presented at sub-regional workshops whose main ob-jectives are to present a progress report on survey activities within the sub-region, analysis of problems and related les-sons learned, assessment of the quality of data, country reports on data verifications, data validation process, creating a common understanding of data quality and providing recommendations and guidelines.
(j) Implementation of ICP field activities: Staff and consultants from ADB and UK-ONS visited forty-one (41) countries in the region in May-June 2005 in order to help the countries, to start or improve the data collection process. The visits focused on pre-survey activities, training of field staff, refinement of country budgets, start of data collection and trans-mission of data. The pre-surveys, the training of data collectors/supervisors and data collection started as early as De-cember 2004 and January 2005 in a few countries. As of August 2005, the progress of field activities is as follows:
Thirty-eight (38) countries started data collection in capital cities and in some other data collection centers before July 2005;
Seven (7) other countries (Botswana, Burkina Faso, Congo-Brazzaville, Ethiopia, Guinea-Bissau, Cape Verde, Togo) were ex-pected to start data collection in July-August 2005, whereas 5 countries (Burundi, Comoros, Djibouti, Libya and Seychelles) are participating in the program for capacity building purposes and may not collect any data, and 2 other countries (Algeria and Eritrea) are likely drop-outs as they have not started yet any preparation for data collection.
Charles Leyeka Lufumpa and Michel Mouyelo-katoula
AFDB-1-69.indd 38 11/1/05 8:17:55 PM

African Development Bank 2005 39
Next Stages of the ICP implementation in Africa
ICP price surveys relating to household goods and services are being conducted on a monthly basis over a period of 12 months, until May 2006. This is in line with the requirements set by the Global Office, according to which a minimum of two quarters of data collection preceded by substantial pilot surveys is required for such surveys. Exceptions are for goods and services the prices of which are subjected to seasonal fluctuations. Their prices will have to be captured in both on- and off-seasons.
Surveys on representative items of the other GDP components such as housing, government services, equipment goods, construction and civil engineering will be carried out once, during the first half of 2006, in accordance with the established and agreed methodology.
The ICP surveys will yield their first results in 2006, in the form of PPPs and GDP related price level indices and volume indices for about 44 countries that would have collected data for all main components of GDP expenditure.
2.2 Development of the Strategic Framework for Statistical Development in Africa
In 2004, the ADB, ECA, PARIS21 and the World Bank sponsored the formation of the Forum on African Statistical Develop-ment (FASDEV), comprising mainly bilateral and multilateral institutions working in the field of statistics in Africa. The Fo-rum was established to look at ways of facilitating the development of statistics on the continent. To this end, one of the key decisions that came out of the Forum was the need to develop a Reference Regional Strategy Framework for the devel-opment of statistics in Africa to guide the process.
The framework will in particular focus on strategic direction and appropriate implementation instruments for improving the planning, financing, management, and coordination of statistical development activities in Africa. It is expected that this new framework, once adopted by all stakeholders, will help create much needed synergies, reduce duplication of efforts and promote sustainable statistical capacity in the African region.
The development of the framework is funded by ADB, Paris21 and the World Bank. A team of international experts including an ECA regional advisor, led by ADB experts, has been assembled to carry out the following tasks: • Review strategic and development frameworks relevant to statistical capacity building in Africa region such as the Marrake-
ch Action Plan on Statistics (MAPS), NEPAD, MDGs, the Poverty Reduction Strategy Papers (PRSPs), the sub-regional eco-nomic integration frameworks, Paris High Level Forum on Aid Effectiveness, and the Commission for Africa report.
• Identify relevant past, current and future initiatives and programs aimed at statistical development in Africa, in close consultation with key stakeholders including: (a) national statistical offices; (b) sub-regional organizations such as AF-RISTAT, ECOWAS, COMESA, and SADC; (c) international agencies such as ADB, IMF, PARIS21, UNECA, UNESCO, UNF-PA, UNICEF, UNSD, WHO, and the World Bank; and (d) bilateral agencies.
• Carry out field assessment of the current situation of statistical systems in a mix of Anglophone, Francophone and other countries with special focus on key issues including but not limited to: planning; budgetary and financing practice; regula-tory framework; organizational framework; human resources; physical infrastructure and IT equipment; statistical practice, process, and operations; data dissemination and availability; donor coordination. This work will draw on existing analyti-
Strengthening Statistical Capacity in African Countries under the Framework of the International Comparison Program for Africa (ICP-Africa)
AFDB-1-69.indd 39 11/1/05 8:17:55 PM

African Development Bank 200540
cal work to the extent possible.• Draft a Reference Regional Strategy Framework based on the findings of the above exercises. The document would con-
tain: (a) a description of the current situation of statistical systems and statistical development constraints; (b) good practice in the region; (c) overall strategic direction and detailed recommendations on how to address the identified constraints and develop statistics in a sustainable way; (d) a framework for the implementation of the proposed recom-mendations, specifying the responsibility of national governments and development partners, an indicative time frame, and cost estimates; (e) a monitoring plan with performance indicators; and (f) a mechanism to have the Reference Re-gional Strategy Framework endorsed by all stakeholders.
2.3 Development of National Statistical Strategies in African Countries
The Bank will support African countries in their efforts to develop or update their National Strategies for the Development of Statistics (NSDS) by the year 2006 in line with the Marrakech Action Plan on Statistics (MAPS). This effort is intended to ensure that statistical requirements in African countries are rooted in wider development strategies, such as PRSPs, and not treated as a separate issue. The main objective of the NSDS process is to: • Provide a detailed assessment of the current status of the National Statistical System (NSS) (current strengths, weak-
nesses, opportunities and threats);• Address sectoral, national, regional and international needs for data;• Be aligned with the country’s development program and poverty reduction strategy;• Incorporate views of all the main stakeholders – principally main data producers and users;• Build upon and increase the value of existing data processes;• Promote data quality improvements in line with international standards and good practice; and• Serve as a coordinating framework for mobilizing and utilizing resources (national, bilateral and international).
In order to achieve these major objectives and to better coordinate the work of elaborating or updating NSDSs in 51 African countries, an ADB Lead Consultant has been recruited who will guide both the technical aspect of the work and coordinate the work of other consultants that would be recruited to carry out the work in the countries.
2.4 Building Capacity for PPP-Based Poverty Measurement
The Bank has started a research study on poverty PPPs with the immediate objectives of: (i) constructing national poverty profiles using price data collected for ICP-Africa and expenditure weights obtained from household expenditure surveys, with the objective of supporting national PRSPs, and (ii) addressing long standing issues related to regional and global pov-erty analysis, and compile a set of PPPs that are more appropriate for making $1- and $2-a-day poverty lines operation-al both for regional and global poverty measurement and monitoring work, with the aim of producing reliable and timely data to support the MDGs.
The ultimate objectives are to: (i) build capacity in poverty statistics, and (ii) integrate poverty specific PPPs into the main stream of ICP-Africa. Within this broader context a few specific objectives are:
Charles Leyeka Lufumpa and Michel Mouyelo-katoula
AFDB-1-69.indd 40 11/1/05 8:17:55 PM
African Development Bank 2005 41
• To assess the quality of currently available poverty data by country and by sub-regions;• To estimate PPPs using the price data collected through ICP-Africa 2005 with poverty-specific data on expenditure
weights and prices;• Prepare monograph with an overview of the methodology, data collection procedures and the final estimates PPPs for
publication in 2006; and • Provide an assessment of the quality of national Price Indexes and poverty-PPP estimates in the light of the experience
gained during the current round of ICP-Africa, and make recommendations for statistical capacity building initiatives for the immediate future.
2.5 MDGs Monitoring and Statistical Literacy
The ADB is collaborating with the UNDP on a project for capacity and statistical literacy to monitor the MDGs and na-tional development plans with a view to improving the use of evidence-based methodologies for the management of de-velopment policy. The project has the broad objectives of improving accessibility of MDG and national planning data; in-creasing capacity; and increasing use of data for policy and public advocacy. With regard to statistical literacy, the aim is to develop the capacity among government officials, civil society organizations and academic institutions for better under-standing and wider use of the data, for monitoring of progress, advocacy and policy development. The ADB will coordinate activities in the region through organizing workshops for training of trainers of at least 12 participants from each country. This includes technical training on the use of software and promotion of data use and analysis.
2.6 Improving National Accounts
In many areas that impinge on the well-being of individuals and households, information about current socio economic conditions is critical. Furthermore, to be able to monitor progress towards the achievement of desired development goals, whether nationally determined or part of an internationally agreed consensus, regular and reliable data on economic and social performance are required. The means to identify obstacles in the way of such progress is clearly essential. The gov-ernment’s own direct contribution to this process is also required. But, in many African countries, relevant economic data remain unavailable or do not meet the international standards and norms. This is mainly true for data on detailed GDP ex-penditures and purchaser’s prices of major categories of goods and services traded in a national economy.
This translates into inability to meet corresponding data demands to support the effective monitoring of progress towards the achievement of internationally agreed MDGs and to reach declared poverty reduction objectives in particular.
To help correct this situation, the Bank has launched some capacity building activities aimed at assisting African countries to improve their national accounts by producing: • Timely national accounts;• National accounts drawn up specifically according to the international standards adopted in the 1993-SNA. • Independent expenditure estimates of the main macro-economic aggregates of GDP and their primary sub-compo-
nents; • Detailed expenditure measures relevant to the household sector, especially those applicable to specific socioeconomic groups
Strengthening Statistical Capacity in African Countries under the Framework of the International Comparison Program for Africa (ICP-Africa)
AFDB-1-69.indd 41 11/1/05 8:17:55 PM

African Development Bank 200542
such as the poor and vulnerable;• Related price information implicit in these expenditure estimates.
These activities will be implemented in the framework of the ICP-Africa, in terms of helping participating countries estimate detailed GDP expenditure data in the context of Supply-and-Use Tables (SUTs).
Lack of sufficiently detailed GDP breakdown of good quality that could be used as expenditure weights is a major hindrance to the estimation of PPPs. Many African countries still do not compile GDP by the expenditure approach and when data on GDP expenditure is compiled, it is not available at a sufficiently detailed level, even for countries where relevant basic data could be obtained inexpensively. The problem is aggravated by the fact that in most countries, though household expendi-ture surveys may have been conducted recently, few countries have ensured that resulting data are consistent with Nation-al Accounts data used in the compilation of GDP estimates.
In that context, ADB is assisting the countries in the compilation of detailed GDP breakdown, through a technical as-sistance program whose main objectives are to: (i) Provide a detailed assessment of the current status of the Nation-al Accounts particularly with regard to the status of implementation of 1993-SNA or hindrances to its implementation; (ii) Build upon and add value to existing data sources; (iii) Promote data quality improvements in line with international standards and good practices; (iv) Obtain accurate measures of national average prices for products in the ICP and de-tailed breakdown of GDP expenditures; and (v) Build a time series data base on the main approaches to GDP calculation i.e. value-added by industry and GDP by main expenditure categories. The work in national accounts will include the de-velopment of SUTs, which ICP-Africa is using as the main comprehensive framework.
The Bank is also looking at ways of providing funding to assist African sub-regional organizations (AFRISTAT, SADC, COME-SA and ECOWAS) and their respective member states in the soundly upgrading of their systems of national accounts along-side the 1993-SNA.
2.7 Streamlining and Improving Price Statistics in Africa: integrating ICP and CPI
Problems in price statistics in most countries relate mainly to data collection constraints: restricted geographical coverage, limited scope, editing, weighting structures, price averaging, and timeliness. Data collection is carried out in technical con-ditions that impair the quality and reliability of price indices produced. Sampling and item description do not soundly en-sure the relevance, representativity and characteristicity of items priced. Data collection rarely covers the whole country; it’s rather restricted to major cities or to the capital city only. In addition, price outlets are not adequately identified. Items are priced only for household consumption; no price indices are calculated for the other main components of GDP such as gov-ernment expenditure, gross fixed capital formation and net exports. Editing leaves a lot to be desired in many cases to the extent that actual price movements are not properly reflected in the CPI as prices quoted are not consistently verified and outliers are not questioned.
Since the most is not made of the results of household budget surveys and no surveys are carried out on gross fixed capi-tal formation, detailed weighting structures cannot be directly derived from the national accounts. To address these many issues, the Bank is providing technical assistance to African countries throughout the implementation phase of ICP data collection activities with a view to improving their ICP survey framework. The continuous furthering and updating of the
Charles Leyeka Lufumpa and Michel Mouyelo-katoula
AFDB-1-69.indd 42 11/1/05 8:17:55 PM

African Development Bank 2005 43
frameworks aims at improving the quality of data to be collected and ensuring that the frameworks are smoothly translat-ed into CPI-ICP survey frameworks.
2.8 Training of Country Professionals and Students through Statistical Training Centers (STCs) and Universities
National Statistical Offices are facing difficulties in mobilizing human resources to carry out their statistics programs. The role of Statistical Training Centers is vital in producing cadres at all levels (technicians and professionals) and so should have access to resources commensurate with the objectives set forth in their programs and the output expected there from. The reality is that these institutions, while facing this constraint, are at the same time under heavy pressure to be more produc-tive and effective.
STCs therefore need assistance in developing or strengthening their programs to make them respond adequately to data needs for ICP, PRSPs, MDGs, NEPAD and other development plans. Functional courses, designed to equip individuals with specific skills for performance specific functions, need to be supported as part of the capacity building measures.
As the current curricula at most training centers tend to be theory biased and do not necessarily encompass new challeng-es such as poverty reduction, comparison of purchasing power across regions and countries, etc, the ADB is working with Statistical Training Centers and some Universities in Africa to merge ICP knowledge in the curricula of statistical training institutes in Africa, as well as in economic faculties in African universities so as to make them more relevant to the African needs and context.
As the lead agency for ICP-Africa activities, the ADB is providing financial and technical support to STCs with regard to: (i) the coordination of country participation in regional training activities as described above; (ii) the development of training materials, mainly related to data analysis; and (iii) the delivery of training materials, with a focus on the involve-ment of African institutions.
STCs will also be required to allow the modification of their curricula for ICP purposes and the use of their facilities to host the ICP-Africa training. Six STCs have been selected to implement ICP-Africa training component: Ecole Nationale Supéri-eure de Statistique et d’Economie Appliquée (ENSEA-Abidjan), Institut National de Statistique et d’Economie Appliquée (IN-SEA-Rabat), Institut Sous-régional de Statistique et d’Economie Appliquée (ISSEA – Yaoundé), Ecole Nationale Supérieure de Statistique et d’Economie Appliquée – Département Statistique et de Démographie (DSD-ENEA-Dakar), Institute for Sta-tistics and Applied Economics (ISAE-Kampala), and the East African Statistical Training Center (EASTC- Dar Es Salam).
3. Conclusion
The availability of comprehensive, timely and accurate statistical information is crucial for effective national development policy making, decision taking as well as for poverty assessment and monitoring processes. However, the quality of statisti-cal information in the majority of African countries remains poor and needs improvement. Lack of statistical capacity -- as manifested in the inadequacy of human and financial resources to plan surveys, collect, process and disseminate data in a timely manner -- is one of the key constraints facing the many African countries today.
Strengthening Statistical Capacity in African Countries under the Framework of the International Comparison Program for Africa (ICP-Africa)
AFDB-1-69.indd 43 11/1/05 8:17:56 PM

African Development Bank 200544
In recognition of this challenge, the Bank has launched a major statistical capacity building program aimed at addressing these problems through the provision of financial and technical support under the framework of the ICP. In addition to the core ICP activities of generating PPP statistics, the Bank has taken a lead role in assisting African countries to improve their general capacity to support information needs for MDGs, PRSPs and NEPAD. Implementation of capacity building activities will certainly require an injection of adequate financial and technical resources from various stakeholders, among which the Bank is expected and willing to play a major role. Although the current financial support being provided by the Bank is for the period up to 2007, it is likely to sustain support to the countries beyond this period given the importance of statistics as a driver for evidence-based development policy formulation, implementation and monitoring.
Annex
Yaoundé Declaration on Statistical Development in Africa
The Directors of the National Statistics Offices (NSOs) from 51 African countries, having taken part in the meeting of the Regional Governing Board of the International Comparison Program for Africa (ICP-Africa) on 26 April, 2004 in Yaoundé, and having deliberated on the urgent and increasingly critical demand for reliable, timely and relevant data necessary for formulating, managing, monitoring and evaluating development policies and programs at the meeting of the Directors of the NSOs, April 26-30, 2004;
Considering that the indicators proposed within the framework of ICP-Africa will be of a great contribution to supporting the development and monitoring of the Poverty Reduction Strategies as well as supporting the optimal allocation of nation-al resources, the follow-up of the implementation of national policies and programs for the attainment of the MDGs;
Emphasizing that most statistical programs lack effective mechanisms to ensure their sustainability and ownership by the countries;
Acknowledging the importance of having sound and effective partnerships, identifying synergies, coordinating efforts, and pooling resources to advance a common goal;
Highlighting that the most critical challenges facing statistical systems in Africa remain the need to create greater aware-ness among policy makers about the importance of statistics and emphasizing the critical importance of securing financial and political commitment from government leaders;
Acknowledging that actions to strengthen national statistical agencies are likely to occur in the short to medium term only with external input that compliments government’s effort;
Recognizing and supporting the resolution of the Second International Roundtable, held in Marrakech, on managing for devel-opment results that call upon international and national policy makers to step up their support for statistical capacity building;
Acknowledging the great strides that have been made in the last two years under the initiative of ICP-Africa and recogniz-ing the importance of the program both as a source of reliable and policy relevant data, and as a comprehensive and co-herent regional capacity building framework;
Charles Leyeka Lufumpa and Michel Mouyelo-katoula
AFDB-1-69.indd 44 11/1/05 8:17:56 PM

African Development Bank 2005 45
Note with satisfaction the recommendations of the second meeting of the Governing Board of ICP-Africa and emphasize the need to prepare strategy papers on advocacy and building partnerships;
Adopt ICP-Africa as a flagship capacity building initiative in the area of economic statistics, with particular emphasis on price statistics and national accounts; Recommend to:
A. African Governments: • To put ICP-Africa, a program covering the entire Africa continent, at the core of statistical capacity building programs
for member countries; • To support statistical activities by making statistics a priority and allocating adequate resources; • To pursue the efforts of statistical harmonization and integration of activities by their NSOs, as well as regional and sub-
regional organizations; • To ensure capacity building in the development of statistical masterplans; in the coordination of national statistical sys-
tems; in human resource development (training, attraction and retention); and in analysis, report writing and dissemi-nation;
B. the bilateral agencies and international institutions • To continue working in the area of statistical capacity building by allocating more financial and material resources to
statistical activities; • To improve their partnership collaboration to facilitate synergy so as to ensure effective and coordinated support to the
countries; • To engage in advocacy work so as to give statistics a high profile and to secure financial and political commitment from
African governments.
C. the ADB as coordinating agency for ICP-Africa • To enhance priority given to statistics and provide optimal resources, both financial and technical, for supporting sta-
tistical activities in the African countries, given the importance of statistics in formulating, monitoring and evaluating poverty reduction strategies, in monitoring the MDGs and in managing for development results.
Adopted this 30th day of April, 2004 at Yaoundé, Cameroon.
Strengthening Statistical Capacity in African Countries under the Framework of the International Comparison Program for Africa (ICP-Africa)
AFDB-1-69.indd 45 11/1/05 8:17:56 PM

African Development Bank 200546
Abbreviations and Acronyms
ACBF African Capacity Building Foundation
ADB African Development Bank
ADF African Development Fund
AFRISTAT Economic and Statistical Observatory for Sub-Saharan Africa
BOCC Basket of Construction Components
COMESA Community of Eastern and Southern
Africa
CPI Consumer Price Index
DFID Department for International Development – UK
DSD-ENEA Ecole Nationale Supérieure de Statistique et d’Economie Appliquée – Département Statistique et de Démographie
EASTC East African Statistical Training Center
ECA Economic Commission for Africa
ECOWAS Economic Community of West African States
ENSEA Ecole Nationale Supérieure de Statistique et d’Economie Appliquée
FAO Food and Agriculture Organization of the United Nations
FASDEV Forum for African Statistical Development
GDDS General Data Dissemination System
GDP Gross Domestic Product
ICP International Comparison Program
ILO International Labor Organization
IMF International Monetary Fund
INSEA-Rabat Institut National de Statistique et d’Economie Appliquée
INSEE Institut National de la Statistique et des Etudes Economiques (French Statistical
Institute)
ISAE Institute of Statistics and Applied
Economics
ISSEA Yaoundé Institut Sous-régional de Statistique et d’Economie Appliquée
IT Information Technology
MDGs Millennium Development Goals
MAPS Marrakech Action Plan on Statistics
NEPAD New Partnership for Africa’s Development
NORAD Norwegian Agency for Development
NSDS National Strategies for the Development of Statistics
NSO National Statistical Office
NSS National Statistical System
PARIS21 Partnership in Statistics in the 21st Century
PPP Purchasing Power Parity
PRS Poverty Reduction Strategy
PRSP Poverty Reduction Strategy Paper
SADC Southern African Development
Community
Charles Leyeka Lufumpa and Michel Mouyelo-katoula
AFDB-1-69.indd 46 11/1/05 8:17:56 PM
African Development Bank 2005 47
SNA System of National Accounts
SPD Structured Product Description
SRO Sub-Regional organization
STC Statistical Training Center
SUT Supply and Use Table
UN United Nations
UNDP United Nations Development Program
UNECA United Nations Economic Commission for Africa
UNESCO United Nations Educational, Scientific and Cultural Organization
UNFPA United Nations Fund for Population
Activities
UNICEF United Nations Children’s Fund
UNSO United Nations Statistics Office
USAID United States Agency for International
Development
References
African Development Bank (2003-2005), Various Methodological Papers on the implementation of ICP-Africa activities, Tunis, (to be published on the Bank’s ICP/Sta-
tistics website).
United Nations (1992), “Handbook of the International Comparison Programme” Studies in Methods Series F Number 62, United Nations, New York, NY. 50-51.
World Bank, “ICP 2003-2006 Handbook”, available at http://www.worldbank.org/data/icp
Strengthening Statistical Capacity in African Countries under the Framework of the International Comparison Program for Africa (ICP-Africa)
AFDB-1-69.indd 47 11/1/05 8:17:56 PM

African Development Bank 200548
1: Statistician-General, Private Bag X44, Pretoria, 0001 e-mail address [email protected]
Summary
This paper plots the trajectory of the last ten years of statistical practice in South Africa. Its focus is on the ten years of 1994-2004 (the first decade of democracy post-apartheid), although some information on 2005 has been included, where pertinent.
The paper provides a set of short remarks on the pre-1994 period. Prior to 1994, official statistics reported adequately on the white minority, and the vital registration systems covered this section of the population fairly comprehensively. However, in the ab-sence of a national system focusing on the total population, the stage was set for the fragmentation of statistics in their thematic and spatial representation. This fragmentation included the institutional basis for producing statistics, and was directly linked to the requirements of apartheid governance. To the extent that those excluded from access to power and resources appeared in the official statistics, it was as objects of policy, for purposes of control and the geographical fragmentation that underlay apartheid. As apartheid was dismantled, and the foundations for a new inclusive democratic order were initiated, this fragmented system of statistical producers represented a terribly under-prepared flock of contestants clamoring to catch the eye of the new bureaucracy.
A new Statistics Act was enacted in 1999, but the void that it sought to fill was deep and broad and meant that it would take some time before the Act could be adequately implemented, despite the strength it wields in terms of statistical co-ordination.
South Africa entered the new millennium as a modern economy, with a strong series of the statistics required for measur-ing, monitoring and planning. However, the poor institutional integration of the statistics system has continued to weaken the value of the statistics themselves. Efforts to attend to integration and development of a national system of statistics, to-gether with an impatience to address errors and inadequacies in the statistical collections themselves, form the backdrop to this exploration of the different phases of South Africa’s statistics system in transition.
Key words
Official statistics, staircase model, Central Statistical Services, Special Data Dissemination Standards, National Statistical System,
1. Introduction
This paper reviews ten years of statistical practice in South Africa, broken down into four periods: 1994-1998, 1999-2000,
Statistics South Africa in Transition:Reflections on a decade of Statistical Practice
(1994-2004)
Pali Lehohla1
AFDB-1-69.indd 48 11/1/05 8:17:56 PM

African Development Bank 2005 49
2001-2002 and 2003 to present. This sort of periodisation is, of its nature, an approximation of the complexity of discon-tinuities, change and consistencies. Institutional transformation is usually subject to a complicated mix of radical ruptures and more-tranquil continuities, a more subtle blend of the past, present and future than the theorists would have us be-lieve. Transformation is more an ongoing process than a set of dramatic events.
Prior to 1994, apartheid in all of its manifestations – political, social, economic, ideological and cultural – dominated soci-ety. This included the collection and dissemination of statistics, both official and other.
Official statistics reported adequately on the white minority, and the vital registration systems covered this section of the pop-ulation fairly comprehensively. However, in the absence of a national system focusing on the total population, the stage was set for the fragmentation of statistics in their thematic and spatial representation. There were very few attempts to ascertain what was happening to the majority population group, nor was there any statistical infrastructure that would allow the col-lection of data from this group.
Social policy was determined by a small group with their own information systems, and they placed little reliance on official statistics. The role of the statistical office was to produce data used primarily as historical information. As a result, timeliness, quality and relevance were less significant than would have been the case if the data had been used for policy purposes. Periodic releases reported at intervals that were more than six-fold of the reference period (a monthly series would be re-leased at least six months later than the reference month). The quality of the information that was released was difficult to determine, as metadata specifying methodology, definitions, standards and the like was largely absent.
South Africa’s system of statistics prior to 1994 produced and reproduced a fragmented and deeply divided statistics prac-tice. The statistical and research landscape consisted of research agencies, the official agency, the homeland agencies, de-velopment agencies and academia.
The consequence was that, prior to 1996, there were few nationwide benchmarks against which to measure progress and change post-apartheid. The most conspicuous result of this practice of intentional omissions is reflected in the difficulty South Africa faces in measuring progress towards the Millennium Development Goals, precisely because of the difficulty in establishing historical benchmarks. The second manifestation of this legacy is reflected in the inconsistent conclusions drawn from the Human Development Index of the UN Human Development Report Office. The effects of transformation of official statistics post-apartheid have been tumultuous, reflecting the consequences of un-usually fast change, competition between new priorities and existing demands, and the growing centrality of official statis-tics in both public and private spheres.
The initial consequences of change, linked to a limited skills and capacity (both qualitatively and quantitatively) resulted in errors of statistical computation that seriously undermined the credibility of official statistics, and focused leadership’s col-lective eyes on issues of governance and management in the statistical cycle.
In the last period under review (2003 to the present), the organization embarked on a number of focused responses to ad-dress the consequences of rapid transformation, including
Statistics South Africa in Transition: Reflections on a decade of Statistical Practice (1994-2004)
AFDB-1-69.indd 49 11/1/05 8:17:57 PM

African Development Bank 200550
• a concerted effort to introduce and sustain improved quality in all phases of the statistical cycle;• addressing the changing range of user requirements for statistics;• greater international engagement; and• strategic deployment of existing staff for training, and recruitment new staff with appropriate skills.
Stats SA still has a number of challenging steps to climb: however, the organization now hold out the promise of a statisti-cal agency well-equipped to play its role in national development, and participate as an equal in the world of internation-al statistical practice.
2. The 1994-1998 Period
The period 1994 to 1998 involved a period of extreme rapid change. In its assessment of what was then known as Central Statistical Services (CSS), a Swedish mission noted that the organization must have transformed faster than any other sta-tistical agency in the world (Swedish Mission, 1998). The extent and speed of the changes posed substantial problems with which the CSS grappled, not always with complete success. In further questioning whether such momentum was sustain-able, the mission implied that it might be dangerous to undertake change at such a pace.
Pali Lehohla
Stage 4:The organisation
works actively with
its clients
Stage 3:The organisation
carries out changes
on its own
Stage 2:The organisation
delivers expected
output
Stage 1:Low and
unpredictable
output
AFDB-1-69.indd 50 11/1/05 8:17:57 PM

African Development Bank 2005 51
The Staircase Model for institutional assessment applied by the Swedish mission involved the following organizational ‘steps’:
Stage 1: The organization has low and unpredictable output.Stage 2: The organization is able to deliver expected output with reasonable reliability and quality.Stage 3: The organization carries out changes on its own. Stage 4: The organization works actively with its clients or customers.
On this model, an organization has to fulfill the requirements of one stage before it qualifies for the next, i.e. the fact that an organization is very developed in terms of client relations does not make it a Stage 4 organization. First it has to at-tend to its output and internal development, in order to climb from Stages 2 and 3. In essence, the Swedish mission ques-tioned whether the rate of institutional change in Stats SA had allowed for successful consolidation of each of the stages set out in the model.
2.1 Changing the leadership of CSS
The head of the apartheid-period CSS remained in office for more than a year after the new government took office in 1994, whilst the next level of managers remained in place for various lengths of time up to 1998. In similar vein, the Statis-tics Council was only replaced in 1996 by a more broadly representative interim Council. A new Statistics Act was enacted towards the end of 1999. Within the CSS, as in many other institutions, remnants of legislation, personnel, and spatial ar-rangements instrumental to sustaining apartheid, clumsily clung onto the system of statistics as the sun set on apartheid. These interim arrangements co-existed uneasily with powerful impetuses for change.
As Orkin et al (1998) put it,
“Various important external developments soon added pressure onto this inadequately prepared environment, and as it were impinged upon the CSS negatively in this uneasy period. After 1994 the ‘independent states’ and other homelands were re-incorporated into what used to be ‘White’ South Africa, and nine new provincial governments created, exercising appreciable devolved responsibilities for health, education and welfare services as well as associated financial autonomy. The incumbents of the various racially or linguistically segregated administrations were lumped together under new leadership, and enjoined to rationalize. Several hundred previously segregated local authorities and their administrations were similarly realigned” In July 1995, the first steps to change leadership of the organization were taken, with Mark Orkin appointed head, and the writer and Orkin’s eventual successor (Pali Lehohla) appointed as Chief Director of Demography.
Over a very short period, a new hierarchy of users, with high expectations of changed and improved statistical delivery, was created. These users expected to be served with up-to-date statistics that were integrated and organized according to new spatial definitions.
The luxury of several years that statistical development requires was compressed into a few months. Every survey instru-ment was conceived as a possible candidate for delivering the information requirements, resulting in congested and lengthy questionnaires.
Statistics South Africa in Transition: Reflections on a decade of Statistical Practice (1994-2004)
AFDB-1-69.indd 51 11/1/05 8:17:57 PM

African Development Bank 200552
2.2 Census ‘96 as an agent and expression of urgency for change
Change was an imperative and was to be undertaken simultaneously on all fronts in order to maintain momentum and meet the deadlines for public sector transformation. An important component of the reconstruction of the society was a credible information base. The 1996 population census was seen both as a way of constituting such an information base, and as a nation-building exercise (counting all South Africans as part of a consolidated nation for the first time). However, this was a high-risk operation. Most plans were completed less than 12 months from the census date, while some, cover-ing for example payment of temporary field staff, were only finalized as enumeration drew to a close! Data capturing was undertaken in nine separate locations (one in each province) – a bad decision for control of quality and accuracy, although a good one in terms of equal access to temporary employment in each province. Later the organization regretted the deci-sion as management infrastructure was stretched across processing centres to deal with wildcat strikes.
Worst still was the rush to provide preliminary results from the raw count. This backfired badly when the final result differed markedly from the preliminary count. A rescue plan was put together, forcing the CSS to learn that statistics are as much about proper execution of an estimation procedure as they are about communication. Although corrective steps were tak-en and the reception to the changed results was overwhelmingly positive, the organization is still dogged by problems of communication of its statistics.
2.3 Introduction of new technology and implementing timeliness
During this period, the organization pledged to put a computer on each staff member’s desk and used sophisticated cut-ting-edge technology to deliver census results. Thanks to increased funding for the census, each staff member had a com-puter delivered at their desk, and a network and Internet link. All staff were compelled to start using the Microsoft Office suite of software, which soon replaced the existing and often-incompatible mix of mainframe programmes and other PC applications.
The acquisition of the Australian-developed SuperCross software to disseminate Census ’96 results was highly successful, with the software soon being extended to other series, and also used for Census 2001. However, the decision to sell prod-ucts from the 1996 census was a major error, and user resistance to this decision limited use of the data. By the time data from Census 2001 was being released, access to census information and linked software was virtually without cost to us-ers, and application of census data increased dramatically.
Timely release of data was prioritized, and new management implemented a policy that results from monthly series had to be released within six weeks of the end of the relevant reference month. For quarterly series, release had to be undertaken within fourteen weeks. This routine has been observed without fail for all the 256 series that are produced.
2.4 Geography as a catalyst for enhancing interdepartmental collaboration
As the 1996 census operations drew to a close, an ambitious interdepartmental project was being born. Sparked by the need for a national election in 1999, and based on extensive paper-based map work conducted in preparation for the cen-sus, the Department of Land Affairs, the Independent Election Commission and Statistics South Africa worked on the paper
Pali Lehohla
AFDB-1-69.indd 52 11/1/05 8:17:57 PM

African Development Bank 2005 53
maps to convert them into a spatial dataset. This was converted into an electronic spatial dataset by drawing polygons us-ing the technology of Global Positioning Systems (GPS).
This national asset was subsequently used for planning Census 2001, is integral for running surveys, and addresses dissem-ination of small area statistics by making results available through a GIS-based technology.
2.5 Introducing social surveys
A household survey, based on the 1992 World Bank survey, was introduced as a benchmarking and monitoring instrument in 1994 and run as the October household survey (OHS) every year up to 1999. The survey was discontinued when the or-ganization was not allocated sufficient funds to continue running it, and was replaced by a labour force survey in 2000. To some extent, this reflected a shift in priorities to labour market data. A number of ad hoc social surveys were conducted in this period, such as the victims of crime and time-use surveys.
2.6 Overview of the 1994-1998 period
Within the CSS, 1994 to 1998 saw rapid change, including improvements in timeliness of release of economic statistics, the implementation of the first series addressing social concerns, and the introduction of new technologies which radical-ly altered the way in which statistics were collected, processed, analyzed and disseminated. During this period, the first inclusive population census conducted under democratic rule was undertaken. However, the most significant changes in-volved the dissolution of the old order’s management, and its replacement with a leadership team committed to a new role for statistics within a democratic society.New legislation governing official statistics was introduced in the 1999-2000 period (the Statistics Act of 1999); the CSS was renamed Statistics South Africa (Stats SA); and a comprehensive review of national accounts was undertaken includ-ing the rebasing and benchmarking of the GDP.
In this first phase of change, the agency had to negotiate its way through a disjuncture of structure, function and man-agement style. This was more widely reflected in a period of tumultuous social change in the wider society. The phases of change moved through the last vestiges of apartheid, the excitement of the transformation phase accompanied by optimis-tic innocence and sweet illusion about the outcome of this transformation.
A significant contribution by the organization was Census ’96. The information produced is used as input to a wide range of interventionist policies designed to improve the welfare of the majority of the population. The population censuses of 1996 and 2001 were particularly significant in this regard. Khalfani et al argue that:
“compared to the previous censuses the 1996 census was a huge success … Such a large improvement in enumeration re-flected the political success of the reformed South African government and the capable efforts of a reformed statistical de-partment as part of the new administration”.
The extensive use of census data in government’s ‘Towards the Ten Year Review’ (GCIS, 2004. further attests to the depth of usefulness of the information.
Statistics South Africa in Transition: Reflections on a decade of Statistical Practice (1994-2004)
AFDB-1-69.indd 53 11/1/05 8:17:57 PM

African Development Bank 200554
However, most major initiatives have required experts from other countries to plan, schedule and organize new statistical ef-forts. A good example of this involved the Swedish technical assistance programme that was deployed from 1995 to 2002. Timing of this important assistance given coincided with a void in the recipient organization. So high were the demands on the organization and so few were the human resources to address these demands that the Swedish consultants found them-selves deployed in line functions. At the end of the agreement, the organization found itself pleading with the consultants to stay longer, because there had been inadequate capacity with Stats SA to incorporate skills transfer, and because there were no local counterparts to take over the line functions the Swedish consultants had filled.
Wisely, the Swedes were adamant that their time for assisting was up, and Stats SA was forced to increase its capacity to absorb the benefits of international assistance. Increasingly, the Department sources international consultancies on a ‘re-cipient-pays’ basis, and this assists in limiting the time periods for such assistance, and deploying it as effectively as is pos-sible.
There is still insufficient statistical, organisational and technical integration. This has been a significant contributing factor to the relatively low quality output of the organisation. The pre-1994 international isolation of the South African regime meant that most local statisticians were kept ignorant of developments in official statistics, and this is a legacy that will re-quire many years to overcome.
With hindsight, we have learned that new problems invariably arise out of solutions executed. We succeeded in the neces-sary destruction of the old and we now can see the first promise of the benefits. However, consolidation of this process posed sometimes bigger and even more-complex challenges. Expectations were high, and the organization was young, inexperi-enced, ill prepared, enthusiastic and full of energy. In a world that did not stay still for a moment, playing catch-up while meet-ing new expectations is no easy task.
3. The 1999-2000 Period
The period 1999-2000 was one of relative calm and consolidation. The results of the 1996 census had been delivered, the reporting cycles for statistical releases had been brought in line with best international practice, the series had become compliant with the International Monetary Fund’s Special Data Dissemination Standards (SDDS), the GDP was rebased and benchmarked and the exit of the old guard of senior managers had been largely completed.
This gave the organization a moment to reflect on what direction it would take, and there was sufficient stability to intro-duce strategic planning rather than ongoing crisis management. The organization changed its name from the Central Sta-tistical Service to Statistics South Africa and the new Statistics Act was enacted. Head of Stats SA, Mark Orkin, seem jus-tified in his assessment that there was a new calm, not a bleep on the media monitors, and that he could after five years sleep easy.
3.1 Signing up to the Special Data Dissemination Standards
South Africa’s decision to sign up to the Special Data Dissemination Standards of the International Monetary Fund (IMF) was a milestone during this period. South Africa was one of the few (and first) countries to sign up to the SDDS, and the
Pali Lehohla
AFDB-1-69.indd 54 11/1/05 8:17:57 PM

African Development Bank 2005 55
only one on the African continent to have done so. Important as the SDDS is for purposes of reliable international compar-ison, signing up had its consequences, especially in terms of balancing workload, governance, staff training and data and product quality.
In November 2003, South Africa’s Minister of Finance, Trevor Manuel, raised the difficulties in establishing this balance when he addressed the Fiftieth Anniversary Conference of the South African Statistics Association :
“The fourth challenge is to try and pace ourselves relative to our capacity … South Africa, or parts of it, are highly sophis-ticated. We aren’t deemed either highly indebted or poor. We are thus required to play in a different league. We have to comply with the Special Data Dissemination Standard (SDDS). The requirements are onerous. Yet, we must recognize that the South Africa of the majority is indeed deeply poor. Similarly, we lack a sufficient skills endowment to meet all of the re-quirements. SASA must rise to the challenge of deepening the skills base whilst engaging in a process to determine how much we can undertake reasonably”.
There is little doubt that the efforts and resources required to adhere to the SDDS exacerbated some of the difficulties Stats SA faced in 2003. We have come to see that ambitious decisions in a context of stretched resources can have negative con-sequences!
3.2 Rebasing and benchmarking the Gross Domestic Product (GDP)
Following the requirements of United Nations System of National Accounts (SNA), revisions to national accounts figures for the five-year period 1993-1998 were completed by June 1999. The improvements in measurement raised level estimates by upwards of between 11% and 14%.
3.3 Planning for Census 2001 and introducing the labour force survey
This period also marked the beginning of preparations for Census 2001. We had at that point hardly licked our wounds from Census 1996, including an unresolved issue of ‘unauthorized expenditure’ of R36 million which was the subject of a Parliamentary enquiry.
In the area of social statistics, a new half-yearly labour force survey (LFS) was introduced to deal with employment measure-ment, reflecting the importance of labour market data for governing policy, planning and monitoring.
3.4 Laying the foundation for use of administrative records
Further improvements in economic statistics were mooted through the use of an integrated business register. This was the solution proposed for the degenerating sampling frame used for economic surveys, and a memorandum of understanding to develop a new register was signed by the four participating departments (Labour, Trade and Industry, South Africa Rev-enue Service [SARS], and Stats SA). This was followed by a change in legislation enabling SARS to make tax data available to Stats SA for statistical purposes.
Statistics South Africa in Transition: Reflections on a decade of Statistical Practice (1994-2004)
AFDB-1-69.indd 55 11/1/05 8:17:58 PM

African Development Bank 200556
3.5 Government voices emerge
At the same time as these changes were occurring, government began demanding more and better statistics at all three levels (national, provincial and local), as well as requiring more and better coordination of information bases used for deci-sion-making. This increased attention to matters of official statistics placed Stats SA far closer to the centre of government policy, planning and monitoring than before. Increased use of, and attention to, statistics was welcome indeed. At the same timer, it placed growing pressure on the organization to seek means of co-ordinating the production of statistics across gov-ernment – one of the requirements of the Statistics Act.
3.6 Staff matters and governance
As transformation progressed, a range of new stakeholders began demanding a role in organizational management and de-cision-making. Trade unions organizing within the public sector, and the staff they represented, began challenging depart-ments on issues previously viewed as prerogatives of government. With their history of central involvement in the struggles to overthrow apartheid, trade union efforts to become more influential in issues of departmental governance and strategic direction demanded sensitive and careful response, without undermining management’s authority and ability to manage. For the first time management was challenged on matters of transformation by the unions, and some differences in ap-proach between unions and government – to date close allies because of a shared history of struggle and a common com-mitment to transformation – began appearing.
3.7 The transition in transition
Organizations in transition are never static, and rarely tranquil for any period. It was not long before new challenges and associated difficulties revisited the organization. This occurred despite the strategic planning meetings in which the organi-zation admitted to an over-reliance on crisis management and ad hoc decision making, and committed to a more-planned work programme. This time the challenges included planning for Census 2001, finalizing implementation of Y2K compli-ance, and greater discipline and prioritization in taking on new projects.
Pioneer head Mark Orkin had left, Ros Hirschowitz acted as caretaker from July to November 2000, and the writer was ap-pointed South Africa’s first Statistician-General in terms of the Statistics Act in November 2000.
The period presided over by Ros Hirschowitz was a particularly difficult one. Orkin’s style of management and leadership, like most pioneer agents of change, was perceived as autocratic, and the change of guard provided an opportunity for is-sues to boil over. In particular, matters relating to staff, transformation and the role of provinces became heavily contested. This simmering pot boiled over, and Hirschowitz spent a large part of her five months as acting head putting out fires.
There were a number of challenges to existing management during Hirschowitz’s brief tenure, including the formation of an organizational development task team (OdeTT), which made proposals on many of the issues which seemed to be di-viding the organization. OdeTT’s membership was drawn from trade unions, head office and provincial staff, and manage-ment. Based on its recommendations, Stats SA management committed itself, in February 2001, to an agenda for change that was underpinned by
Pali Lehohla
AFDB-1-69.indd 56 11/1/05 8:17:58 PM

African Development Bank 2005 57
• improving stakeholder relations, • a focus on people development, • developing a culture for the organization and improving the working environment, • developing processes and systems to ensure predictability, and • implementing an organizational design to suit delivery.
With the appointment of a new departmental head, and Statistician-General, in November 2000, the uncertainty over lead-ership of the organization was resolved. However, issues relating to organizational design persisted and a new structure was only finalized in April 2001.
The process associated with OdeTT had initiated the building of a new trust amongst the diverse constituencies making up Stats SA, and the organization appeared ready to enter its next phase on the basis on a strong consensus.
3.8 Overview of the 1999-2000 period
At the end of 2000, the composition of the organization was completely different from that of 1994. It still lacked, however, the skilled human resources and proper plans required to shift it out of a mode of permanent crisis management.
Technology had been modernized without staff becoming modern; production methods were still archaic and individual re-tention and storage of documentation prevented the development of a functional system of knowledge management and information retrieval.
The signing up to the IMF’s SDDS had brought new pressures that reinforced routine ways of working without reflection as a way of meeting punitive deadlines. However, the GDP had been successfully re-based and benchmarked, plans for Census 2001 were well advanced, and preparations for the new labour force survey were underway.
Government was making its expectations known as the principal stakeholder of official statistics, and the organization was exploring the landscape and seeking ways of meeting these increasing user demands. Dissenting voices were being raised about the pace and content of transformation and governance, particularly from the trade unions.
With its limited capacity, and absence of depth and experience in management and leadership, the organization had reached a point where it was poised on the brink of a crisis. This was compounded by change in leadership. The creation of OdeTT al-lowed for managed change amongst staff and management and created conditions for a shared vision.
4. The 2001-2002 Period
With a new head and Statistician-General at the helm, expectations, particularly within Stats SA, were heightened. For the first time, the head of the statistics agency was a full director-general (the CSS had been headed by a deputy director-gen-eral), and this created an expectation among staff of an overall improvement in prospects. Many staff may have concluded that the new head, being black, would be more sensitive to aspirations of black staff, while some among the white staff might have been fearful of this first black head of department.
Statistics South Africa in Transition: Reflections on a decade of Statistical Practice (1994-2004)
AFDB-1-69.indd 57 11/1/05 8:17:58 PM

African Development Bank 200558
However, most of the new management appointed, as well as the new head, had worked in Stats SA for some time, and this continuity assisted in controlling unrealistic expectations and unreasonable fears. What remained was the enormous task of organizational development and building.
The development of an overall strategy document, funded by the Partnership in Statistics for development in the 21st cen-tury (PARIS21), a global consortium of policy makers, statisticians, and users of statistical information, was an important brick in the building process. Ben Kiregyera2 was deployed as a consultant by PARIS21 to South Africa. A next step entailed implementation of the first phase of the National Statistics System (NSS), which consisted of advocacy, the third introduced a dedicated component unit responsible for statistical quality, while a fourth introduced a dedicated programmes and proj-ects unit as a way of introducing project management and management information systems.
The relative lull in public and media attention that Stats SA experienced in the 1999-2000 period extended into 2001 and 2002. This allowed for a period of introspection as well as the consolidation of a workforce committed to a new leadership. But this was the calm before the storm. The full impact of the changes that occurred in the preceding five years was to be felt in the period beyond 2002.
4.1 Spelling out the priorities
Within a week of appointment, the Statistician General (SG) spelt out new organizational priorities, including a strength-ened commitment to training, skills development and human resource development, and improvement in working condi-tions. The first framework for these priorities was the Reconstruction and Development Programme (RDP), (a base policy prepared by the ANC before it took power). The second was Growth, Employment and Redistribution (GEAR), government’s policy top address building the economy, and achieving macro-economic stability through employment and redistribution.
4.2 Production inputs to meet priorities
In order to achieve these goals, the SG began specifying the inputs to these priority areas were, and how they would be managed. The key inputs to the production system were defined as
• statistical units;• their associated data items;• the relevant classifications into which these units and their data items are grouped; and • the standards that are applied in the treatment and reportage on these statistical units and their respective data items
over time.
The process of understanding and unpacking these areas, together with the application of the related statistical procedures, would enhance data governance and coherence over time. However, it took some time for all staff to absorb this new way of defining the core elements of Stats SA’s business, and placing them at the centre of all activities (including support func-
Pali Lehohla
2: Ben Kiregyera is the Chairperson of the Board of Directors, Uganda Bureau of Statistics (UBOS), he is also the first African to win the Mahalanobis Award
AFDB-1-69.indd 58 11/1/05 8:17:58 PM

African Development Bank 2005 59
tions). Indeed, it was the misunderstanding of, or resistance to, this approach which led a small group of managers to at-tack the leadership of Stats SA, and call for the removal of the Statistician-General.
4.3 Frames for collection and estimation
The role of collection frames in statistical production now formed an integral part of statistical units, data items, classifica-tions and standards and, as a consequence, these frames had to be evaluated, strengthened and, where necessary re-en-gineered or totally replaced.
By building and enhancing the geographic frame, the quality of statistics would be improved. This is because geography provides a dimension of uniqueness for a statistic relating to a statistical unit. Subsequently the organization invested heav-ily in geography and the associated technological infrastructure.
The second central frame was the business frame, which is the basis for drawing samples in the collection of economic sta-tistics. Classifications were implemented for purposes of disentangling establishments from enterprises and subsequently classifying each establishment by its key operation and product.
The third frame was the population of people. Primarily sourced from the population census and mapped geographically, this would be continually tested for quality and improved through application of the population register and vital registra-tion systems. This has necessitated intensive collaboration with the Department of Home Affairs on the population register and the management of information on vital events (including a project to capture data on causes of death).
4.4 Reviewing organizational structure
Management had pledged that it would look at an organizational design that would facilitate delivery. By October 2001, the first two deputies to the Statistician-General were appointed. The third level of the structure was systematically filled over the year 2002. Three new units were created. The first focused on quality, the second would lead programme and proj-ect management and the third was to lead the national statistics system.
4.5 The crisis of Census 2001
Census 2001 posed major challenges for the organization. Although better resourced than the 1996 census, reliance on external contractors for a range of services proved less successful than expected. As enumeration loomed, additional ques-tionnaires of appropriate quality for scanning had to be printed, at great cost and speed, in the United States. Difficulties arose with the consortium appointed to assist in recruitment of temporary staff and develop a payments system for over a hundred thousand enumerators, and Stats SA took over this operation at short notice. Scanning-based data processing, us-ing intelligent and optical character recognition, was introduced in an attempt to speed up release of census results. How-ever, this proved far more complex than anticipated, and the relationship with consortium appointed to undertake this had to be restructured to become more of a joint venture, which absorbed and diverted the majority of the resources of the or-ganization. This exposed the institution to other risks and dangers.
Statistics South Africa in Transition: Reflections on a decade of Statistical Practice (1994-2004)
AFDB-1-69.indd 59 11/1/05 8:17:58 PM

African Development Bank 200560
4.6 The acid test on economic statistics
As the organization began to rollout the census, other areas of concern had emerged. An internal research document from the new Quality and Methodology unit questioned the very basis of economic statistics (the business register used as the basis for a sampling frame). This research prompted intense debate on the condition of economic statistics. The discussions, although acrimonious at times, were well-managed, and broad consensus was finally reached. It was concluded that the quality of the economic series suffered from:
• A deficient business register.• Obsolete samples.• Application of questionable methodologies in respect to imputation, weighting and raising factors.• Inadequate professional competencies.• Poor management processes.
The combined result of these factors had resulted in under-estimation of some areas of economic activity, with inevitable consequences for estimation of GDP.
Some reluctance to acknowledge these serious quality issues had to be carefully managed to prevent it from turning into a resistance against measures ‘that the agency might want to introduce towards the improvement of the quality of its products (Arrow, 2001). Von Reibnitz and Ryten (2004), in their assessment of the situation at the beginning of 2003 stated that:
“The current malaise of Stats SA economic statistics can be traced back to the lack and/or poor quality of its business regis-ter. The AUSAID consultancy missions of 1996/97 clearly established the weaknesses in the economic statistics. Importantly the missions made a set of recommendations, few of which have been implemented”.
The internal Acid Test Report of 2001, and the input by Von Riebnitz and Ryten (2004), formed the basis for the develop-ment of a strategy to revive economic statistics. The preamble to this strategy notes that
“strong consensus is emerging around a strategy which will have to be pursued over the next two years in the ten main activity streams in economic statistics, if Stats SA is to meet the goal enunciated by the Statistician-General to lift the qual-ity of the economic statistics output of Stats SA to a level which will satisfy the reasonable requirements of the major na-tional and international users”.
Importantly, this process broke a culture of silence which had previously masked key organizational weaknesses, and added to the richness of a culture of debate that emerged in OdeTT.
4.7 Training
Management’s new commitment included development of human resources as a central element in organizational life. This aimed at addressing the limited skill base in Stats SA, which was the result of changed requirements of staff in terms of skills, experience and knowledge; and a consequence of the appalling neglect of mathematical and statistical skills at pri-mary, secondary and tertiary levels over decades, especially where black pupils and students were concerned.
Pali Lehohla
AFDB-1-69.indd 60 11/1/05 8:17:58 PM

African Development Bank 2005 61
The first task was to seek advice from institutions in South Africa and abroad on how to deliver through better skills. A for-eign study training programme was initiated and Stats SA has, since 2001, been sending staff for further study at the East African Statistical Training Centre (EASTC) in Dar es Salaam, Tanzania; and the Institute for Statistics and Applied Econom-ics at Makerere University, Uganda. Collaboration with local universities is under exploration, and a group of Stats SA staff members have undertaken post-graduate study at the University of Witwatersrand.
Training initiated by Stats SA is expected to reach beyond the development of professional statisticians. Management was shocked when it found that two messengers who had joined the department thirty years back were about to retire – still as messengers. To demonstrate commitment to building human resources, management pledged that never again would a staff member who joined the organization in a junior capacity retire in that same position. As a consequence, messengers and cleaning staff are now provided with facilities for improving their skills, especially in the use of computers.
4.8 Creating statistical infrastructure
The collection and dissemination of statistics requires a system that is logically integrated in terms of legislation, geogra-phy, resources, technology, users, producers and suppliers. The infrastructure critical to this integration consists of legisla-tion, geographic distribution, technology and resources. In the period under review, Stats SA has had to create and develop almost all elements of this required infrastructure:
In terms of legislation, the Statistics Act of 1999, that governs statistics in South Africa has been hailed as particularly forward-looking, especially in respect of the powers of co-ordination vested in the Statistician-General. However, Bill McLennan (2004) has noted that these powers have not been fully used: ‘In a way this is a pity as Statistics South Africa has the strongest leg-islative backing I have seen for producing, or encouraging, a properly co-ordinated statistical service across governement.
Geographically, each of South Africa’s nine provinces has a statistics office, and regional offices being developed within each province. The provincial and regional offices are at the centre of Stats SA’s decentralized fieldwork and survey strategies.
In the first five years following the inauguration of democratic governance, the organization experienced severe resource constraints. Resource allocation improved considerably thereafter. The physical move to a new building was completed smoothly, and staff settled easily into a new environment.
Access to cutting edge technology, especially in data processing, analysis, dissemination and – more recently, the data ware-housing project – has become progressively easier, with positive effects on delivery, performance and quality.
4.9 Improving communication
Communication with stakeholders, especially in the area of media relations, took on a high priority in anticipation of the re-lease of census results. One of the most successful initiatives involved an agreement with a national daily business news-paper for a weekly column by the Statistician-General. This has become a central tool in explaining statistical processes, alerting users to important issues, responding to controversial statistical issues of the day, and clarifying ambiguity in the uses and abuses of statistics.
Statistics South Africa in Transition: Reflections on a decade of Statistical Practice (1994-2004)
AFDB-1-69.indd 61 11/1/05 8:17:59 PM

African Development Bank 200562
Since 2002, when the column first appeared, it has been published by Business Report on Thursdays, under the title of ‘In-side Statistics’, and has garnered a considerable readership.
4.10 Overview of the 2001-2002 period
The 2001-2002 period ushered in a new leadership deriving its mandate from the Statistics Act; a second population cen-sus was undertaken; and the fundamentals of South Africa’s economic statistics were challenged from within Stats SA. The new leadership introduced an intense focus on development of human resources, including representivity in staffing aimed at redressing racial imbalances inherited from the apartheid past. Attempts were made to address some of the organiza-tional instabilities which had resulted from the previous period of rapid change.
The period 2001-2002 saw a change of guard at senior level, as well as a shift in management and leadership style. A co-alition committed to new directions was established through the formation of OdeTT and increased trust and the ability to work together amongst diverse constituencies. With a commitment to the agenda to change, a new organizational cul-ture began emerging.
While not all commitments in the agenda for change were met, the crucial one on improving skills was started and has fo-cused staff and management on training. Awareness of Stats SA and the uses of official statistics increased considerably over the period, focusing more attention on the department and its outputs.
Questions on the quality of economic statistics, and the neglect of other work areas brought about by the pressure of the population census, were being raised with increasing frequency and intensity. Partially in response to these concerns, it be-came increasingly apparent that improvements in statistical quality would have to be linked to the development and im-provement of geographical, business and population frames.
5. 2003 to the present
Early in April 2003, Stats SA acknowledged that it had erred in overstating the rate of increase in the housing rental com-ponent in the CPI. The source of this error lay in methodologically faulty imputations, undertaken because the data required had not been collected since the October household survey was discontinued in 1999.
The consequences of these unsound imputations and projections had not been properly identified, largely because of the absence of skilled analytical capacity in the agency.
This high-profile error severely dented the credibility of Stats SA, and heralded a period in which the reliability of the data it collected was questioned from all sides: government, the media, investment analysts, economists.
Although, the facts were true, the source of the problem was the intentional omissions emanating from the termination of the household survey programme in 1999 that supplied this information. The overestimation also arose due to lack of ana-lytical capacity and insight by the office to address matters of this nature.
Pali Lehohla
AFDB-1-69.indd 62 11/1/05 8:17:59 PM

African Development Bank 2005 63
The results of Census 2001, released in July 2003, were received positively, and stakeholders got down to the serious busi-ness of analyzing and applying the data. Nonetheless, Stats SA accepted that it faced serious operational, image and cred-ibility problems which required urgent attention.
Tackling these issues demanded a multi-pronged approach. Organizationally, a programme and projects office to support planning, implementation and monitoring, and to facilitate the implementation of a matrix structure, was introduced. The findings of a review of economic statistics were digested, and management agreed that help in revitalizing this area was required urgently. A team of experts recently retired from the Australian Bureau of Statistics and Statistics Canada was as-sembled to develop a renewal strategy for economics. A second qualified audit for the organization was released in September 2003 and a memorandum drafted by a group of staff alleging incompetence and corruption against the Statistician-General was released in November 2003. With renew-al of the Statistician-General’s contract due for consideration in the same month, organizational leadership appeared seri-ously unstable.
However, there were positive results from this period of uncertainty and instability. By the end of 2004, the economic sta-tistics strategy was yielding far-more accurate data, and this was being seen in the compilation of national accounts. Revi-sions of series based on the new integrated business register were being absorbed, and by the middle of 2005 the quarterly GDP release was reflecting a more coherent picture of economic activity.
5.1 Programme and project planning
Attempts made in 1999/2000 to implement integrated plans and manage information better had yielded few tangible re-sults, and at the beginning of 2003, a new planning and project monitoring system was launched.
The trigger for improvements in the implementation of the system was a set of audit queries directed to responsible man-agers, and used as a management tool to enforce governance. The second trigger was the training of personnel in project management, the third being the integration of inputs, outputs and resource management.
5.2 The CPI debacle
Stats SA’s miscalculation of the CPI generated a storm in April 2003, and media coverage was understandably extensive and hostile. Stats SA prioritized transparency and honesty in communicating the sources of the error, and the steps being undertaken to correct it.
Senior and respected colleagues from abroad, notably Canada’s Jacob Ryten, ABS head Dennis Trewin and Britain’s statis-tical chief Len Cooke gave invaluable advice in guiding the agency through this trying period. The Statistics Council rallied in an objective way on the matter and the Minister of Finance, to whom Stats SA reports, provided necessary perspective on this issue.
Statistics South Africa in Transition: Reflections on a decade of Statistical Practice (1994-2004)
AFDB-1-69.indd 63 11/1/05 8:17:59 PM
African Development Bank 200564
Members of Parliament called for the Statistician-General to be fired. Cartoonists had a field day satirising the agency and its senior staff. As a leader, the situation became the sort of nightmare that ensured one would never sleep again!
With the impact of the CPI error threatening to contaminate response to the results of Census 2001, due for release in July 2003, the S-G’s regular newspaper column, ‘Inside Statistics’, mounted a systematic campaign of information, explanation and admission which, by taking the public into his confidence, did much to repair Stats SA’s dented credibility.
5.3 Allegations of corruption
Already shaken, Stats SA was further disrupted when, in May 2003, a senior manager circulated a dossier alleging incom-petence and corruption on the part of the Statistician-General. In October, a second document made similar allegations.
At the S-G’s request, the Minister asked the Public Service Commission to assess these allegations, and after an extensive enquiry, found that the substance of the allegations was without foundation, and that no evidence could be found to sup-port the most-damaging claim of corruption.
This bruising and disruptive episode brought home a number of lessons. It reminded management of the dangers of making alle-gations against colleagues without having evidence to support these; it showed how disruptive agendas for personal power can be when they are combined with minority resistance to necessary change; and it demonstrated how those with questionable in-tentions and motives can exploit a consultative and participatory management style which flattens organizational hierarchies.
5.4 Errors or managed revisions?
Managing the revision of economic statistics in line with the renewal strategy placed substantial strains on the organiza-tion, and a range of stakeholders – including the media – found it difficult to distinguish between planned revisions, chang-es in methodology, and errors.
The ‘Inside Statistics’ column was used on a number of occasions to tease out the differences. When it was found that my counterpart in the United Kingdom, Len Cooke, was facing similar issues, his views were regularly inserted into various edi-tions of ‘Inside Stats’.
Central to our credibility was acknowledgement that when an error occurs, it is an error, and correcting it is not a planned revision, nor should it be presented as such. Equally central to our learning at the time was the realization that the media sells newspapers (or viewing or listening time), and we produce statistics, and that there is rarely commonality of interests between those two activities!
5.5 Focusing on quality and data governance
By introducing a unit for quality through standards and methods, the key inputs to the production system could be refined so as to improve the quality of products.
Pali Lehohla
AFDB-1-69.indd 64 11/1/05 8:17:59 PM

African Development Bank 2005 65
Closely linked to these elements of quality improvement is the issue of data governance and management. In 2003 Jan-uary the organization allocated resources to investigate the concept of data warehousing, which soon developed into a more-ambitious programme to re-engineer the way in which Stats SA processes, transforms, analyses, stores and dissemi-nates the data it collects.
The Data Management and Information Delivery (DMID) project holds out the possibility of a system that will minimize, if not eliminate, the sorts of statistical errors which have haunted the agency.
5.6 Getting the implementation strategy right
In an assessment note on Stats SA, Jacob Ryten (2004) had this to say:
“Statistics South Africa (SSA) is a special case among statistical offices in any part of the world. It is an office in transition; it is an office that has advanced standards; it is an office with a great deal of technical know-how; and it is also an office that has a comparatively short history as the break away from Apartheid marked a major discontinuity in South Africa’s so-cial and economic fabric. If the world managed to stay still for a while and no one within the public sector were allowed to move from their post, it is questionable whether SSA would need help from anyone. Unlike many other offices in Africa, Asia and Latin America, after a while SSA would emerge as an office with capabilities of developed countries (it has the standards)”.
The organization runs seminars every Friday where staff present their projects, methods applied, progress and findings. This has proved highly successful and quite different from the acrimonious sessions held on economic statistics in 2001. Staff at all levels are more open to criticism and are prepared to learn from others. This is a pleasing sign of a maturing and de-veloping institution.
However, Ryten’s wish notwithstanding, the world does not stand still, and people do move on, not least because of re-tirement. When they leave, they withdraw more than physical presence. They often take away with them human capital for which there is no short-term replacement.
Towards the end of 2004, Stats SA started a recruitment process that seeks to inject young talent into the organization. The results of this are bound to change the way we conduct business. The pilot programme has yielded 15 recruits, and next year we aim for a further 30 recruits. A thousand applications for this special programme are already on our books. We aim to have brought in twenty percent of Stats SA staff members through this process within five years.
5.7 Overview of the period 2003 to date
The past two years probably represent the most tumultuous that the organization has ever experienced. Resilience of lead-ership and management has been tested to limits not encountered before. In addressing this, the organization implemented a programmatic and project planning approach to its work, enabling initial implementation of a matrix structure.
Statistics South Africa in Transition: Reflections on a decade of Statistical Practice (1994-2004)
AFDB-1-69.indd 65 11/1/05 8:17:59 PM

African Development Bank 200566
The organization has also faced a range of major management challenges, including audit qualifications for three succes-sive years; and a disruptive challenge to the Statistician-General’s authority by a group of staff led by a disaffected se-nior manager, who leveled allegations of embezzlement and corruption. The fact that a Public Service Commission enquiry found that there was no evidential basis for these allegations did little to undo the destructive consequences of these ac-tions over a two-year period.
The error in CPI estimation, and the broader revision of the economic series, have forced far-greater attention to data qual-ity, while the DMID project is nudging the organization towards better data governance and management, more-coherent metadata, and improved facilities for analysis.
There is a growing realization that leadership and management of a statistical agency requires skills and approaches which differ in many respects to those needed in other departments of government. Dennis Trewin (2005), Australian Statistician and head of the Australian Bureau of Statistics, has recently noted that the key priority in leading a national statistical of-fice has become relationship management. This includes
• Relations with Ministers and government;• Relations with policy agencies;• Relations with media, which can have such a significant influence on perceptions of the National Statistical office; and• Increasingly, relations with other producers in the National Statistical System.
6. The road ahead
There is, after a long and difficult gestation period, broad organizational consensus over the ten main activity streams to lift the quality of economic statistics. However, Stats SA needs more than the assistance of the few experts who identified these streams – although this support is still required.
Stats SA will also require steady support from a well-known, capable and respected statistical institution. There are three main dimensions to this:
• Proactivity: the ability to detect clouds on the horizon and advise on measures to be taken to avoid accidents, losses of credibility, doubts about competence and so on. Only an outside look can help focus attention on weaknesses, fragile methods and systems, lax supervision, and poor quality of output.
• Replacement: Stats SA’s young professionals have a desperate need to acquire training and managerial experience and confidence. They do not lack the motivation or the intelligence but they have no free time if they are expected to simul-taneously carry on with their regular duties.
• Seal of approval: young institutions find it hard to increase credibility at the same time as they broaden their scope and improve the quality of their output. This second imperative inevitably leads to mistakes, yet the first demands an error-free environment. A respected and independent institutional process capable of reassuring users about quality, integri-ty and professional competence facilitates management of the tension between broadening of scope while increasing credibility.
Pali Lehohla
AFDB-1-69.indd 66 11/1/05 8:17:59 PM

African Development Bank 2005 67
Statistics South Africa in Transition: Reflections on a decade of Statistical Practice (1994-2004)
6.1 Implementing the economics statistics strategy
To address the morass of problems relating to poor statistics, Stats SA focused specifically on those activity streams, which form the core, though not the sum total, of the economic statistics activity of the organization. The main outcomes required for each of the activity streams were identified, as were the main challenges to be faced. It is now clear which tasks must be completed and which milestones must be met to achieve these outcomes.
• The underlying thrust of the strategy was to capture as closely as possible the true levels of activity in the South African economy, as well as the changes over time.
• The outcome will be more reliable measures of GDP and its components, as well as supporting economic series, some of them new, all of them enhanced, which will be more relevant in their own right.
• The prerequisite for achieving this outcome is a business register which covers consistently over time the businesses which account for a very high proportion of total business activity, recording their full structures as well as producing units, accurately classifying them to industry at both levels of unit, and carrying appropriate, reliable measures of size for sample stratification purposes.
• The key output required is that the annual national accounts accurately describe the real level of activity in the South African economy, and that the quarterly accounts accurately measure the real growth in the economy.
The first major milestone towards achieving this outcome was the release of re-benchmarked national accounts time series in November 2004 based on a fully balanced Supply-Use table which reconciled the three approaches to measuring GDP. The re-benchmarking process, between January and October 2004, drew on all of the major economic statistics series pro-duced by Stats SA. Most of these series had deficiencies, some of which were ameliorated in the short term to allow the re-benchmarking to proceed, and all of which will have to be enhanced progressively to satisfy the requirements of all major users regarding scope, coverage and reliability.
6.2 Continuing to develop human capacity
In 2003, Finance Minister Trevor Manuel described the training challenge as follows:
“There are too few South Africans who love statistics or have a passion for it … This too is embedded in South Africa’s apartheid history. On 17 September 1953, the Minister of Native Affairs, HF Verwoerd, said in Parliament ‘What is the use of teaching the Bantu child mathematics when it cannot use it in practice?’ Thus Bantu Education was introduced in 1954, consciously de-emphasizing the teaching of Mathematics and Science. A generation of maths students was destroyed and thereafter, successive generations of maths teachers. To this day, the teaching of maths and science … is too frequently mediocre. Ten years into democracy, this residue of apartheid decision lives on. It must be reversed – not merely at univer-sities or in the work place, but at primary and pre-schools”.
There is no outside agency which can develop the important competencies Stats SA requires. Accordingly we have em-barked on developing the skills in-house through the launching of an internship programme designed to obtain high ac-ademic achievers for the organization who are put through a rigorous twelve month induction program. We will develop this programme further to provide training to both existing professional staff within the organization as well as subsequent training to the successful interns. We will continue to increase the intake as our capacity to mentor them improves. We hope
AFDB-1-69.indd 67 11/1/05 8:17:59 PM

African Development Bank 200568
in a relatively short time that we will have both increased capacity to undertake new work and will be much more self-re-liant on our resources than in the past.
As our capacity increases we will both widen the scope of our economic and social statistics as well as improving the qual-ity and reliability of our data thereby providing a better service to our policy makers and analysts.
6.3 Implementing the NSS through data governance
While the Statistics Act gives the Statistician-General far-reaching powers for coordination of the production and dissemina-tion of statistics, this has not been fully exercised. Bill McLennan has noted that, the Statistician-General has ‘rather signifi-cant powers of coordinating the statistical work of government agencies’, per sections 7(2) (g) and 14 of the Act. However,
these powers have either not been used or used only sparingly. In a way this is a pity as Statistics South Africa has the stron-gest legislative backing I have seen for producing, or encouraging, a properly coordinated statistical service across gover-nement.
As part of this process we intend to place a much greater emphasis on standards for statistical units, classifications, data items, tabulations and publications to produce greater coherence in our statistical output. Through this, we intend interact-ing to a greater extent than before with other producers of South African statistics, attempting to develop and adopt com-mon standards, and thereby providing a richer picture of what is happening in our society.
7. Conclusion
The years since 1994 have seen a great deal of change in the role, functions and significance of the statistical organization. It has developed the statistical infrastructure required to collect information from a large heterogeneous population, which speaks eleven official languages. Statistics South Africa has undergone extremely rapid and far-reaching change with nota-ble successes. This process has been neither smooth nor error-free. Quality of the statistical output is uneven, and errors in high-profile series have undermined credibility and trust. Inadequate capacity, skills and experience internally led to over-reliance on outside experts. The organization however, has not been deterred from seeking and finding solutions. In a follow-up report to its first ‘staircase’ mission, SIDA (2002) noted that Stats SA had made considerable progress. Out-put had become more regular and quality had improved. However, while new processes, methods and tools had been in-troduced, the desired results were not yet apparent. Over these ten years of statistical practice we have progressively addressed the new demands made on official statistics. These were well-expressed by the Finance Minister in 2003 when he said
“I like good news. I like to tell good stories about how well we are doing as a country. But please don’t give me what I like, give me what I need, because part of what I need to do is to help deliver democracy to people who have waited for it to touch their lives. Government needs good statistics”.
Pali Lehohla
AFDB-1-69.indd 68 11/1/05 8:18:00 PM

African Development Bank 2005 69
In its attempts to deliver on this mandate, the organization has prioritized human capital development, programme and project management and proper coordination of statistical production and use. The follow-up assessment of the SIDA mis-sion was correct: in terms of the staircase model, Stats SA still has a number of steps to climb: however, the organization Stats SA now hold out the promise of a statistical agency well-equipped to play its role in national development, and par-ticipate as an equal in the world of international statistical practice.
References
Arrow, J. (2001), Reviewing Economic Statistics: An Acid Test of Some Key Surveys, report prepared for the Statistician-General Government Communication and in-
formation Service – GCIS (2004), Towards the Ten-year Review’, report prepared to assess government performance in the first decade of freedom, Pretoria,
Khalfani, A.K, T. Zuberi, S. Bah, and P.J. Lehohla, ‘Population Statistics’, in (eds) T Zuberi, A Sibanda and E Udjo, The Demography of South Africa, ME Sharp Inc. pp.
19-20.
Manuel, T, (2003), Address to the Fiftieth Anniversary Conference of the South African Statistics Association, Ekhureleni,
McLennan, B. (2004), Provide Advice on the Governance and Accountability of Official Statistics in South Africa, report prepared for the Statistician-General
., .... (1998), S P Prepared for the Forty-sixth Plenary S
Reibnitz F von and J Ryten (2004), An Economic Statistics Strategy for Statistics South Africa, report prepared for the Statistician-General
Ryten, J. (2004), An Assessment Note to the Statistician-General for Engaging and Mobilizing Resources
SIDA (1998), Swedish Mission to Central Statistical Services, ‘Staircase Report’, unpublished
SIDA (2002), The Institutional Development of Statistics South Africa: a Follow-up Study Using the Staircase Model.
Statistics South Africa (2003), Strategic Plan 2003/04-2005/06, quoted from the keynote address Minister Manuel delivered at the Indicator Workshop, Somerset
West, Cape Town.
Trewin, D (2005), Summary of 2005 Conference of Commonwealth Statisticians’, quoted in Pali Lehohla, ‘Inside Statistics’, Business Report.
Statistics South Africa in Transition: Reflections on a decade of Statistical Practice (1994-2004)
AFDB-1-69.indd 69 11/1/05 8:18:00 PM

African Development Bank 200570
1: Statistical Consultant and Chairman, Board of Directors of Uganda Bureau of Statistic and the Second Winner of the P.C. Mahalanobis International Award in Statistics. Address: P.O. Box
23045, Kampala, Uganda. e-mail address: [email protected].
The views expressed in this paper are personal to the author and do not necessarily represent the views of the Uganda Bureau of Statistics or various agencies the author is associated with.
Summary
Many poor developing countries are trapped in a vicious cycle of statistical under-development broadly characterized by weak production of statistics matched with little use of statistics by national policy-makers. Specific characteristics of the National Statistical Systems in these countries are presented. It is argued that this vicious cycle has constrained policy analysis and design as well as achievement of development outcomes. A case is made for scaling up statistical advocacy (which is elaborated) to break this cycle and to provide good statistics which are increasingly recognized as a core com-ponent of good governance and as part of the enabling environment for national development.
A number of actions are proposed to enhance statistical advocacy including integrating statistics in national development policy; raising the profile of statistics; establishment of more effective leadership of the National Statistical System and Of-fice; mainstreaming users in statistical processes; use of newsmakers and cultivation of high level policy and decision-mak-ers as champions for statistical processes; establishing effective news media relations; improving data analysis, presentation and reporting; scaling up Africa Statistics Day celebrations; appropriately designing the National Strategy for the Develop-ment of Statistics (NSDS); making statistical training more relevant; and continued and enhanced engagement of the inter-national community in statistical development in the countries. It is also shown that tremendous opportunities now exist for advocating for statistics including the new culture of evidence-based policy-making and the results agenda; the interna-tional environment that is more receptive and supportive of statistical capacity development efforts; availability of a wide knowledge base with appropriate advocacy tools, materials and best practices; and advances in information technology.
Key words:
Statistical under-development, National Statistical System, National Statistical Office, results agenda, statistical awareness/numeracy, National Strategy for the Development of Statistics
1. Introduction
Poor developing countries, many of them in Africa, are trapped in a vicious cycle of statistical under-development. Little or lack of appreciation at political and policy level of the role and importance of statistics as a strategic resource for planning, decision-making, good governance, accountability and management, has led to low priority being attached to statistical
A Case and Some Actions for Improving Statistical Advocacy in Poor Developing Countries
Ben Kiregyera1
AFDB-70-139.indd 70 11/1/05 8:19:00 PM

African Development Bank 2005 71
production, domestic under-funding of statistical production, which in turn has led to limited organizational and institution-al development leading to limited quantity and quality of statistical data and services which in turn, has led to lower de-mand for data and further under-funding of statistical production. This is depicted in the following figure.
It is paradoxical that these countries which are in most need for data are the same ones with the weakest National Statis-tical Systems (NSSs). The NSSs in these countries can be characterized by a combination of the following: • weak relationships or disconnect between producers and users of statistics,• donor rather than country-driven systems sometimes with conflicting donor interests,• inadequate linkage between data systems and national policy work,• an imbalance between data supply and demand, with demand for good data by far outstripping supply,• inadequate coordination of statistical capacity building and data collection efforts, both nationally (e.g. between the
NSO and Statistical Units in sector ministries) and internationally, • ad hoc and piecemeal statistical development, intended to meet short-term data needs rather than for long-term sta-
tistical capacity building,• low status of the National Statistical Office (NSO),• demoralized and despondent statistical staff with high staff turnover in many institutions,• oversupply of data at some levels and unmet needs for data at others,• serious gaps in statistical systems and data series (data gaps on indicators of gender, environment, poverty, food secu-
rity at household level, etc),
Limited:
• Organizational development
• Institutional development
Under-performance
(limited outputs & services in
quality and quantity)
• Domestic under-resourcing
• Conflicting donor interests
• Lower demand
• Fewer resources
Limited appreciation at
political & policy level
Figure: The vicious cycle of statistical under-development depicted
A Case and Some Actions for Improving Statistical Advocacy in Poor Developing Countries
AFDB-70-139.indd 71 11/1/05 8:19:01 PM
African Development Bank 200572
• poor quality data (usually inaccurate and conflicting) which are often insufficiently processed and analyzed, insufficient-ly disaggregated (e.g. by sex, age and geographical divisions) and not easily accessible, and
• insufficiently analyzed data to illuminate policy issues and less than satisfactory data dissemination.
The NSSs in these countries are also characterized by the paradox that on the one hand, there are data gaps and on the other hand, existing data are not being effectively used. This paradox is best illustrated by a senior official in the Govern-ment of Mali, West Africa, who was quoted lamenting thus: “on the one hand, we somehow or other, with limited resourc-es, produce statistical data which are scarcely usable and on the other hand we suffer badly from lack of relevant data to satisfy the basic requirements of most users” (Cisse, 1990).
Some of the reasons for failure to effectively use existing data include the following, among others:
(a) a number of NSSs are supply rather than demand driven. As a result, a lot of data which are not demanded are routine-ly collected and data which are demanded are not always collected.
(b) A number of NSSs lack the capacity to adequately identify, synthesize and prioritize user needs including the merging ones.
(c) Some potential users lack information about available data sets.(d) Often, data are scattered in different forms in different institutions that produce them thereby making it inconvenient
or difficult to access them. (e) In some cases, data are not made available to users in a timely manner or in a usable form (e.g. disaggregated to sub-
national levels when required at these levels) or users feel that available data are not sufficiently accurate. (f) There are cases where would-be data users are not empowered and lack knowledge of how to effectively use data in
their operations.
The consequences of the aforementioned include: poor issue identification, policy analysis and design; uninformed and oc-casionally costly decision-making; inability to properly monitor implementation of policies, projects and programmes as well as inability to evaluate their success. The results agenda includes the Poverty Reduction Strategies (PRSs) that countries are designing and implementing, Millennium Development Goals (MDGs) which countries have signed up to and other nation-al development plans. This agenda is “data intensive” and involves focusing on performance and reporting on the achieve-ment of outputs, outcomes and impact, using information to improve decision-making and steer country-led development processes towards clearly defined development goals. The results agenda has not only created unprecedented demand for “good statistics” and exposed the above vicious cycle but it has also ushered in unprecedented opportunities for statistical development in the countries. This paper argues for sustained statistical advocacy targeted at governments, senior civil ser-vants (policy and decision-makers) and politicians including parliamentarians to speed up the process of breaking the said vicious cycle. These groups of people who initiate development programmes and allocate resources should be convinced to create greater political will to develop statistics (take necessary decisions to reform and restructure the NSS, revise the legal framework, create coordination arrangements and invest in statistics) and to use statistics for evidence-based policy and decision-making. In his citation during the P.C Mahalanobis International Award ceremony in Sydney, Australia in 2005, the Indian Minister for Statistics and Programme Implementation aptly called the latter establishing the “authority of facts” in a world where, at times, attempts are made to establish “the fact of authority” (Fernandes, 2005). The paper outlines what is involved in statistical advocacy and proposes a number of actions to enhance this advocacy in African countries.
Ben Kiregyera
AFDB-70-139.indd 72 11/1/05 8:19:01 PM

African Development Bank 2005 73
2. What is involved in statistical advocacy?
Statistical advocacy is about proactively creating statistical awareness, demand for or use statistics and promoting invest-ment in statistical production. It entails the following, among others:
• creating greater statistical awareness or numeracy in society. This means “having a feel for numbers, an appreciation of appropriate levels of accuracy, the making of sensible estimates, a common sense approach to the use of data in sup-porting an argument, the awareness of the variety of interpretations of figures, and a judicious understanding of widely used concepts such as means and percentages. All these are part of everyday living” (Cockcroft, 1982),
• creating a knowledge-based information society as part of the African Information Society Initiative that “envisages an information society in Africa where: “every man, woman, student, village and government office and business will be able to access information through computers and telecommunications; information and decision support systems will be used to support decision-making in all major sectors of the nation’s economy; access will be made available through-out the region to international, regional and national “information highway”; a vibrant information sector will exhib-it strong leadership in growing information-based economies; African information resources will be globally accessible and will provide content on a range of topics including tourism, trade, education, culture, energy, health, transport, and natural resources management; and information and knowledge will empower all sectors of society” (Executive Secre-tary of ECA, 1996),
• making the general case for statistics as a necessary part of the enabling environment for improving development out-comes i.e. that statistics are needed to inform the process of government (e.g. supporting decentralization, account-ability and good governance), facilitate better policy and decision-making and hence more effective use of resources for development and poverty reduction,
• demonstrating the use of statistical data for decision-making at sectoral level by presenting examples of how policy-mak-ers can use available data from a range of sources to improve both policy and day-to-day management,
• emphasizing the role of statistics in supporting private sector investment and in promoting the development of effec-tive and efficient markets,
• making a case for specific statistical activities e.g. the Population and Housing Census, drawing attention to the range of uses census data could be put to and highlighting the costs and benefits of the census compared to other informa-tion sources,
• mobilizing and properly using national and international resources for statistics, and• promoting coordinated investment in developing statistical capacity.
The nature and complexity of statistical advocacy demands that it should be carried out in an inter-disciplinary manner and in partnership, involving statisticians, policy-makers and development partners.
3. Some actions to enhance statistical advocacy
The aforementioned underscore the need for and a commitment to a huge, dynamic and sustained statistical advocacy agenda to break the aforementioned vicious cycle and to take full advantage of opportunities which have come on the lap of the results agenda to improve the supply and use of statistics in the countries. As part of this agenda, the following ac-tions are proposed:
A Case and Some Actions for Improving Statistical Advocacy in Poor Developing Countries
AFDB-70-139.indd 73 11/1/05 8:19:01 PM

African Development Bank 200574
3.1 Actions by government
Integrating statistics in national development policy
While it is increasingly recognized that statistics are essential to the achievement of development outcomes, they remain to be mainstreamed in national development policy. In many countries, there is still a visible imbalance in the use of statistics in the development process. The tendency has been to use statistics in monitoring and evaluation – “down stream” stages of the development process and not at “up-stream” stages. It is important to appreciate that “policy outcomes are crucially affected by the use of statistics and statistical procedures in “upstream” stages of policy making, such as issue recognition, programme design, policy choice and accurate forecasting….” (PARIS21, 2005).
There is, therefore, a strong case for governments to integrate statistics in the national development policy and to promote evidence-based decision-making using sound and transparent statistics. One way of doing this is to regard statistics as a cross-cutting issue, very much like gender and environment, to be mainstreamed as part of national development policy, in-cluding for the design, monitoring and evaluation of PRSPs, other national development plans and assessing progress to-ward the MDGs.
Raising the profile and status of statistics
Government can also advocate for statistics by raising the profile and status of statistics in government and society. This can be done in different ways depending on the political and administrative set up in each country. In broad terms, how-ever, the profile of statistics will be raised if:
(a) statistics are used extensively in policy analysis and design as well as in the national planning cycle;(b) political leadership appreciates and talks more about statistics;(c) the NSO is given special departmental status in government with its Head at the level of the highest civil servant in a
Ministry (Permanent Secretary in some countries); (b) the NSO leadership is appointed to key government committees e.g. Presidential Economic Council;(c) the NSO is made a semi-autonomous government agency with its own governing Board, very much like the Central
Bank, and with a budget approved separately by the National Parliament, as has been done in countries like Uganda;(d) statistics is believed to be so important as to be included in the school curriculum.
Providing more effective leadership
It is well recognized that the success or failure of organizations largely depends on the quality of their leaders. Leadership has, therefore, become one of the most significant items on the agenda of organizations in modern age. Effective leader-ship is required to meet organizational challenges and deliver results. These challenges include globalization, fast-paced technological change, rising expectations of citizens and customers, increasing diversity in societies, need for performance-focused organizations and the need for managing networked organizations.Effective leadership of the NSS can enhance statistical advocacy. This leadership should be provided at two levels. At the
Ben Kiregyera
AFDB-70-139.indd 74 11/1/05 8:19:01 PM

African Development Bank 2005 75
level of the NSS, leadership should be provided by a well resourced, cultured and structured NSO, able to manage effective relationships with other systemic players and have both the technical expertise and organisational systems and capability to perform these roles. Governments should reform the NSSs, ensuring that the Statistics Acts strengthen the NSO’s coor-dinating and leadership role.
The NSOs also require effective leadership to, among other things:
• develop, support and promote a user-focused and performance culture; • promote a new vision and strategies for and champion changes necessary to make the NSS more responsive to user
needs;• embody the status and the professionalism of the NSO; • set performance goals, standards and paradigms; • passionately articulate the indispensability of statistics to society; • identify opportunities engendered by the results agenda and capitalize on them;• generally work towards raising the profile of statistics in the country.
It behooves national governments to provide effective leadership of the NSOs. This could be done by instituting more mer-itocratic and competitive selection processes for Heads of and other leaders in NSOs in contradistinction with automatic promotions and succession currently practiced in many countries.
3.2 Actions by data producers
Developing effective leadership
The point was made earlier that governments need to provide NSOs with effective leadership. It is important to point out that leadership can be cultivated, developed and nurtured through continuing processes of self-study, education, training, experience and emulation of good leaders. Therefore, capacity building programmes should include training in leadership and management for all personnel in leadership and management positions.
Mainstreaming users in national statistical processes
In many countries, users are not yet mainstreamed in national statistical processes. In these countries, it is common for data users to play fringe and “down-stream” roles – invited to one-off workshops sometimes to discuss already drafted ques-tionnaires or to discuss reports from some data collection activities (censuses or surveys), to receive and use data, etc. It should be mentioned that it is not best practice to use user-producer workshops to determine user needs as is being done in many countries. Identification of user needs is best done through a process of ongoing dialogue between data users and producers.
There is a need to reposition data users i.e. bring them from the margins of the data production processes to the centre so that they can take ownership of data processes and play more proactive and “up-stream” roles in the development of na-tional statistics. This will enhance the relevance of national statistics and make it easier for data systems to more adequately
A Case and Some Actions for Improving Statistical Advocacy in Poor Developing Countries
AFDB-70-139.indd 75 11/1/05 8:19:01 PM

African Development Bank 200576
assess user needs, generate more demand for data, attract more funding for data production and respond more adequate-ly to user needs. In particular, policy and decision-makers should be kept in the loop and engaged to make data policy-rel-evant and their production sufficiently funded. Thus we should have a situation where statisticians are talking more about development policy and policy-makers talking more about statistics.
In some countries, data user-producer committees have been formed as recommended by the Addis Ababa Plan of Action for the Development of Statistics in Africa in the 1990s to provide a forum for dialogue between the two groups of stake-holders. Such dialogue is necessary to “advance a common understanding of policy issues and related data requirements, set data priorities, clarify the objectives for data collection and agree on the best methods for data collection” (UN, 1992). It will also assist in the development of new products and promote use of statistical information by government and non-gov-ernment. It has been observed, however, that while user-producer committees formed in relation to specific issues e.g. Ear-ly Warning Systems, Population and Housing Censuses and Trade Statistics appear to have functioned well, attempts to es-tablish more general statistical committees have been largely unsuccessful. This has been attributed to failure by some data users to see the relevance of some topics handled by the Committees to their work, the practice of some users sending to meetings low-ranking officials who may not always be aware of the data needs of their institutions, failure by the NSOs to prepare interesting agendas, etc. It is, therefore, important that due care is exercised in forming the committees and working out their business. In addition to the user-producer committees, regular national stakeholders’ workshops should be held.
Use of newsmakers and cultivation of champions
Use of news makers can be an effective mechanism for advocating for statistics. News makers include top government of-ficials e.g. government Ministers and Permanent Secretaries. When these officials are invited to launch a statistics report or open a stakeholders’ workshop, the event is extensively reported in the media. For instance, when the President of Uganda launched the 2002 Main Population and Housing Census Report at a colourful ceremony, not only was the event headline news on national radio and television that evening and for the next few days, but also the census results were reported in newspapers every day for two weeks running. On the other hand when a head of an NSO performs such a function, it be-comes a “non-event” to the extent that it receives little publicity, if at all. Unfortunately, news makers are not being used as much as they could. It is, therefore, very important that as much as possible, newsmakers is used and that the right mes-sages are embedded in their speeches.
Experience in a number of countries has also shown that better results are achieved if statistics are championed by a high-level policy or decision-maker. It is, therefore, important to cultivate such champions for the statistical processes at high lev-els of government in the countries so that the case for statistics is made not only by statisticians but also by policy and de-cision-makers. There is also a need to cultivate champions of statistical processes among donors who will also act as focal points anchoring inter-donor coordination (PARIS21, 2004).
Establishing effective news media relations
Increasingly, NSOs are recognizing the important role the news media can play in the development of national statistics. This role has been well articulated by John Wright, former Head of Media Relations for the UK Central Statistical Office and senior media advisor to Eurostat, as follows: “Official statistics record matters of great significance to the nation and to in-
Ben Kiregyera
AFDB-70-139.indd 76 11/1/05 8:19:01 PM

African Development Bank 2005 77
dividuals. They are one way ordinary citizens can judge the state of their nation and how well (or badly) the government is running things, because statistics are objective. Politicians are wary of statistics, which is a good thing. This is why they often seek to suppress or manipulate them. Politicians’ unease about official statistics underlines their importance for the public good, but the public often finds them boring or difficult to understand. The media tend to reflect their attitude. Newspapers don’t sell by boring people. This can make it easier for politicians to avoid publicity for difficult statistics”.
The above stated role underscores the need for NSOs to establish effective relations with news media. News media can be a great partner in statistical advocacy as well as wider dissemination of statistical products. Relations with the media can be enhanced in a variety of ways including NSOs holding periodic workshops for media practitioners as has been done pe-riodically in Nigeria and Uganda to great effect, NSOs employing former journalists to conduct their media relations, mak-ing the NSOs and their staff accessible and approachable to journalists and NSOs issuing appropriate news releases and holding periodic press conferences. The media can teach NSOs how to prepare appropriate news releases. Also crucial to news media relations is the advance publication of release dates and timing of releases and who answers questions – there should be prompt response and ease of contact with NSOs (PARIS21 web site).
Improved data analysis, presentation and reporting
Perhaps the best way to advocate for statistics is to produce the statistics users need when they need them, how they need them and can be understood and used by them. It has been observed that non-effective use of statistics in a number of poor developing countries has partly been attributed to poor data analysis, presentation and reporting. Generally, data are col-lected, analyzed and reported in a routine manner, with broad analysis and no differentiation among users. Typically, NSOs and other data producers do basic data analysis which involves (a) checking the quality of the data, (b) modifying the data (e.g. transforming one or more of the variables) or adding sample weights to the data, and (c) obtaining simple descriptive summaries using summary statistics (e.g. totals), plotting graphs and constructing tables. The results of such analysis are usually presented in statistical reports. Quite often, these reports are too big on account of too many tables being attached to them as annexes, tell the reader “what is” and usually not “why”. Also, results are often insufficiently disaggregated by important domains such as geographical breakdown. This, of course, makes effective targeting interventions and resources difficult. One other problem with analyses undertaken by data producers is that often, results are not compared with na-tional development targets such as those in the PRSPs or sectoral development plans and programmes. This “water is wet” kind of analysis often leaves readers asking “so what” after reading the reports. It is important to stress the need for statis-tics to go beyond figures and tell a story; data should be turned into information, insight, knowledge and actions.
Basic data analysis and survey reports are good but not enough. More detailed data analysis and especially policy-relat-ed analysis is required to establish relationships among various variables and to illuminate policy issues. Whether this type of analysis should be done by the NSO or some other institution has been a subject of great debate. Perhaps this debate has been misplaced. What is important, we would like to argue, is that detailed and policy-relevant data analysis should be undertaken by those people with intense subject-matter knowledge e.g. on gender, poverty, environment, agronomy, crop husbandry, trade, etc. as well as good knowledge of policy issues and direction. If the NSO does not have staff with such knowledge as is often the case, it should seek the collaboration of researchers, policy analysts and institutions endowed with capacity for this kind of analysis such as Economic Policy Research Centres (in many countries such centres are sup-ported by the African Capacity Building Foundation – ACBF), Poverty and Gender Analysis Units in government ministries and at Universities. This kind of collaboration has a number of advantages including:
A Case and Some Actions for Improving Statistical Advocacy in Poor Developing Countries
AFDB-70-139.indd 77 11/1/05 8:19:02 PM

African Development Bank 200578
• value addition to data by bringing subject-matter knowledge to bear on the analysis thereby increasing chances of making right interpretation of the data,
• raising demand for data and spreading ownership of the process and the resulting analytical products among different stakeholders,
• Improvements in data quality. The process of scrutinizing data during detailed analysis can provide very useful insights into data quality. Usually such scrutiny identifies weaknesses in the data (as the saying goes, the devil lies in the detail) and when these weaknesses are fed back to data producers and acted upon, there can be improvements in future data collections. For instance, the analysts may advise changes in questionnaire design and/or data collection methods.
Data analysis can also be improved by producing more innovative products e.g. poverty maps which show, among other things, (a) the distribution of poverty across sub-regional administrative units e.g. districts and help to capture heteroge-neity within them, (b) identify geographical factors affecting poverty, (c) improve targeting of resources and interventions; for instance, the Kenya government is now using poverty maps to allocate poverty funds to constituencies, and (d) improve communication about poverty conditions. It is believed that poverty profiles are incomplete without poverty maps.
In addition to improving data analysis, there is a need to improve data presentation and reporting in a way that helps deci-sion-making. In particular, there is a need to use pictorial presentations and production of specialized and thematic reports e.g. on poverty, gender, environment, etc. targeted at policy makers, pressure groups, leaders of public opinions, etc. Given the problem of producing reports in untimely manner, there is a need for the statistical community to begin to appreciate that statistical products do also expire.
Africa Statistics Day celebrations
In 1992, the 16th Meeting of African Ministers responsible for Economic Planning and Development adopted the Addis Aba-ba Plan of Action for Statistical Development in Africa in the 1990s. The Plan whose purpose was to reverse the decline in statistical production witnessed in the 1970s and 1980s, set aside the 18th November each year to be celebrated as Afri-ca Statistics Day in order to “increase public awareness about the important role which statistics play in all aspects of so-cial and economic life” (UNECA, 1991). By and large, celebration of this day in many countries has been intermittent and wholly unsatisfactory. There is, therefore, a need to take the Africa Statistics Day more seriously and to scale up celebrations of this day in the countries.
Experience in some African countries which have consistently celebrated the day shows that a lot can be achieved by a well structured and comprehensive celebration programme. In Uganda, a decision was taken in 2000 to celebrate for a week ending on 18th November rather than for a day. The celebration programme each year usually includes feature articles in daily newspapers, radio discussions and television talk shows, a media workshop, stakeholder workshops covering various subjects, procession through the streets of Kampala, demonstration of GIS database and products, screening the OECD-PARIS21 Film: Measuring Change in World Poverty on national television and hosting a top government official (President, Vice President or prime Minister) as Guest of Honour on 18th November. The programme for the 2003 Uganda Africa Statis-tics Week Celebrations is presented in the Annex for illustration purposes.
Ben Kiregyera
AFDB-70-139.indd 78 11/1/05 8:19:02 PM

African Development Bank 2005 79
National Strategy for the Development of Statistics (NSDS)
It is now well recognized that strategic approaches including appropriately designed National Strategy for the Development of Statistics (NSDS) can break the vicious cycle of weak production of statistics matched with little use of statistics by na-tional policy and decision-makers. The International Roundtable on Managing for Development Results held in Marrakech, Morocco, in February 2004, agreed on a target for all low income countries to have a NSDS by 2006 and to have started implementing it by the following year, with a view towards having better data to monitor progress towards national and international development goals by 2010. PARIS21 (Partnerships in statistics for development in the 21st Century), African Development Bank (AfDB) and the United Nations Economic Commission for Africa (UNECA) are working together with sub-regional organizations, training centres and countries themselves to achieve this goal.
The design of the NSDS uses a participatory, inclusive and consensus-building approach to produce country-specific strate-gies that are both country and stakeholder-owned. The process which is highly consultative and empowering, broadens and deepens both intra-institutional and inter-institutional communication, and is a golden opportunity for across-the-board statistical advocacy. PARIS21 has produced NSDS documentation and materials that will advance the statistical advocacy agenda. These include (PARIS21, 2004): • NSDS essentials which summarize the more detailed materials, drawing out the main messages to inform the NSDS
design process and serve as an agreed set of criteria against which the quality of NSDS and their processes can be judged;
• Making the case for an NSDS (advocacy document) which sets out to encourage broader recognition by national and international policy makers and funders of the role of statistics in development and poverty reduction and of the neces-sity of strategic planning;
• Guide to designing an NSDS (for managers of statistical offices) which covers a broad range of issues to explain the ra-tionale behind the NSDS and sets out the principles of strategic planning, assessment, consultations, costing, funding and implementation;
• NSDS knowledge base as a virtual library with general background documents especially those held by PARIS21 part-ners, notes to support the design process with case study materials, strategy implementation and national strategy doc-uments.
3.3 Actions by training institutions
Training institutions have a special role in taking forward the statistical advocacy agenda. The 2000 evaluation of the im-plementation of the Addis Ababa Plan of Action showed that training institutions, mainly Regional Statistical Training Cen-tres and Departments of Statistics at national Universities, have contributed immensely to human resources development by producing statistical personnel to manage the NSSs. However, the demand for statisticians in African countries still out-strips the supply (UNECA, 2000).
The evaluation also showed that current programmes especially in Departments of Statistics at national Universities have tended to be theoretical. Little official statistics (if any) is taught in these Departments, and yet the greater demand is for graduates with training in official statistics. The main regional statistical training centres in Africa include: Ecole Nationale Supérieure de Statistiques et d’Economie Appliquée (Abidjan, Côte d’Ivoire), ISSEA (Yaounde, Cameroon), Department of
A Case and Some Actions for Improving Statistical Advocacy in Poor Developing Countries
AFDB-70-139.indd 79 11/1/05 8:19:02 PM

African Development Bank 200580
Statistics at the University of Ibadan (Nigeria), Institute of Statistics and Applied Economics at Makerere University (Ugan-da), Eastern Africa Statistical Training Centre (Tanzania) and the Institut de Formation Démographique (Yaounde, Camer-oon). While these centres largely teach official statistics, this is done from the supply side. However, without familiarity with demand for statistics, the supply solutions may not be adequate or appropriate. It is, therefore, important that supply solu-tions should be informed by the use to which the data supplied will be put.
It is, therefore, high time the curricular of these centres were revised to cover the demand aspects including national and international development agenda such as Poverty Reduction Strategy and the Millennium Development Goals as well as the implications for monitoring progress towards achievement of the goals and targets set in these agenda. Training cen-tres should begin to turn out more and more statisticians who appreciate better and talk more about development issues. The revision should also take care of the need for more training in data analysis, interpretation and reporting; communica-tion and other soft skills such as report writing; etc. Statistical advocacy should be part of the new curricular in these cen-tres and the already available advocacy materials should be customized for use in the African region.
3.4 Actions by the international community
In recent years, the international community has increasingly focused on managing for development results and on evidence-based policy-making as a way of improving human development. The results agenda is data intensive and availability and use of better statistics have been identified by the international community as a priority of the results agenda. The interna-tional community is already playing a critical role in the development of statistics in Africa including statistical advocacy. This role can best be illustrated by the efforts of PARIS21 in catalyzing statistical development in developing countries. PARIS21 is a consortium comprising policy makers, analysts and statisticians from donor and developing countries, international orga-nizations, professional bodies and academic institutions. These members have practical experience and wish to collaborate to improve policy making through good statistics. Established in November 1999 in response to the UN Economic and Social Council resolution on the goals of the UN Conference on Development, PARIS21 was set up to act as a catalyst for promot-ing a culture of evidence-based policy-making and monitoring in all countries and especially in developing countries.
PARIS21 has been able to lead and catalyze the global statistical advocacy agenda. Realizing constraints imposed by lack of statistical advocacy materials, PARIS21 has specially developed resource materials, targeting different audiences including planners and decision-makers, other users such as civil society organizations, the private sector, politicians, the media, do-nor agencies and international organizations. The resource materials have been developed as “global public goods” which countries can appropriate and adapt/tailor to their needs to: (a) show how greater availability and use of good statistics can improve development outcomes, (b) make a case for increased investment in statistics and statistical capacity building, and (c) make a case for greater use of statistics in policy-making. These materials include:
• A pamphlet: Why governments need good statistics: • A poster on: Why statistics are crucial: • Advocacy film: making the case for the importance of the use of statistics in policy-making• Video clips: with senior politicians, policy-makers and statisticians speaking about the importance of using statistical
information in policy-making processes. Many clips also appear in the advocacy film.• Measuring up to the measurement problem: The role of statistics in evidence-based policy-making which shows that
better use of better statistics leads to better policy and better development outcomes.
Ben Kiregyera
AFDB-70-139.indd 80 11/1/05 8:19:02 PM

African Development Bank 2005 81
• Website: with a wealth of information on statistical development and use of statistics with links to reference materials and good practices from national statistical agencies, international organizations and research organizations. The web site is also a forum for exchange of views by statisticians and others, to share information and to identify additional re-quests for help and information.
These resource materials can be used in many ways including production of briefs, articles and pamphlets, posters, radio and television information – all adapted to national needs. They can also be used to improve the style of press releases and other methods of dissemination, in training staff to provide them with effective arguments to explain the nature of a good statistical system and why it is necessary, in preparation of annual dissemination plan to check all the different fields of ac-tion and the improvements required, and to benchmark a particular statistical organization against good practices else-where (PARIS21 web site).
Donors should live up to the Paris Declaration on donor coordination by making sure that they use countries’ own institu-tions and systems to monitor development outcomes. They will, however, need to be convinced that countries have the ca-pacity to monitor and to interpret reliably the results. Where the institutions and systems are weak, the declaration calls for their strengthening rather than undermining them by setting up new systems or using data that are not generated by countries.
4. Opportunities for statistical advocacy
There are now more opportunities for statistical advocacy than ever before. It is important that these opportunities are tak-en full advantage of by NSOs. These opportunities include, among others:
• The new culture of evidence-based policy-making and the results agenda at different levels – national, regional and in-ternational level. Evidence-based policy-making and the results agenda have created unprecedented demand for data and provided an important opportunity not only to raise the political profile and status of statistics but also to identify the data needed and to highlight areas where investment and improvement are needed. It has also opened opportuni-ties for mobilizing additional resources for capacity building.
• The international environment that is more receptive and supportive of statistical capacity development efforts. Indeed in the last few years, there has been an increase in international cooperation and partnerships for statistical develop-ment to respond to the unprecedented demand for statistics and development indicators in developing countries. The need for such international cooperation was emphasized in 2002 by Ms. Clare Short, the then Secretary for Internation-al Development in the United Kingdom. In her speech at the London launch of that year’s Human Development Report (HDR), she said: “One of the striking things about the HDR’s MDG assessment is the lack of data for many countries. Statistical capacity in many developing countries is weak as a result of lack of demand for this type of information and adequate resources, both local and donor. What we need is coherent global action to address this. Multilateral agen-cies and other donors need to work in a coordinated way with developing countries to build the information systems needed to support their own poverty reduction strategies”.
• The existence of a wide knowledge base with appropriate tools, materials and best practices which countries can eas-ily access and use to empower and equip statisticians to better communicate with their clients and the public. Much of this knowledge base can be found on the PARIS21 web site, www.PARIS21.org.
A Case and Some Actions for Improving Statistical Advocacy in Poor Developing Countries
AFDB-70-139.indd 81 11/1/05 8:19:02 PM

African Development Bank 200582
• Advances in information technology (IT) (hardware, application systems, communications networks and skilled staff) which have provided great opportunities for improving the way data are collected, processed, stored and disseminated to users. In particular:
(a) these advances have made IT hardware more powerful, relatively inexpensive and accessible; (b) computer applications have become more user-friendly; (c) the advances have led to the possibility to network to improve internal access to data and metadata; (d) data processing has been speeded up to improve on timeliness; (e) large datasets can be stored, databases can be created; (f) platforms and networks can be created for sharing equipment and information; (g) more imaginative and attractive statistical products can now be produced; and (h) Internet and web-based technologies have made it possible to disseminate and access information from the out-
side world in real time.
It is important that the NSS harnesses these advances in IT to improve the statistical processes and delivery of data and in-formation to the users.
5. Conclusions
In some African countries, failure to appreciate the role and importance of statistics has led to a vicious circle of statistical under-development that has led to poor policy design, uninformed decisions, inability to monitor implementation of poli-cies, projects and programmes as well as inability to evaluate the same. Statisticians and statistical organizations have in the past not done much to advocate for statistics in part because they have not been empowered and equipped to do so and also because there have been no specially designed advocacy materials.
There is a need for a huge, dynamic and sustained statistical advocacy agenda to break the vicious cycle of statistical under-development. This agenda should include disparate actions to be undertaken in concert by government, data producers, train-ing institutions, and the international community. The advocacy agenda should take full advantage of opportunities ushered in by the new culture of evidence-based policy-making and the results agenda, the international environment that is more receptive and supportive of statistical capacity development efforts, and a wide knowledge-base with appropriate tools, ma-terials and best practices
Ben Kiregyera
AFDB-70-139.indd 82 11/1/05 8:19:02 PM

African Development Bank 2005 83
A Case and Some Actions for Improving Statistical Advocacy in Poor Developing Countries
References
Cisse, L. (1990), National Statistical Needs in Mali, Proceedings of a Workshop Held in Luxembourg on Strengthening Statistical Systems in Sub-Sahara Africa,
INTER-STAT, No. 3, 1990.
Cockcroft, W. H. (1982), Mathematics Counts: Report of the Committee of Inquiry into the Teaching of Mathematics in Schools, Her Majesty’s Stationery Office,
London.
Fernandes, O. (2005), Prof. P.C. Mahalanobis International Award in Statistics 2005: Award Presentation Address, Sydney, Australia
IMF (2001), Guide to the General Data Dissemination System (GDDS) Manual, IMF, Statistics Department
Institute of Statistics and Applied Economics et al, (2001), Report of PARIS21 Sub-regional Workshop for East Africa and the Great Horn, Kampala and Paris.
Kiregyera, B. (2001), Novel Statistical Capacity Building Initiatives: Addis Ababa Plan of Action and PARIS21, invited paper presented at the 53rd Session of the Inter-
national Statistical Institute, Seoul, Korea, 22-29 August 2001.
Lucie Lalibertee (2002), Statistical Capacity Building Indicators, IMF
OECD et al, (2004), Action Plan on Managing for Development Results, Second International Roundtable, Marrakech, Morocco
OECD et al, (2005), Paris Declaration on Aid Effectiveness: Ownership, Harmonization, Alignment, Results and Mutual Accountability, Paris, February 2005
PARIS1 Pamphlet: Why Governments Need Good Statistics
PARIS21 (2004), National Strategy for the Development of Statistics (NSDS) Documentation, PARIS21 Secretariat, Paris
PARIS21 (2005), Measuring Up to the Measurement Problem: The Role of Statistics in Evidence-based Policy-making, PARIS21 Secretariat, Paris
Uganda Government (2001), Poverty Eradication Action Plan (2001-2003), Volume I, Ministry of Finance, Planning and Economic Development, Kampala.
United Nations Economic Commission for Africa (1991), Addis Ababa Plan of Action for Statistical Development in Africa in the 1990s, Addis Ababa, Ethiopia.
United Nations Economic Commission for Africa (2000), Economic Report on Africa 1999: The Challenge of Poverty Reduction and Sustainability, Addis Ababa,
Ethiopia
United Nations Economic Commission for Africa (2000), Overall Report of the Evaluation of the Addis Ababa Plan of Action for Statistical Development in Africa in
1990s, Addis Ababa, Ethiopia
United Nations (1983), Use of Household Surveys for Collection of Food and Agricultural Statistics, FAO Economic and Social Development Paper 35/Prov., FAO,
Rome.
AFDB-70-139.indd 83 11/1/05 8:19:02 PM

African Development Bank 200584
United Nations (1986), National Household Survey Capability Programme: Sampling Frames and Sample Designs for Integrated Household Survey Programme,
United Nations, Department of Technical Co-operation for Development and Statistical Office, New York.
United Nations (1992), Household Surveys of Agriculture: A Methodological Study, United Nations Statistical Office, New York
United Nations Economic Commission for Africa (1990), Addis Ababa Plan of Action for Statistical Development in Africa in the 1990s, Addis Ababa, Ethiopia
United Nations Economic Commission for Africa (1993), A Strategy for the Implementation of the Addis Ababa Plan of Action for Statistical Development in Africa in
the 1990s, Addis Ababa, Ethiopia.
United Nations Economic Commission for Africa (1996), A Vision for African Information Society, A speech by the Executive Secretary made at the Conference on the
Information Society and Development Information Society Luncheon Forum in Midrand, South Africa, and 14 May 1996.
World Bank (2002), a Sourcebook for Poverty Reduction Strategies, Volume I: Core Techniques and Cross-Cutting Issues, Washington D.C.
Ben Kiregyera
AFDB-70-139.indd 84 11/1/05 8:19:03 PM

African Development Bank 2005 85
A Case and Some Actions for Improving Statistical Advocacy in Poor Developing Countries
Media workshop, November 13, 2003
Theme Eradicating Poverty through Popular Participation
Venue International Conference Centre
Time 9.30 am – 2.15 pm
9.30 am Opening Session
9.30 – 9.50 am Chair Dr. Alphonse Okidi, Executive Director, EPRC
9.55 – 10.15 am Official Opening Hon. Nsaba Buturo, Minister of State for Information, Presidents Office
Presentations
10.20 – 10.40 am Presenter 1 The Role of the Media in Dissemination of StatisticsMr. Robert Kabushenga, Corporation Secretary, The New Vision
10.45 – 11.10 am B R E A K
Chair Dr. J. Musinguzi – Executive Director, Population Secretariat
11.15 – 11.35 am Presenter 2 Institutional Effectiveness in Monitoring PEAPMr Eric Mukasa, Principal Economist, MFPED
11.40 – 12.00 noon Presenter 3 Information to strengthen Popular Participation, Equity and Social JusticeMr. Richard Ssewakiryanga, UPPAP
12.05 – 1.00 pm Discussion on Key Issues from the Keynote Address and papers
1.00–2.15 pm L U N C H
Invitees Media, Ministry of Internal Affairs, Civil Society, Ministry of Justice and Constitutional Affairs, Uganda Human Rights Commission, UPPAP, Private Sector, Private Sector Foundation, Poverty Monitoring and Analysis Unit, Donors and International organizations, Ministry of Finance Planning and Economic Development, Uganda Bureau of Statistics (relevant directorates)
Annex
2003 Africa statistics week celebrations in uganda“Governance and development: a challenge for statistics”
November 12, 2003
Talk show
News supplement (including data processing centre pictorial)
AFDB-70-139.indd 85 11/1/05 8:19:03 PM

African Development Bank 200586
User-producer workshop, November 14, 2003
Theme Using Quality Statistics for Effective Governance
Venue Kampala International Conference Centre
Time 9.00 am – 4.15 pm
Opening Session
9.00 – 9.15 am Chair Prof. Omaswa, Director General of Medical Services
09.20 – 9.40 am Official Opening Hon. Jim Muhwezi, Minister of Health(MOH)
09.45 – 9.50 am Keynote Address Prof. Ben Kiregyera, Chairman Board of Directors
Presentations
Chair Mrs. Florence Malingha, Commissioner for Planning, MOE
09.50 – 10.10 am Presenter 1 The National Statistical Work Programme 2004Coordination Unit, UBOS
10.15 – 10.30 Discussion
10.30 – 11.00 am B R E A K
11.05 – 11.30 am Presenter 2 Challenges of meeting User Needs: Case of URAMr. Justin Zaake, Deputy Commissioner General, URA
11.35 – 12.00 noon Discussion
12.05 – 12.30 pm Presenter 3 Challenges of producing Sectoral Statistics• Health• Education
12.35 – 12.55 pm Discussion
1.00 – 2.00 pm L U N C H
Chair Mr.J.B. Male-Mukasa, Executive Director, UBOS
2.05 – 2.25 pm Presenter 4 Role of Universities in Statistical DevelopmentProf. James Ntozi
2.30 – 2.50 pm Presenter 5 Capacity Building for supporting the National Statistical SystemProf Munene, Consultant
2.55 – 3.15 pm Presenter 6 Information Challenges for Investment in Uganda.Dr. Margaret Kigozi, Executive Director Uganda Investment Authority
3.20 – 3.50 pm Discussion
3.55 – 4.15 pm T E A
Invitees Main data users and producers from government Ministries and institutions, Public sector, Private sector, Academia, Media, NGO sector, Donors and International organizations, URA, Parliament, Uganda Police, Universities, UBOS Directors and Senior Officers
Ben Kiregyera
AFDB-70-139.indd 86 11/1/05 8:19:03 PM

African Development Bank 2005 87
Institutional effectiveness workshop, November 17, 2003
Theme Measuring Governance and Institutional Effectiveness
Venue Kampala International Conference Centre
Time 9.00 am – 4.00 pm
Opening Session
9.00 – 9.05 am Chair Mr. Jotham Tumwesigye, Inspector General of Government
9.10 – 9.30 am Official Opening Hon. Tim Lwanga, Minister of State for Integrity
Presentations
9.35 – 9.40 am Chair Hon. Miria Matembe, Women Member of Parliament, Mbarara
9.40 – 10.00 am Presenter 1 Appreciating leading Statistical indicators in Uganda, ED/DED UBOS
10.00 – 10.20 am Presenter 2 Information for Corporate Governance by Mr. Nimrod Waniala, Executive Director, PSF
10.20 – 10.40 am Presenter 3 Monitoring Fiscal Decentralisation in Uganda by Mr. Isaac Shinyekwa, EPRC
10.40 – 11.00 am B R E A K
11.05 – 11.30 am Presenter 4 Information Requirements by NGOs by Prof. Jassy Kwesiga, Executive Secretary, DENIVA
11.35 – 12.00 noon Presenter 5 Measuring Integrity, Dr. Nkote Nabeta, Leader National Integrity Survey, IGG’s Office
12.05 – 12.40 pm Discussion
Invitees Media, Parliamentarians, Uganda Debt Network, Line ministries, Legal systems, Private sector, IGG, Electoral Commission, NGO sector, donors and international organizations, Districts, UBOS Directors and Officers
1.00 – 2.00 pm L U N C H
2.10 – 2.35 pm Dissemination of Trade Statistics, NWG, RHCTSSP
2.40 – 2.55 pm Discussion
3.00 – 3.15 pm External Trade Statistics Bulletin, Chris Mukiza, P/ST, UBOS
3.20 – 3.35 pm Tea
3.40 – 4.00 pm Marketing of Trade Statistics, NWG, RHCTSSP
4.05 – 4.30 pm Discussion
Invitees Cabinet Ministers, Members of Parliament, Governor Bank of Uganda, Directors NRM Secretariat, Commissioner Genaral, URA, UMA, PSF, NGO Forum, Donors (Norad, DFID, Japan, UNFPA, UNDP, World Bank, IMF, EU, Italian Embassy, Director General of Health, Inspector General of Police, UBOS Board Members, UBOS Directors and Senior Officers
08.00 – 08.30 pm Address to the Nation by Hon. Isaac Musumba, Minister of State for Planning, Ministry of Finance, Planning and Economic Development
08.35 – 09.00 pm Screening of the Film on Poverty, UTV and WBS
A Case and Some Actions for Improving Statistical Advocacy in Poor Developing Countries
AFDB-70-139.indd 87 11/1/05 8:19:03 PM
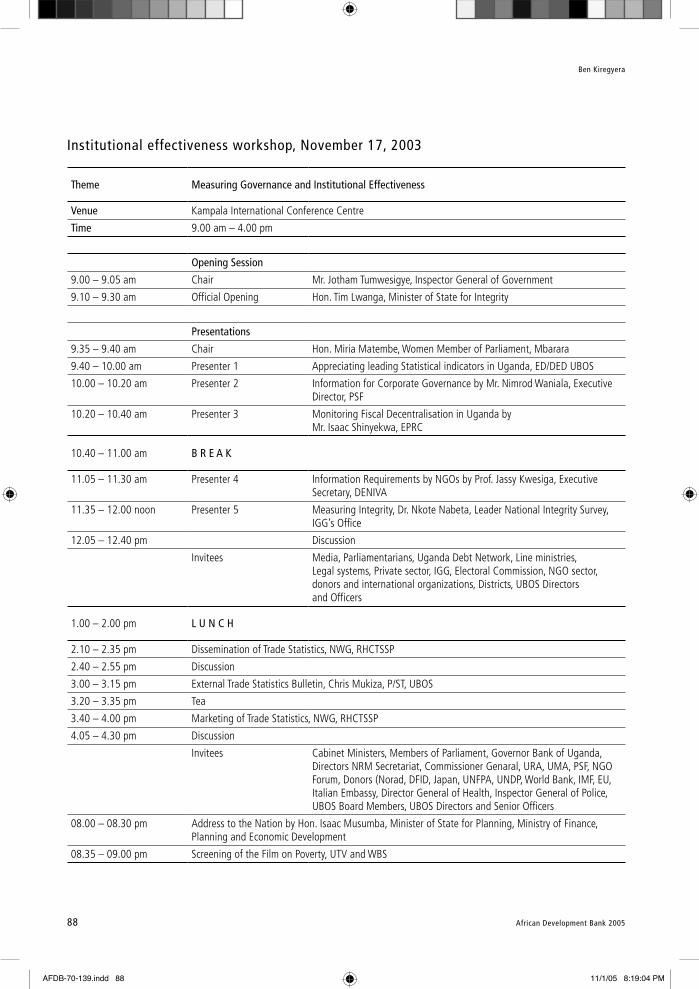
African Development Bank 200588
Institutional effectiveness workshop, November 17, 2003
Theme Measuring Governance and Institutional Effectiveness
Venue Kampala International Conference Centre
Time 9.00 am – 4.00 pm
Opening Session
9.00 – 9.05 am Chair Mr. Jotham Tumwesigye, Inspector General of Government
9.10 – 9.30 am Official Opening Hon. Tim Lwanga, Minister of State for Integrity
Presentations
9.35 – 9.40 am Chair Hon. Miria Matembe, Women Member of Parliament, Mbarara
9.40 – 10.00 am Presenter 1 Appreciating leading Statistical indicators in Uganda, ED/DED UBOS
10.00 – 10.20 am Presenter 2 Information for Corporate Governance by Mr. Nimrod Waniala, Executive Director, PSF
10.20 – 10.40 am Presenter 3 Monitoring Fiscal Decentralisation in Uganda by Mr. Isaac Shinyekwa, EPRC
10.40 – 11.00 am B R E A K
11.05 – 11.30 am Presenter 4 Information Requirements by NGOs by Prof. Jassy Kwesiga, Executive Secretary, DENIVA
11.35 – 12.00 noon Presenter 5 Measuring Integrity, Dr. Nkote Nabeta, Leader National Integrity Survey, IGG’s Office
12.05 – 12.40 pm Discussion
Invitees Media, Parliamentarians, Uganda Debt Network, Line ministries, Legal systems, Private sector, IGG, Electoral Commission, NGO sector, donors and international organizations, Districts, UBOS Directors and Officers
1.00 – 2.00 pm L U N C H
2.10 – 2.35 pm Dissemination of Trade Statistics, NWG, RHCTSSP
2.40 – 2.55 pm Discussion
3.00 – 3.15 pm External Trade Statistics Bulletin, Chris Mukiza, P/ST, UBOS
3.20 – 3.35 pm Tea
3.40 – 4.00 pm Marketing of Trade Statistics, NWG, RHCTSSP
4.05 – 4.30 pm Discussion
Invitees Cabinet Ministers, Members of Parliament, Governor Bank of Uganda, Directors NRM Secretariat, Commissioner Genaral, URA, UMA, PSF, NGO Forum, Donors (Norad, DFID, Japan, UNFPA, UNDP, World Bank, IMF, EU, Italian Embassy, Director General of Health, Inspector General of Police, UBOS Board Members, UBOS Directors and Senior Officers
08.00 – 08.30 pm Address to the Nation by Hon. Isaac Musumba, Minister of State for Planning, Ministry of Finance, Planning and Economic Development
08.35 – 09.00 pm Screening of the Film on Poverty, UTV and WBS
Ben Kiregyera
AFDB-70-139.indd 88 11/1/05 8:19:04 PM

African Development Bank 2005 89
Main celebrations, November 18, 2003
Activity 1 Procession Led by Prisons Brass Band
Time 1.00 – 2.30 p.m.
Route City Square – International Conference Centre
Activity 2 MAIN CELEBRATIONS
Venue International Conference Centre – Main Hall
2.30 – 2.45 p.m. Invited Guests Assemble
2.35 p.m. Chair: Hon. Isaac Musumba, Minister of State for Planning, Ministry of Finance, Planning and Economic Development
2.45 p.m. Hon. Gerald Ssendaula, Minister of Finance Planning & Economic Development – Arrives
3.00 p.m. Guest of Honour: Rt. Hon. Prof. Apollo Nsibambi, Prime Minister of Uganda – Arrives
3.05 p.m. National Anthem
3.10 – 3.25 pm Statement by Prof. Ben Kiregyera, Chairman Board of Directors, UBOS
3.25 – 3.50 pm Keynote Address: Information for Policy, Programming and Management Director General, Statistics Norway.
3.55 – 4.10 pm Remarks by Hon. Gerald Ssendaula, Minister of Finance Planning & Economic Development
4.15 – 4.45 p.m Rt. Hon. Prof. Apollo Nsibambi, Prime Minister of Uganda, Addresses the Nation
END
A Case and Some Actions for Improving Statistical Advocacy in Poor Developing Countries
AFDB-70-139.indd 89 11/1/05 8:19:04 PM

African Development Bank 200590
1: Director, Trade and External Debt Department, Bank of Uganda, 37/43 Kampala Road, P.O. Box 7120, Kampala, Uganda. E-mail address: [email protected]
2: Senior Statiscian, Uganda Bureau of Statistics (UBOS) , P.O.Box 7186, Kampala, Uganda. E-mail adress:[email protected]
Summary
The paper discusses results from agricultural statistics surveys in Uganda which indicate that there is potential to use rela-tively cheap Global Positioning System (GPS) equipment for measuring area and for geo-referencing of holdings in the con-text of agricultural statistics. However, this experience shows that there is need for careful setting of the equipment and thorough training of field staff before the GPS tool can be efficiently used. More studies are also recommended concerning the variability and consistency of the equipment, especially for very small plots and where tree cover and/or hilly areas in-troduce “shadow” and projection problems.
Key Words:
Agricultural Statistics; Census of Agriculture; Uganda Pilot Census of Agriculture (PCA). 2003; Uganda Permanent Agricul-tural Statistics System (PASS); Area Estimation Methods
1. Introduction
Reliable estimation of annual production of food crops and other agricultural commodities are very important, especially for a developing country such as Uganda which is making serious efforts to tackle the problem of feeding her population, di-versifying her export crops and, thus, raising the living standards of her people. Unfortunately, there have been major meth-odological problems in the estimation of crop production in developing countries, particularly in Africa.
A number of methods of estimating crop production exist including the following: Utilisation Table or Food Balance sheet; Direct Weighing; Farmers’ Estimates; Continuous Weighing; Measurements from Researchers; and a Product of Area and Yield. Each of these methods has strengths and weaknesses, particularly in Africa.
One of the most important factors for production used in growing crops, raising livestock or any other farming activity, is land. The pattern of land-use usually varies by seasons or by different regions of the country. Thus, apart from being used in the estimation of agricultural production, accurate data on area used for agricultural purposes is an important aspect of agricultural planning.
Total land operated by the holder (i.e. the agricultural holding) is a crucial variable for the analysis of agricultural data. The area of a holding may vary from time to time. A holder may sell or leave part of his/her holding or he/she may buy or rent from others.
Experience with GPS Equipment in Measuring Crop areas: The Case of Uganda
E.S.K. Muwanga-Zake1 and J.B. Magezi-Apuuli2
AFDB-70-139.indd 90 11/1/05 8:19:04 PM

African Development Bank 2005 91
At any time the holder has the option to fully or partially utilize the holding. Thus the proportion of the holding under crop also varies from season to season or from year to year. Crop production can be estimated as a product of the Yield and Area. The product can easily be computed in the case crops are grown in pure stand. With mixed cropping, data is collect-ed on the proportions of crop cover, which are then used to apportion the area to the various crops in the mixture to a pure crop equivalent.
Area measurement for use in traditional agricultural statistics has a twofold objective:
• To determine the structural changes of the agricultural holdings i.e. changes in total area size of the holding, size of the different land use categories and also to follow possible fragmentation or aggregation of farmland.
• To enable for determination of the actual and potential agricultural production by calculation of total crop production as a function of yield and area
Geo referencing of agricultural holdings in the context of agricultural statistics become relevant as Geographical Informa-tion Systems and Tools (GIS/GIT) is widely introduced in research institutions and civil administration planning units. Exact positioning of holding center and even of parcels and crop-plots can be combined with other geo referenced thematic in-formation and digital base maps for spatial analyses and planning.
2. Experimentation in Area Measurement Using the Geographical Positioning System (GPS) Equipment in Uganda
2.1 Background
In Uganda , like many other countries, there is no complete cadastral map or land register that includes information about holding areas. Experience from previous surveys and censuses also reveals that most of the holders in rural Uganda are not able to accurately determine the size of their land in useable quantitative units. As a consequence, all information about size of land has to be collected by measuring.
Experience from area measurement during the Agricultural Censuses in Uganda in 1963/65 and 1990/91, indicates that the measuring of areas by measuring tape (or wheel) combined with compass use and traversing the perimeter of the se-lected area is a fairly accurate but very time consuming method. The accuracy of this method however depends on the enu-merators capacity to read the compass and correctly apply the tape measurements and also to which extent approximation to the actual shape of the parcel or plot has to be done – the so called “give and take approach”. Also the cost for instru-ments like high quality compass and measuring tapes are considerable (Ministry of Agriculture, 1993).
On this background it was decided to look for alternative methods for area measurements. In this regard, a number of ex-periments have been carried out in the country using Geographical Positioning System (GPS) Equipment. These include the pre test for the Uganda Census of Agriculture and Livestock conducted in Masaka district in June/July 2002; the Pilot Cen-
Experience with GPS Equipment in Measuring Crop areas: The Case of Uganda
AFDB-70-139.indd 91 11/1/05 8:19:04 PM

African Development Bank 200592
sus of Agriculture (PCA), 2003; and the pilot Permanent Agricultural Statistics System (PASS) (Uganda Bureau of Statistics (UBOS) 2002, 2003a, 2003b & 2004a)
The GPS equipment is in principle a high precision digital watch combined with a signal receiver. It finds longitudes and latitudes on the earth’s surface. The geographical position is found by continuously measuring the time a signal takes from satellites in the sky to the GPS tool on the earth surface. An obvious advantage that the GPS tool has compared to the tra-versing with tape and compass is that the perimeter of the area can be followed fairly quickly, accurately and completely, irrespective of its shape.
2.2 Pre-test in Masaka District
Preliminary experimentation was carried out using two hand held GPS equipment of the type Magellan Meridian (www.ma-gellan.com) for area calculation of crop-plots and parcels as well as for geo-referencing of the holding during the pretest.
The findings of the pretest was that, compared to accurate but time consuming traversing of the same areas using compass and measuring tape, the average of the GPS equipment measurements seemed to be of promising accuracy. However the variation in the repeated measurements caused some concern at this stage. GPS equipment based calculation of areas was during the pretest done both by reading results from the device display directly and in addition by downloading the track-log polygons to a GIS software for storage, mapping and area calculations on a lap-top.
The registration of holding point co-ordinates caused no serious problems during the pre-test fieldwork.
2.3 Further experimentation and fine tuning of GPS tool setup
In October/November 2003, more studies of the accuracy and variation of the results were carried out using GPS tools al-ready available in Uganda Bureau of Statistics (UBOS). These had been procured and used in the identification of coordi-nates for all establishments in the Uganda Business Register.
The tools available were of the type Garmin 12 or Garmin 12XL. Most of these tools already contained the necessary soft-ware to calculate areas. Information about upgrading for area calculation software can be found on the Garmin home pag-es (www.garmin.com).
In cooperation with experts from the National Biomass Study Project and the Principal Cartographer within the UBOS, the instruments setup were optimized for such registrations i.e. the interval for registration recoded to the track-log was min-imized and a suitable projection and co-ordinate system was agreed. The latter was also to ensure comparability with al-ready existing digital thematic maps relevant for agriculture presentations and GIS analyses.
During this preparatory experimentation the possibility for downloading vector data for each parcel and plot perimeter was discussed and tested (necessary PC software can be downloaded). For practical reasons this approach was not further fol-lowed up. Recording of parcel and plots polygons as vector data would require advanced and expensive systems for trans-ferring large amounts of geographical data from the fieldwork into UBOS storing and processing facilities. In addition, the accuracy of the shape of the polygons registered with a handheld GPS equipment without any adjustment facilities, would
E.S.K. Muwanga-Zake and J.B. Magezi-Apuuli
AFDB-70-139.indd 92 11/1/05 8:19:04 PM

African Development Bank 2005 93
not fulfill technical requirements for use as cadastral maps. Finally, cadastral mapping was also regarded as being outside the scope of a census of agriculture.
During the October/November 2003 studies, it was concluded that the GPS equipment measurements were not statistically significant from those measured by tape and compass at the 5% level of significance. As a result of the pretest and the following experimentation and fine-tuning, it was decided to expand the experimentation with the GPS tool during the Pilot Census of Agriculture (PCA). The approach agreed for the PCA was to traverse the perim-eter of the selected areas with the GPS tool, conduct readings of results of position and areas directly from the GPS equip-ment display and finally recording the data into traditional statistical questionnaires.
2.4 Testing of GPS equipment during the Pilot Census of Agriculture, 2003
It was decided to compare the various methods for area measurement during the Pilot Census of Agriculture (PCA).
The experimental design of the PCA provided for four approaches to area estimation for three groups of holdings within each Enumeration Area (EA). Each EA had a total of 15 holdings selected, so each of the three randomly selected groups had five (5) holdings. The experimental design for area measurements was as follows: (i) Holders’/respondents’ eye estimates of parcel and crop plot area was recorded on the 5 selected holdings in Group I. (ii) Enumerators’ eye estimates of parcel and plot area was recorded on the 10 selected holdings in Groups II and III.(iii) Measurements using compass and measuring tapes were recorded on the 5 selected holdings in Group I.(iv) Measurements by use of GPS equipment were recorded for all the 15 holdings in the EA i.e for all the Groups I-III.All the four measurements had to be independent.
The land area measured per holding selected for the PCA was limited to that one within the selected EA and included:
• The total area of the holding. • Pasture land; and
• The area of agricultural parcels3 and plots4 under various crops.
The holdings in the EA were divided into three (3) groups/strata each with five holdings. The reason for this stratification of holdings was that the different methods for area measurement should be applied to the holdings independently. Second-ly, as the compass and tape take a long time, it was considered necessary to limit it to only five holdings which were then also measured by the GPS tool for comparison. The following scheme illustrates the three selected holding strata and which methods should be applied to each:
3: A Parcel is any piece of land that is part of the holding, but is entirely surrounded by other land, water, a road, forest, etc, not forming part of the holding. This implies that a parcel is part
of a holding that is physically separate from other parts of the holding. A holding is made up of one or more parcels.
4: A Plot is defined as a piece of land within the holdingand within a parcel on which a specific crop or a crop mixture is grown. A parcel may, therefore, be made up of one or more plots.
Experience with GPS Equipment in Measuring Crop areas: The Case of Uganda
AFDB-70-139.indd 93 11/1/05 8:19:04 PM

African Development Bank 200594
The area measurements and/or estimates for both parcels and plots were carried out in the following sequence:
• While walking around the holding to decide on the parcel boundaries and the number of plots to be found on the par-cel, the holder’s/respondent’s area estimate were to be recorded in the appropriate form for the five selected holdings for Group I.
• The Enumerator would make his eye estimates and record it on the appropriate forms for the ten selected holdings in Groups II and III.
• The Enumerator would take measurements using compass and measuring tape (traversing) on five selected holdings in Group I, and record the measured results (meters and degrees) for each of the sides in the parcel/plot that was measured. Results were then recorded (bearings and lengths). Thereafter, the Enumerator would calculate the measured area and the closing error using the programmable calculator and record the final results.
• The Enumerator would do the area measurement using the GPS equipment for all parcels and plots in Group I –III and record it in the same forms.
• Finally the Supervisor and/or the team from UBOS/MAAIF (Ministry of Agriculture, Animal Industry & Fisheries) cross-checked some selected parcels and plots by measuring, using GPS equipment.
• The Holders’/Respondents’ eye-estimates were made on different holdings to ensure independence of the two. Further, the actual measurements were to be carried out after the eye-estimates again to ensure independence. In both cases the eye-estiamtes would not be affected.
2.5 Use of the GPS Equipment in the Pilot Permanent Agricultural Statistical System (PASS)
The Uganda Bureau of Statistics (UBOS) in co-operation with the Ministry of Agriculture, Animal Industry and Fisheries (MA-AIF) have been conducting pilot agricultural surveys since 2004 to test a proposed system for collecting annual agricultural statistics. In these surveys the GPS equipment has also been used for the estimation of crop areas.
3. Lessons Learned in the Use of the GPS Equipment
Following the above-mentioned work, several lessons have been learnt as outlined below, especially from the Pilot Cen-sus of Agriculture (PCA) 2003, the subsequent Permanent Agricultural Statistics System (PASS) and the on-going Uganga Household Survey (UNHS) 2005:
E.S.K. Muwanga-Zake and J.B. Magezi-Apuuli
Holding group I5 holdings
Holders estimate+
Tape & Compass
Holding group II5 holdings
Enumerators estimates
Holding group III5 holdings
Enumerators estimates
All 15 holdings measured with GPS
AFDB-70-139.indd 94 11/1/05 8:19:05 PM

African Development Bank 2005 95
Experience with GPS Equipment in Measuring Crop areas: The Case of Uganda
3.1 Results from use of GPS and traversing during the PCA, 2003
The experimental design of the PCA allowed the comparison of the results of area measured with GPS equipment, by tra-versing with tape and compass and even by eye estimates by the holders and enumerators on a large number of holdings and in different topographic and vegetation cover conditions.
Initially problems with the level of accuracy were expected when the objective was to measure the area of parcels and plots. Experience on the ground, was however more positive. Basically the results of GPS measurements of areas reveals variances around the assumed most correct area figure i.e. the figure based on accurate traversing.
Comparative study of measurementmethod for Parcels
1. There were 430 observations where areas of parcels were measured both with GPS tool and by traversing (tape & com-pass). A paired T-test (see figure 3.1) of this set of observations reveals that there is no significant difference between the results of the two methods concerning parcels measured during the PCA filedwork 2003.
< Area measured by GPS. Hectares
Area measured by traverisng. Hectares > 10
8
6
4
2
0
0 1 2 3 4 5 6
Figure 1. Comparison of Parcel Area measured by GPS and area measured by traversing. PCA 2003
There are a number of outliers. However, the explanation about what caused them was unfortunately, not ascertained.
Comparative study of measurement method for Plots
A total of 1,004 plots were found where area is both measured by the GPS tool and by Traversing (measured area both for GPS and Traversing >=0). The area size of most of the measured plots is very small and in order to reveal possible differ-ences between measurement of small and larger plots during the statistical testing, the dataset for plots was divided into
AFDB-70-139.indd 95 11/1/05 8:19:05 PM

African Development Bank 200596
E.S.K. Muwanga-Zake and J.B. Magezi-Apuuli
Table 1: Paired Samples Statistics of Plot Areas
Mean N Std. Deviation Std. Error Mean
Stratum 1 Traversing 8.9251 70 14.37497 1.71814
GPS 7.8983 70 14.29725 1.70885
Stratum 2 Traversing 0.1441 934 0.57584 0.01884
GPS 0.0894 934 0.09383 0.00307
Table 2: Paired Samples Correlations of Plot Areas
N Correlation Sig.
Stratum 1 70 0.897 0.000
Stratum 2 934 0.121 0.000
Table 3: Paired samples Test of Plot Areas
Paired Differences T Df Sig. (2-tailed)
Mean Std. Deviation
Std. Error Mean
95% Confidence Interval of the Difference
Lower Upper
Stratum 1 1.0269 6.49338 0.77611 -0.5214 2.5752 1.323 69 0.190
Stratum 2 0.0547 0.57209 0.01872 0.0180 0.0914 2.922 933 0.004
2 strata; Stratum 1 with plot areas at least 0.5 hectares (N=70) and Stratum 2 with plot area size less than 0.5 hectares (N=934). Thereafter a paired T-test comparing the areas obtained by traversing and use of GPS tool was conducted for the two strata of plot area size. The results of these T-tests are presented in Tables 3.1- 3.3
AFDB-70-139.indd 96 11/1/05 8:19:05 PM

African Development Bank 2005 97
Experience with GPS Equipment in Measuring Crop areas: The Case of Uganda
The results from the paired T-test in Table 3.1 indicates that traversing of the plots that are more than 0.5 hectares, gives a slightly larger area per plot compared to the same plot area measured by GPS equipment. This tendency seems to be the same when plots with area size less than 0.5 hectares are measured. However, since the questionnaire only allowed for fill-ing in of hectares with 2 decimal places, this size group of small plots may have been disturbed by rounding-routines for the smallest areas measured i.e. those plot areas that were less than 0.01 hectares but rounded up and recorded as beeing equal to 0.01 hectares by the Enumerators.
Results for a combined sample of all plots are shown in Tables 3.4 to 3.6 and Figure 3.2. Using this sample in a paired T-test reveal, as for parcels but now also on the smaller plot areas, that there is no significant difference in the measured re-sults of the two methods.
Table 5: Paired Samples Correlations for all Plots
N Correlation Sig.
Pair 1 AREA_traversing & AREA_GPS 1030 0.914 .000
Table 6: Paired Samples Test for all Plots
Paired Differences T Df Sig. (2-tailed)
Mean Std. Deviation
Std. Error
Mean
95% Confidence Interval of
the Difference
Lower Upper
Pair 1 AREA_traversing- AREA_GPS
0.1196 1.78444 0.05560 0.0105 0.2287 2.151 1029 .032
Table 4: Paired Samples Statistics for all Plots
Mean N Std. Deviation Std. Error Mean
Pair 1 AREA_traversing 0.7374 1030 4.36468 .13600
AREA_GPS 0.6178 1030 4.19330 .13066
AFDB-70-139.indd 97 11/1/05 8:19:06 PM

African Development Bank 200598
The results with plots are still unclear and inconclusive, especially as subsequent work in PASS shows that measurements with the GPS tool are inconsistent especially for small plots. As small plots form a high percentage of planted area for a number of crops there is need for more research.
Results of Comparison of Time Use during PCA
1. Time use for the different measurement methods was recorded by the enumerators during the fieldwork of the PCA. For all observations recorded, the average timeuse for traversing with tape and compass was three times as long per hold-ing as when GPS equipment was used (Table 3.7).
E.S.K. Muwanga-Zake and J.B. Magezi-Apuuli
< area_GPS
area _ traversing > 80
60
40
20
0
0 20 40 60
Figure 2. Comparison of Plot Area measured by GPS and area measured by traversing. PCA 2003
AFDB-70-139.indd 98 11/1/05 8:19:06 PM

African Development Bank 2005 99
Experience with GPS Equipment in Measuring Crop areas: The Case of Uganda
At the beginning of the PCA, there was confusion on how and where to record the time taken, especially for traversing which took a long time. This contributed greatly to the missing observations but was subsequently clarified. A subset of all observations was selected in order to compare observations about time use on those holdings where both GPS equipment measurements and traversing with tape and compass was conducted. A paired T-test for this sub-set of 191 holdings reveals that time use for traversing was as much as 3 hours and 23 minutes or 3.5 times as much as when GPS equipment was used (Table 3.8).
Table 7: All observations of time used. Traversing, Use of GPS and Enumerator’s Estimates. PCA 2003
Traversing GPS use Enumerator’s estimate
Observations
N Valid 302 538 448
N Missing 476 240 330
Minutes used
Mean 153.9 55.6 46.1
Median 97.0 48.0 37.5
Table 8: Comparison between time use for traversing and use of GPS. Paired T-test Samples Statistics. PCA 2003
Mean minutes used
Comparable observations (N)
Standard. Deviation
Standard error for the mean
Traversing 203.1 191 185.4 13.4
GPS use 57.8 191 34.1 2.5
It should however, be noted that the mean minutes for traversing in Table 3.7 (153.9) is considerably different from the 203.1 minutes shown in Table 3.8. The reasons for this difference were, unfortunately, not explored. However, even this is still three times the time for using the GPS tool. Therefore, it can be concluded the GPS equipment is a far more time-effi-cient method/tool than the tape and compass measured in terms of average time use per holding.
Comparison of costs of instruments
Even simple handheld GPS tools are relatively expensive tools. The GPS equipment model used in the PCA was a Garmin 12 channel receiver with an approximate price of USD150 per unit (2003 prices). During the PCA fieldwork, three enumer-ators shared two GPS tools. With good logistics, cost efficiency could be improved by letting even more enumerators share the same tools.
AFDB-70-139.indd 99 11/1/05 8:19:07 PM

African Development Bank 2005100
The use of batteries turned out to be high as it was agreed to change batteries when approximately 2/3 of the energy was used. Since each GPS tool uses four high quality AA batteries, the costs for power supply was considerable. The recommend-ed batteries cost an equivalent of US$1.25 per pair compared to the more common ones which cost about USCents25. Clearly, this cost could be reduced by giving the equipment to the staff only when they are ready to carry out the area mea-surements. Also use of re-chargeable batteries may reduce the costs. The enumerators were instructed to switch off the equipment whenever not in use. It was however, not easy to know how well they followed this instruction.
For further work it should be experimented with rechargeable batteries as a more cost efficient option. However not all ar-eas in Uganda have stable power supply and recharging can give some logistical problems.
Two GPS device were lost during the project period due to unfortunate civil unrest in the enumeration areas. Such losses and cost will have to be expected to occur even more frequently in a full census since all districts shall be included.
The price of high quality tape and compass equipment is approximately 25 USD and 100 USD (compass including jacket) respectively. In addition a fairly expensive programable calculator is necessary to calculate areas captured by traversing. The total price is therefore not so different from the price of a GPS tool. On the otherhand, battery cost are zero for tape and compass.
Other General Observations
The way the GPS equipment was set up for the PCA, the area of each parcel and plot was calculated directly in square meters. Therefore, the value had to be converted to hectares (by dividing by 10,000) with two decimal places before information could be recorded in the appropriate questionnaire. Some enumerators had problems converting from Square Meters to Hectares. Oth-ers had recorded the values in square meters directly on the forms and this caused some confusion in the data entry/data clean-ing process. Why did you have the enumerators doing the conversion? The form should have a place for the enumerator to re-cord the square meters and let someone else do the conversion. Space on the questionnaire is limited and filling in Sq. Mts will need a very large range and hence many boxes. However, in subsequent work e.g. PASS, enumerators were given more train-ing and are copying better.)
During the PCA fieldwork it turned out to be necessary to repeat and further drill the routines for using the GPS. This was an indication of lack of proper training. Further, unfortunate changes of the setup of the instruments accidentally occurred and had to be corrected. However, in the end most of the enumerators managed to record both areas and coordinates ac-cording to the instructions.
Since the GPS equipment is fast and easy to use compared to traversing with tape and compass, in some cases the enu-merators only conducted GPS measurements and in spite of their instructions they did not follow up with the requested but cumbersome traversing of the same plot. It is also assumed that using the “high tech” GPS adds importance and status to the enumerator work as he/she visits the holders. During area measurement the experience was that positioning from between 5 to 8 satellites for each observation were re-ceived. The expected accuracy when using a hand held GPS-tool without any corrections based on additional fixed ground
E.S.K. Muwanga-Zake and J.B. Magezi-Apuuli
AFDB-70-139.indd 100 11/1/05 8:19:07 PM

African Development Bank 2005 101
stations or WAAS techniques is better than +/- 15 meters. This accuracy is acceptable when the objective is to geo-refer-ence the holding for statistical use.
During the fieldwork, problems were found with using the GPS tools on plots and parcels where the tree canopy cover is dense. In addition, there were problems with area measuring in very steep terrains due to the difference between actual area and horizontal projections. Also struggling with some “shadow” effect when receiving of signals from satellites in hilly terrain caused problems. A possible improvement could be to equip the GPS tool with an external antenna device when used under extreme conditions. This is possible for the GARMIN 12XL tool.
Farmers eye-estimates of area size both for parcels and plots and seem to overestimate the size of the areas compared to values obtained from use of GPS and traversing technique.
3.2 Experience from PASS
In the PASS there has not been any comparison with other methods of area measurement, however the exercise has provided further experience in the use of the GPS equipment.
Step by step instructions for setting up the GPS tool
The GPS tool measurement accuracy is sensitive to the set up of the instrument and possibly to battery status. Therefore de-tailed instructions on how to set up the GPS GARMIN 12 (or 12XL) device have been made for the pilot PASS 2004. (For prac-tical use of the GPS and for more information on the set-up refer to the GARMIN manual (hardcopy or www.garmin.com) and UBOS 2004a). A few examples are given below.
The area calculation should be recorded as hectares with 3 decimals (i.e. 10 square meters is the smallest area that can be recorded) in the PASS questionnaire. The GPS should be set up so that areas are calculated in square meters. The enumera-tor must take the readings of square meters area from the GPS and divide this value on 10,000 to get the area in hectares. Finally this value of hectares with three decimals should be recorded in the PASS questionnaire.
When using the GPS, the tool records and stores the geographical position at a specific interval of times based on signals from satellites that are received continuously as long as the device is switched on and has free sight to the sky.
The time interval that the GPS should use between each observation or position is recorded in the GPS memory should be correctly set up to 00.00.10 seconds. There has however, been proposals to reduce this time interval to cater for the small plots.
Finally, during the measurement, the speed of movement should not be too fast and the staff should stop in corners (for at least 15 seconds).
Experience with GPS Equipment in Measuring Crop areas: The Case of Uganda
AFDB-70-139.indd 101 11/1/05 8:19:07 PM

African Development Bank 2005102
Costs of the GPS Equipment
Unfortunately, the Germin 12 and 12XL models used for PASS have cost US$470 compared to the US$150 for those used in the PCA. Long life batteries should be used (e.g. Duracell or Energizer AA batteries). However, it was established that batteries could be changed when they reach 75% used. This compares to 2/3 recommended in the PCA. Thus a reduction in overall costs. How long the batteries take before replacement, depends on how organised the field staff are, especially switching off the equipment whenever it is not in use.
Training of Field Staff
During the PASS, field staff training on the use and practice of the GPS equipment was increased considerably, compared to the PCA.
Consistency of Measurements
During the PASS and the on-going Uganda National Household Survey (UNHS) inconsistencies have been observed where-by with repeated measurements different equipments, and even the same equipment, give different readings for the same area; especially for small areas. These are unfortunately common and at times the differences have been quite wide. This is being investigated. If the accuracy rate is around plus/minus 15 meters, say, then the smaller the plot the larger the possi-ble error. The best thing to do would probably be to repeat the measurements for plots smaller than a predetermined size and take an average.
4. Conclusions
The results from the PCA indicate that the area measurements by the GPS equipment and those by the compass and tape are very close – for parcel areas there were no statistically significant difference between the results of the two methods. Considering that the GPS equipment is much faster, this indicates that there is a potential for the GPS equipment for agricul-tural area measurements. Further work during the PASS collaborates some of these findings. However, as the differences for small plots were not conclusive, a lot more research work needs to be carried out for small polts. This includes trying to find the critical plot sizes above which the results are acceptable. Secondly, efforts need to be made for cheaper GPS equipment and running costs or at least more efficient use. Thirdly, there is need for more thorough training of field staff and proper setting of the equipment. Fourtly, more study is required on the variability and consistency of the equipment under more scientifically designed and closely supervised conditions. It is useful to compare different makes/models of the equipment. Finally, special studies concerning effects of steep slopes and under tree and cloud cover should also be conducted.
5. Further work and new possibilities for statistics
Combination of digital thematic maps, digital administrative boundaries and geo-referenced statistical information opens for spatial analyses of data. However, before such data can be used in Geographical Information Systems (GIS), a long pro-
E.S.K. Muwanga-Zake and J.B. Magezi-Apuuli
AFDB-70-139.indd 102 11/1/05 8:19:07 PM

African Development Bank 2005 103
Experience with GPS Equipment in Measuring Crop areas: The Case of Uganda
cess of data capture, geo-referencing/geo-coding, scanning and digitalization is required. Since geographical information will be found in different organizations in Uganda, it is crucial for common use to agree upon standards and formats.
By introducing geo referencing (coordinates) and geocoding (administrative division unit code) to statistical information of agricultural holdings sampled during survey and censuses and at the same time introduce similar coding for business and industry surveys/listings, new possibilities for spatial analyses of data occurs. The statistical information can also be com-bined with other sources of digitalized geographical data such as thematic maps available at the The Uganda National Bio-mass Study including digital main road net, water courses, land cover classes etc.
The use of the GPS tool also enables the use of point sampling which is a form of area sampling. Points can be randomly identified, once the enumerator finds the point using the GPS tool, the next step is to construct the holding around it and use Probability Proportional to Size (PPS) to estimate the land area.. This needs to be investigated.
References:
GARMIN manual (hardcopy or Web-page: www.garmin.com)
Ministry of Agriculture (1964). Uganda Census of Agriculture 1963/65; 4 Volumes
Ministry of Agriculture, Animal Industry & Fisheries (1993). National Census of Agriculture and Livestock 3 Volumes
Muwanga-Zake, E.S.K. (2003). Experiments in Yield Estimation in Uganda; Paper presented at the 54th Session of the International Statistical Institute, Berlin,
Germany
Uganda Bureau of Statistics (2002). Report on the Pre-Test for the Uganda Census of Agriculture and Livestock conducted in Masaka District in June/July 2002
Uganda Bureau of Statistics and Statistics Norway (2003a); Paper on the Results From the Pilot Census of Agriculture, 2003: GPS Equipment For Agricultural
Statistics Surveys
Uganda Bureau of Statistics (2003b). Use of the GPS Equipment In Agricultural Surveys: Uganda’s Field Experience: A Paper Presented at AFCAS & Technical Work-
shop On Rural Data For Policy Support, Best Practices And Emerging Methods In Agricultural Statistics; Yaoundé, Cameroon; 23rd – 30th October, 2003
Uganda Bureau of Statistics (2004a). Report of the Pilot Census of Agriculture, 2003
Uganda Bureau of Statistics (2004b). The Permanent Agricultural Statistical System – A Proposal by Dr. E.S.K. Muwanga-Zake, National Long-Term Consultant
Uganda Bureau of Statistics (2004c). Permanent Agricultural Statistics System Enumerators’ Manual.
AFDB-70-139.indd 103 11/1/05 8:19:07 PM

African Development Bank 2005104
1: Head of IT section, CAPMAS, Salah Salema Road, Nasr City, Cairo, Egypt: Email: [email protected]
2: Head of Data Entry Department, CAPMAS, Salah Salema Road, Nasr City, Cairo, Egyp. Email: [email protected]
Summary
The Central Agency for Public Mobilization and Statistics (CAPMAS) utilizes all its capabilities to provide statistical informa-tion covering all economics, social, health and cultural areas in Egypt by data gathering, processing and analysis.The Latest Population Census was under taken in the 1996, The next Census will be held in the year 2006.To ensure proper arrangements for conducting the Census and to deal with any concerns, Preparation should start three years before the census date.This paper discussed that automatic data capture is available for Latin numbers, CAPMAS developed the software to capture Arabic (Hindi) numerals and separate alphabet to facilitate the process of filling out forms for the enumerators.This paper illustrated the software and Hardware requirements that will be needed for the census which will use nearly 24 million questionnaires. This paper presented the challenges that will face by CAPMAS during the preparation phases of the ICR / OCR Implemen-tation and using scanning technology. CAPMAS has adopted a progressive statistical program that is based on advanced techniques and international recommen-dation to facilitate and reduce data collection and processing time, The data can be captured on computers automatically by scanning and using ICR / OCR technology ,This will reduce the data processing time and achieve more accurate results.
Key words
Population Census , ICR / OCR Technology, Scanning using Arabic numbers, Decentralization.
1. Introduction
The Census is one of the most important national statistical projects. Its results influence the formulation of many political, economic, and social policies, in addition to the implementation of essential programs for raising the standard of living.
The Central Agency for Public Mobilization and Statistics (CAPMAS) has adopted a progressive statistical programme that is based on advanced techniques and international recommendations. This programme should facilitate and reduce data collection and processing time which will, as a result, improve the decision making process through the provision of accu-rate and timely demographic data.
Preparation for Egypt’s Populationand Housing Census.
Data Processing Challenges
Bahy El- Din Abdel- Hamid Mortagy1 and Nevine Naguib Hegazy2
AFDB-70-139.indd 104 11/1/05 8:19:07 PM

African Development Bank 2005 105
The programme is characterized by a number of improvements over the previous census carried out in 1996. Some improve-ments deal with the process, and others deal with techniques. The main improvements are: 1. Preparation should start early to ensure that proper arrangements are firmly in place or conducting the census. In our
case we started three years before the census date.2. Data processing time should be less than the time taken for the previous census.3. The questionnaires should be specially designed so that the data can be captured on computers automatically by scan-
ning and ICR/OCR technology. This will reduce the data processing time and achieve more accurate results.4. The decentralization of data processing activities to four centers in the main regions of Egypt (Cairo- Alexandria -
Ismailia and Upper Egypt). Each region is responsible for between 5 to 7 governorates, with local offices in several towns. The local offices are capable of performing limited data processing functions.
5. Census results will be presented and disseminated in a visual format to improve data user understanding and thus im-prove decisions by policy makers. In this regard the data from the 2006 Census will be presented spatially using a geo-graphical information system (GIS).
In order to achieve these improvements, the 2006 population census will utilise advanced technologies for data collection and input. Intelligent Character Recognition (ICR) and Optical Mark Reader (OMR) will be used in capturing input data from the census questionnaires/survey instruments for accelerating the processing of census data. It is estimated that it will take about 9 months to process nearly 24 million (24,000,000) questionnaires with 22 characteristics (fields) using scanning and OCR/ICR technologies. This is less than half the time that would be required for manual data entry which is estimated to take more than a year and a half using single data entry. The reminder of this paper will discuss the technologies in greater detail.
The quantity of equipment that is required depends on the number of questionnaires that will be used, Estimation of household Population, Buildings and, Establishments in 2006: No. of population 73.1 million No. of household 15.9 million No. of building 14 million No. of housing unit 23.5 million Country area 1.000.000 Km2
Referring to our previous estimate of household population, buildings and establishments, we would need 12 servers, 1100 Pc’s, for traditional data entry. It is estimated that the equipment requirement when using ICR techniques will be 16 servers, 600 Pc’s, 11 scanners and the estimated cost will be reduced by 20 % compared to manual data entry.
2. Technology Overview
2.1 Intelligent Character Recognition and Optical Character Recognition
Intelligent Character Recognition (ICR) and Optical Character Recognition (OCR) recognize and capture alphanumeric char-acters on computer at a very high speed.
Preparation for Egypt’s Population and Housing Census. Data Processing Challenges
AFDB-70-139.indd 105 11/1/05 8:19:08 PM

African Development Bank 2005106
ICR/OCR, the two terms are often used interchangeably, provide complete form processing and documents capture solu-tion. They use modular architecture that is open, scaleable and workflow controlled, and the modules include forms defini-tion, scanning, image, pre–processing, and recognition capabilities. ICR/OCR captures data from forms, thus reducing keystroke errors, reducing data entry time, error and cost and as a result brings data entry one step closer to complete automation, while maintaining the high level of accuracy required in form processing applications.
Forms containing character images can be scanned through scanner and then recognition the engine of the OCR system interprets the images and turns images of machine printed characters into ASCII data while ICR has the ability to turn im-ages of hand written or printed characters into ASCII data.
2.2 Optical Mark Reader
OMR works with specialized forms. Each form contains data in pre-coded format, ID marks, which look like black boxes on the top or bottom of a form, to identify the form, and timing tracks along one edge of the form indicate to the scanner where to read the marks. OMR is a data collection technology that does not require a recognition engine since it cannot recognize hand – printed or machine printed characters. The use of Optical Mark Reader was one of the first attempts to optically process statistical information. With OMR the image of the document is not scanned or stored, hence it is consid-ered a simpler technology than OCR / ICR and, if the forms and the system are properly designed, OMR is more accurate than either ICR or OCR. The main limitation of OMR is that it occupies a lot of space on a form and so it can only be used on short uncomplicated questionnaires.
2.3 Assessment of the Use of ICR for Census Data processing
The use of ICR has a number of advantages and it presents a number of challenges. This section includes a list of the major beneficial features and limitations. The major beneficial features are:
• It reduces the data entry time and increases its accuracy (compared to the use of manual data entry operators).• Validation rules may be included in the system to validate and correct the data. • Errors are identified using different colors that facilitate the review and correction process. • Recognized data fields are updated automatically in the appropriate database form. • Scanned forms are stored digitally thus eliminating the need for physical storage of paper forms.• The system stores data in a database thus facilitating data analysis.• It reduces the number of data entry persons needed.• The system is scalable to include more clients when required.• Forms can be designed easily.• Drop out color improves the accuracy of recognition.
Bahy El- Din Abdel- Hamid Mortagy and Nevine Naguib Hegazy
AFDB-70-139.indd 106 11/1/05 8:19:08 PM

African Development Bank 2005 107
On the other hand:
• Quality of paper is an important factor. Thin or dirty forms may cause a problem. From our experience during three trial experiments, we faced a problem which led to the decrease in the recognition rate.
• Errors in filling of questionnaires decrease the rate of recognition as well as in manual data entry. • The speed of gathering data by enumerators is less than the traditional method. An enumerator, in the same time pe-
riod, may enumerate 250 households using traditional methods, and 200 households using new technology because the filling of ICR forms needs more care to write in definite positions. It needs more care than manual data entry. The enumerator must write in the specified box.
• Variation of enumerator handwriting can cause major problems in form processing and may decrease the recognition rates.
• Printing quality can cause problems if it is too dark or too light. This may reduce the rate of recognition of the forms. • Defining a paper drop out color is an important factor since different scanners may have different appropriate colors.
Table 2: Comparison between ICR with Manual Data Capture
Point of Comparison ICR Manual Data Capture
Speed High low
Accuracy High low
No of users Small More than ICR
Quality of paper Needed Not Needed
Cost Less than manual More than ICR
Storage of questionnaire
keep it Not needed Need large space to store it
Storage of image Needed Not needed
No of Pc’s used Small More than ICR
Error during human intervention Small More than ICR
Preparation for Egypt’s Population and Housing Census. Data Processing Challenges
Table 1: Comparison between ICR / OCR and OMR
Points of Comparison ICR / OCR OMR
Hand print recognition Y for ICR N
Machine print recognition Y N
Recognition of checks an “x” s Y Y
Requires timing tracks / form IDs N Y
Require registration marks Y N
Electronic image storage and retrieval Y N
AFDB-70-139.indd 107 11/1/05 8:19:08 PM

African Development Bank 2005108
Trial runs are often used to determine the appropriate color(s). • Drop out color, usually red, is the color facility in ICR system that allows the system to pick up only the meaningful in-
formation from an ICR form. The system only needs to identify the black parts, and to compare them to specifications to recognize parts that are filled or written.
2.4 Assessment of using scanned images for data entry and checking compared to a paper questionnaire
Images provide a significant step towards a paperless office; no more carrying of questionnaires to and from the work sta-tion; clear desks; faster processing; minimal physical storage requirements either near the operator or in long term storage facilities. The scanned questionnaires can be stored in various locations decreasing the chance of them being destroyed. Fi-nally, questionnaires are available on-line and can be displayed within seconds as opposed to searching for documents on shelves which is very time consuming. Electronic filing of questionnaires is prone to less filing errors especially if a file in-dexing application is used.
Larger and more expensive computer screens 17” are needed for ideal display of the image. 15” screens are the standard for CAPMAS. Larger servers and additional computer memory are required to appropriately store and process images. How-ever, this is a minor extra cost compared to the massive benefit of having the questionnaires in electronic format.
3. How to obtain good results of scanning?
Improvements in the scanning process have a positive influence on the speed and accuracy of the census. Several factors must be considered in order to ensure appropriate and correct scanning. These include quality of the form, appropriate preparation of field personnel and their supplies, and appropriate design of the quality control activities.
3.1 Quality of the Form
In order to increase the quality of the form several steps should be considered:
• A reliable printing press should be considered. Poor print quality may cause problems during the scanning and recog-nition phases.
• Appropriate ink and careful consideration of the dropout color for the questionnaires.• The use of paper heavier than 80 gm per square meter may reduce paper crashes and over read the other side of a sin-
gle page.
3.2 Field Personnel Preparation and Supplies
Careful handling and filing of the ICR / OCR documents are of paramount importance, therefore, survey enumerators should have appropriate supplies such as a documents bag, several black pencils, corrector, etc. Training enumerators on how to
Bahy El- Din Abdel- Hamid Mortagy and Nevine Naguib Hegazy
AFDB-70-139.indd 108 11/1/05 8:19:08 PM

African Development Bank 2005 109
write numeric or alphabetic characters to achieve maximum recognition cannot be understated. For example, each box should contain only one character, characters should not extend out side designated boxes, and unnecessary lines of char-acters such as points, decorative strokes, etc are prohibited.
3.3 Quality Control Process
To improve accuracy a number of quality control checks are required. For example procedures need to be developed to en-sure that all the questionnaires are scanned completely, with no omissions or duplication, the same as manual data entry. Other procedures are needed to ensure the quality of the various processes such as the recognition process. A sample may be used to perform quality assurance checks on these processes. For example, quality assurance tests should be performed on the recognition process to ensure that acceptable recognition rates are maintained.
Reading errors are often due to:• Poor form condition due to dirt, folds, crumples, etc…• Forms improperly fed into scanner (at an angle).• Forms are partially filled (incomplete forms during data collection) this is the same as manual data entry.
Reading errors may be reduced by the following: • Preparation of coding library (dictionary). • Learning ICR software on obscure fonts or specific country’s handwriting style. Learning the software increases the rec-
ognition rates.
4. Census Forms
As previously stated, the proper design of the census forms is of paramount importance. The census uses four major forms to collect the data from the field. These forms are:• Household and housing conditions.• Establishments.• Buildings.• Residents in public houses.
Legal size (A3) regular (100 gm) paper was used. The household and housing conditions form includes sufficient space for seven household members. Households with more than seven members may use additional sheets.
The forms were designed to be processed using scanners as part of the ICR technology. It is important to follow the appro-priate design process in order to develop an efficient form that reduces the processing time and maximizes the reliability of the ICR process. Some of the guidelines are:• The instructions should be written in clear simple language.• The data fields must be clearly defined.• The fields should be listed by name and number of characters required for each field identified. • Fields that require ICR should be identified.
Preparation for Egypt’s Population and Housing Census. Data Processing Challenges
AFDB-70-139.indd 109 11/1/05 8:19:08 PM

African Development Bank 2005110
• Size of form and weight of paper will play a role in the determination of the type of scanner. • Registration marks should be used. These are special markings needed to aid the registration system in de-skewing the
scanned image. The marks should be at least _ inch away form the edge of the paper.• A margin of at least _ inch (6.4 mm) around the entire frame should be provided.• A drop out color should be used to improve the recognition process.• For best results registration marks should be placed as far apart as possible on the form.• Size of each character box should be a minimum 5x 6 mm to be suitable for filling it with data. • The form should include white space between each field character box and between each field to prevent the intersec-
tion of data and to get good result during recognition.• For maximum recognition rates ensure that responses are coded with numeric characters.
5. System Requirements: Hardware and Software
5.1 Hardware
Three main hardware components must be carefully selected. These are:• Pc’s ( for scanning , recognition , verification , validation, and tabulation).• Servers ( for data storage, validation and tabulation ).• Scanners. Scanner selection is critical for the success of the process. The following factors must be considered:• Paper size.• Paper handling (Automatic document feeder).• Resolution.• Scanning speed.• Drop out color. We used two types of scanners Fujitsu M4099 D and Kodak 3520 which processed 90 page a minute.
5.2 Forms processing capabilities.
Forms processing features include Form ID, registration, de-skewing and form template removal. Form ID allows sorting of forms in a batch by allowing unique identification of graphical object or character strings. Recognition and de-skewing fea-tures automatically align and re- size images to their original dimension and provide more precise from template removal leading to much higher recognition accuracy. Fujitsu M 4099 D specification Duplex Image scanners
Bahy El- Din Abdel- Hamid Mortagy and Nevine Naguib Hegazy
AFDB-70-139.indd 110 11/1/05 8:19:08 PM

African Development Bank 2005 111
Features
Speed : 90 ppm simplex scanning 180 imp duplex scanning Document size : from A3 to A7 Resolution : 100 to 400Capacity of ADF : Maximum 1000 Sheet
5.3 Software requirements.
The software that will be used in the census consists of modules for recognition, verification, validation and tabulation. The scanning module is bundled with the scanner. The recognition module must recognize and interpret different data forms including hand written, machine – printed barcodes, check boxes, marks, numeric field, alphabetical field and mixed field. It should be able to convert the scanned image file into a text / ASCII file. In the case of CAPMAS, the software develop-ment team is responsible for the development and deployment of the remaining modules. All the modules will be integrat-ed into one application.
6. Recognition Approach
Character recognition is an important process. Different approaches are often used to increase the recognition rate. These include the use of the same recognition engine with different settings and the parallel use of different engines with differ-ent capabilities, since some engines are better recognizing numeric while others are better recognizing alpha characters. CAPMAS used two different engines during the third pilot project (discussed later) census to determine the best approach that delivers a high degree of confidence.
There are many companies globally but only a handful of companies provide this type of product like Intelligent Data Cap-ture Solution (Indicius) from Neura Script company, and Eyes & Hands From Read and Soft company. Also COSEKE in Tan-zania is using OCR for Anydoc software.
7. Automatic Coding
CAPMAS replaced manual coding with automatic coding in order to reduce time and achieve more accurate results. Auto-matic coding is the process of selecting a code that matches the response given to a question. Possible answers to ques-tions and their appropriate codes are included in a coding library, and during the data entry a list of codes appear on the operator’s screen. The operator may select a code from the list that matches the answer, or enter a different one.
Preparation for Egypt’s Population and Housing Census. Data Processing Challenges
AFDB-70-139.indd 111 11/1/05 8:19:08 PM

African Development Bank 2005112
8. Decentralization
CAPMAS, in order to improve the collection and analysis of data, divided Egypt into four provinces. Each province covers a number of governorates and includes a province head office, a governorate office and local offices. CAPMAS established clear guidelines of the responsibility of each level, these guidelines are:
Role of local offices in governorate:• Committees receive the documents for each governorate.• Manual verification of the documents.
Role of provinces center:• Committees deliver the documents to the data processing department.• Manual verification.• Data Entry process (Scanning – recognition – correction).• Automatic coding.• Load data to the head quarters system.
Role of the head quarter:• Validation programs for each governorate.• Edit programs.• Elementary tabulation.• Statistical revision for the tabulation.• Final tabulation for each governorate.• Final tabulation for all the country.
9. Implementation Procedures
CAPMAS has carried out three pilot projects to test the appropriateness of the use of ICR in the census data entry process. The first included 7500 households, and data entry was limited to Latin characters only. The main problems identified dur-ing this pilot project were the inappropriate design of the questionnaire that led to inaccurate filling of the form; and the second was the heavy weight of the register that included the forms and carried by the field personnel. After the redesign of the form and the register, a second pilot project was conducted using 20,000 households. During this phase, the register contained 30 forms and dropout technology was introduced. The results showed improvements over the first pilot project.
A third pilot project was conducted covering 100,000 households. The pilot project assessed two main aspects; the use of Arabic characters and the decentralization system. The recognition process used a CAPMAS-developed module to recog-nize Arabic numbers (Hindu numbers) and Arabic alphabetic for the first time in the Arabic countries. The pilot project was conducted in two provinces (Cairo and Ismailia). The result of the third pilot project (97% recognition rate) is extremely en-couraging. Recognition rate is the proportion of data that is automatically accepted.
Bahy El- Din Abdel- Hamid Mortagy and Nevine Naguib Hegazy
AFDB-70-139.indd 112 11/1/05 8:19:09 PM

African Development Bank 2005 113
10. Challenges
Several problems arose during the preparation phases of the ICR/OCR implementation. The following restates the chal-lenges.
A – Designing of documents
Some points should be taken into consideration:The paper quality (if it is too thin or dirty).Using trial and run method is the best way to choose the suitable dropout color.
B – Selecting the scanner
The type of scanner depends on : Speed.Ability to handle a large number of pages.Duplex (read both sides in the same time).Resolution.Driver and interface.
C – Choosing the image software
Many types of imaging software are available in the market and each with different degrees of accuracy, some modifications may be necessary with census data processing. CAPMAS used two different engines in the third (3rd) pretest to choose the most accurate one for the 2006 population census.
D – Variation in hand writing
Due to variations in hand writing a special training program for enumerators is required to ensure they fill in the forms using ICR friendly characters. The recognition rate must be as high as possible to minimize manual data verification, and corrections.
11. Conclusion
Using ICR technology is a progressive step, which shortens the data processing time and therefore the period from field level data collection to the production of reports and other dissemination applications. The three years leading up to data collection have been extremely useful as they allowed the team to develop and comprehensively test the data processing applications before data collection started. It is expected that data entry and tabulation will be complete within 9 months of the end of data collection which will enable the team to produce the census documents and disseminate the census re-sults in very good time.
Preparation for Egypt’s Population and Housing Census. Data Processing Challenges
AFDB-70-139.indd 113 11/1/05 8:19:09 PM
African Development Bank 2005114
1: GDDS Regional Advisor, IMF
1. Introduction
The GDDS project was designed to promote capacity building in statistics. The Anglophone African project started in early 2002, sponsored by the Department for International Development (DFID) of UK. The IMF and World Bank are the imple-menting agencies. It is designed to promote the systematic development of statistical systems, by providing diagnostic tools to identify areas of the statistical system that require attention and to establish processes to formulate and implement de-velopment plans. The first phase of the project was to help countries prepare metadata and the subsequent activities fo-cused on the provision of short-term technical assistance and other services to help implement of plans for improvement to 15 countries: Botswana, Eritrea, Ethiopia, Ghana, Kenya Lesotho, Liberia, Malawi, Namibia, Nigeria, Sierra Leone, Sudan, Swaziland, Zambia and Zimbabwe. The IMF concentrates on macroeconomic sectors namely, fiscal, external, finance and real, while the World Bank looks at the socio-demographic areas namely, population, poverty, health and education.
The project is due to be completed in April 2006.
2. The main objectives of the Anglophone project
The main objectives of the project include:
• Sustainable improvements in the quality, coverage and dissemination of key statistics in all active countries• Countries have a plan to improve national statistical system• GDDS plans for improvement are implemented• Information about data, “metadata”, is developed, updated, and disseminated • Effective coordination nationally and within the region• Awareness of data statistical practices among data users is improved.
The first priority has been to assist countries to prepare the metadata that are needed to participate in the GDDS. Most of the countries have prepared the metadata and has been posted on the IMF website, www.dsbb.imf.org and with this goal completed, emphasis has shifted to assisting countries to make the improvements in the specific areas of statistics that have been dentified as priorities in the metadata.
General Data Dissemination System (GDDS) Projectfor Anglophone Africa
Oliver J.M Chinganya1
AFDB-70-139.indd 114 11/1/05 8:19:09 PM

African Development Bank 2005 115
3. Project Activities undertaken
Project activities undertaken so far mainly include:
• Real Sector: focus has been on National Accounts, Consumer Price Index, Producer Price Index and Labour Statistics. Technical assistance for the later has been provided by the World Bank.
• Fiscal Sector: Government Finance Statistics focusing on the coverage and classification as well as migration to 2001 Manual.
• External Sector: Balance of Payments, which included introduction of quarterly statistics, Private Capital Flows and In-ternational Investment Position.
• Financial Sector: coverage of financial statistics and the reconciliation of monetary and financial accounts.• Population and demographic statistics: population projection, including projection taking into account HIV/AIDS, cen-
sus preparation documents, etc.• Poverty Statistics: detailed analysis of household income and expenditure, poverty profiles and CPI weights.• Education Statistics: improvement in data collection instruments and general improvements of education statistics.• Health Statistics: general improvement of statistics including management of information and development of the
health information system. Although not initially designed to strengthen statistics in other areas, the project has also provided assistance in carto-graphic mapping and Geographical Information Systems; statistical organization – strategic plans; gender; vital registra-tion; judicial statistics; trade statistics; improvement of websites and dissemination policies. More recently, the promotion of cooperation among statistical agencies on the national and regional level and strengthening of statistical system as part of the strategy to reduce poverty have also been added to the scope of the project.
The project has also organized joint training seminars with other regional agencies such as East AFRITAC on Producer Price Index, and Macro Economic and Financial Management Institute (MEFMI) of the Eastern and Southern Africa, on Private Capital Flows.
4. Up coming workshops
Upcoming workshops include:
• Undertaking of Statistics Awareness workshops – dates to be decided by participating countries• Regional National Accounts and Private Capital Flows seminars with MEFMI – Venue and time to be agreed.• GDDS regional workshop (Project Wrap-up) – Gaborone, Botswana, early 2006.
General Data Dissemination System (GDDS) Project for Anglophone Africa
AFDB-70-139.indd 115 11/1/05 8:19:09 PM

African Development Bank 2005116
1. Background
The Southern African Development Community (SADC) is a regional grouping of 13 states in Southern Africa2. Its mission is “To promote sustainable and equitable economic growth and socio-economic development through efficient productive systems, deeper co-operation and integration, good governance, and peace and security, so that the region emerges as a competitive and effective player in international relations and the world economy”.
The SADC Secretariat is implementing a Trust fund project to support statistical capacity building for poverty reduction strat-egies in Southern Africa. The purpose of the grant is to provide seed money for putting up structures for poverty monitoring in the SADC region. The sustainability of these structures lies with the Member States to incorporate their continued exis-tence in their national budgets.
The life of the project is 18 months starting January 2005 ending June 2006.
2. Purpose of the Project
The main purpose of the project is to promote poverty reduction and economic development. This will be achieved by pro-viding continued support to SADC Member States to generate, disseminate and use good quality statistics for the moni-toring and evaluation of their poverty reduction strategies and to inform policy formulation. The project is directly linked to the RISDP cross-sectoral intervention areas, in particular statistics. The project support the implementation and monitoring of the RISDP in three main ways: a. Assists SADC member states to prepare and implement national strategies for the development of statistics and to gain
better access to international resources for capacity building;b. Develop a cadre of experts in the region to support statistical capacity building and poverty monitoring;c. Develop a regional resource base and information network
SADC/WB Project on Statistical Capacity Building for Poverty Reduction Strategies
Helena Nthibe1
1: Programme Manager, Statistical Capacity Building for Poverty Reduction Strategies, SADC Secretariat, P/Bag 0095, Gabarone, Botswana.e-mail address: [email protected]
2: Angola, Botswana, Democratic Republic of the Congo, Lesotho, Malawi, Mauritius, Mozambique, Namibia, South Africa, Swaziland, Tanzania, Zambia and Zimbabwe
AFDB-70-139.indd 116 11/1/05 8:19:09 PM

African Development Bank 2005 117
3. Project Components and Outputs
The project has five main components which, together with their main outputs include:
Coordination and Development of a Regional Resource Base
Under this objective Member States will get direct technical assistance from the Project manager by way of facilitation of statistical activities for poverty monitoring. Develop a regional database in support of statistical capacity building and pov-erty monitoring and supporting the Regional Indicative Development Strategy (RISDP) implementation. Establish a database on statistical expertise for access by all member states.
The main outputs of this component is an effective project management and coordination system in place and to have a regional resource database accessible to members states and others, The resource base will include a number of different sets of information, including: • An inventory of regional staff with expertise and experience in statistical development and poverty monitoring• An inventory of statistical capacity in member states• A collection of national statistical development strategies and other relevant material• Case study material on statistical development and poverty monitoring from member states• Information on international and regional programs supporting statistical development and poverty monitoring• Both data and metadata on poverty indicators in member states
Links will be maintained with the PARIS21 web-site and with collaborating agencies both within the region and elsewhere, such as Universities, Central Banks, donors etc.
Assist SADC Member States to develop, implement and monitor national strategies for the development of statistics (NSDS)
In line with the Marrakech Action Plan for Statistics (MAPS) the purpose of this component is to assist member states to prepare, implement and monitor national strategies for the development of statistics. This component will provide technical assistance to member states, promote the exchange of information and encourage the sharing of experience, both through workshops and the regional database. Particular emphasis will be placed on aspects of the strategic planning process such as improving links between the demand for and supply of statistical data, building links with national policy development plans and poverty reduction strategies and reviewing overall coordination and management processes.
The basic strategy will be to use the project as a strategic resource, providing advice and technical support to enable mem-ber states to get access to other funds, including specific applications to TFSCB, where appropriate.
The main output from this component will be for at least 10 member states to have an NSDS in place by the end of 2006. Assist SADC Member States develop regional expertise in areas related to statistical development and poverty monitoring.This component aims to improve the links between data and their use for policy and poverty analysis. It also focuses ex-plicitly on building capacity to use poverty statistics more effectively, thus helping to create more long-term demand for the products and services of national statistical systems. Short training programs and dissemination workshops will be organ-ised on poverty analysis and especially for poverty monitoring units, other policy analysts such as rural development coor-
SADC/WB Project on Statistical Capacity Building for Poverty Reduction Strategies
AFDB-70-139.indd 117 11/1/05 8:19:09 PM

African Development Bank 2005118
dinators and statisticians responsible for the generation of poverty and poverty related data. These short training programs will be augmented by a mentoring and attachment program. The project will provide the technical inputs for the workshops, with member states taking responsibility for meeting the costs of provision of training facilities, etc.
Particular emphasis is to bring poverty monitoring units and similar agencies more directly into the scope of the project, thereby helping to improve links between statisticians and data users.
By the end of the project, a cadre of at least 20 regional staff will have been developed with the experience and expertise to lead statistical development activities and poverty monitoring in SADC member states.
4. Progress so far
A number of technical missions have been identified and logistics on identification of consulting firms are ongoing to carry out the assignments. These include:
i. Regional training workshop on poverty analysisii. Database development for poverty monitoring and monitoring of the MDGs, Malawiiii. Micro level estimates of poverty in Zambiaiv. Database development for poverty monitoring (Lesotho and DRC)v. Review of the Statistics Act (Malawi)vi. Updating/development of a national business register (Swaziland, Zimbabwe)vii. Consolidation and dissemination of the Statistics legislation of Botswanaviii. Development of a statistics governing document for the new autonomous statistics office ix. National workshop for the launching of the National Statistics Strategy (Zimbabwe)x. Review of agricultural system (Zimbabwe)xi. A producer/user workshop, DRCxii. Analysis of HBS, DRC Tanzania (Zanzibar)xiii. Development of a funding proposal for a joint informal sector and labour force survey, Swazilandxiv. Development of the Statistics Legislation, DRCxv. Poverty mapping Mauritius
Helena Nthibe
AFDB-70-139.indd 118 11/1/05 8:19:09 PM

African Development Bank 2005 119
SADC/WB Project on Statistical Capacity Building for Poverty Reduction Strategies
AFDB-70-139.indd 119 11/1/05 8:19:10 PM

African Development Bank 2005120
1. Introduction
La Communauté Economique des Etats de l’Afrique de l’Ouest (CEDEAO) a été créée le 28 mai 1975. Le Traité signé à cet-te date à Lagos a été révisé en 1993 (Traité Révisé), essentiellement pour doter l’institution d’éléments adéquats pour un fonctionnement plus efficace, avec pour but la promotion de la coopération et l’intégration dans la perspective d’une union économique de l’Afrique de l’Ouest. En plus du Secrétariat Exécutif et du Fonds de la CEDEAO créés suivant le Traité de 1975, d’autres institutions ont vu le jour avec le Traité Révisé. Parmi celles-ci, on peut citer le Parlement, la Cour de Justice et le Conseil Economique et Social. Les décisions de la Communauté passent par les Commissions Techniques Spécialisées avant d’être adoptées par le Conseil des Ministres et/ou par la Conférence des Chefs d’Etat et de Gouvernement. Par exem-ple, les dossiers statistiques passent par les Directeurs de Statistique de la CEDEAO réunis dans la Commission « Commer-ce, Douanes, Fiscalité, Statistique, Monnaie et Paiements ».
En vue de la réalisation de l’union économique, la Communauté a mis en place un schéma de libéralisation et est en passe d’adopter un tarif extérieur commun ; elle a aussi adopté depuis 1999 un mécanisme de surveillance multilatérale des po-litiques économiques des Etats membres en vue de la mise en place de l’union monétaire. Pour faciliter la mise en œuvre de l’intégration, un certain nombre de programmes communautaires ont été définis dans les domaines de l’agriculture, des transports et télécommunications, de l’énergie, etc. ainsi que dans le domaine de la paix et de la sécurité.
2. Du programme statistique
Le programme statistique dérive de l’agenda communautaire ci-dessus et vise la facilitation de l’exécution et de l’évaluation des programmes, tout en s’ajustant à l’environnement régional et international. Il s’inscrit dans le cadre de la Politique de la CE-DEAO en matière de Statistique, adoptée en 1996, et conformément aux dispositions de l’Article 3, section 2, alinéa (i) du Traité (Révisé). Les priorités à court et à moyen terme s’articulent autour du fonctionnement du mécanisme de surveillance multilaté-rale des politiques macroéconomiques des Etats membres et de la surveillance commerciale, ainsi que le suivi des indicateurs de pauvreté et des Objectifs de Développement du Millénaire (ODM). Deux plans d’action ont été adoptés en 2004 concernant l’harmonisation des comptes nationaux et des indices de prix à la consommation, respectivement, tandis qu’un programme sta-tistique régional pour la période 2006-2010 reprenant les domaines prioritaires (huit au total) sera soumis pour adoption aux instances de la Communauté aux prochaines réunions statutaires.
Pour exécuter le programme statistique, la Division Statistique bénéficie de deux types de ressources : le financement du Secrétariat Exécutif, à travers les budgets annuels, et une assistance extérieure. Les deux composantes ont connu une aug-mentation notable ces trois dernières années : la première composante est passée de $188 000 en 2003 à un montant de $287 000 en 2005 ($204 000 en 2004) ; tandis que la deuxième composante (assistance extérieure) s’est accru de $659
Communauté Economique des Etats de l’Afrique de l’Ouest : Activités statistiques du Secrétariat
Exécutif de la CEDEAO relatives au renforcementdes capacités des Etats membres
Akou Adjogou
AFDB-70-139.indd 120 11/1/05 8:19:10 PM

African Development Bank 2005 121
000 en 2003 à $1 486 000 en 2005 ($803 000 en 2004). Ces ressources sont essentiellement utilisées sous forme d’in-tervention dans les Etats membres, avec un accent particulier sur le renforcement de capacités institutionnelles et techni-ques.
La Division statistique compte présentement 6 statisticiens professionnels (dont 3 permanents) et 2 assistants. Deux du personnel professionnel sont des spécialistes des comptes nationaux et des statistiques du commerce extérieur, respecti-vement.
Comme on pourrait le voir, les ressources extérieures représentent ces dernières années une part importante des ressources dédiées à la statistique par le Secrétariat Exécutif. Ceci témoigne de l’intérêt grandissant de nos partenaires dans le pro-gramme statistique de la CEDEAO. Mais dans le même temps, la nécessité de soutenir et consolider les capacités mises en place ainsi que la stratégie pour ce faire deviennent une préoccupation de première importance. En fait, ce sera l’un des dé-fis que le Secrétariat Exécutif devra traduire sur le plan politique et budgétaire dans les années à venir.
Les principaux partenaires dans le domaine de la statistique sont pour l’heure la Banque Africaine de Développement (BAD), la Commission Economique pour l’Afrique (CEA), la Commission Européenne, la Division Statistique des Nations Unies (DSNU), la France et PARIS21. L’Observatoire Economique et Statistique d’Afrique Subsaharienne (AFRISTAT) est constamment sollicité par la CEDEAO pour son appui technique, notamment dans le domaine des comptes nationaux, des indices de prix à la consommation (IPC) et des capacités de diffusion des données. Par ailleurs, dans la mesure où la Com-munauté comporte d’autres regroupements sous-régionaux, la coordination statistique s’est vu accorder une importance notable dans l’exécution du programme statistique. Ainsi devient-elle une conditionnalité dans les négociations des assis-tances avec les partenaires statistiques.
3. Du renforcement des capacités dans les Etats membres
De par sa nature transversale, le renforcement des capacités est intégré à la plupart des composantes des grandes actions entreprises par le Secrétariat Exécutif pour le développement statistique en Afrique de l’Ouest. Il s’agit notamment des ac-tivités suivantes : l’harmonisation des comptes nationaux et des IPC, les statistiques du commerce extérieur, la coordination statistique, les stratégies de développement de la statistique, le suivi des indicateurs de pauvreté et des Objectifs de Déve-loppement du Millénaire (ODM), la connectivité, et, d’une façon générale, la diffusion de données.
3.1 Harmonisation des comptes nationaux et des IPC
Sur la base du rapport d’une étude réalisée en 2001 avec l’assistance technique d’AFRISTAT, un plan d’action pour l’har-monisation des comptes nationaux a été adopté en janvier 2004 par les instances de la Communauté. L’objectif de ce plan d’action est à court terme d’harmoniser le contenu et la présentation des PIB à travers des méthodologies convergentes, afin de répondre aux besoins urgents de la surveillance multilatérale des politiques macroéconomiques des Etats membres, et à moyen terme de mettre en œuvre le Système de Comptabilité Nationale de 1993 (SCN 93) dans les Etats membres de la Communauté. Les rapprochements méthodologiques ont été donc opérés de façon à s’approcher autant que possible des recommandations du SCN93. Pour les besoins de la présentation uniforme des comptes, une plateforme commune de la CEDEAO a été adoptée en décembre 2003.
Communauté Economique des Etats de l’Afrique de l’Ouest : Activités statistiques du Secrétariat Exécutif de la CEDEAO relatives au renforcement
des capacités des Etats membres
AFDB-70-139.indd 121 11/1/05 8:19:10 PM

African Development Bank 2005122
Dans le souci de renforcer les capacités nationales en matière de comptabilité nationale et d’assurer la pérennité des tra-vaux, les fonctionnaires en charge de l’élaboration des comptes nationaux et des prévisions macroéconomiques ont été ap-pelés à servir eux-mêmes comme consultants pour la traduction des comptes dans la plateforme commune, sous la supervi-sion des experts d’AFRISTAT, et à travers des missions d’appui et d’ateliers organisés à cet effet. Une attention particulière a été accordée aux pays à très faible système statistique. Dans ce cadre, des missions coordonnées des experts du Secréta-riat Exécutif et d’AFRISTAT ont été envoyées dans les pays concernés pour rebâtir les comptes et mettre en place des capa-cités nationales. Cet exercice a pris – et continue de prendre – la forme à la fois de formation et d’équipement des struc-tures nationales. Le cadre des PIB harmonisés (plus comparables), une fois adopté, fera l’objet en 2006 de vulgarisation et de formation aux niveaux national et régional.
Comme pour les comptes nationaux, un plan d’action pour l’harmonisation des IPC dans les Etats membres de la CEDEAO a été adopté en janvier 2004. Dans ce domaine également, et conformément aux besoins pressants du fonctionnement du mécanisme de surveillance multilatérale et aux exigences méthodologiques en la matière, le plan d’action a consisté égale-ment en des actions de court et de long terme. Dans le court terme, il s’agit de corriger en contenu et en présentation, sui-vant des méthodes convergentes, les IPC couramment calculés, tandis que dans le moyen terme sera mis en place un pro-gramme d’harmonisation véritable, fondé sur des données de base consistantes.
Les services des fonctionnaires en charge de l’élaboration des IPC ont été utilisés pour la traduction des IPC dans la plate-forme commune, sous la supervision et l’assistance technique des experts d’AFRISTAT. Cet exercice prend la forme à la fois de formation et d’équipement des structures nationales, avec une attention particulière aux pays à très faible système sta-tistique. Le cadre des PIB harmonisés (plus comparables), une fois adopté, fera l’objet en 2006 de vulgarisation et de for-mation aux niveaux national et régional.
3.2 Statistiques du commerce extérieur
Pour des raisons évidentes, les statistiques du commerce extérieur ont depuis longtemps retenu l’attention des autorités de la Communauté, accompagnant ainsi les programmes prioritaires d’intégration commerciale. Ainsi, les statistiques du com-merce extérieur des pays membres sont aujourd’hui encore élaborées sur la base d’un cadre douanier et statistique adopté dans les années 1980. Le SYstème DOuaNIer Automatisé (SYDONIA) et le logiciel EUROTRACE avaient à cet effet été dé-veloppés avec l’assistance de la CNUCED et de la Commission européenne, et constituent encore les outils généralisés de traitement des documents douaniers et des données statistiques du commerce extérieur, respectivement. De plus, un mé-canisme permanent de maintenance et formation, constitué d’experts informaticiens et de statisticiens spécialisés, a égale-ment été mis en place par le Secrétariat Exécutif. Des versions évoluées de ces divers outils sont en cours d’installation dans les Etats membres. Une mise à jour du cadre douanier et statistique vient d’être entreprise ; le nouveau cadre sera soumis pour adoption courant 2005.
3.3 Coordination statistique
En sus du cadre régulier de concertation des Directeurs de statistique de la CEDEAO (sous la forme de réunions bi-annuel-les), la coordination statistique aux niveaux national et communautaire est au centre du programme statistique régional 2006-2010. Elle est associée au renforcement du cadre juridique des activités statistiques, ainsi qu’à la formulation ou la
Akou Adjogou
AFDB-70-139.indd 122 11/1/05 8:19:10 PM

African Development Bank 2005 123
mise en œuvre de stratégies nationales de développement de la statistique. A cet effet, le Secrétariat Exécutif développe une coopération active avec PARIS21. Des activités de même nature figurent également au programme des actions exé-cutées par le projet d’assistance statistique des Nations, notamment sous forme d’ateliers régionaux de planification des activités statistiques et des relations utilisateurs-producteurs, ainsi que de diffusion des données. D’autres axes du même projet concernent la connectivité des services nationaux de statistique. Mais la connectivité constitue aussi le domaine d’in-tervention d’autres partenaires (projet ECOSTAT de la Commission Européenne) et fait partie des priorités du Secrétariat Exécutif, tout comme d’ailleurs les capacités de diffusion de données, assortie d’un environnement adéquat de promotion de bases de données adaptées à l’environnement spécifique des Etats membres, en utilisant en particulier le cadre d’une assistance de la France.
Suivi des indicateurs de pauvreté et des Objectifs de Développement du Millénaire (ODM)
Le Secrétariat Exécutif réalisera courant 2006 une publication régionale sur les statistiques de pauvreté, avec l’assistance de la Division Statistique des Nations Unies. Elle offrira l’occasion de faire le point des activités relatives au suivi des indi-cateurs de pauvreté en Afrique de l’Ouest et examinera les mécanismes possibles de leur amélioration et de leur harmoni-sation. A cet effet, elle s’appuiera sur le manuel des statistiques de pauvreté que la Division Statistique des Nations Unies est en train de finaliser. Les statistiques de l’environnement feront aussi l’objet d’une publication similaire, pendant que des plans d’actions sont en cours d’élaboration pour la promotion des statistiques de l’environnement et de l’énergie. En vue de la formulation de ces divers plans d’action, des ateliers régionaux sur les statistiques de pauvreté, de l’environnement et de l’énergie ont été organisés dans le cadre de l’assistance statistique des Nations Unies.
Les systèmes statistiques nationaux affectés par la guerre
Dans le souci de relancer les activités statistiques des pays affectés par la guerre, notamment le Libéria et la Sierra Léone, le Secrétariat Exécutif a entrepris la formulation de programmes nationaux de développement statistique dans ces pays. Cette action a été initiée dans le cadre du projet ECOSTAT. L’exécution de ces programmes sera suivie dans le cadre du pro-gramme statistique régional.
4. Conclusion
De ce qui précède, il transparaît qu’un certain nombre de chantiers ont été initiés pour le développement statistique de la région, notamment en ce qui concerne les capacités de diffusion de données ainsi que l’harmonisation et le coordination statistiques. Ces efforts ont cependant besoin d’être soutenus et consolidés. Le Secrétariat Exécutif est conscient de la né-cessité d’accroître son financement propre, mais en même temps, il lance un appel solennel à la communauté des partenai-res afin qu’elle accompagne le processus de façon adéquate et conséquente.
Communauté Economique des Etats de l’Afrique de l’Ouest : Activités statistiques du Secrétariat Exécutif de la CEDEAO relatives au renforcement
des capacités des Etats membres
AFDB-70-139.indd 123 11/1/05 8:19:10 PM
African Development Bank 2005124
1: Director, Institute of Statistics and Applied Economics, Makerere University, P.O. Box 7062, Kampala, Uganda.
1. Introduction
The Institute of Statistics and Applied Economics (ISAE) was established as an autonomous institute within the legal frame-work of Makerere University in July 1969 to provide facilities for the high level professional training of personnel in statis-tics and applied economics to meet the needs of Uganda, as well as those of other English speaking countries in the con-text of the formulation and implementation of national plans for economic and social development. The Government of Uganda (GoU) is the main source of funding through monthly subventions to the University. Other resources are got from the privately sponsored students.
Since 1969, the Institute has trained a number of Statisticians from English-speaking African countries up to postgradu-ate professional level. Some of our graduates hold key and professionally important posts in the statistical services of their counties. Others have joined regional and international organizations.
Vision
The vision of ISAE is to be an internationally recognized center of excellence in statistics and applied economics with capac-ity for training, research and information technology.
Mission
The mission of ISAE is to produce high quality professionals in statistics, applied economics, population studies and infor-mation technology so as to spearhead informed policy making both for public and private sectors through training, research and community service.
2. Management of the Institute of Statistics
The Institute of Statistics and Applied Economics is managed by the Director who is the Secretary of the Advisory Council whose membership consists of the Vice Chancellor of Makerere University as Chairperson, representatives of governments of Botswana, Kenya, Lesotho, Malawi, Namibia, South Africa, Swaziland, Tanzania, Zambia, Zanzibar and Zimbabwe, The
Statistical Training at the Instituteof Statistics and Applied Economics,
Makerere University
Jonathan Odwee1
AFDB-70-139.indd 124 11/1/05 8:19:10 PM

African Development Bank 2005 125
Academic Registrar and the Deans of Faculties of Science and Social Sciences of Makerere University. The Advisory Council recommends policies governing the operation of ISAE to the University Senate or to the University Council.
The Board of Studies, chaired by the Director, oversees all the academic business of the Institute and reports to the Univer-sity Senate. The Director is assisted by the Deputy Director and the Heads of Departments. The Institute runs under three academic departments; the Department of Statistical Methods, Department of Planning and Applied Statistics and Depart-ment of Population Studies.
3. Facilities and Staffing at the Institute
The Institute operates three Computer Laboratories.1. Undergraduate Laboratory2. Postgraduate Laboratory3. Ph.D Laboratory
The facilities for the Ph.D Laboratory were offered by the School of Graduate Studies and are used in training the Ph.D stu-dents in data management, processing and analysis.
ISAE also has a Library with six sections namely; Demography, Statistics, Computing, Reference, Book Bank and Dissertations
The Institute is serviced by the Department of Mathematics, Faculty of Science and Faculty of Economics and Management. On ground, it has a total of 43 members of academic staff and 24 administrative and support staff (Table 1). The number of academic members of staff is inadequate but the University has already advertised for some posts which will somewhat ease the work load.
Table 1: Staff of ISAE
Rank Number
Professor 1
Associate Professor 1
Senior Lecturers 6
Lecturers 14
Assistant Lecturers 4
Teaching Assistants 5
Part time Lecturers 12
Administrative/Support staff 24
Statistical Training at the Institute of Statistics and Applied Economics, Makerere University
AFDB-70-139.indd 125 11/1/05 8:19:10 PM

African Development Bank 2005126
4. Academic programmes
From the time of establishment, the Institute has grown both in the scope and depth of the programmes it offers and the services it offers to the community.
The Institute runs five undergraduate programmes and nine postgraduate programmes. All bachelor programmes have a duration of three years and except for Bachelor of Statistics, have both Day and Evening components. The postgraduate di-ploma programmes are run for one year and the masters are run for two years. All Ph.D programmes take at least three and half years and a maximum of five years.
Undergraduate programmes
1. Bachelor of Statistics2. Bachelor of Science in Actuarial Science3. Bachelor of Science in Quantitative Economics4. Bachelor of Science in Population Studies5. Bachelor of Business Statistics
Postgraduate programmes
1. Postgraduate Diploma in Demography2. Postgraduate Diploma in Statistics3. Master of Statistics4. Master of Science in Quantitative Economics5. Master of Arts in Demography6. Master of Arts in Population and Development7. Master of Science in Population and Reproduction Health8. Ph.D in Population Studies9. Ph.D in Statistics
Master of Science in Population Studies is already approved by Makerere University Council and will commence during the academic year 2006/2007.
Short courses
The following are the short courses:1. Data Handling, Biostatistics and Use of Stata for Windows funded by DBL-Institute of Health Research and Develop-
ment2. Economic Statistics and National Accounts3. Monitoring and Evaluation of Population Programs
Jonathan Odwee
AFDB-70-139.indd 126 11/1/05 8:19:11 PM

African Development Bank 2005 127
4. A Practical Approach to Data analysis Using Stata/SPSS5. Statistics for Ph.D students (service course)
5. Research
The Institute has carried out a number of research independently or in collaboration with other organizations. A number of members of staff also do consultancies for governments, national or international organizations, as individuals or in col-laboration with consultants.
6. Student Numbers
ISAE has expanded from 60 students at the time of its establishment in 1969 to the current 1,792 students in 2005/2006 of this 1,520 are registered in undergraduate programmes (Table 2) and 272 in postgraduate programme (Table 3) exclud-ing Ph.D students. Currently we have 7 Ph.D candidates.
Statistical Training at the Institute of Statistics and Applied Economics, Makerere University
AFDB-70-139.indd 127 11/1/05 8:19:11 PM

African Development Bank 2005128
Table 2: Student enrollment by undergraduate programmes
GOVT PRIVATE DAY PRIVATE EVE. TOTAL
Male Female Male Female Male Female
FIRST YEAR
BPS 6 5 57 33 44 30 174
B.STAT 54 19 33 20 - - 126
BSC.QE 12 5 24 21 55 29 146
BSC.AS 4 3 13 3 14 1 38
BBS 10 4 33 10 19 9 84
TOTAL 86 36 160 87 132 69 569
TOTAL 122 247 201 570
SECOND YEAR
BPS 22 10 34 44 28 46 184
B.STAT 57 14 13 11 - - 95
BSC.QE 35 21 11 6 46 18 137
BSC.AS 8 2 22 7 7 2 48
BBS - - 19 7 22 08 66
TOTAL 122 47 99 75 103 74 520
TOTAL 169 174 177 520
THIRD YEAR
BPS 10 23 35 31 28 38 165
B.STAT 57 22 9 7 - - 95
BSC.QE 57 24 6 4 36 21 148
BSC.AS 15 0 4 2 2 0 23
TOTAL 139 69 54 44 66 59 431
TOTAL 208 98 125 431
TOTAL 347 152 312 206 301 202 1520
GRAND TOTAL 499 518 503 1520
Jonathan Odwee
AFDB-70-139.indd 128 11/1/05 8:19:11 PM

African Development Bank 2005 129
Statistical Training at the Institute of Statistics and Applied Economics, Makerere University
B.STAT. Bachelor of StatisticsBSC.AS Bachelor of Science in Actuarial ScienceBSC.QE Bachelor of Science in Quantitative EconomicsBPS Bachelor of Science in Population StudiesBBS Bachelor of Business Statistics
Table 3: Student enrollment by postgraduate programmes
PRIVATE DAY PRIVATE EVE. TOTAL
Male Female Male Female
FIRST PART
DIP DEMO 3 1 - - 4
DIP STAT 9 3 - - 12
MSTAT 27 8 - - 35
MA DEMO 10 6 - - 16
MA PDV 11 13 - - 24
MSC PRH 37 26 - - 63
MSC QE 14 3 - - 17
TOTAL
PART I
SECOND PART
M.STAT 17 2 - - 19
MA DEMO 14 24 - - 38
MA PDV 21 19 - - 40
MSC PRH 27 8 - - 35
MSC QE 17 8 15 3 43
TOTAL
PART II
GRAND TOTAL 272 18 272
DIP. DEMO. Postgraduate Diploma in DemographyDIP. STAT. Postgraduate Diploma in StatisticsM.STAT. Master of StatisticsMSC. QE Master of Science in Quantitative Economics
MA.DEMO. Master of Arts in DemographyMA.PDV Master of Arts in Population and DevelopmentMSC PRH Master of Science in Population and
Reproduction Health
AFDB-70-139.indd 129 11/1/05 8:19:11 PM
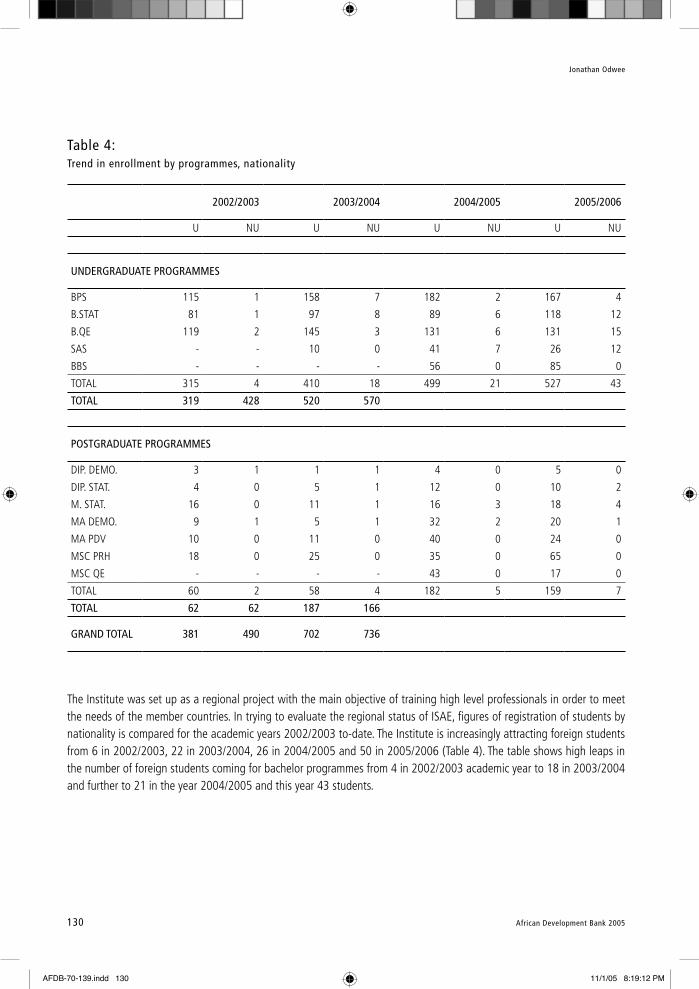
African Development Bank 2005130
Table 4: Trend in enrollment by programmes, nationality
2002/2003 2003/2004 2004/2005 2005/2006
U NU U NU U NU U NU
UNDERGRADUATE PROGRAMMES
BPS 115 1 158 7 182 2 167 4
B.STAT 81 1 97 8 89 6 118 12
B.QE 119 2 145 3 131 6 131 15
SAS - - 10 0 41 7 26 12
BBS - - - - 56 0 85 0
TOTAL 315 4 410 18 499 21 527 43
TOTAL 319 428 520 570
POSTGRADUATE PROGRAMMES
DIP. DEMO. 3 1 1 1 4 0 5 0
DIP. STAT. 4 0 5 1 12 0 10 2
M. STAT. 16 0 11 1 16 3 18 4
MA DEMO. 9 1 5 1 32 2 20 1
MA PDV 10 0 11 0 40 0 24 0
MSC PRH 18 0 25 0 35 0 65 0
MSC QE - - - - 43 0 17 0
TOTAL 60 2 58 4 182 5 159 7
TOTAL 62 62 187 166
GRAND TOTAL 381 490 702 736
Jonathan Odwee
The Institute was set up as a regional project with the main objective of training high level professionals in order to meet the needs of the member countries. In trying to evaluate the regional status of ISAE, figures of registration of students by nationality is compared for the academic years 2002/2003 to-date. The Institute is increasingly attracting foreign students from 6 in 2002/2003, 22 in 2003/2004, 26 in 2004/2005 and 50 in 2005/2006 (Table 4). The table shows high leaps in the number of foreign students coming for bachelor programmes from 4 in 2002/2003 academic year to 18 in 2003/2004 and further to 21 in the year 2004/2005 and this year 43 students.
AFDB-70-139.indd 130 11/1/05 8:19:12 PM

African Development Bank 2005 131
Statistical Training at the Institute of Statistics and Applied Economics, Makerere University
7. Planned Activities
Two programmes (Bachelor of Science in Actuarial Science and Bachelor of Business Statistics) have no postgraduate compo-nents for more specialized training. This, the Institute, is embarking in writing the proposal for consideration by Makerere Senate and subsequent approval by University Council.
To improve in the quality of service to the University student, the University has embarked on training of staff. A number of staff members have registered for further studies in Makerere University or outside Uganda. However, because of policy of holding a Ph.D to be appointed a Lecturer, the staff development funds at Makerere University had been overstretched. The candidates from ISAE have, therefore, not benefited as much we expected.
8. Challenges
ISAE has experienced insufficient space for a number of years now. This is caused by non-completion of Statistics Building which has remained at slab level for the last 30 years. This has led to lack of space lecture rooms, computer laboratories, Library, offices and stores.
Another critical issue is insufficient staffing establishment caused by the freezing of appointment which affected Makerere University in general.
The Institute will embark on reviewing its five year strategic plan.
AFDB-70-139.indd 131 11/1/05 8:19:12 PM

African Development Bank 2005132
The African Statistical Journal has been established to promote the understanding of statistical development in the African region. It will focus on issues related to official statistics as well as application of statistical methodologies to solve practi-cal problems of general interest to applied statisticians. Of particular interest will be exposition of: how statistics can help to illuminate development and public policy issues like poverty, gender, environment, energy, HIV/AIDS, etc; development of statistical literacy; tracking national and regional development agenda; development of statistical capacities and effec-tive national statistical systems; and the development of sectoral statistics e.g. educational statistics, health statistics, ag-ricultural statistics, etc.
In addition to individual academic and practicing statisticians, the Journal should be of great interest to a number of institu-tions in the region including National Statistical Offices, Central Banks, research and training institutions and sub-regional economic groupings, and international development agencies.
The Journal will serve as a research outlet and information sharing publication among statisticians and users of statistical information mainly in the African region. It will publish, among other things:
• articles of an expository or review nature that demonstrate the vital role of statistics to society rather than present technical materials,
• articles on statistical methodologies with special emphasis on applications,• articles about good practices and lessons learned from the region,• opinions on issues of general interest to the statistical community and users of statistical information in the African region,• notices and announcements on upcoming events, conferences, calls for papers, and• recent statistical developments and anything that may be of interest to the statistical community in the region.
The papers which need not contain original material, should be of general interest to a wide section of professional stat-isticians in the region.
Notes to authors
Submission
Manuscripts in English or French should be sent to the Chairpersons, Editorial Board. The papers must not have been sub-mitted elsewhere for publication. Authors are encouraged to send their manuscripts as MS Word file attachment by e-mail to The African Statistical Journal at [email protected] and [email protected]
Title
The title should be brief and specific. The title page should include the title, the author’s name, affiliation and address. The affiliation and address should be given as a footnote on the title page. If the manuscript is coauthored, the same informa-tion should be given for the coauthor(s).
Editorial Policy
AFDB-70-139.indd 132 11/1/05 8:19:12 PM

African Development Bank 2005 133
Abstract, Key Words and Acknowledgements
A short summary of about 150 words must be included at the beginning of the manuscript together with up to 6 key words used in the manuscript. The key words should not repeat words used in the title. Acknowledgements, if any, should be in-serted at the bottom of the title page.
Sections
Sections should be numbered. Subsections may be used.
Tables and Figures
Tables and figures should be numbered and given a title. These should be referred to in the text by number, not by page or indications such as “below” or “above”.
Equations
Any equations in the paper should be numbered. The numbers should be placed to the right of the equation.
References
A list of references should be given at the end of the paper. The references should be arranged alphabetically, and for the same author chronologically. The references should give author’s name and year of publication, title and details of the pub-lication – name of Journal. Use a,b,c, etc to separate publications of the same author in the same year.
Examples
Kish, L. (1988a). Multipurpose Sample Designs, Survey Methodology, 14, 19-32.
Kish, L. (1988b). A Taxonomy of Elusive Populations, Proceedings of the Section on Survey Research Methods, American Sta-tistical Association, 44-46.
Herzog, A.R. and Dielman, L. (1985). Age Differences in response Accuracy for Factual Survey Questions, Journal of Geron-tology, 40, 350-367.
In the text, the author’s surnames only should be given, followed by the year of publication in parentheses e.g. Kish (1988a). For three or more authors, only the first surname should be given, followed by et al. Abbreviations ibid, opt. cit. should not be used.
Editorial Policy
AFDB-70-139.indd 133 11/1/05 8:19:12 PM

African Development Bank 2005134
Acknowledgements
The Editorial Board would like to express its appreciation to all authors who submitted papers for publication in the journal and to the following people who reviewed the papers that are printed in this issue of the journal:
1. Dr. Dimitri Sanga, Senior Statistician, Social and Economic Policy Division, United Nations Economic Commission for Af-rica (UNECA), Addis Ababa, Ethiopia (has since become a member of the Editorial Board)
2. Mr. Guest Charumbira, Chief Technical Advisor (UNDP), Office of Chief Government Statistician,Zanzibar3. Dr. Fred Vogel, Manager, International Comparison Program (ICP) Global Office, World Bank, Washington, USA4. Mr. Colin Scot, Rural Development Consultant - Census and Surveys, Monitoring and Evaluation and Management In-
formation Systems, MD Scotts Agriculture Consultancy ltd. Currently FAO advisor on the Agriculture Census, National Bureau of Statistics, Tanzania
5. Mr. Graham Eele, Senior Statistician, World Bank, Washington, USA6. Prof. Prasada Rao, Director, Centre for Efficiency and Productivity Analysis, School of Economics, University of
Queensland, Brisbane, Australia7. Ms. Mary Strode, Senior Statistician, Oxford Policy Management (OPM), U.K8. Dr. Chris Scot, Consultant and Research Affiliate of the Suntory International Centre for Economics and Related Disci-
plines (STICERD), London School of Economics and Political Science, London, U.K
In addition, the Editorial Board would also like to express his appreciation to the Uganda Bureau of Statistics and the Uganda Statistical Society for the importance role the played in the inception of the journal.
AFDB-70-139.indd 134 11/1/05 8:19:12 PM
African Development Bank 2005 135
Acknowledgements
AFDB-70-139.indd 135 11/1/05 8:19:12 PM

African Development Bank 2005136
Announcements
Prof. Ben Kiregyera received the 2005 Prof. P.C. Mahalanobis International Ward in Statistics
Prof. Ben Kiregyera, Chairman of Board of Directors, Uganda Bureau of Statistics and the Co-Chair of the Editorial Board of The African Statistical Journal received a coveted and prestigious international statistics award, the 2005 Prof. P.C. Mahala-nobis International Ward in Statistics. This award was instituted by the Government of India to serve two purposes of keep-ing the memory of Prof. P.C. Mahalanobis, an eminent Indian Statistician, alive and of recognizing and stimulating progress in statistics in developing countries. The award is given to a statistician from a developing country in recognition of his/her lifetime achievement in statistics and promotion of best statistical practice. The selection for the award is made by the Ma-halanobis Committee of the International Statistical Institute. Prof. Kiregyera is the second recipient of the award. The award was conferred by Mr. Oscar Fernandes, the Minister of State for Statistics and Programme Implementation, Government of India, on 11 April 2005 during the 55th Session of the International Statistical Institute held in Sydney, Australia. The pic-ture shows Prof. Kiregyera receiving the award from Minister Fernandes.
AFDB-70-139.indd 136 11/1/05 8:19:14 PM

African Development Bank 2005 137
Upcoming Events
February 2006, Addis Ababa
Meeting of the Forum for Statistical Development in Africa (FASDEV) organized by ADB, ECA, Paris21 and the World Bank to review the Reference Framework for Statistical Development in Africa currently under preparation.The meeting will bring together Heads of National Statistical Offices from all African Countries; senior officials representing multilateral & bilateral agencies, regional and sub-regional organizations as well as other stakeholders involved in statistical work in Africa.
February 2006
ICP sub-regional workshop on data quality and validation for 20 French speaking countries jointly organized by AFRISTAT and the African Development Bank.
ICP sub-regional workshop on data quality and validation for 10 COMESA member countries jointly organized by COMESA Secretariat and the African Development Bank.
ICP sub-regional workshop on data quality and validation for 13 SADC member countries jointly organized by SADC Sec-retariat and the African Development Bank.
ICP sub-regional workshop on data quality and validation for 5 ECOWAS member countries jointly organized by ECOWAS Secretariat and the African Development Bank.
ICP workshop on data quality and validation for Algeria, Morocco and Tunisia organized by the African Development Bank.The main objective of each sub-regional workshop is to review the progress made in the implementation of ICP price sur-veys, edit checks price data, estimate purchasing power parities for detailed groups of goods and services, and analyze re-lated quality indicators.
April 2006
ICP sub-regional workshop on quality of GDP estimates and breakdown for 20 French speaking countries jointly organized by AFRISTAT and the African Development Bank.
ICP sub-regional workshop on quality of GDP estimates and breakdown for 10 COMESA member countries jointly orga-nized by COMESA Secretariat and the African Development Bank.
ICP sub-regional workshop on quality of GDP estimates and breakdown for 13 SADC member countries jointly organized by SADC Secretariat and the African Development Bank.ICP sub-regional workshop on quality of GDP estimates and breakdown for 5 ECOWAS member countries jointly organized by ECOWAS Secretariat and the African Development Bank.
Announcements
AFDB-70-139.indd 137 11/1/05 8:19:14 PM

African Development Bank 2005138
ICP sub-regional workshop on quality of GDP estimates and breakdown for Algeria, Morocco and Tunisia organized by the African Development Bank. The main objective of each sub-regional workshop is to review methodologies used by the countries in the compilation of detailed GDP estimates, address problems encountered in applying the ICP-Africa 201 basic heading classification and share best practices.
July-August 2006
ICP regional workshop on data quality, validation and analysis for 51 African countries organized by the African Develop-ment Bank.The main objective of the workshop is to review price and national accounts data submitted by countries participating in the ICP with a view to finalizing the computation and analysis of PPPs for the reference year 2005.
AFDB-70-139.indd 138 11/1/05 8:19:14 PM

African Development Bank 2005 139
Announcements
AFDB-70-139.indd 139 11/1/05 8:19:14 PM

African Development Bank 2005140
Other publications of the Development Research Department are:
Selected Statistics on African Countries(Annual)
Gender, Poverty and Environmental Indicators (Annual)
Compendium of Statistics on Bank Group Operations (Annual)
ADBStatistics Pocket Book(Annual)
Wall Chart – Africa : Progress Towards Attaining the Millennium Development Goals(Annual)
African Development Report(Annual)
African Economic Outlook(Annual)
African Development Review(Semi-annual)
Economic Research Papers
Copies of these publications can be obtained from the following address:
Development Research DepartmentAfrican Development Bank GroupBP 323, 1002 Tunis BelvedèreTunis, TunisiaTel : (216) 71 10 3216 / 2848 / 2876Fax : (216) 71 10 3779 / 3743Email : [email protected] Site:http://www.afdb.org
AFDB-70-139.indd 140 11/1/05 8:19:14 PM

African Development Bank 2005 141
Announcements
Autres publications du département de la recherche sur le développement:
Statistiques choisies sur les pays membres regionaux(Annuel)
Indicateurs du genre, la pauvreté et l’environnement sur les pays africains(Annuel)
Compendium de statistiques sur les opérations du Groupe de la banque (Annuel)
Livre de poche des statistiques de la BAD(Annuel)
Poster - Afrique: Progrès vers la réalisation des objectifs du millénaire pour le développement(Annuel)
Rapport sur le développement en Afrique(Annuel)
Perspectives économiques africaines(Annuel)
Revue africaine de développement(Semestriel)
Etudes et recherches économiques
Pour obtenir des copies de ces publications, prière prendre contact avec:
Département de la recherche sur le développementGroupe de la banque africaine de développementBP 323, 1002 Tunis BelvedèreTunis, TunisieTél : (216) 71 10 3216 / 2848 / 2876Fax : (216) 71 10 3779 / 3743Email : [email protected] Web :http://www.afdb.org
AFDB-70-139.indd 141 11/1/05 8:19:14 PM


![Statistical - [email protected] - African Virtual University](https://img.dokumen.tips/doc/110x75/6203986eda24ad121e4b3c76/statistical-emailprotected-african-virtual-university.jpg)

