Embed Size (px)
Citation preview

White paper
Africa Payments: Insights into African transaction flows

2
Africa Payments: Insights into African transaction flows
Foreword 3
Executive summary 4
Introduction & economic context 6
Our approach 8
Chapter 1: 2017 trends 9
Chapter 2: What is driving change in cross-border transaction flows? 15
Chapter 3: What will change in African cross-border banking? 20
Conclusion 23
Views from Africa – external contributions Interoperability: the next step for mobile money in Africa
Bill & Melinda Gates Foundation 24
Financial Crime Compliance in Africa Ecobank 25
Enabling economic development in Africa – do payment systems matter? BankservAfrica 26
Facilitating inter-regional payment flows South African Reserve Bank 27
Renminbi: Africa’s long-term trading currency? Standard Chartered
28
Appendix: Regional Initiatives in Africa 29
SWIFT in Africa 39
The authors would like to thank the following for their support in producing the paper:
Dilwonberish Aberra, Financial Services for the Poor, Bill & Melinda Gates Foundation
Idrissa Diop, Head of Group Compliance, Ecobank
Chris Hamilton, CEO, BankservAfrica
Razia Khan, Chief Economist for Africa, Standard Chartered Bank
Tim Masela, Head of payments department, South African Reserve Bank
Kamal Mokdad, Director General, Banque Centrale Populaire
Moono Mupotola, Director of Regional Integration, African Development Bank
John Ndunguru, Financial Services for the Poor, Bill & Melinda Gates Foundation
Bleming Nekati, Chief Trade Finance Officer, African Development Bank
Philip Panaino, Regional Head, Transaction Banking, Africa & Middle East, Standard Chartered Bank
Dr. Amediku Settor, Head of the Payments Systems Department, Bank of Ghana
Contents

3
Africa Payments: Insights into African transaction flowsForeword:
by Moono Mupotola, Director of Regional Integration, African Development Bank
Africa is still rising. Despite challenging global economic conditions over the last five years, African economies have shown increased resilience. Real output is growing steadily and faster than projected.
The continent’s strong economic growth over the past two decades was not met by accelerated industrialisation. On average, African industry generates $700 of GDP per capita, less than a third compared to Latin America ($2,500) and barely a fifth in comparison to East Asia ($3,400). Low-tech products and unprocessed natural resources make up for more than 80% of Africa’s exports in many of the continent’s largest economies. This leaves them vulnerable to external shocks like fluctuations in commodity prices, decreasing external demand and extreme weather conditions. Structural economic transformations and diversification can be truly transformative and key drivers of sustained, inclusive economic growth. However, diversification remains timid in many African countries. Nations like Mauritius are making progress, shifting from a sugar-dependent economy to a regional financial services hub. Botswana has also embarked on a bold journey to diversify its economy by positioning itself as a diamond cutting, polishing and marketing centre. Rwanda is also winning on the diversification front by slowly transitioning into an innovation and technology hub, while Ethiopia is poised to become a manufacturing hub. However, the diversification and transformation challenge remains for many others.
This is why the African Development Bank has supported similar initiatives across the continent, including the East African Payment System and the West African Monetary Zone’s project to link payment systems. Likewise, in support of the CFTA, Afreximbank is working on establishing a Pan-African Payment and Settlement Platform (PAPSP), which will not only lower transaction costs but also facilitate informal cross-border trade, currently estimated at $93 billion.
Another interesting trend is the rise of African multinationals investing into other African countries. At the forefront are African financial institutions. Today, Ecobank has a footprint in 24 countries while Moroccan banks are now present in 16 countries, up from just three in 2005. This is welcome news. Indeed, banks support about one-third of total intra- African trade.
More than ever before, Africa needs to accelerate intra-regional trade and bring down market barriers. Papers such as this SWIFT report provide invaluable insight for policy makers, banks and other financial institutions. The study is a compelling guide that will help stakeholders better understand the movement of financial flows and goods. It is my hope that the report will assist in developing the right policies to connect the continent’s markets, deepen regional integration and adopt reforms that enhance competitiveness.
Countries with more advanced manufacturing sectors hold a potential for growth if they can access a larger less-fragmented African market. The signing of the landmark continental Free Trade area (CFTA) by 44 countries in Kigali in March 2018 offers hope for increased intra-African trade. Similarly, the African Union’s Agenda 2063 calls for increased intra-African trade from the current 16% to over 25% by 2025.
However, while the free flow of goods and services is crucial in boosting intra-regional trade, the movement of financial flows across borders is equally important. It has been five years since SWIFT addressed the issue of movement of financial flows in Africa and it is still clear that foreign currency remains the preferred payment method when trading across Africa and globally. However, recent data released by SWIFT indicates a shift towards intra-Africa clearing and trade, and a rise in the use of local currencies.
While the US dollar still dominates, it is releasing its hold. 51.1% of transactions from Africa were denominated in dollars in 2013 compared to 45.1% in 2017. A significant increase can be seen in the use of local currencies, especially the West African franc and South African rand. Payments in franc increased from 4.4% in 2013 to 7.3% in 2017 while transactions in rand increased from 6.3% to 7.2%.
The Central Bank of the West African States and the Southern African Development Community’s Integrated Regional Electronic Settlement System have played a key role in supporting this. The value that regional harmonisation plays in promoting sustainable economic development is undeniable.
4
Africa Payments: Insights into African transaction flowsExecutive
summary
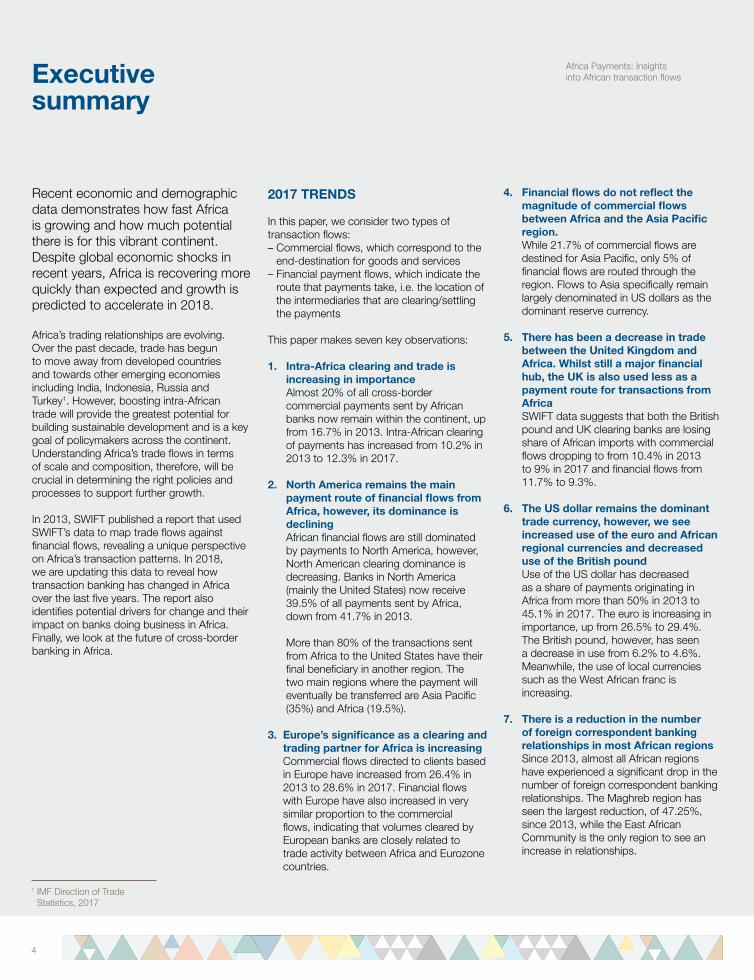
Recent economic and demographic data demonstrates how fast Africa is growing and how much potential there is for this vibrant continent. Despite global economic shocks in recent years, Africa is recovering more quickly than expected and growth is predicted to accelerate in 2018.
Africa’s trading relationships are evolving. Over the past decade, trade has begun to move away from developed countries and towards other emerging economies including India, Indonesia, Russia and Turkey1. However, boosting intra-African trade will provide the greatest potential for building sustainable development and is a key goal of policymakers across the continent. Understanding Africa’s trade flows in terms of scale and composition, therefore, will be crucial in determining the right policies and processes to support further growth.
In 2013, SWIFT published a report that used SWIFT’s data to map trade flows against financial flows, revealing a unique perspective on Africa’s transaction patterns. In 2018, we are updating this data to reveal how transaction banking has changed in Africa over the last five years. The report also identifies potential drivers for change and their impact on banks doing business in Africa. Finally, we look at the future of cross-border banking in Africa.
4. Financial flows do not reflect the magnitude of commercial flows between Africa and the Asia Pacific region. While 21.7% of commercial flows are destined for Asia Pacific, only 5% of financial flows are routed through the region. Flows to Asia specifically remain largely denominated in US dollars as the dominant reserve currency.
5. There has been a decrease in trade between the United Kingdom and Africa. Whilst still a major financial hub, the UK is also used less as a payment route for transactions from Africa SWIFT data suggests that both the British pound and UK clearing banks are losing share of African imports with commercial flows dropping to from 10.4% in 2013 to 9% in 2017 and financial flows from 11.7% to 9.3%.
6. The US dollar remains the dominant trade currency, however, we see increased use of the euro and African regional currencies and decreased use of the British pound Use of the US dollar has decreased as a share of payments originating in Africa from more than 50% in 2013 to 45.1% in 2017. The euro is increasing in importance, up from 26.5% to 29.4%. The British pound, however, has seen a decrease in use from 6.2% to 4.6%. Meanwhile, the use of local currencies such as the West African franc is increasing.
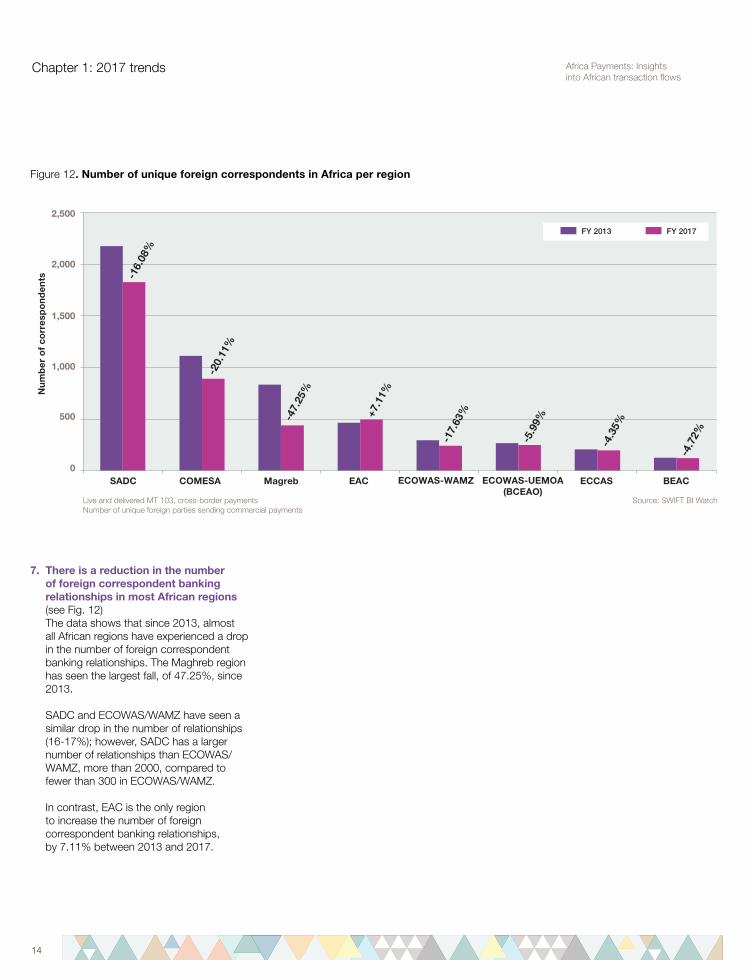
7. There is a reduction in the number of foreign correspondent banking relationships in most African regions Since 2013, almost all African regions have experienced a significant drop in the number of foreign correspondent banking relationships. The Maghreb region has seen the largest reduction, of 47.25%, since 2013, while the East African Community is the only region to see an increase in relationships.
2017 TRENDS
In this paper, we consider two types of transaction flows:– Commercial flows, which correspond to the
end-destination for goods and services – Financial payment flows, which indicate the
route that payments take, i.e. the location of the intermediaries that are clearing/settling the payments
This paper makes seven key observations:
1. Intra-Africa clearing and trade is increasing in importance Almost 20% of all cross-border commercial payments sent by African banks now remain within the continent, up from 16.7% in 2013. Intra-African clearing of payments has increased from 10.2% in 2013 to 12.3% in 2017.
2. North America remains the main payment route of financial flows from Africa, however, its dominance is declining African financial flows are still dominated by payments to North America, however, North American clearing dominance is decreasing. Banks in North America (mainly the United States) now receive 39.5% of all payments sent by Africa, down from 41.7% in 2013. More than 80% of the transactions sent from Africa to the United States have their final beneficiary in another region. The two main regions where the payment will eventually be transferred are Asia Pacific (35%) and Africa (19.5%).
3. Europe’s significance as a clearing and
trading partner for Africa is increasing Commercial flows directed to clients based in Europe have increased from 26.4% in 2013 to 28.6% in 2017. Financial flows with Europe have also increased in very similar proportion to the commercial flows, indicating that volumes cleared by European banks are closely related to trade activity between Africa and Eurozone countries.
1 IMF Direction of Trade Statistics, 2017

5
Africa Payments: Insights into African transaction flows
ENVIRONMENTAL FACTORS DRIVING CHANGE
We have also identified several environmental factors that are driving change in cross-border transaction flows. These are re-shaping cross-border banking in Africa and leading to more intra-African trade.
1. Political will for regional integration and harmonisation Regional harmonisation is and will continue to be a significant driver of economic transformation in Africa. This will impact all types of industrial and commercial activity across the continent, and consequently payment flows. Policy makers have recognised the need to build sound financial marketplaces with the appropriate legal framework and technological infrastructure. Regional harmonisation projects are a major catalyst for the evolution of cross-border trade and banking in Africa and are driving the increased use of local currencies across the region.
2. The demand side of the African market is expanding and evolving The political will to achieve harmonisation across the continent is driving agreements that enable free trade, such as the African Union’s Continental Free Trade Area (CFTA). This is facilitating corporate growth across Africa, which, in turn, is leading to change in cross-border transactions.
3. The development of Africa’s financial infrastructure African countries are investing in financial market infrastructures (FMIs), many at a regional level. Policy makers recognise that payments systems and other infrastructures are an enabler for economic growth and quickly repay their investment. The development of strong and secure FMIs has also been important in helping to drive more cross-border trade within Africa and with the rest of the world.
4. Regulatory pressure in financial markets Transaction patterns are being shaped by international regulations that impose strong prudential controls and operate a close to zero-tolerance to exposure to potential money-laundering and terrorist financing. It is becoming increasingly difficult for global transaction banks to do business with smaller African banks that cannot easily demonstrate strong Know Your Customer, anti-money laundering and counter-terrorist financing processes. This has led many global transaction banks to review and rationalise their correspondent banking relationships, which in turn has led to a reduction in the number of foreign correspondent banking relationships in Africa.
CONCLUSION SWIFT data in this report underscores the importance of intra-regional trade corridors, both for financial and commercial flows. The data also clearly indicates that the dominance of the US dollar is declining and there is a shift towards the use of the euro and Africa’s local currencies.
As regional initiatives across Africa continue to mature, they are likely to contribute to and impact these flows and promote the use of local currencies. However, since most commodities are denominated in dollars, the US dollar will continue to be used for a large proportion of payments in the future.
Macro-economic and political forces have been shaping Africa’s banking sector over the last five years and will continue to do so. Digitisation and technological innovation will also play an increasingly important role in defining Africa’s financial landscape. To be successful, pan-African players will need to seize the opportunities offered by these shifts and use them to their advantage.
4. Increasing regulatory pressure
2. Evolving & expandingdemand in Africa
3. Development of financial
infrastructure
1. Political will for regional integration and harmonisation
BiggerAfricanplayers
Multi-currency clearing
Move to regional
currencies
Interlinkageof regional payment systems
Executive summary

6
Africa Payments: Insights into African transaction flows
6
Introduction & economic context
The sustained growth of African economies is clearly reflected in SWIFT payments volumes, which have been increasing year-on-year, ahead of global growth patterns across SWIFT (see Fig. 2).
Analysis of transaction flows originating from different African economic regions shows the growing importance of intra-Africa trade, and the decreasing dominance of North American banks as intermediaries for cross-border payments. While the US dollar and euro remain the predominant base currencies for settling cross-border trade, increasing and renewed pressure from political and economic drivers are challenging the status quo. So what does this mean for cross-border banking in Africa?
In 2013, SWIFT published the white paper “Africa Payments: Insights into African Transaction Flows”, which attempted to frame the cross-border banking context in the midst of regional initiatives, international regulatory pressures and the reconfiguration of trade corridors. Supported by some unique market data on payment routes, we identified various trends that summarised transaction flows in Africa at this time and explored the drivers for change. In 2018, we are updating and reviewing this data to explore how transaction banking has changed in Africa over the last five years, what external conditions are driving these changes, and look at possible evolution scenarios that will impact banking in Africa in the years to come.
ECONOMIC CONTEXT
The African economy is almost ten times smaller than advanced economies2 and four times smaller than China. Compared to the BRIC countries, Africa’s total GDP would rank third, between India and Russia (see Fig. 3).
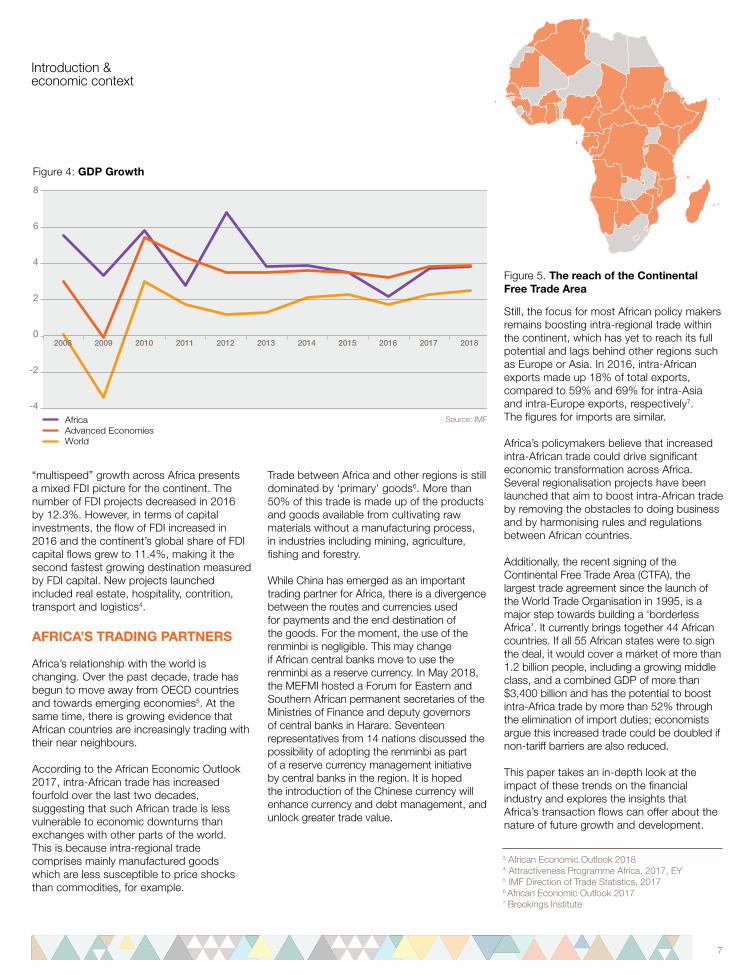
Global and domestic shocks in 2016 slowed Africa’s pace of growth, which had previously been outperforming total global growth for more than a decade (see Fig. 4). However, signs of recovery were already evident in
2017 and growth is expected to accelerate further this year.
While recovery has been faster than many economists expected, natural resources remain the biggest contributor to African growth, which leaves commodity-dependent markets vulnerable to shocks – as illustrated in 2015/2016 when the price of oil collapsed. However, the African Development Bank (AfDB) believes that many African countries are now more resilient and better placed to cope with volatile market conditions than ever before. AfDB figures from 2015 showed that the five fastest growing African countries were non-resource rich, led by Ethiopia, Ivory Coast and Rwanda.
That said, policymakers across the continent recognise the need to diversify, scale up infrastructure and human capital, and to industrialise in order to create sustainable growth and generate employment for a growing labour force. Africa will be the youngest and most populous continent in the next few decades, with its labour force expected to reach nearly two billion by 20633. foreign direct investment (FDI) will remain fundamental in supporting the development of Africa’s critical infrastructure. According to EY’s Attractiveness Programme Africa, heightened geopolitical uncertainty and
Figure 2: African commercial payments evolution
2 Advanced economies: Australia, Austria, Belgium, Canada, Cyprus, Czech Republic, Denmark, Estonia, Finland, France, Germany, Greece, Hong Kong SAR, Iceland, Ireland, Israel, Italy, Japan, Korea, Republic of, Latvia, Lithuania, Luxembourg, Macao SAR, Malta, Netherlands, New Zealand, Norway, Portugal, Puerto Rico, San Marina, Singapore, Slovak Republic, Slovenia, Spain, Sweden, Switzerland, Taiwan, Province of China, United Kingdom, United States
2007 2008 2009 2010 2011 2012 2013 2014 2015 2016
Growth: 2017 vs 2007212%
20170
15
30
45
60
75
90
Live and delivered MT 103, traffic sent and received in Africa, FY 2007 – FY 2017
Millions
Figure 3: GDP in 2018 based on PPP
25,239
(Billions of current international dollars)
China
3389Brazil
10,385
Russian Federation 4169
Africa (Region) 6748
India
Advanced economies 55,004
Source: SWIFT BI Watch
Source: IMF
7
Figure 4: GDP Growth
2008 2009 2010 2011 2012 2013 2014 2015 2016 2017 2018
-4
-2
0
2
4
6
8
AfricaAdvanced EconomiesWorld
“multispeed” growth across Africa presents a mixed FDI picture for the continent. The number of FDI projects decreased in 2016 by 12.3%. However, in terms of capital investments, the flow of FDI increased in 2016 and the continent’s global share of FDI capital flows grew to 11.4%, making it the second fastest growing destination measured by FDI capital. New projects launched included real estate, hospitality, contrition, transport and logistics4.
AFRICA’S TRADING PARTNERS
Africa’s relationship with the world is changing. Over the past decade, trade has begun to move away from OECD countries and towards emerging economies5. At the same time, there is growing evidence that African countries are increasingly trading with their near neighbours.
According to the African Economic Outlook 2017, intra-African trade has increased fourfold over the last two decades, suggesting that such African trade is less vulnerable to economic downturns than exchanges with other parts of the world. This is because intra-regional trade comprises mainly manufactured goods which are less susceptible to price shocks than commodities, for example.
3 African Economic Outlook 20184 Attractiveness Programme Africa, 2017, EY5 IMF Direction of Trade Statistics, 20176 African Economic Outlook 20177 Brookings Institute
Trade between Africa and other regions is still dominated by ‘primary’ goods6. More than 50% of this trade is made up of the products and goods available from cultivating raw materials without a manufacturing process, in industries including mining, agriculture, fishing and forestry.
While China has emerged as an important trading partner for Africa, there is a divergence between the routes and currencies used for payments and the end destination of the goods. For the moment, the use of the renminbi is negligible. This may change if African central banks move to use the renminbi as a reserve currency. In May 2018, the MEFMI hosted a Forum for Eastern and Southern African permanent secretaries of the Ministries of Finance and deputy governors of central banks in Harare. Seventeen representatives from 14 nations discussed the possibility of adopting the renminbi as part of a reserve currency management initiative by central banks in the region. It is hoped the introduction of the Chinese currency will enhance currency and debt management, and unlock greater trade value.
Introduction & economic context
Still, the focus for most African policy makers remains boosting intra-regional trade within the continent, which has yet to reach its full potential and lags behind other regions such as Europe or Asia. In 2016, intra-African exports made up 18% of total exports, compared to 59% and 69% for intra-Asia and intra-Europe exports, respectively7. The figures for imports are similar.
Africa’s policymakers believe that increased intra-African trade could drive significant economic transformation across Africa. Several regionalisation projects have been launched that aim to boost intra-African trade by removing the obstacles to doing business and by harmonising rules and regulations between African countries.
Additionally, the recent signing of the Continental Free Trade Area (CTFA), the largest trade agreement since the launch of the World Trade Organisation in 1995, is a major step towards building a ‘borderless Africa’. It currently brings together 44 African countries. If all 55 African states were to sign the deal, it would cover a market of more than 1.2 billion people, including a growing middle class, and a combined GDP of more than $3,400 billion and has the potential to boost intra-Africa trade by more than 52% through the elimination of import duties; economists argue this increased trade could be doubled if non-tariff barriers are also reduced.
This paper takes an in-depth look at the impact of these trends on the financial industry and explores the insights that Africa’s transaction flows can offer about the nature of future growth and development.
Figure 5. The reach of the Continental Free Trade Area
Source: IMF

8
Africa Payments: Insights into African transaction flows
8
Figure 6: Transaction flows
Financial flow
Commercialflow
Goods / services
Bank of Client A
Bank of Client A
EXAMPLE 1
Bank of Client B
EXAMPLE 2
Commercialflow
Goods / services
Financial flow Financial flow
Clearing Bank
Bank of Client B
SWIFT’s presence in the African region is growing rapidly, as shown with the number of high-value payment (HVP) and low-value payment (LVP) systems using SWIFT. In addition, there are several countries and regional initiatives currently under implementation that are expected to go into production in the coming months and years.
This paper discusses the current situation in Africa, and takes a closer look at the different regional initiatives. We will explain the drivers for the continued evolution of transaction flows in Africa and we highlight new trends in the continent’s payments environment.
Our approach
This paper considers transaction flows based on cross-border commercial payments, because these mirror actual trade flows and generate the associated financial flows.
Two types of transaction flows can be differentiated: commercial flows and financial flows. Commercial flows refer to the payment instruction sent by the bank of a client A, typically a corporate, to the bank of a client B for the import of goods or services. These flows are measured based on the commercial payments sent by banks from Africa to the country in which the end-beneficiary is situated.
Financial flows represent the payment route used for the settlement of the transaction. They are measured using the number of commercial payments sent by banks from Africa to the country of the counterparty bank.
Commercial and financial flows can mirror each other – see example 1 with an African import from Europe where the payment is directly routed to a European bank, or show a disconnect – see example 2 with an African import from Asia intermediated by a clearing bank in the United States.
Transaction flows are measured based on customer credit transfers (called MT 103 SWIFT messages) executed on the SWIFT network.
SWIFT connects more than 11,500 financial institutions and corporations in more than 200 countries and territories providing the proprietary communications platform, products and services that allow its customers to connect and exchange financial information securely and reliably. SWIFT is widely recognised as the trusted financial telecommunication service provider for the payments clearing market, and provides messaging services for more than 115 domestic and international payments clearing systems worldwide in 130 countries.

9
Africa Payments: Insights into African transaction flows
9
Chapter 1
2017 TRENDS
Africa Payments: Insights into African transaction flows

10
Africa Payments: Insights into African transaction flows
Chapter 1: 2017 trends
8 African Economic Outlook 2017
Economic growth in Africa is represented by transaction flows on the SWIFT network. With the exception of 2009, transactions flows sent by banks in Africa have shown a year-on-year growth of around 10%.
Transaction flows in Africa todaycan be summarised in sevenobservations:
indicates that this remains the main clearing route. However, North American clearing dominance is decreasing. Banks in North America (mainly the United States) now process 39.5% of all payments sent by Africa, down from 41.7% in 2013. More than 80% of the transactions sent from Africa to the United States have their final beneficiary in another region (see Fig. 9). The two main regions where the payment will eventually be transferred are Asia Pacific (35%) and Africa (19.5%).
3. Europe’s significance as a clearing and
trading partner for Africa is increasing (see Fig. 8) Historically, Europe has been the largest trading partner for the African region. In 2015, 30% of African trade was carried out with the EU8. The strong Africa-EU trade relationship is also reflected in SWIFT’s data. Commercial flows directed to clients based in Europe have increased from 26.4% in 2013 to 28.6% in 2017. Financial flows with Europe have also increased in very similar proportion to the commercial flows. This indicates that volumes cleared by European banks are closely related to trade activity between Africa and Eurozone countries.
1. Intra-Africa clearing and trade is increasing in importance (see Fig. 8) SWIFT data shows a significant increase in commercial payments within Africa. Commercial payment flows correspond with the end-destination for goods and services. Almost 20% of all commercial payments sent by African banks now remain within the continent, up from 16.7% in 2013. Clearing of payments within Africa is also increasing. Financial payment flows indicate the route that payments take, i.e. the location of the intermediaries that are settling the payments. Intra-African clearing of payments increased from 10.2% in 2013 to 12.3% in 2017. While this indicates that intra-African trade and payments clearing are increasing, African banks and companies are still using foreign financial intermediaries to facilitate trade, notably in North America and Europe.
2. North America remains the main
payment route of financial flows from Africa, however, its dominance is declining (see Fig. 8) African financial flows are still dominated by payments to North America, which
200820082007 2009 2010 2011 2012 2013 2014 2015 2016 2017 2018
Africa payments on SWIFTGDP
Figure 7: Evolution of GDP compared to SWIFT payment volumes (MT 103)
SWIFT forecasts 4% GDP growth in 2018 based on the evolution of SWIFT payments volumes
Source: IMF and SWIFT BI Watch

11
Africa Payments: Insights into African transaction flows
FY 2017 FY 2013
Live and delivered MT 103 sent from Africa, cross-border
Europe – Non Euro Zone without UK
%
CN/HK
Asia-Pacific without CN/HK
Africa
United Kingdom
North America
Europe – Euro Zone
1.31.2
0.81.0
0.1
Middle East
Central & Latin America
1.5
9.3
10.2
12.3
11.7
3.5
3.6
1.4
31.7
39.5
41.7
29.1
FY 2017 FY 2013
Live and delivered MT 103 sent from Africa, cross-border
Europe – Non Euro Zone without UK
%
United Kingdom
CN/HK
Asia-Pacific without CN/HK
North America
Europe – Euro Zone
Africa
5.65.2
4.24.4
0.60.7
Middle East
Central & Latin America
9.0
10.3
11.7
11.6
13.2
10.1
11.3
10.4
19.9
28.6
26.4
16.7
Chapter 1: 2017 trends
Figure 8 Where are commercial payments from Africa going to? (Commercial flow)
Which payments routes are being used? (Financial flow)
Source: SWIFT BI Watch

12
Africa Payments: Insights into African transaction flows
12
Chapter 1: 2017 trends
4. Financial flows do not reflect the magnitude of commercial flows between Africa and the Asia Pacific region (see Fig. 8) In our 2013 report, SWIFT data showed that while 21.6% of African commercial flows were directed to customers in Asia Pacific, only 5% of financial flows were routed through the region. The same trend is reflected in this year’s data. While 21.7% of commercial flows are destined for Asia Pacific, only 5% of financial flows are routed through the region. This divergence is explained by the use of the US dollar by African banks and companies (more than 45% of cross-border flows) and intermediation of financial flows by US dollar clearing banks in the United States. Flows to Asia specifically remain largely denominated in US dollars. As trade with China and investment from China has increased, many expected an increase in the use of the Chinese renminbi (RMB), however this has not materialised.
5. There has been a drop in trade between the UK and Africa. The UK is also used less as a payment route for transactions from Africa (see Fig. 8) In 2013, the UK was the end beneficiary for 10.4% of all payments being sent from Africa, while 11.7% of payments were routed through the UK. SWIFT data suggests that both the British pound and UK clearing banks are seeing a reduction in their share of African imports with commercial flows dropping to 9% and financial flows to 9.3% in 2017. The data shows that Africa’s share of payments to the UK has dropped and that the payment flows are now almost exclusively related to goods and services from the UK, and not to the clearing of payments for goods and services originating from elsewhere.
6. The USD remains the dominant trade currency, however, we see increased use of the euro and African regional currencies and decreased use of the British pound (see Fig. 10) The US dollar accounted for more than 50% of payments from Africa in 2013 and this has decreased to 45.1% in 2017. The euro is increasing in importance, up from 26.5% to 29.4%. The British pound, however, has seen a decrease in use from 6.2% to 4.6%. The use of local currencies, including the West African franc and South African rand, is increasing. Use of the franc for cross-border payments has overtaken the rand and the pound, accounting for 7.3% of payments in 2017, up from 4.4% in 2013. The rand has seen a smaller increase in cross-border payments from 6.3% to 7.2%. Despite more than 10% of payments ending up in China, the use of the renminbi is negligible, only 0.1% of all payments are denominated in RMB. If we break down the use of currency by African region, the data shows some obvious patterns in cross-border payments.
Figure 9. Final destination of payments from Africa routed through US clearing banks
Figure 10. Africa’s currency usage for cross-border commercial payments
Co
mm
erci
al c
oun
terp
artie
s
%
Asia-Pacific 35.0
AfricaSending bankAfrica
FinancecounterpartyUSA
North America
Europe – Euro Zone
Middle East
Other regions 11.6
7.9
10.7
15.3
19.5
Others 6.4
Others 5.5XOF 4.4
GBP 6.2
GBP 4.6
%
%
USD 51.1
USD 45.1
EUR 26.5
EUR 29.4
ZAR 6.3
ZAR 7.2
XOF 7.3
Source: SWIFT BI Watch
OVERALL CURRENCY USAGE – 2017
OVERALL CURRENCY USAGE – 2013
Source: SWIFT BI Watch

13
Africa Payments: Insights into African transaction flows
13
Chapter 1: 2017 trends
2013SA
DC
EA
CB
EA
C
2017
2013
2017
2013
2017
2013
2017
2013
2017
2013
2017
2013
2017
2013
2017
0 10 20 30 100908070605040 %
Currency usage of integration regions
More USD and others
More USD
More XOF
More EUR
Stable
More EUR and others
More EUR
More EUR and ZAR
USD
ZAR
GBP
EUR
XOF
Others
EC
OW
AS
WA
MZ
EC
OW
AS
–U
EM
OA
/W
AE
MU
(BC
EA
O)
Mag
hre
bC
OM
ES
AE
CC
AS
Live and delivered MT 103 sent from Africa, cross-border, FY 2013 vs FY 2017
Figure 11. Africa’s currency usage for cross-border commercial payments by region
In the Southern African Development Community (SADC) there has been a significant drop in the use of the dollar while the euro and the rand have increased. Currency usage should be revisited when the dollar becomes a settlement currency on SIRESS (SADC’s intra-regional payments system), which is planned for late 2018. The increase in the use of the West African franc in Africa is linked to the Central Bank of West African States, since is it the common currency for eight countries in the region. Over the last five years there has been a significant increase in the use of the franc, while use of the euro has reduced in the region.
West and east Africa are the only regions in which the use of the dollar has increased. COMEA, ECCAS and BEAC all see an increase in the use of the euro, which also dominates in the Maghreb region.
Source: SWIFT BI Watch
14
Africa Payments: Insights into African transaction flows
14
Chapter 1: 2017 trends
FY 2013 FY 2017
SADC
Nu
mb
er o
f co
rres
po
nd
ents
COMESA Magreb EAC ECCAS BEACECOWAS-WAMZ ECOWAS-UEMOA(BCEAO)
0
500
1,000
1,500
2,000
2,500
-16.
08%
-20.
11%
-47.
25%
+7.1
1%
-17.
63%
-5.9
9%
-4.3
5%
-4.7
2%
Figure 12. Number of unique foreign correspondents in Africa per region
7. There is a reduction in the number of foreign correspondent banking relationships in most African regions (see Fig. 12) The data shows that since 2013, almost all African regions have experienced a drop in the number of foreign correspondent banking relationships. The Maghreb region has seen the largest fall, of 47.25%, since 2013. SADC and ECOWAS/WAMZ have seen a similar drop in the number of relationships (16-17%); however, SADC has a larger number of relationships than ECOWAS/WAMZ, more than 2000, compared to fewer than 300 in ECOWAS/WAMZ. In contrast, EAC is the only region to increase the number of foreign correspondent banking relationships, by 7.11% between 2013 and 2017.
Source: SWIFT BI WatchLive and delivered MT 103, cross-border paymentsNumber of unique foreign parties sending commercial payments

15
Africa Payments: Insights into African transaction flows
15
Chapter 2
WHAT IS DRIVING CHANGE IN CROSS-BORDER TRANSACTION FLOWS?

16
Africa Payments: Insights into African transaction flows
Chapter 2: What is driving change in cross-border transaction flows?
16
Cross-border payments, both intra-Africa and between Africa and the rest of the world, are still skewed towards US dollar usage and dollar clearing via North American banks. However, this pattern is changing, with SWIFT data showing a move away from the US dollar towards greater use of African currencies and the euro.
Below we look at some of the regional forces that have been re-shaping African cross-border payment flows and leading to more intra-Africa trade
1. Political will for regional integration and harmonisation Regional harmonisation is and will continue to be a significant driver of economic transformation in Africa. This will impact all types of industrial and commercial activity across the continent, and consequently payment flows. Many African countries believe that regional collaboration will contribute to achieving their political, economic and social goals. Africa comprises 54 countries with disparate economies. Smaller markets can be constrained in their growth prospects and have less leverage at international level. Forging regional ties through integration and cooperation can eliminate obstacles to trade and make regions more competitive in the global marketplace. This brings greater economic stability and resiliency. Because trade between African countries has the greatest potential for sustainable economic development, regional harmonisation is also seen as a way to foster intra-Africa trade flows and attract foreign direct investment from within and beyond the continent. To that end, policy makers have recognised the need to build sound financial marketplaces with the appropriate legal framework and technological infrastructure. This is illustrated by the numerous regional
African foreign direct investment – money that African companies invested in African countries – nearly tripled11. This growth is supported by SWIFT data, which reveals that commercial payment flows – showing the end recipient of the payment and therefore the destination of the goods and services – have risen from 16.7% to 19.9% between 2013 and end of 2017. The signing of the CFTA agreement by 44 countries in March 2018 is a major step towards building a “borderless Africa” that will further boost Intra-African trade. Under the continent-wide agreement, nations commit to cut tariffs on 90% of goods. It is the largest free trade zone established since the creation of the World Trade Organisation in 1995. The African Development Bank expects that the CFTA will stimulate intra-African trade by up to $35 billion per year, generating a 52% increase in trade by 2022 and a $10 billion decrease in imports from outside Africa12. These efforts will continue to push up intra-Africa payment flows. The move towards more intra-African trade is also reflected in change in the use of currency. SWIFT data shows that the use of the US dollar has dropped as a share of payments from Africa from 50% in 2013 to 45.1% in 2017. There is a significant increase in the use of several regional currencies. Use of the West African franc has increased in use from 4.4% in 2013 to 7.3% in 2017, and the South African rand from 6.3% to 7.2%.
initiatives taking place across the continent (see Fig. 13). Such regional harmonisation projects are a major catalyst for the evolution of cross-border trade and banking in Africa. The impact of regional initiatives can be seen in SWIFT’s data. Intra-African financial flows – the route taken by payments – have increased from 10.2% in 2013 to 12.3 in 2017. There is also an increased use of local currencies in regions that have strong regional integration. The West African franc, for example, used by all members of the West African Economic and Monetary Union, has increased in use from 4.4% in 2013 to 7.3% in 2017. The use of the South African rand, which is the settlement currency of SIRESS (see Fig. 13), has also increased from 6.3% to 7.2%.
2. The demand side of the African market is expanding and evolving Regional harmonisation is and will continue to be a significant driver of economic transformation in Africa. This will impact all types of industrial and commercial activity across the continent, and consequently payment flows. The political will to achieve harmonisation is driving agreements that enable free trade, such as the Continental Free Trade Area (CFTA). This is facilitating corporate growth across Africa, which, in turn, is leading to change in cross-border transactions. A growing number of companies are pan-African in their operations, with successful companies emerging in retail, financial services and transportation. Africa has 700 companies with revenues of more than $500m10. According to a report by Boston Consulting Group, there are 150 leading companies investing in Africa, 75 of which are Africa-based, coming from 18 countries across the continent: 32 from South Africa, 10 from Morocco and 6 from both Nigeria and Kenya. The report also found that, between 2006/2007 and 2015/2016, the average annual amount of
10 Lions on the Move II: Realising the potential of Africa’s economies, McKinsey, 2016
11 Pioneering One Africa, The Companies Blazing a Trail Across the Continent, Boston Consultancy Group, 2018
12 https://www.afdb.org/en/news-and-events/african-development-bank-pledges-full-support-towards-success-of-continental-free-trade-area-17968/

17
Africa Payments: Insights into African transaction flows
17
Chapter 2: What is driving change in cross-border transaction flows?
13 Annual Report on the payment systems of the BCEAO, 2016
BCEAO In the West African Economic and Monetary Union, countries share a common currency (the West African franc, XOF) and clearing and settlement infrastructure for payments (the Central Bank of the West African States BCEAO). By the end of 2016, there were 118 participants on the regional RTGS, settling 758,995 transactions at a value of 457,831 billion francs in 2016 alone13. The impact of this project is clear in SWIFT’s data. Almost 30% of cross-border payments in this region are denominated in the West African franc, and this figure is increasing.
WAMZThe West African Monetary Zone (WAMZ) is currently working on a project to interlink real time gross settlement (RTGS) systems in the region, which could make payment flows easier and cheaper since banks will no longer need to open subsidiaries across the region. Currently, the US dollar dominates payments flows from this region, which is likely linked to oil exports from countries like Nigeria. With an integrated payments system in place, it remains to be seen whether there will be a shift to the use of regional currencies.
SIRESSIn July, 2013, the Southern Africa Development Community (SADC) launched the SADC Integrated Regional Electronic Settlement System (SIRESS). SIRESS settles payments between participating banks in South African rand. From its inception to 31 March 2017, 83 participants carried out 712,099 transactions with a value of 3,100 billion rand on the system. The system delivers faster settlement time, a reduction of settlement risk and lower cost of transacting. Coupled with increased FDI into African countries by mainly South African corporates, the SIRESS platform to a large extent provides an explanation for the increasing usage of the South African Rand (ZAR) as a settlement currency in comparison to 2013.
Figure 13. Spotlight on some of Africa’s regional payment systems
EAPSThe East African Regional Payment System (EAPS) was launched in November 2013 with Kenya, Tanzania and Uganda. Rwanda successfully joined the EAPS in December 2014 and Burundi is expected to connect this year. The regional payment platform facilitates intra-regional trade by allowing easier, faster, cheaper and secure transfer of funds by both importers and exporters. Clearing takes place in local currencies. The success of the system is yet to be confirmed. There is limited data available on current transaction volumes. What is clear, however, is that the US dollar continues to be the dominant currency within this region.

18
Africa Payments: Insights into African transaction flows
18
Chapter 2: What is driving change in cross-border transaction flows?
2. continued: While intra-African trade is increasing, its biggest trading partners are still outside of the continent. According the African Development Bank, 30% of African trade was carried out with the EU in 201514. The strong Africa-EU tie is reflected in SWIFT’s data, with commercial payments increasing from 26.4% in 2013 to 28.6% in 2017, and the use of the euro increasing from 26.5% to 29.4% of all payments from Africa. This is a result of certain partnerships including the Africa-EU Strategic Partnership established in 2007, which acts as the formal platform for cooperation between the two continents. There are also numerous bilateral and unilateral agreements between the EU and Africa, which means that most African countries enjoy duty-free and quota-free access to the EU market15. Trade between West Africa and Europe is particularly strong. Local currencies, including the West African franc (XOF) and Central African franc (XAF), are pegged to the euro and are used for the trading of many soft commodities coming from the region. The value chain of the trade therefore supports use of the euro, since a lot of soft commodities denominated in euro – such as cocoa and cotton – are being sold to Europe; particularly cocoa, to France, Belgium and Switzerland. However, since most commodities continue to be denominated in dollars it is likely that the US dollar will continue to be used for a large proportion of payments in the future.
3. The development of Africa’s financial infrastructure Infrastructure weaknesses in Africa can be barriers to economic development. The African Development Bank estimates the infrastructure ‘gap’ to be about $50 billion per year16, which has led to a massive ramp-up in public infrastructure projects. Like telecommunications, roads and ports, financial market infrastructures (FMIs) are an enabler for economic growth and quickly repay their investment, so many governments have made this a major priority in the last few years. SWIFT is supporting the development of Africa’s financial infrastructure and connects and serves more than 25 market infrastructures across the continent. The first generation of FMI was introduced in the 1990s in the form of real time gross settlement (RTGS) systems, with a primary aim to equip domestic economies with robust settlement and risk management systems. The second generation involved interlinking the RTGS with ancillary systems, such as government securities, central securities depositories, automated clearing houses, cards and points of sale. The third generation includes systems such as SIRESS, which have a cross-border reach and support multiple-currencies. With the adoption of the latest communication and information technology, these third generation systems will support central bank reporting, improve transparency and increase security and resilience. Discussions are already taking place about the fourth generation, which would provide richer data, greater speed and better integration with digital economy platforms. The development of strong and secure FMIs has been important in helping to drive more cross-border trade within Africa and with the rest of the world. FMIs provide greater certainty and efficiency in transaction processing. Accompanied by a sound, harmonised legal and regulatory framework, robust
FMIs make intra-regional payments more competitive, reducing the need for foreign intermediation. As infrastructures mature, intra-Africa transactions will converge towards them.
4. Regulatory pressure in financial markets Transaction patterns are being shaped by regulations that impose strong prudential controls and operate a zero-tolerance to exposure to potential money-laundering and terrorist financing. For American and European global transactions, banks operating from jurisdictions where the regulatory regimes are particularly onerous, it is becoming increasingly difficult and more expensive to do business with small African banks, especially if they cannot demonstrate that they have robust Know Your Customer, anti-money laundering and counter-terrorist financing processes in place. This has led many global transaction banks to review and rationalise their correspondent banking relationships. SWIFT data shows that almost every region in Africa has experienced a reduction in foreign counterparties – in other words, the foreign banks with whom African banks transact overseas. As a result, access to the US dollar and dollar clearing may become more difficult. While the withdrawal of international banks can create challenges, it also provides opportunities for African banks to expand, and to provide clearing and settlement services to other, smaller African banks. SWIFT data shows that the number of intra-African correspondent banking relationships has increased significantly since 2013 (see Fig. 14). Larger African banks like Standard Bank, National Bank of Egypt, ABSA Bank, Ecobank, Banque Populaire du Maroc and Attijariwafa are already positioning themselves to become the gateway for banking in Africa. Attijariwafa, for example, operates in 12 countries in sub-Sahara Africa, Standard Bank has a presence in 20, and Ecobank in 36.
14 African Development Bank African Economic Outlook 2017
15 https://eeas.europa.eu/sites/eeas/files/eu_-_africa_trade_2017.pdf
16 https://www.afdb.org/en/news-and-events/speech-by-dr-akinwumi-a-adesina-president-of-the-african-development-group-at-the-media-launch-of-the-africa-investment-forum-johannesburg-may-8-2018-18091/

19
Africa Payments: Insights into African transaction flows
19
Chapter 2: What is driving change in cross-border transaction flows?
Number of correspondents sending MT 950 and MT 940 to Africa, FY 2013 – 2017
2013
0
20
40
50
220
230
240
250
260
270
290
310
280
300
320
330
2014 2015 2016 2017
Figure 14. Number of intra-African accounts
Source: SWIFT BI Watch

20
Africa Payments: Insights into African transaction flowsChapter 3
WHAT WILL CHANGE IN AFRICAN CROSS-BORDER BANKING?
20
21
Africa Payments: Insights into African transaction flows
21
Africa Payments: Insights into African transaction flows
1. Fewer but bigger African players Over the last five years we have seen an increase in the number and strength of pan-African banks operating across the continent and the trend looks set to continue. This is because African banks are today better positioned in terms of their balance sheets, local market understanding and risk appetite to capture growth across the continent. While foreign global banks possess some significant competitive advantages, such as global reach and a sophisticated product offering, many have less capacity (or willingness) to develop a large footprint on the continent due to liquidity and local market know-how. Pan-African banks are therefore attractive partners for foreign banks interested in doing cross-border business with Africa. Additionally, banks are refocusing their business and risk management strategies. As global transaction banks review and rationalise their correspondent banking relationships in Africa as a result of ever increasing compliance obligations, pan-African banks are taking the opportunity to expand. Many are already providing clearing and settlement services to smaller African banks. SWIFT data shows that the
Simultaneously, across the continent, access to the US dollar is becoming increasingly difficult for smaller players, principally because of tighter anti-money laundering and Know Your Customer requirements. This could further drive the use of regional currencies.
3. Interlinkage of regional payments systems While regional payment systems are being successfully deployed across the continent, including the STAR-UEMOA, EAPS and SIRESS, several regions are looking at how these could be interconnected to allow payments to flow from one system to another and provide pan-regional settlement capability. For example, there is a triparty arrangement between the East African Community, the Southern African Development Community and the Common Market for Eastern and Southern Africa, the ‘Tripartite Free Trade Area’. This agreement aims to promote economic and social development in the region, create a large single market with free movement of goods and services to promote intra-regional trade, and enhance the regional and continental integration processes17. Part of the agreement includes the coordination of financial and payment systems. Stakeholders are currently discussing how this could be realised.
Chapter 3: What will change in African cross-border banking?
In the banking landscape that is emerging we believe that there are six scenarios to watch.
number of intra-African correspondent banking relationships has increased significantly since 2013. Policy makers across the continent are focusing on regional harmonisation as a means to foster intra-Africa trade flows. As regional markets become more harmonised, banks and corporates will find it increasingly compelling to maximise economies of scale across multiple markets. It is therefore likely that pan-African financial players will gain a business advantage.
2. A shift towards regional currency denomination While the share of the US dollar in cross-border payments from Africa has fallen, it still accounts for 45% of all payments leaving the continent. For inter-continental transactions and for transactions between less well known trading partners, it is unlikely that the hegemony of the dollar will be challenged soon. However, SWIFT data suggests that for a substantial and growing proportion of intra-Africa trade, we could expect increased use of regional currencies. For example, between 2013 and 2017, the use of the West African franc increased 4.4% to 7.3%, and the South African rand from 6.3% to 7.2%. The further development of regional payments systems denominated in local currencies, such as STAR-UEMOA (Système de Transfert Autmatisé et de Règlement de l’UEMOA run by the BCEAO), SIRESS and the East African Payment System, will support this shift. Equally, African central bankers will continue to promote the use of their local currencies. An agreement in 2016 by the five central banks in East Africa offers a good example. Central banks in the region agreed on direct convertibility of national currencies, which will enable traders to transact without having to convert national currencies into dollars first.
17 http://www.atf.org.na/cms_documents/feb-tftaagreements9june20151740hrscleaned.pdf

22
Africa Payments: Insights into African transaction flows
22
Africa Payments: Insights into African transaction flows
Chapter 3: What will change in African cross-border banking?
4. Increased intra-African trade as a result of regional economic transformation Commodity-based African economies remain vulnerable to external shocks and fluctuations in the price of oil. As a result, African policy makers and international financial institutions such as the African Development Bank are focused on economic diversification and the capability to add value to raw commodities through processing and manufacturing, as a way to increase economic resilience. Natural resources and commodities remain important as a source of revenue in many African countries but their role in economic growth is decreasing. In Nigeria, for example, oil represents more than 90% of foreign exchange earnings but only around 10% of GDP. This is down from 25.6% in 2000. According to the African Development Bank, petroleum income has been replaced by other sectors, such as manufacturing, services and agriculture. Further, African Development Bank figures for 2015 show that the five fastest growing African countries were non-resource rich, led by Ethiopia, Ivory Coast and Rwanda18. Diversification is supporting the growth of intra-Africa trade, where manufactured goods are beginning to dominate regional trade, accounting for 60% of total regional trade. In turn, higher levels of regional trade are helping to boost cross-border banking across Africa.
5. The emergence of an African multi-currency clearing centre As growth and greater integration generate more transaction volumes, the economics of setting-up multicurrency clearing infrastructures that include the euro and dollar alongside regional currencies are becoming more persuasive, and strong and reputable international financial centres are emerging. Such initiatives are already being established elsewhere in the world. In 2018, the Arab Monetary Fund agreed to create an independent ‘Regional Entity for Clearing and Settlement of Intra-Arab
payments’, which aims to promote the use of local currencies for intra-Arab clearing and settlement of payments alongside international currencies. In Africa, SIRESS is moving towards this solution with the planned introduction of the US dollar in late 201819. This is expected to improve the settlement of transactions within the region and bring more transactions onto SIRESS that were previously settled through correspondent banking arrangements using US dollar clearers. SADC’s Banking Association hopes that the introduction of the US dollar will improve the regional investment climate through enhanced cooperation among member states on payment, clearing and settlement systems in order to facilitate trade integration.
6. Digital transformation Financial technology (FinTech) is driving the digital transformation of financial services across Africa and has provided an opportunity for African economies to disrupt and leapfrog legacy systems such as those in Europe and North America. In the retail space, many markets have embraced mobile payments, notably East Africa. In 2017, MPesa, a Kenyan-based mobile money service, reported that it had more than 30 million users across 10 countries accessing a range of services including international transfers, loans and health provision. Mobile payments enable consumers to make payments from anywhere using only their mobile phones. This has led to increased levels of financial inclusion particularly in remote areas where people do not have easy access to bank branches or financial services. Banks are also rolling out new products and services across digital channels to grow their customer-base. Banks across the continent are transforming their existing operations to increase their share of digital sales and transactions. They are also partnering with telcos and FinTechs to deliver new and cheaper financial
services to their customers. M-Schwari, for example, is a Kenyan mobile-based loans application formed in partnership between the Commercial Bank of Africa and Safaricom20. As a result of such developments, Africa today has the second-fastest-growing banking market in the world. Between 2012 and 2017, African banking-revenue pools grew at a compound annual growth rate of 11% in constant 2017 exchange rates.21 Pan-African banks are now exploring how digital financial service products can be rolled out across multiple markets. Technology is helping frictionless payments and borderless financial services to become a reality. Historically, innovations started in wholesale markets and then found their way into retail markets. Now, innovation increasingly starts in retail markets and sets the standard elsewhere. With the pace of change quicker than ever and the borders between countries and market segments becoming increasingly blurred, it will be interesting to observe how digitisation and technological innovation will impact cross-border and high-value payments moving forward.
18 African Economic Outlook 2017 19 https://www.sadcbanking.org/news/multi-
currency-project/ 20 Roaring to life: Growth and innovation in
African retail banking, McKinsey, 201821 Roaring to life: Growth and innovation in
African retail banking, McKinsey, 2018

23
Africa Payments: Insights into African transaction flowsConclusion
Africa continues to be a continent of growth and opportunity despite challenging global economic conditions over the last five years. This paper provides a transaction banking perspective on the continent’s developments using reliable and up-to-date payments statistics.
The paper confirms the importance of intra-regional trade corridors, both for financial and commercial flows. Regional initiatives across the continent, including payment market infrastructures and trade agreements such as the Continental Free Trade Area, will contribute to these flows in future.
The data also highlights the importance of the US dollar; however, the data also indicates that its dominance is declining and there is a shift towards the euro and Africa’s local currencies, including the South African rand and West African franc. While regional harmonisation projects will continue to promote the use of local currencies, the composition of African trade means that the US dollar will continue to be used in the future.
Macro-economic and political forces will continue to shape Africa’s banking sector as they have over the last five years. Digitisation and technological innovation will also play an increasingly important role. To be a successful pan-African player it will require careful monitoring of these forces so that business can be positioned to benefit from potential shifts.
23
Africa Payments: Insights into African transaction flows

24
Africa Payments: Insights into African transaction flowsViews from Africa
Interoperability: the next step for mobile money in Africa
By Dilwonberish Aberra and John Ndunguru Financial Services for the Poor Bill & Melinda Gates Foundation
Retail payments are a major component of the digital payment landscape, especially in Sub-Saharan Africa. A digital wallet is much more beneficial when it can be used not only to trade funds among friends and family but also to purchase and sell goods. But in many countries where mobile money proliferates, merchants remain off the digital payments “grid.”
A major cause is the lack of interoperability: There is no common platform connecting all customers throughout the market that merchants can connect to as well. Customers and services stand apart in their own silos. Therefore, a repair shop or grocery wishing to accept digital payments must subscribe to one provider, effectively alienating the customers who subscribe to other services. These silos also keep money from flowing across borders, despite the fact that many in Africa have business and personal relationships beyond the citizens of their home countries.
Mobile money has immense potential for growth and financial inclusion. But unlocking its full potential depends on integrating retailers in the payment landscape and connecting customers on a wider scale. And that depends on interoperability.
From Included to ConnectedSince 2014, the percentage of Sub-Saharan Africans with traditional financial accounts has not changed. But the percentage of mobile money users has doubled, to 21 percent.22
With mobile money and other digital financial services, people can store money securely, spend it effortlessly, and afford the small fees charged by their providers. In Kenya, nearly 200,000 households emerged from extreme poverty after the mobile money service M-PESA was established in their communities.23
Interoperability is the logical evolution of mobile money markets. Essentially, it will drive growth through national or regional standardisation, a process we’ve seen in everything from electrical sockets and
appliances to the common codes used in web development. When digital money is universally accepted, regardless of which particular service a person subscribes to, we can expect more and more people to sign up for digital banking services.
There is parallel logic on the supply side as well. Private sector providers who charge small fees for their services depend on high transaction volumes to make a profit. An interoperable scheme multiplies the number of other users a customer can transact with. This leads to more transactions per customer and more fees collected by the provider.
Interoperability TodayThe inertia toward interoperability is very evident on the continent. Tanzania integrated payments among its mobile money services in 2014, and now one of those services, Airtel, processes more than US $16 million in cross-platform transactions every month.24 A soft launch of the Southern African Development Community’s payments project, which aims to bring region-wide interoperability to its 15 member nations, is possible as early as June of this year.25 Meanwhile, the eight countries of the West African Economic Monetary Union (WAEMU) are planning an interoperable system that will connect 110 million people across banks, financial systems, and borders.
The path to interoperability will be unique in every case. But in broad strokes, every approach is enabled by national, regional, and commercial market infrastructures embracing principles of cost reduction, cost recovery, and cost sharing. Competitors must cooperate, recognising that a common platform serves the common good.
In that spirit, a number of non-proprietary tools are becoming available to help governments and businesses achieve interoperability at a national or regional level. Publicly available APIs allow providers to build digital bridges between their services. Our team at the Bill & Melinda Gates Foundation helped develop open-source software called Mojaloop, which can be used to build a central “switch” that verifies, routes, and
settles payments between diverse players, including mobile money providers, banks, and merchants.
What Next?The next step for both the public and private sectors is to take advantage of the growing set of resources and best practices making interoperability attainable. Given the strong regional relationships in Africa, there is a particular opportunity to connect national infrastructures to enable cross-border payments. Using a tool like Mojaloop, countries can power and propel intra-region commerce without the need for a settlement bank off the continent.
As stated earlier, another important step is looping in retail. Currently, mobile money customers move cash in and out of their digital wallets quite often. But when digital payments are accepted by the vendors and merchants that customers depend on daily, cash will stay digital. That allows customers to fully utilise the speed and security of digital payments, as well as build a robust digital transaction history that can be used to inform new lines of credit, eligibility for loans, and other entrees into more advanced and helpful financial services.
With regional interoperability that includes retail, we can envision a real-time payment network spanning the entire continent, connecting all 400 million unbanked people who live there. This future is closer than it may appear. African governments, businesses, and citizens are already transforming their economies. The tide of innovation and progress will soon come to include—and benefit—everyone.
22 World Bank, Global Findex.23 Suri and Jack, Science. (link is gated; findings also covered in this MIT article)
24 GSMA, “The Impact of Mobile Money Interoperability in Tanzania.”25 Per interview with Maxine Hlabah, executive secretariat of SADCBA.
24

25
Africa Payments: Insights into African transaction flows
25
Views from Africa
Financial Crime Compliance in Africa
In this challenging environment, international banks with dealings in Africa are reviewing and rationalising their relationships, a phenomenon known as de-risking. This is reflected in SWIFT data, which shows a drop in the number of foreign correspondent banking relationships in almost all African regions as a result.
The World Bank has reported that global financial institutions are threatening to cut off access to the global financial system for remittance companies and local banks in certain regions, putting them at risk of losing access to the global financial system26.
According to the World Bank, if the current trend continues, people and organisations in the more volatile areas of the world or in small countries with limited financial markets could be completely cut off from access to regulated financial services.
African banks at a crossroadsWith the combination of increased and tighter regulations imposed on sub-Saharan banks by supervisors, whose main objective is to ensure compliance with international standards, and the de-risking phenomenon, African banks find themselves at a crossroads.
African banks will need to comply with international regulatory requirements while promoting innovation if they want to continue playing the role expected of them: supporting the development of African economies while remaining connected to the global economy.
By Idrissa Diop Group Head Compliance Ecobank
In the wake of financial crises, cybercrime, money laundering and tougher domestic controls, financial institutions are facing more and more international financial crime compliance regulations. These include the requirements of the Basel Committee, FATF recommendations and the international recommendations to fight tax evasion. Within this new environment, banks are expected to illustrate stronger governance that ensures their ability to finance the economy without exposing institutions, and countries, to unknown risk.
To remain competitive, banks must anticipate and meet customer needs while generating returns that meet investor’s expectations, and remain compliant at the highest level expected by regulatory supervisors.
Banks around the world are expected to: – Promote good governance though a
robust risk framework, including a risk appetite statement which states that the bank has the financial, technical and managerial capacity to manage their risk appetite.
– Implement a strong compliance culture by strengthening compliance capabilities and building more robust regulatory compliance risk management methodologies.
– Establish quality data management to ensure that data is accurate, accessible, consistent, secure and up-to-date. Data is a key asset for banking since it helps identify clients, accounts, balances, transactions, risks, assets, liabilities, income, etc.
The increasing compliance challenge in AfricaIn sub-Sahara Africa, supervisors are introducing regulations which align with international standards such as Basel II/III, anti-money laundering /counter-terrorist financing (AML/CTF) regulations which reflect FATF recommendations, and foreign exchange regulation to protect their economies.
At the same time, African Banks are beginning to offer products to their customers allowing them to transact across the continent. This is reflected in SWIFT’s data, which confirms an increase in intra-African accounts and intra-Africa trade. The increase of intra-African trade has led local supervisors to introduce stronger frameworks with which banks need to comply.
Technology is fuelling change too. The rise of mobile banking in Africa means that financial services are able to reach some of the most remote regions, bringing unbanked populations into the financial system. This enables banks to develop platforms where millions of Africans can access services including healthcare and education. However, supervisors are also introducing specific regulations to address this new development.
All of the above have created a more challenging regulatory environment for African banks.
Local initiativesIn the West African Monetary Union region, the Central Bank (BCEAO) has taken important steps to promote financial stability, including the adoption of Basel II and III capital standards and the introduction of consolidated supervision. This has led to increased discipline in terms of capital buffers and prudential ratios.
The Central Bank of Nigeria has also promoted several regulations that have helped local banks adapt their structure to better support the growth of the local economy.
The impact of these challenges on African banksThe introduction of AML/CFT regulations that banks are expected to strictly implement across their network has led to important investments in terms of monitoring systems, hiring of control units and several millions of US dollars declared to local financial intelligence units as being linked to money laundering and terrorist acts.
26 http://www.worldbank.org/en/topic/financialsector/brief/de-risking-in-the-financial-sector

26
Africa Payments: Insights into African transaction flows
26
Policy makers focus on payments infrastructureIn over 400 years of global economic engagement in Africa – from slavery through colonialism, primary resource development and ultimately development aid – there has been little focus on payment methods. Payment systems overwhelmingly relied upon cash, reflecting the extractive nature of most relationships. Until now. Public policymakers know that a healthy, growing economy cannot rely solely on a cash-based payments system. The world’s most advanced economies have the largest proportion of electronic payments in the national payments infrastructure. Attempts to promote national development that ignore the “plumbing” – the way value moves around a national economy and between it and its major trading partners – are likely to be frustrated by costly inefficiencies and large financial risks. Getting this right is not an economic silver bullet, but it is a necessity.
Accordingly, African national governments, regional economic groupings and international aid agencies are all focusing on, and investing in, non-cash payments infrastructure. Lead times are long, but this will ultimately bear fruit for African economies, societies and citizens. The better the payments infrastructure, the more economic opportunity for all. Cross-border flowsSWIFT’s insights into cross-border flows tell part of the story. We can see from data collected in this white paper that cross-border flows reflect two key vectors:
1. Intercontinental flows remain dominated by US dollar-denominated, US-routed movements, although Europe remains the most likely destination for outward flows. Both of these phenomena are reducing, as the euro and local currencies increase in significance and Asia becomes a more significant payments destination.
2. Regional economic groupings are gradually increasing in importance, reflected in increased payment flows within groupings as the regional payment infrastructures gradually improve.
The more efficient both intercontinental and regional flows become, the better the prospects for economic development across Africa’s 55 national governments. Efforts by the Southern African Development Community (SADC) and its counterparts to improve regional payments, plus international developments like SWIFT’s global payments innovation (gpi) service, need vigorous support.
National flowsCross-border flows are only one part of the total payments ecosystem. Economic benefit could also be obtained by investing in national payments infrastructure. And the time to do it is now. For the first time in history, it is possible for non-cash payment services to reach even the remotest, least developed communities in Africa – through the mobile handset. In this way, we have the opportunity to reverse a familiar pattern in so many African countries – a small proportion of the population well served by traditional banking services and infrastructure, with a broad mass of underbanked people. Even South Africa, with its sophisticated financial infrastructure, reaches only 77% of its population with banking services. Some other sub-Saharan countries reach only 10%. Yet GSMA estimates that by 2020, more than 50% of the entire African population will have access to mobile services, two thirds of them through a smart phone. It is therefore no surprise that more than 140 African mobile money services have sprung up in recent years.
It is no longer a question of if, but when. As mobile coverage improves, we can expect rapid organic growth in payments services to African communities using the mobile.
Interoperability is keyThis is good news, but there is a caveat. Uncoordinated growth of point-to-point mobile remittance services will store up cost and risk for later. There is a direct analogy here with the historic and haphazard development of Africa’s rail infrastructure to meet immediate needs (i.e. ports and mines). Different gauges and bespoke routes mean economic growth has been inhibited by inefficiency. This is expensive to fix.
A better path would be a systematic, international approach to coordinated development of mobile-based payments infrastructure. It is important to encourage competition and innovation, but within a framework of interoperability. This is not just a national issue, but a regional and ultimately continental one. The pilot now under way for providing regional mobile interoperability within the SADC region is an important step in the right direction.
As African nations continue to develop their modern payments infrastructure, the more they do so in a way that allows for seamless national and cross-border interoperability, the better for long-term economic health. The technology is freely available: what is needed is political and business will.
Views from Africa
Enabling economic development in Africa – do payment systems matter?
By Chris Hamilton CEO BankservAfrica

27
Africa Payments: Insights into African transaction flows
27
Views from Africa
Facilitating inter-regional payment flows
By Chris Hamilton CEO BankservAfrica
Payment infrastructures can contribute significantly to enabling economic activity in Africa. Although intra-regional trade within some African regions may be low, implementation of practical, safe and efficient payment infrastructures will go a long way towards making it easier to do business in Africa by removing some of the friction.
Various African regional initiative groups have been hard at work developing payment infrastructures as part of their integration agendas. Progress has been achieved in these programmes and some visible changes in the profile of payment flows are evident. However, questions are often raised relating to the need to open up some of these infrastructures to payments from other African countries. The core question here is whether the different regional groups will be open to facilitating inter-regional payment flows in addition to intra-regional.
This is a valid question that should be answered sooner rather than later. This will ensure that openness and the adoption of standards that will facilitate integration are key considerations in the development of these infrastructures. To achieve this, it will be necessary to establish platforms for dialogue and develop appropriate frameworks.
As payments take place in a network economy, collaboration among a multiplicity of stakeholders is imperative. Central banks, as regulators and overseers of payment systems and facilitators of their development, are well placed to take the lead and induce change. This will drive engagement and ensure that desired outcomes are achieved. Established collaboration structures within the continent should be leveraged to initiate dialogue and engagement between public and private sector stakeholders.
The initial outcomes of the engagement process may be practical frameworks that lay the foundations to enable the integration of existing or future infrastructures. These could be followed by more tangible roadmaps that set out the path to achieving inter-regional integration. As part of the process, short, medium and long term strategies supported by practical monitoring mechanisms will need to be put in place.
The drivers for easier inter-regional payment flows include:– Increased payment efficiency in terms of
speed and cost– Increasing the ease of doing business– Greater access to payment services– More transparency in the payment value
chain process – Addressing the de-risking aspects as far as
they relate to payments in Africa
For wholesale payments, banks are the best partners for developing the right approach and frameworks that will ensure successful delivery. It is, however, crucial that the process involves a public-private partnership between the regulators/overseers and the bank stakeholders to ensure that all appropriate building blocks are part of the end solution.
For retail payments, the central banks should take the lead and engage with the private sector on key public policy objectives such as financial inclusion, competition and consumer protection. They should also establish an environment that enables the private sector to work on possible solutions while continuing to monitor progress. It is also worth noting that private sector stakeholders should come from a range of sectors beyond the banking sector.
By working together, all participants can ensure that these infrastructures are built with the considerations of standardisation and interoperability as integral components, ensuring that they will be able to achieve their goals.
By Tim Masela Head of the Payments Department South African Reserve Bank

28
Africa Payments: Insights into African transaction flows
28
China’s renminbi is rapidly developing as an international currency. Within global trade corridors, the renminbi is maturing, albeit while experiencing some teething issues. However, with fluctuations in foreign exchange movements and resurgence in more traditionally used currencies, renminbi volumes unilaterally retreated across both payments and trade finance globally in 2017. Unsurprisingly, volumes in Africa have followed global trends.
China’s Belt and Road initiative is expected to expedite cross-border investments, and will play an important role in promoting the internationalisation of the renminbi. In Africa, long term commitments such as the Chinese-led railway project in Kenya and the 600-megawatt Karuma Hydroelectric Power Station, currently under construction in Uganda, will generate demand for the currency and act as drivers to facilitate Renminbi usage. As the Belt and Road initiative continues to foster financial cooperation and trade in Africa, it makes economic sense for countries along the modern ‘Silk Road’ to use the Chinese currency.
A strategic currencyIn 2016, policymakers in China pivoted towards an agenda of economic stability, inadvertently allowing the renminbi internationalisation project to find its own feet for the first time. According to SWIFT data from March 2018, the Renminbi is the sixth most active currency for domestic and cross-border payments, trailing the Canadian Dollar. However, the renminbi’s share for payments still accounts for only 1.62% of domestic and cross-border payments. Furthermore, data within this paper states that, despite more than 10% of payments from Africa ending up in China, the use of the renminbi remains low with only 0.1% of all payments.
Some are questioning whether recent events mark the end of the renminbi’s rapid growth or whether the currency’s place internationally is entering a phase of more strategic usage. In the context of the deepening trade relationship between China and Africa, it clearly points to a longer-term story whereby the renminbi will play a more strategic role in facilitating cross-border trade. According to SWIFT data, the number of inter-bank relationships between China and Africa has increased substantially from 20 in 2008 to 186 in 2017. In parallel, Chinese companies and banks are using the renminbi in trade with an increasing number of African countries and a number of those nations have included it in their baskets of currencies.
Ghana, Nigeria, Mauritius and Zimbabwe use the renminbi for payments and reserves, for instance, and the Nigerian central bank has 10% of its foreign reserves in the renminbi. With an expected rebound in China and Sub-Saharan Africa trade in 2018, we remain very confident in the renminbi’s usage and future in Africa; with the right support the currency will develop more meaningfully.
The next chapterSeveral important factors will need to align to facilitate the renminbi’s next growth phase in Africa.
Firstly, the increased use of the renminbi in African trade finance will need to be further supported by central banks to ensure continual traction. Numerous central banks across the continent are now using the renminbi as a reserve currency and many others have indicated their plans to expand their renminbi holdings.
This trend provides an incentive to African corporations to invoice more trade in renminbi and demonstrates to the market that confidence in China’s currency is increasing at an institutional level. As more favourable exchange rates and payment terms with Chinese counterparties become a reality for African corporations, we also expect to see increased liquidity and renminbi-based use.
Secondly, for volumes to stabilise in Africa and for corporations to take advantage of a maturing trade currency, the renminbi will need to be used more strategically. In our view, widespread adoption of the currency in Africa will not be a one-size fits all approach.
However, broader adoption of the renminbi will have greater potential to occur when FX markets develop further in Africa and renminbi pioneers gradually transition its usage from an export currency to a supply chain constituent. Furthermore, the development of more hedging solutions and broader in-house and third party renminbi expertise available to African corporations and banks will also promote more strategic usage.
Thirdly, it is essential for more knowledge to be shared with corporates. Providing a sustainable platform across the continent to ensure better understanding of the major renminbi considerations for corporates will be a vital step in this larger process. In this context, we see scope for the expansion of the risk management knowledge required to use a developing global currency.
To address these challenges, Africa will ultimately need to create a renminbi ecosystem to facilitate the next phase of trade finance across the continent. This will not happen overnight but will instead require both substantial domestic bank involvement and expertise from foreign players to succeed.
Views from Africa
Renminbi: Africa’s long-term trading currency?
By Philip Panaino Regional Head,Transaction Banking Africa & Middle East Standard Chartered

2929
Appendix
REGIONAL INITIATIVES IN AFRICA
Africa Payments: Insights into African transaction flows

3030
Africa comprises 54 countries with disparate economies. There is significant political support for regional integration initiatives as a means to create employment, act as a catalyst for investment and foster growth in Africa. Some of these involve a high degree of integration and a common currency, while others are relatively inactive.
In terms of transaction volumes, the SADC region dominates the African continent thanks to the large contribution of South Africa. However, other regional unions are showing increasingly strong growth.
The following section takes a closer look at the different regional initiatives and provides transaction flows across two metrics: overview of the main commercial and financial counterparties for outgoing payments; and distribution by counterparty region for intra-Africa financial flows.
Appendix: Regional Initiatives in Africa
Commercial payments sent from Africa by integration regions
African regions
Live and delivered MT 103, transactions sent from Africa by integration regions since 2003
2003 2004 2005 2006 2007 2008 2009 2010 2011 2012 2013 2014 2015 2016 2017
EAC
SADC
Others
ECOWAS – WAEMU/UEMOA(BCEAO)
ECCAS – EMCCA/CEMAC(BEAC)
ECCAS – EMCCA/CEMAC(BEAC)
Maghreb
EAC
SADC
ECOWAS –WAMZ
others
ECOWAS –WAEMU/UEMOA(BCEAO)
ECCAS –EMCCA/CEMAC(BEAC)
Maghreb
Source: SWIFT BI Watch
Source: SWIFT BI Watch
Africa Payments: Insights into African transaction flows

31
Africa Payments: Insights into Africa transaction flows
31
African regions
Appendix: Regional Initiatives in Africa
EAC – Distribution of outgoing payment flows
EAC – Intra-Africa financial counterparties
EAC – East African Community
The East African Community (EAC) is the regional intergovernmental organisation with a mission to widen and deepen economic, political and social integration in order to improve the quality of life of the people of East Africa.
The Treaty for the Establishment of EAC was signed in November 1999 and entered into force in July 2000 by the original three partner states - Kenya, Tanzania and Uganda. Rwanda and Burundi became full Members of the Community in July 2007. South Sudan acceded to the Treaty in April 2016 and became a full member in August 2016.
According to EAC, the regional integration process is in full swing, as reflected by the encouraging progress of the East African Customs Union, the establishment of the Common Market in 2010 and the implementation of the East African Monetary Union Protocol.
The Africa Regional Integration Index Report 2016 highlighted that the EAC is the top performing Regional Economic Community on regional integration overall and in particular in areas of trade and infrastructure development.
CURRENT STATUSThe process towards an East African Federation is being fast tracked, underscoring the serious determination of the East African leadership and citizens to construct a powerful and sustainable East African economic and political bloc.
The East African Regional Payment System (EAPS) was launched in November 2013 with Kenya, Tanzania and Uganda. Rwanda successfully joined the EAPS in December 2014 and Burundi is expected to connect this year. The regional payment platform facilitates intra-regional trade by allowing easier, faster, cheaper and secure transfer of funds by both importers and exporters.
NEXT STEPS – TOWARDS A MONETARY UNION?As part of their regional integration, the EAC Treaty laid the groundwork for a monetary union by 2023. It aims to harmonise monetary and fiscal policies, payment and settlement systems, financial accounting and reporting practices and eventually establish an East African Central Bank.
EACMember States: The Republic of Burundi, Kenya, Rwanda, South Sudan, the United Republic of Tanzania, and the Republic of UgandaPopulation: 145.5 million (2015)Land area: 1.82 million km²GDP (nominal): USD 147.5 billion (2015)
Commercial counterparty Financial counterparty
Number of cross-border MT 103 sent from Africa, FY 2017
Africa
%
Asia-Pacific
Central & Latin America
Europe – Non Euro Zone
Europe – Euro Zone
North America
Middle East
27
10
35
8
9
12
8
7
6
11
65
MT 103 sent intra Africa, FY 2017
EAC
SADC
ECOWAS –WAMZ
BEAC
ECOWAS –WAEMU/UEMOA(BCEAO)
ECCAS
Maghreb
5442
2 2
%
Source: SWIFT BI Watch
Source: SWIFT BI Watch
Source: East African Community

32
Africa Payments: Insights into Africa transaction flows
SADC – Distribution of outgoing payment flows
SADC – Intra-Africa financial counterparties
SADC – Southern African Development Community
The Southern African Development Community (SADC) aims to achieve economic development, peace, security and growth, alleviate poverty, and enhance the standard and quality of life of the people of Southern Africa through regional integration.
CURRENT STATUSSADC has commenced the process of formulating a new cooperation and regional integration strategy. The Regional Indicative Strategic Development Plan (RISDP), which was first approved by SADC leaders in 2003 and revised in 2015 is expected to end in 2020. A new development blueprint will be drafted to shape Southern Africa’s regional integration agenda post-2020.
The SADC regional cross-border settlement system – SADC Integrated Regional Electronic Settlement System (SIRESS) – has been in operation since July 2013. The current system settles payments denoted in ZAR (South African rand) only but additional currencies will be added to the system in the near future, starting with the US dollar which is planned for late 2018.
NEXT STEPS – CRAFTING NEW SADC STRATEGIES?The post-2020 SADC Development Cooperation Vision 2050 should provide a framework for a long-term vision for SADC as the region seeks to position itself in a context of emerging global and continental issues, including increasing financial instability.
In the shorter term, SADC’s focus seems to be on extending and/or creating a new payment platform to serve the growing need of intra-SADC credit transfers (i.e. cross-border remittances, mobile payments, etc). Today, they are processed informally and/or formally at a relatively high cost and many people still do not have access to formal mechanisms in order to send cross-border remittances.
Planning is also underway for SIRESS to extend settlement in multiple currencies. The access criteria to the regional payment platform may need to be reviewed in order to facilitate various intra-SADC financial flows; however, legal or regulatory harmonisation could take a long time.
SADCMember States: Angola, Botswana, Comoros (since 20 August 2017), Democratic Republic of Congo, Lesotho, Madagascar, Malawi, Mauritius, Mozambique, Namibia, Seychelles, South Africa, Swaziland, United Republic of Tanzania, Zambia, ZimbabwePopulation: 277 millionLand area: 9.88 million km²GDP: USD 1,193 billion (2013 estimate)
Commercial counterparty Financial counterparty
Number of cross-border MT 103 sent from Africa, FY 2017
Africa
%
Asia-Pacific
Central & Latin America
Europe – Non Euro Zone
Europe – Euro Zone
North America
Middle East
29
17
23
21
9
15
23
1
1
9
3
9
39
MT 103 sent intra Africa, FY 2017
EAC
SADC
ECOWAS –WAMZ
BEAC
ECOWAS –WAEMU/UEMOA(BCEAO)
ECCAS
Maghreb
2 2
3
92
%
Appendix: Regional Initiatives in Africa
Source: SWIFT BI Watch
Source: SWIFT BI Watch
Source: SADC
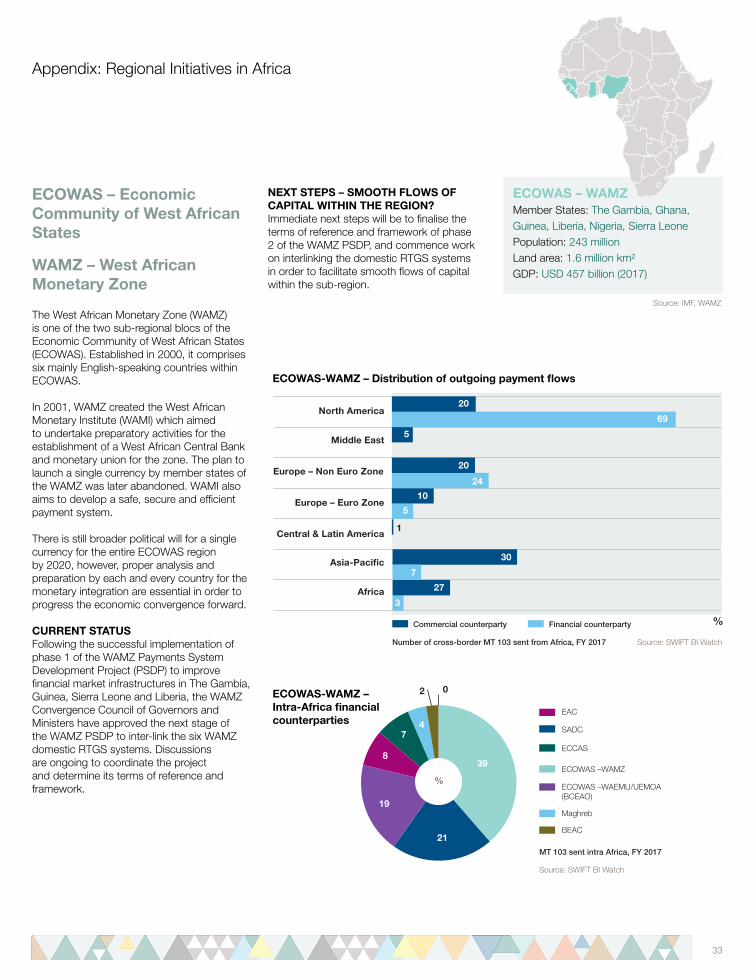
33
Appendix: Regional Initiatives in Africa
ECOWAS – Economic Community of West African States
WAMZ – West African Monetary Zone
The West African Monetary Zone (WAMZ) is one of the two sub-regional blocs of the Economic Community of West African States (ECOWAS). Established in 2000, it comprises six mainly English-speaking countries within ECOWAS.
In 2001, WAMZ created the West African Monetary Institute (WAMI) which aimed to undertake preparatory activities for the establishment of a West African Central Bank and monetary union for the zone. The plan to launch a single currency by member states of the WAMZ was later abandoned. WAMI also aims to develop a safe, secure and efficient payment system.
There is still broader political will for a single currency for the entire ECOWAS region by 2020, however, proper analysis and preparation by each and every country for the monetary integration are essential in order to progress the economic convergence forward.
CURRENT STATUSFollowing the successful implementation of phase 1 of the WAMZ Payments System Development Project (PSDP) to improve financial market infrastructures in The Gambia, Guinea, Sierra Leone and Liberia, the WAMZ Convergence Council of Governors and Ministers have approved the next stage of the WAMZ PSDP to inter-link the six WAMZ domestic RTGS systems. Discussions are ongoing to coordinate the project and determine its terms of reference and framework.
NEXT STEPS – SMOOTH FLOWS OF CAPITAL WITHIN THE REGION?Immediate next steps will be to finalise the terms of reference and framework of phase 2 of the WAMZ PSDP, and commence work on interlinking the domestic RTGS systems in order to facilitate smooth flows of capital within the sub-region.
ECOWAS – WAMZMember States: The Gambia, Ghana, Guinea, Liberia, Nigeria, Sierra LeonePopulation: 243 millionLand area: 1.6 million km²GDP: USD 457 billion (2017)
ECOWAS-WAMZ – Distribution of outgoing payment flows
ECOWAS-WAMZ – Intra-Africa financial counterparties
Commercial counterparty Financial counterparty
Number of cross-border MT 103 sent from Africa, FY 2017
Africa
%
Asia-Pacific
Central & Latin America
Europe – Non Euro Zone
Europe – Euro Zone
North America
Middle East
27
3
30
10
24
20
5
7
5
20
69
1
MT 103 sent intra Africa, FY 2017
EAC
SADC
ECOWAS –WAMZ
BEAC
ECOWAS –WAEMU/UEMOA(BCEAO)
ECCAS
Maghreb
2 0
39
21
8
74
19
%
Source: SWIFT BI Watch
Source: SWIFT BI Watch
Source: IMF, WAMZ
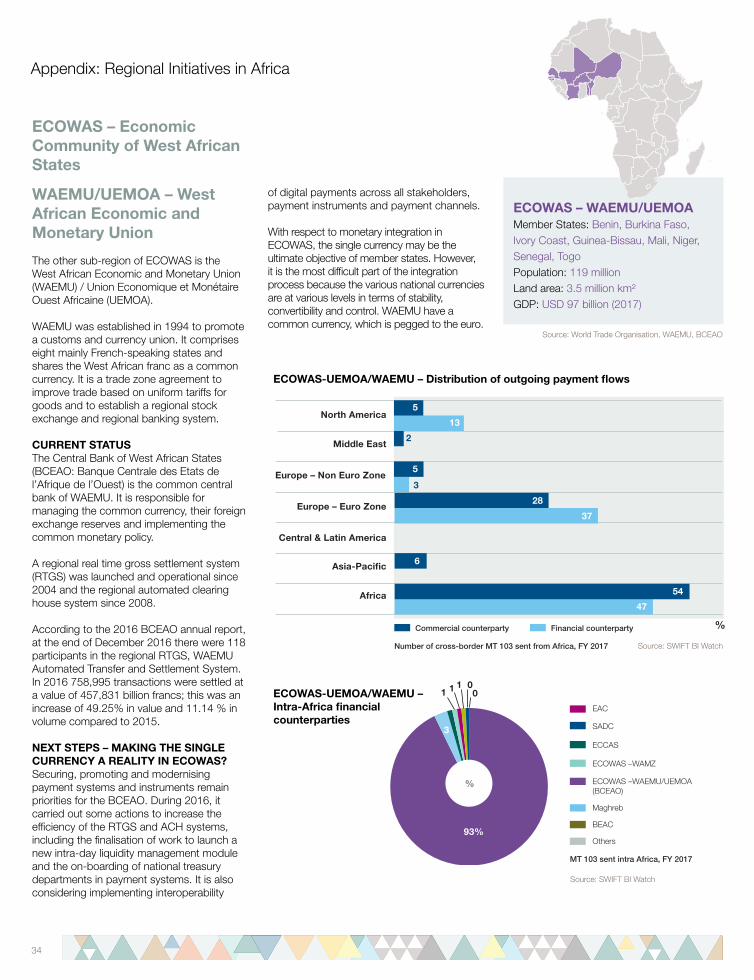
34
Africa Payments: Insights into Africa transaction flows
ECOWAS-UEMOA/WAEMU – Distribution of outgoing payment flows
ECOWAS-UEMOA/WAEMU –Intra-Africa financial counterparties
WAEMU/UEMOA – West African Economic and Monetary Union
The other sub-region of ECOWAS is the West African Economic and Monetary Union (WAEMU) / Union Economique et Monétaire Ouest Africaine (UEMOA).
WAEMU was established in 1994 to promote a customs and currency union. It comprises eight mainly French-speaking states and shares the West African franc as a common currency. It is a trade zone agreement to improve trade based on uniform tariffs for goods and to establish a regional stock exchange and regional banking system.
CURRENT STATUSThe Central Bank of West African States (BCEAO: Banque Centrale des Etats de l’Afrique de l’Ouest) is the common central bank of WAEMU. It is responsible for managing the common currency, their foreign exchange reserves and implementing the common monetary policy.
A regional real time gross settlement system (RTGS) was launched and operational since 2004 and the regional automated clearing house system since 2008.
According to the 2016 BCEAO annual report, at the end of December 2016 there were 118 participants in the regional RTGS, WAEMU Automated Transfer and Settlement System. In 2016 758,995 transactions were settled at a value of 457,831 billion francs; this was an increase of 49.25% in value and 11.14 % in volume compared to 2015.
NEXT STEPS – MAKING THE SINGLE CURRENCY A REALITY IN ECOWAS?Securing, promoting and modernising payment systems and instruments remain priorities for the BCEAO. During 2016, it carried out some actions to increase the efficiency of the RTGS and ACH systems, including the finalisation of work to launch a new intra-day liquidity management module and the on-boarding of national treasury departments in payment systems. It is also considering implementing interoperability
ECOWAS – Economic Community of West African States
of digital payments across all stakeholders, payment instruments and payment channels.
With respect to monetary integration in ECOWAS, the single currency may be the ultimate objective of member states. However, it is the most difficult part of the integration process because the various national currencies are at various levels in terms of stability, convertibility and control. WAEMU have a common currency, which is pegged to the euro.
ECOWAS – WAEMU/UEMOA Member States: Benin, Burkina Faso, Ivory Coast, Guinea-Bissau, Mali, Niger, Senegal, TogoPopulation: 119 millionLand area: 3.5 million km²GDP: USD 97 billion (2017)
Commercial counterparty Financial counterparty
Number of cross-border MT 103 sent from Africa, FY 2017
Africa
%
Asia-Pacific
Central & Latin America
Europe – Non Euro Zone
Europe – Euro Zone
North America
Middle East
54
47
6
3
28
37
2
5
5
13
MT 103 sent intra Africa, FY 2017
EAC
SADC
ECOWAS –WAMZ
BEAC
Others
ECOWAS –WAEMU/UEMOA(BCEAO)
ECCAS
Maghreb
111 00
3
93%
%
Appendix: Regional Initiatives in Africa
Source: SWIFT BI Watch
Source: SWIFT BI Watch
Source: World Trade Organisation, WAEMU, BCEAO

35
Arab Maghreb Union– Distribution of outgoing payment flows
Arab Maghreb Union – Intra-Africa financial counterparties
AMU – Arab Maghreb Union
The Arab Maghreb Union (AMU) was founded in February 1989 with a primary aim to progress free movement of people, goods, services and capital by eventually establishing a Maghreb economic union between the member states.
CURRENT STATUS The union is not active due to various challenges and only the most basic level of cooperation exists today between the regions’ five countries.
AMUMember States: Algeria, Libya, Mauritania, Morocco, TunisiaPopulation: 94.2 million Land area: 5.8 million km²GDP: USD 425 billion (2016)
MT 103 sent intra Africa, FY 2017
EAC
SADC
ECOWAS –WAMZ
BEAC
Others
ECOWAS –WAEMU/UEMOA(BCEAO)
ECCAS
Maghreb
89
7
0011
2
%
Commercial counterparty Financial counterparty
Number of cross-border MT 103 sent from Africa, FY 2017
Africa
%
Asia-Pacific
Central & Latin America
Europe – Non Euro Zone
Europe – Euro Zone
North America
Middle East
5
6
4
66
75
3
1
1
6
13
18
Appendix: Regional Initiatives in Africa
Source: SWIFT BI Watch
Source: SWIFT BI Watch
Source: United Nations Conference on Trade and Development statistical database (2016)

36
Africa Payments: Insights into African transaction flows
ECCA EEAC – Distribution of outgoing payment flows
ECCAS/CEEAC – Intra-Africa financial counterparties
ECCAS/CEEAC
The Economic Community of Central African States (ECCAS; in French: Communauté Économique des États de l’Afrique Centrale, CEEAC) was established in October 1983 to promote regional economic co-operation in Central Africa.
ECCAS aims to achieve collective autonomy, raise the standard of living of its populations and maintain economic stability through harmonious cooperation. The Community also focuses on security and defence cooperation to establish and sustain regional stability.
CURRENT STATUSIn July 2004, ECCAS launched its free trade area with the aim of establishing a customs union of common external tariff by 2008. However, the timetable for establishing the free trade area has been postponed.ECCAS is implementing trade facilitation programmes, including the construction of one-stop border posts that are becoming more frequent in the region.
NEXT STEPS – MAINTAINING PEACE AND SECURITY The central aim to create a Central African single market and free movement of goods and services is only possible based on the peace and security cooperation. Through the Council for Peace and Security in Central Africa, and a mandate to form a Free Trade Area as part of the African Economic Community, the Community’s focus is shifting towards maintenance and consolidation of peace and security in the area covered by ECCAS.
ECCAS/CEEACMember States: Angola, The Republic of Burundi, Cameroon, Central African Republic, Chad, Congo, Democratic Republic of the Congo, Equatorial Guinea, Gabon, Rwanda, and Sao Tome and PrincipePopulation: 158.3 million (2014)Land area: 6.5 million km²GDP (nominal): USD 257.8 billion (2014)
Commercial counterparty Financial counterparty
Number of cross-border MT 103 sent from Africa, FY 2017
Africa
%
Asia-Pacific
Central & Latin America
Europe – Non Euro Zone
Europe – Euro Zone
North America
Middle East
26
8
12
3
5
44
60
4
2
6
6
24
MT 103 sent intra Africa, FY 2017
EAC
SADC
ECOWAS –WAMZ
BEAC
Others
ECOWAS –WAEMU/UEMOA(BCEAO)
ECCAS
Maghreb
3
6
7
26
26
31
1
%
Appendix: Regional Initiatives in Africa
Source: SWIFT BI Watch
Source: SWIFT BI Watch
Source: United Nations Conference on Trade and Development statistical database (2016), Understanding regional economic policies in Central Africa, Bruce Byiers

37
Africa Payments: Insights into African transaction flows
EMCCA/CEMAC (BEAC)– Distribution of outgoing payment flows
EMMCA/CEMAC – Intra-Africa financial counterparties
EMCCA/CEMAC (BEAC)
The Economic and Monetary Community of Central Africa (more commonly known as CEMAC from its name in French, Communauté Économique et Monétaire de l’Afrique Centrale) was created in 1994 to replace the previous largely neglected customs union that had been established in the 1960s. It became operational after the treaty’s ratification in 1999.
CEMAC operates a customs union and monetary union. The monetary union is in place with the Central Africa franc as a common currency.
CURRENT STATUS The Monetary union is underpinned by the Bank of Central African States (BEAC, Banque des Etats de L’Afrique Centrale, the central bank serving six member states). The regional RTGS system was launched as part of the framework of payment and financial infrastructure modernisation project and it has been operational since 2007.
Movement of capital within CEMAC is free and, in theory, tariffs have been eliminated on trade within CEMAC. Most recently the free movement of people and goods within CEMAC was established in October 2017.
NEXT STEPS – STRENGTHENING THE FOUNDATIONThe fall of oil prices in 2014 has highlighted the structural weaknesses suffered by the countries of CEMAC, including the strength of the common currency. This has forced member states to adopt structural reforms to strengthen budget management, the fight against corruption, improve the business environment and reduce macro-economic imbalances.
EMCCA/CEMACMember States: Cameroon, Central African Republic, Chad, Republic of Congo, Equatorial Guinea, GabonPopulation: 51 million (2015)Land area: 5.8 million km²GDP: XAF 46,449 billion (2015)
4
Commercial counterparty Financial counterparty
Number of cross-border MT 103 sent from Africa, FY 2017
Africa
%
Asia-Pacific
Central & Latin America
Europe – Non Euro Zone
Europe – Euro Zone
North America
Middle East
36
14
6
34
46
3
6
7
5
37
3
46
13
37
37
MT 103 sent intra Africa, FY 2017
EAC
SADC
ECOWAS –WAMZ
BEAC
Others
ECOWAS –WAEMU/UEMOA(BCEAO)
ECCAS
Maghreb
%
Appendix: Regional Initiatives in Africa
Source: SWIFT BI Watch
Source: SWIFT BI Watch
Source: CEMAC, IMF Country Report No. 17/389

38
Africa Payments: Insights into Africa transaction flows
COMESA – Distribution of outgoing payment flows
COMESA – Intra-Africa financial counterparties
COMESA – Common Market for East and Southern Africa
The Common Market for East and Southern Africa (COMESA) was established in 1994 to replace the Preferential Trade Area for Eastern and Southern Africa (PTA) which was set up in 1981. The Free Trade Area was achieved in October 2000 with an aim to eliminate tariffs on goods traded among the member states. It also launched its Customs Union in June 2009, which is yet to be operational. COMESA envisages becoming a full Economic Community by 2025.
CURRENT STATUSStrengthening of market integration is the main strategic objective of COMESA in its Medium Term Strategic Plan 2016-2020, which includes trade facilitation through simplification and harmonisation of documents and procedures, and lowering the cost of cross-border trade through the removal of trade barriers.
With regard to the payment market infrastructure, COMESA Regional Payment and Settlement System (REPSS), has been live since February 2014, which aims to facilitate cross-border payments within the COMESA region. The system settles payments denominated in US dollars and euros.
NEXT STEPS – STRENGTHENING OF KEY REGIONAL SECTORSAccording to the medium term strategic plan 2016-2020 for COMESA, there will be concerted efforts in the areas of implementation of the agreed commitments in the four priority sectors namely: transport, communication, financial and tourism services.
COMESAMember States: Burundi, Comoros, Democratic Republic of the Congo, Djibouti, Egypt, Eritrea, Ethiopia, Kenya, Libya, Madagascar, Malawi, Mauritius, Rwanda, Seychelles, Republic of Sudan, Swaziland, Uganda, Zambia, ZimbabwePopulation: 492.5 millionLand area: 12 million km²GDP: USD 657.4 billion (2014)
11
2
11
19
66
MT 103 sent intra Africa, FY 2017
EAC
SADC
ECOWAS –WAMZ
BEAC
Others
COMESA
ECOWAS –WAEMU/UEMOA(BCEAO)
ECCAS
Maghreb
%
Commercial counterparty Financial counterparty
Number of cross-border MT 103 sent from Africa, FY 2017
Africa
%
Asia-Pacific
Central & Latin America
Europe – Non Euro Zone
Europe – Euro Zone
North America
Middle East
32
13
25
6
8
16
18
2
9
13
54
6
Appendix: Regional Initiatives in Africa
Source: SWIFT BI Watch
Source: United Nations Economic Commission for Africa
Source: SWIFT BI Watch

39
SWIFT works with many countries to deliver Real Time Gross Settlement (RTGS) systems that equip domestic economies with robust settlement and risk management systems, as well as systems that interlink the RTGS with ancillary systems, such as: central securities depositories; automated clearing houses; and card, point of sale and government securities systems.
SWIFT is also supporting the development of regional payment infrastructures that have cross-border reach and support multiple currencies, including: the Southern African Development Community’s Regional Electronic Settlement System (SIRESS), the West African States’ central bank (BCEAO), the Central African States’ central bank (BEAC), the East African Payments System, and the West Africa Monetary Zone.
StandardsSWIFT is also facilitating Africa’s push for regional harmonisation through its strong implementation of messaging standards.
Financial messaging standards sit at the heart of virtually all economic activity, from executing the smallest retail transactions to managing massive global institutional businesses. Standards are vital to allow for a common understanding of data across linguistic and systems boundaries, and to permit the seamless, automated transmission, receipt and processing of communications exchanged between users. Use of standardised messages and reference data ensures that data exchanged between institutions is unambiguous and machine friendly; in turn this enables efficient automation, thereby reducing costs and mitigating risks.
In its role as a financial messaging standardiser, SWIFT’s Standards Group works with the financial community to define standards for these messages. SWIFT plays a key part in integrating IS020022 across the banks on the network and would relish the opportunity to assist African banks in this work.
Financial Crime ComplianceAs regulators across Africa and in more advanced economies demand greater tools for detection and prevention of money-laundering, terrorist financing and fraud, the
implementation of measures that prevent illegal behavior becomes an increasing challenge for local banks.
Penalties for non-compliance with rules and regulations can be severe. Smaller banks in particular risk losing valuable correspondent relationships with banks overseas if they cannot demonstrate their compliance with the rules and regulations.
To assist customers’ compliance with these rules, SWIFT provides a growing range of products and services whether through the development of appropriate messaging standards, products, processes or services.
SWIFT has been providing solutions for Financial Crime Compliance to the community since 2012 and currently serves more than 120 customers in 37 countries in Africa alone.
CybersecuritySWIFT takes cybersecurity very seriously: it is core to the service it offers – a secure and reliable communications channel.
Cybercrime is becoming increasingly sophisticated and far reaching. SWIFT believes that a community-based approach can best confront this challenge and therefore launched the SWIFT Customer Security Programme (CSP) in 2016 to reinforce the security of the global financial ecosystem. The CSP assists customers in protecting and securing their local environments, in preventing and detecting fraud and in sharing fraud-related information.
All of SWIFT’s 11,000+ customers from more than 200 jurisdictions around the world have been directly targeted and reached through the Customer Security Programme. In Africa, webinars and workshops, roadshows and roundtables, training sessions and bootcamps have been held since the CSP’s launch, attracting 1300 attendees in more than 30 countries.
SWIFT Corporate Social Responsibility SWIFT integrates social, environmental, ethical, and human rights concerns into its operational strategy. SWIFT sponsors a wide range of charities in Africa with a special focus on education and under-privileged children.
SWIFT in Africa
Africa is an important region for SWIFT. SWIFT traffic growth across the continent is impressive with year-on-year growth exceeding 10% for the last decade. SWIFT opened its first African office in Johannesburg, South Africa in 2002. It has since expanded its footprint, opening two new offices in Accra, Ghana and Nairobi, Kenya to get closer to its customers.
National Member and User GroupsTo ensure that activity on the continent matches the needs of the African community, SWIFT works closely with Member and User groups in more than 40 countries on the continent. These represent SWIFT shareholders and users, and serve in an advisory capacity to the Board of Directors and SWIFT management. In addition, each group supports the interests of the shareholders and users of the nation they represent by coordinating their views and feeding this back to SWIFT.
Bringing the African financial community togetherSWIFT holds numerous events across Africa to bring together the African financial community. The African Regional Conference is the flagship event, attracting about 500 leading financial services executives from more than 45 countries across Africa, including financial institutions, market infrastructures, international corporations and technology partners to do business and shape the future of Africa’s financial industry. Additionally, SWIFT holds business forums across the region that focus on the interests of particular communities.
Supporting domestic and regional infrastructureSWIFT is supporting the development of Africa’s financial infrastructure and connects and serves more than 25 market infrastructures across the continent. The adoption of SWIFT for a payments market infrastructure leads to major improvements in stability, efficiency, interoperability and cost reduction for financial institutions and regulators alike – something that’s vitally important in fast-growing markets like those in Africa.
Africa Payments: Insights into African transaction flows

© SWIFT 2018June 2018
About SWIFT
SWIFT is a global member-ownedcooperative and the world’s leadingprovider of secure financial messagingservices.
We provide our community with aplatform for messaging and standardsfor communicating, and we offerproducts and services to facilitateaccess and integration, identification,analysis and financial crime compliance.Our messaging platform, products andservices connect more than 11,500banking and securities organisations,market infrastructures and corporatecustomers in more than 200 countriesand territories, enabling them tocommunicate securely and exchangestandardised financial messages in areliable way.
As their trusted provider, we facilitateglobal and local financial flows, supporttrade and commerce all aroundthe world; we relentlessly pursueoperational excellence and continuallyseek ways to lower costs, reduce risksand eliminate operational inefficiencies.Headquartered in Belgium, SWIFT’sinternational governance and oversightreinforces the neutral, global characterof its cooperative structure. SWIFT’sglobal office network ensures an activepresence in all the major financial centres.
Disclaimer
This report is provided for informationonly. If the customer or any third partydecides to take any course of actionor omission based on this report and/or any conclusion contained therein,they shall do so at their own risk andSWIFT shall not be liable for any lossor damage, arising from their acts oromissions based on this report and/or any recommendations containedtherein.
To find out more
The SWIFT Africa Payments WhitePaper is based on unique dataand analysis from SWIFT BusinessIntelligence. This portfolio of tools,including analytics, insights andeconomic indicators, provides granulardetail on your SWIFT traffic across avariety of metrics, including currency,product type and value, and enablesyou to track market evolution. Thishelps financial institutions to makefact-based business decisions andmore efficient use of their resources,and to identify market trends. Formore information on SWIFT BusinessIntelligence and other services, pleasecontact SWIFT.
Denis KrugerHead of Sub-Sahara Africa, [email protected]
Sophia LyscomCommunications & Events,EMEA, [email protected]
SWIFT contributors Tom CallaertLeah CapiliThierry ChilosiGeraldine LambeSophia LyscomMichimaru Onizuka