Embed Size (px)
Citation preview

Aflatoxin Redux: Does European Aflatoxin Regulation Hurt Groundnut Exporters from Africa?
Bo Xiong [email protected]
Department of Economics Iowa State University
John Beghin Department of Economics
Iowa State University
Selected Paper prepared for presentation at the Agricultural & Applied Economics Association 2010 AAEA,CAES, & WAEA Joint Annual Meeting, Denver, Colorado, July 25-27, 2010
Copyright 2010 by Bo Xiong and John Beghin. All rights reserved. may make verbatim copies of this document for non-commercial purposes by any means, provided that this copyright notice appears on all such copies.

Aflatoxin Redux: Does European Aflatoxin Regulation Hurt Groundnut Exporters from
Africa?
May 28, 2010
Bo Xiong
John Beghin*
Iowa State University
Abstract
We provide an ex-post econometric examination of the harmonization and tightening of the EU
Maximum Residues Limit (MRL) on aflatoxins in 2002 and its impact on African exports of
groundnut products. We show that the MRL set by the EU has no significant trade impact on
groundnut exports from Africa across various methods of estimation. African domestic supply
plays an important role in the determination of the volumes of trade and the propensity to trade.
Our findings suggest that the trade potential of African groundnut exporters is more constrained
by domestic supply issues rather than by limited market access.
Keywords: food safety, standards, aflatoxin, MRL, groundnut, Africa, EU, market access
JEL Code: Q17, F13
* Contact author: Bo Xiong at [email protected]. Bo Xiong is a graduate student in Economics, Department of Economics, Iowa State University. John Beghin is Marlin Cole Professor of International Agricultural Economics, Department of Economics, Iowa State University. The authors thank John Wilson and Tsunehiro Otsuki for providing their original data set, Dominique van der Mensbrugghe for providing further data, and John Schroeter and workshop participants at Iowa State University for comments. The usual disclaimer applies.
1

1. Introduction
Aflatoxins are a group of toxic metabolites produced by certain fungi in agricultural
commodities. They are commonly found in agricultural crops such as corn, peanuts, coconuts,
cassava and their food and feed products. Scientific research shows that aflatoxin B1, M1, and
G1 can cause various types of cancer in both animal species and humans. Evidence of acute
aflatoxicosis in humans has been reported from many parts of the world with grim morbidity and
mortality.1 Chronic intake of aflatoxin in animals can lead to poor food intake and weight loss.
Due to their demonstrated potent health effect to both animals and humans, aflatoxins
regulations have received great attention in food policy design and debates. Although some good
practice based on current scientific knowledge and technical improvements can effectively
reduce the level of contamination, the entire elimination of the presence of aflatoxin in foodstuff
is not possible. Therefore, certain Maximum Residue Limits (MRLs) are commonly adopted as
the policy instrument to control for the aflatoxin contamination in the food supply. While a tight
MRL on aflatoxins generates health benefits, it also induces various costs such as regulatory and
administrative costs, compliance costs borne by producers, and plausible forgone trade revenues
borne by some foreign exporters failing the MRL.
The European Union (EU)’s harmonization of the MRLs on aflatoxins in 2002 has
highlighted these tradeoffs and initiated a controversy. Prior to 2002, member countries in the
EU set their MRLs individually (FAO (1995)). In April 2002, the EU formally adopted a unified
MRL policy on aflatoxin contaminants (European Communities (2001) and (2002)). In
December 2006, the EU modified the harmonized maximum levels for certain contaminants in
foodstuffs, but the policy regarding aflatoxin remained (European Communities (2006)). The
1 The syndrome of aflatoxicosis is characterized by vomiting, abdominal pain, pulmonary edema, convulsions, coma, and death with cerebral edema and fatty involvement of the liver, kidneys, and heart.
2

harmonized EU aflatoxin standards, from several perspectives, have been more stringent than the
Codex Alimentarius, which contains the international standards recommended by the Food and
Agriculture Organization (FAO) and World Health Organization (WHO). First, the EU policy
targets specific aflatoxin compounds. Not only the EU policy sets a MRL for the total aflatoxin
level as Codex does, it also imposes a MRL on aflatoxin B1, which is by far the most toxic
compound in the aflatoxin family. Second, the EU MRLs are much lower than Codex. Figure 1
illustrates EU’s harmonization and its departure from Codex in setting MRLs on aflatoxin B1 for
edible groundnuts.
Figure 1: EU and Codex MRLs on aflatoxin B1 for edible groundnuts
10
10
10
10
10
10
10
10
10
10
10
10
10
10
2
2
2
2
2
2
2
2
2
2
2
2
2
2
2
1
2.5
5
25
5
5
5
2
1
2.5
2
5
1
United Kingdom
Switzerland
Sweden
Spain
Portugal
Netherlands
Italy
Ireland
Germany
France
Finland
Denmark
Belgium-Luxemburg
AustriaPre-harmonized MRLsEU harmonized MRLCodex MRL
Notes: Data sources are FAO (1995), FAO (2004) and European Communities (2001) and (2002). Codex sets a MRL of 15 ppb on total aflatoxin contaminants. Science suggests that some 70% of the total aflatoxins can be attributed to Aflatoxin B1. Therefore, the Codex MRL on Aflatoxin B1 is roughly 10 ppb. FAO (2004) shows that Switzerland, a non-EU member, has aligned itself on the EU 2- ppb MRL on aflatoxin B1 since 2002.
3
4
The strictness of the EU standards has triggered serious concerns among exporters to the
EU market that the EU has abused the Agreements on Sanitary and Phytosanitary (SPS)
Measures of the World Trade Organization (WTO) and created a protectionist SPS regulation.
Groundnut exporters from Africa, in particular, have been generally considered vulnerable to the
new regulations because of their high cost of compliance and their dependency on the EU market
as their largest export destination.
Otsuki, Wilson and Sewadeh (2001), in a noted paper, examined this very issue in the late
1990s by conducting a gravity equation analysis to a pre-harmonization dataset of EU MRLs and
trade flows. They found that the African exports of edible groundnuts and groundnut oil were
negatively affected by the MRL on aflatoxin set by EU member countries during 1989-1998.
Their simulation predicted that the harmonization and tightening of the standards in 2002 would
decrease African exports enormously. Notably, there are two limitations in this analysis. The first
one is the lack of time-variation of the MRL variable. The research was done before the
harmonization took place in 2002. During the period of examination 1989-1998, the only
available data source for the MRL policies on aflatoxin was FAO (1995), in which each country
reported the MRL it currently imposed on aflatoxin contaminants. Consequently, the MRL
observed for the single year had to be assumed to hold for the entire time period and only
exhibited cross-sectional variation. As we will elaborate later, this lack of time-variation of the
MRL variable makes its effect undistinguishable from the country-level “multilateral resistance”
terms or fixed effects (Anderson and van Wincoop (2003)).
The second limitation in Otsuki et al. comes from their deletion of the zero trade records.
Statistically, the elimination of zeros could result in the standard sample selection bias (Heckman
(1979)). Even if the sample selection issue does not bias the estimate of interest, the ignorance of

zero trade flows limits the economic interpretations of the model. First, the deletion of the zero
trade precludes exploring the extensive margin of trade, that is, the creation of new bilateral trade
partnership, and the role of MRL on this margin. In addition, all their estimates are conditioned
on trade already taking place and marginal effects of SPS measures and other trade costs are on
the intensive margin of trade. Nothing could be said on implications for new trade.
The harmonized EU aflatoxin regulations have been effective for several years and this
aflatoxin policy remains a plausible factor contributing to the vulnerability of African groundnut
export potential and market access. It is of much interest to reconsider the previous analysis and
re-examine whether groundnut exporters from Africa actually turn out to be impeded by the new
EU standards. This issue remains a major concern with development practitioners in particular.
For example, IFPRI has several field projects funded by the Bill and Melinda Gates Foundation
to explore the impact of aflatoxin MRLs on small African holders and new ways to overcome
phytosanitary issues in production and trade (IFPRI (2009)). Our investigation complements this
current fieldwork on aflatoxin and associated trade impediments.
Our analysis also contributes to the debate on Africa’s “under-trading” (Bouët, Mishra
and Roy (2008)). Africa trades less with the rest of the world than one would expect according to
various economic models, even after controlling for major trade costs and the size of the trading
economies. It remains a puzzle whether this African missing trade is more associated with the
limited access to the world market or to domestic factors within Africa. For example, Bouët,
Mishra and Roy (2008) incorporate various trade barriers in a gravity equation analysis and find
that African countries in general already have good market access and that the transport and
communication infrastructure can be held accountable for the under-trading phenomenon. Other
authors have emphasized the poor internal infrastructure of Many African Countries (Buys,
5
Deichmann, and Wheeler (2010)).
The purpose of our study is to provide an ex-post econometric examination of the
harmonization and tightening of EU MRL on aflatoxins in 2002 and its impact on African
exports of groundnut products. By virtue of a state-of-the-art gravity model with corrections for
the sample selection bias, the ‘multilateral resistance’ terms, and the heterogeneity across firms,
we show two main results. First, MRLs set by EU have no significant impact on groundnut
exports from Africa across all methods of estimation. Two rationalizations can help interpret this
result. Either, the MRL regulations are non binding for African groundnut exporters because
other factors in production and before the border are binding impediments. As discussed below,
our second result favors this rationalization. Or, the alternative rationalization is that the tighter
MRL on aflatoxin does induce additional trade costs to African groundnut exporters, but it also
generates trade benefits because EU consumers value safer groundnut products from Africa. The
two effects could offset each other thus the net effect on trade is negligible.
The second result of our analysis is that domestic supply conditions in Africa play an
important role in the determination of both the trade volumes and the propensity to trade in
groundnut products. This result is consistent with the recent findings of Bouët et al. (2008) on the
lack of trade facilitation in Sub-Saharan Africa for all exports, and the extent to which the
missing trade is self-inflicted. Rios and Jaffee (2008) and Jaffee and Henson (2005) go one step
further and point out that the proliferation and increased stringency of food safety standards can
serve as a basis for the competitive repositioning of the developing world if developing countries
successfully upgrade capacity and improve the operation of their supply chains (Maertens and
Swinnen (2009)). Rios and Jaffee, and Jaffee and Henson also state that in several cases,
inspections reveal extreme violations of MRL regulations by African exports, including
6
violations of codex MRLs making the EU MRLs redundant. Consistent with the latter, our
findings cast doubt on the conventional wisdom of restrictive EU aflatoxin regulations. They
suggest the key importance of addressing domestic issues in production and trade facilitation in
Africa. In terms of groundnut products, improving the farm-level practice could reduce the
aflatoxin contaminants, increase yields, and eventually lead to more trade. These improvements
would lead to more consistent production of exportable products which could meet the MRLs.
The analysis is organized into 5 sections. Section 2 outlines our empirical strategy and
describes the data set. Section 3 presents the econometric models and the associated results.
Section 4 checks the robustness of the main results and summarizes the trade effects of the MRL
policy. Section 5 concludes the presentation. An appendix is available from the authors with
detailed results supplementing tables in the text.
2. Methodology and Empirical Strategy
Gravity equation models are widely used to infer trade flow effects of distance (Disdier and
Head (2006)), currency union (Rose and van Wincoop (2001)), common borders (McCallum
(1995)), tariffs (Baier and Bergstrand (2001)), technical barriers to trade (TBTs) (Maskus and
Wilson (2001)), fixed trade cost between countries (Helpman, Melitz and Rubinstein (2008)),
and other types of trade costs. The gravity equation approach posits that bilateral trade volume is
a function of the importer’s demand, the exporter’s supply, and various bilateral trade costs such
as tariffs, technical barriers, transportation costs, border effects, colonial ties, etc. One reason for
its popularity lies in the fact that the gravity equation fits the data well across a wide range of
applications in international trade. Despite its popularity, some recent research has raised
concerns about several widespread mistakes and biases in gravity equation applications to trade
7

(Anderson and van Wincoop (2003), Baldwin and Taglioni (2006), Helpman et al. (2008), and
Martin and Pham (2008) among others).
One strand of the research focuses on the micro-foundations of the gravity equation
model. Anderson and van Wincoop (2003) use a full expenditure system and market clearing
conditions to derive a gravity equation with country-specific ‘multilateral resistance’ terms,
which are often omitted in traditional gravity equation specifications. Baldwin and Taglioni
(2006) points out three mistakes, defined as golden, silver and bronze, often made in gravity
equation applications: the ignorance of ‘gravitational un-constant term’, which corresponds to
the above-mentioned country-specific ‘multilateral resistance’ term; the mistake in averaging
bilateral trade data; and the wrong deflators applied to GDP and trade series.
Another strand sheds light on several econometric problems associated with the gravity
equation approach to trade. The first problem is the sample selection bias as defined by Heckman
(1979). A commonly found feature in bilateral trade data is that zero trade records are frequent
across country-pairs and products, and that the zero trade flows could dominate when
disaggregated trade data are used. Martin and Pham (2008) show that failure in modeling such
limited dependency of the trade data can result in large biases for all estimates of interest.
Helpman, Melitz, and Rubinstein (2008) attribute the absence of trade to exporting firms’ self-
selection behavior. Accounting for heterogeneous productivity across firms, they establish a
generalized gravity equation that accommodates asymmetric trade flows, zero trade observations,
and the overlooked extensive margin from new firms entering export markets. The estimation of
their generalized gravity equation model does not require firm level data and can be implemented
via a two-stage modified Heckman procedure.
The second econometric problem associated with gravity equation models evolves around
8

heteroscedasticity. Silva and Tenreyro (2006) points out that because of the Jensen’s Inequality,
the parameters of a log-linearized gravity equation can not be interpreted as the true elasticities.
To circumvent this problem, they propose estimating the gravity equation model in its original
multiplicative form by a Poisson Pseudo-Maximum-Likelihood (PPML) method. Martin and
Pham (2008) compare different estimators in a Monte-Carlo experiment in which both
prevalence of zero trade and heteroscedasticity are present. Their results show that the Heckman
Maximum Likelihood estimator performs well if true identifying restrictions are available, and
that PPML solves the heteroscedasticity but yields biased estimates when zero trade observations
are frequent. In an application to the exports of U.S. corn seeds, Jayasinghe, Beghin and
Moschini (forthcoming) finds that PPML does not accommodate pervasive zeros well. Without a
consensus on which estimator to use to address the co-existence of the pervasive zero trade flows
and the heteroskedasticity issue, we apply different methods of estimation as explained later in
section 4. We consider Truncated Sample Ordinary Least Square, the Helpman-Melitz-
Rubinstein generalized gravity equation model, and the PPML approach and the Zero-Inflated
PPML approach. Inferences are then drawn based on a thorough comparison across all results to
develop a robust assessment.
3. Data Description
Our dataset builds upon the dataset of Otsuki et al. (2001). Three groundnut products are
considered: edible groundnuts, groundnut oil, and shelled groundnut (groundnut for further
processing). Bilateral trade volumes of each groundnut product between 14 European countries
(13 EU members: Austria, Belgium-Luxemburg, Denmark, Finland, France, Germany, Ireland,
9

Italy, Netherlands, Portugal, Spain, Sweden, plus Switzerland2) and 9 African countries (Chad,
Egypt, Gambia, Mali, Nigeria, Sudan, Senegal, South Africa, and Zimbabwe) are extracted from
United Nations COMTRADE records for the period 1989-2006.3 For MRL levels, we use Food
and Agriculture Organization (FAO)’s survey of worldwide regulations for mycotoxins in food
and feed (FAO (1995)), and Commission Regulation No 466/2001 on setting maximum levels
for certain contaminants in foodstuffs (European Commission (2001)). With these two sources,
we construct a MRL variable that indicates the MRLs on aflatoxin B1 imposed by each EU
member country in each year.4
An EU member country’s demand for groundnut exports is represented by its GDP
adjusted to 2000 US dollars (World Development Indicators, The World Bank) for any given
year. The annual domestic supply of a groundnut product in a given African country is proxied
by its total exports.5 To deal with the plausible endogeneity problem with this proxy, we also
extract food supply series from FAOSTAT database for robustness’ check. Our dataset also
contains a distance variable measuring the capital distances between country pairs, a colonial tie
dummy indicating whether trading partners had colonial relationship in history as described in
the original Otsuki et al. dataset,6 and a common language dummy that equals one if the trading
partners use the same official language. Table 1 provides summary statistics for data of the
2 We refer to all 14 importers of interest as EU member countries or the EU hereafter including Switzerland which has aflatoxin MRLs similar to the EU MRLs. 3 SITC Revision 1 codes 05172, 2211 and 4214 are used as the product categories for edible groundnut, shelled groundnut and groundnut oil, respectively. 4 Constrained by the data availability, we follow Otsuki et al. (2001) and assume that the MRLs reported in FAO (1995) hold for the period 1989-2001. The harmonized MRLs cover the period 2002-2006. 5 Though it is desirable to add African domestic consumptions to the African supply proxy, the consumption data in Africa is generally unavailable. We implicitly assume that domestic consumption only takes a negligible share of the total groundnut supply in Africa since they are an export crop. 6 Tariffs are other trade barriers. The TRAINS database shows that EU preferential tariff rates imposed on African countries are identically zero from 1995 on. Preferential tariff data prior to 1995 are not in TRAINS. The TARIC database contains some tariff information for some of the years between 1989 and 1995 showing not a single recorded tariff rate higher than 5%. Therefore, we assume away the impact of tariffs on the groundnut trade between the EU and the African countries 1989-2006 given the lack of variation over time. Tariffs were also ignored by Otsuki et al. (2001).
10

edible groundnut sector.
Table 1: summary statistics for the sector of edible groundnuts Mean Std. Dev. Min Max Unit Trade 0.0083 0.053 0 1.24 1000 metric tons MRL 3.86 5.13 1 25 parts per billion GDP_EU 544.42 549.54 45 2010 billions of 2000 U.S. $ Supply_AF1 1.01 2.36 0 14.01 1000 metric ton Supply_AF2 73.39 86.25 5.83 350.03 1000 metric ton Distance 5320.97 2005.84 2136.02 10489.44 kilometers Colonial tie 0.07 0.26 0 1 N.A. Common language 0.15 0.36 0 1 N.A.
Three features of our dataset are outstanding. First of all, zeros dominate the trade records
in all three groundnut products. 88% of the bilateral trade flows in edible groundnut between
African countries and the EU are zeros. This percentage is 90% for groundnut oil and 81% for
shelled groundnut. Some of these zero trade observations may be due to rounding errors or
incompleteness of the COMTRADE, but many others are more likely to reflect African
exporters’ reluctance or inability to trade, which could result from prohibitive fixed cost to
establish trade partnership with the EU member countries, including compliance costs to meet
the restrictive standards. Therefore, it is necessary to explicitly model this limited-dependency of
the trade data to accommodate the absence of trade.
Second, the MRL variable exhibits time variation due to the EU harmonization of
aflatoxin regulations in 2002, which allows us to disentangle the trade effect of the MRL policy
out of the country-level fixed effects. Lastly, our supply proxy originates in the sectoral approach
of the gravity equation and it is a supply measure in physical quantity rather than the GDP of the
exporter.7 We express the supply in metric tons rather than in dollars to avoid the problematic
deflation issues raised by Baldwin and Taglioni (2006).
7 Readers are referred to Henry de Frahan and Vancauteren (2006) for a brief discussion of the sectoral gravity equation application to disaggregated trade data.
11

4. Model Specifications and Results
We consider three estimators for the gravity equation model. The first one is the Truncated
Sample Ordinary Least Square (Trun-OLS hereafter), which is most commonly used in the
literature. Basically, it is an Ordinary Least Square estimator applied to a subsample that contains
positive observations only. In our context, the associated gravity equation is specified as follows:
)1(,
)ln()ln()ln()ln()0|ln(13
1
8
165
43210
ijtnn
knm
m
kmt
kij
k
ijkk
itk
jtkk
jtkkk
ijtk
ijt
DimDexYearDcol
DistSupplyGDPMRLYY
εγαββ
βββββ
+++++
++++=>
∑∑==
where βs, αs and γs are parameters to be estimated. A positive β1 suggests that the MRL on
aflatoxin is trade-impeding: the lower the tolerant level is, the less the bilateral trade flows are.
εijt is the classical idiosyncratic error term. The definition of each variable is presented in Table 2.
Table 2: definitions of variables Variable Name Definition
kijtY The trade volumes of groundnut product k from African country i to EU
member country j in year t kjtMRL The MRL applied to groundnut product k set by EU member country j
in year t jtGDP The GDP (in 2000 US dollars) of EU member country j in year t
kitSupply The total supply of groundnut product k in African country i in year t
ijDist The distance between African country i and EU member country j
ijDcol The colonial tie dummy for African country i and EU member country j
tYear Calendar year t
mDex The national dummy for African country ma
nDim The national dummy for EU member country nb Notes:
a. South Africa’s national dummy is excluded from the model to avoid multicollinearity. b. France’s national dummy is excluded from the model to avoid multicollinearity.
We estimate Equation (1) via Trun-OLS for each groundnut product separately and
summarize the results in Model (1), (3), and (5) of Table 3. To make the results comparable to
12
Otsuki et al. (2001), we also drop the 13 importer dummies8 and estimate the models again.
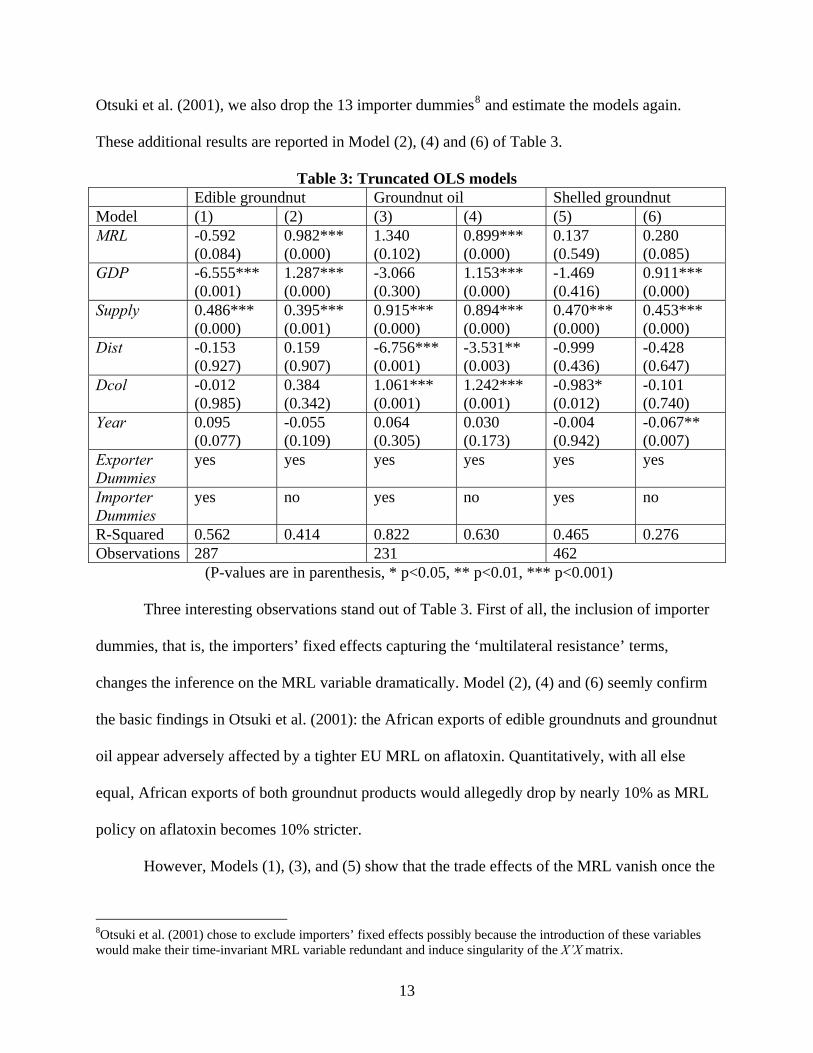
These additional results are reported in Model (2), (4) and (6) of Table 3.
Table 3: Truncated OLS models Edible groundnut Groundnut oil Shelled groundnut Model (1) (2) (3) (4) (5) (6) MRL -0.592
(0.084) 0.982*** (0.000)
1.340 (0.102)
0.899*** (0.000)
0.137 (0.549)
0.280 (0.085)
GDP -6.555*** (0.001)
1.287*** (0.000)
-3.066 (0.300)
1.153*** (0.000)
-1.469 (0.416)
0.911*** (0.000)
Supply 0.486*** (0.000)
0.395*** (0.001)
0.915*** (0.000)
0.894*** (0.000)
0.470*** (0.000)
0.453*** (0.000)
Dist -0.153 (0.927)
0.159 (0.907)
-6.756*** (0.001)
-3.531** (0.003)
-0.999 (0.436)
-0.428 (0.647)
Dcol -0.012 (0.985)
0.384 (0.342)
1.061*** (0.001)
1.242*** (0.001)
-0.983* (0.012)
-0.101 (0.740)
Year 0.095 (0.077)
-0.055 (0.109)
0.064 (0.305)
0.030 (0.173)
-0.004 (0.942)
-0.067** (0.007)
Exporter Dummies
yes yes yes yes yes yes
Importer Dummies
yes no yes no yes no
R-Squared 0.562 0.414 0.822 0.630 0.465 0.276 Observations 287 231 462
(P-values are in parenthesis, * p<0.05, ** p<0.01, *** p<0.001)
Three interesting observations stand out of Table 3. First of all, the inclusion of importer
dummies, that is, the importers’ fixed effects capturing the ‘multilateral resistance’ terms,
changes the inference on the MRL variable dramatically. Model (2), (4) and (6) seemly confirm
the basic findings in Otsuki et al. (2001): the African exports of edible groundnuts and groundnut
oil appear adversely affected by a tighter EU MRL on aflatoxin. Quantitatively, with all else
equal, African exports of both groundnut products would allegedly drop by nearly 10% as MRL
policy on aflatoxin becomes 10% stricter.
However, Models (1), (3), and (5) show that the trade effects of the MRL vanish once the
8Otsuki et al. (2001) chose to exclude importers’ fixed effects possibly because the introduction of these variables would make their time-invariant MRL variable redundant and induce singularity of the X’X matrix.
13

importer dummies are introduced. In fact, several importer dummies are statistically significant
(see Appendix 1 for details), suggesting that the trade-impeding effect found in Otsuki et al.
(2001) stems from the multi-lateral resistance terms of some of the importing countries rather
than the MRL. When those terms are controlled for, the MRL by itself has no significant impact
on groundnut exports from Africa. This observation casts doubt on the conventional viewpoint
that the EU’s MRL policy on aflatoxin is trade-impeding for exporters from African countries.
Two rationalizations can help interpret our result. Either, the MRL regulations are not binding
for African groundnut exporters because other domestic factors in production and before the
border constrain the trade potential in Africa. Or, the potential trade loss of African groundnut
exporters due to the compliance cost associated with the tighter standard is offset by the trade
benefits originated from an enhanced EU demand because of consumers’ preferences for safer
groundnut products.
Secondly, all estimates in Table 3, except for the African supply, are sensitive to the
introduction of the importer dummies. For example, the inclusion of the importer dummies
changes the inference on the European GDP variable from positive and statistically significant to
negative and statistically significant, and the trade-impeding effect of distance in the groundnut
oil sector nearly doubles. This sensitivity supports the claim of Anderson and van Wincoop
(2003) that when the ‘multi-lateral resistance’ terms are excluded from the gravity equation,
estimates suffer from severe bias from omitted variables. Last, African supply is found to
positively influence the exports across specifications and products, which suggests the key
importance of domestic production capacity in Africa to explain its trade potential. A Hausman
endogeneity test is conducted to check if the supply proxy is endogenous to bilateral trade flows.
14
No evidence of endogeneity is found for all three groundnut products.9 In addition, to ensure that
the OLS results are not driven by some influential trade flows of certain country-pairs, we also
conduct robust regression estimation using a mild down-weighing strategy. The robust regression
results confirm the results in Table 3.10
Despite of its computational simplicity, the Trun-OLS estimator suffers from several
criticisms. One major statistical problem with the Trun-OLS is the potential sample selection
bias it can cause if the eliminated zero observations are not drawn on a random basis. This is the
case in our context since countries not trading with each other in general choose to do so
voluntarily. Even if a sample selection bias is not detected, the economic interpretations of
truncated OLS estimates are limited. In our application, a Trun-OLS estimate for any variable of
interest would only capture its intensive margin to trade, that is, the intensification of existing
trade (marginal effects conditional on trade already taking place). However, from a development
viewpoint it is the extensive margin to trade, the creation of new bilateral trade partnership, that
we are interested in. Have the harmonization and tightening of the EU aflatoxin regulation
decreased the international market accessibility for groundnut exporters from Africa? The latter
concern naturally motivates a Heckman type sample selection model, which we pursue next.
The Heckman type of model we choose to present is the Helpman, Melitz, and Rubinstein
approach (HRM). As the state-of-the-art of the gravity equation approach to trade, the HMR
approach generates an extended gravity equation model with firm-level heterogeneity in
productivity. The model exhibits three appealing features. First, it explains zero trade flow. The
absence of bilateral trade occurs when all producers, even the most efficient ones, within a
country find it unprofitable to export to a destination. Second, it deals with the sample selection
9 The results of the endogeneity tests are available from authors upon request. 10 The details of the robust regressions are reported in the Appendices.
15

bias defined by Heckman (1979). Heckman (1979) proposed adding another equation to account
for the qualitative choice of outcomes, whether or not to trade with the EU countries in our
context, and then estimate this selection equation and the outcome equations (the equation with
positive observations only) jointly via a maximum likelihood method or a two-step procedure.
Third, HMR controls for the trade effect of the fraction of exporting firms, which varies
across exporting countries due to the different degrees of firm-level heterogeneity. Only the most
productive firms export as exports entail some additional fixed costs relative to selling
domestically. Econometrically, this additional term in the outcome equation can be consistently
estimated from the first stage of the Heckman two-stage procedure. To help with the
identification, at least one explanatory variable included in the selection equation is excluded
from the outcome equation. Economic theory suggests that a variable that affects the fixed costs
of EU-African trade, but not the variable costs of trade would qualify. We let the common
language dummy variable serve this role. The HMR in our application is specified as follows:
)3(.}1)]ˆ(ln{exp[
)ln()ln()ln()ln()0|ln(
)2(),~~~~
~)ln(~)ln(~)ln(~)ln(~~()0Pr(
13
1
8
165
43210
13
1
8
176
543210
ijtkijt
kkijt
kijt
k
nn
knm
m
kmt
kij
k
ijkk
itk
jtkk
jtkkk
ijtk
ijt
nn
knm
m
kmt
kij
k
ijk
ijkk
itk
jtkk
jtkkk
ijt
uIMRIMRz
DimDexYearDcol
DistSupplyGDPMRLYY
DimDexYearDcol
DlangDistSupplyGDPMRLY
++−++
++++
++++=>
++++
+++++Φ=>
∑∑
∑∑
==
==
ηδ
γαββ
βββββ
γαββ
ββββββ
Selection equation (2) is essentially a standard Probit binary choice model, where )(•Φ
is the standard normal distribution function, is the common language dummy variable for
the country pair i and j. We assume that this common language dummy variable affects the fixed
cost of trade, but has trivial effects on the variable costs to trade. Therefore, it is excluded from
ijDlang
16

outcome equation (3), to help with the identification of the model.
In (3), the term captures the trade effect of the fraction of
firms in country i that export to country j in year t
}1)]ˆ(ln{exp[ −+ kijt
kijt
k IMRzδ
kδ
kijtz
11. Specifically, is a parameter to be
estimated: a significant implies that the firm-level heterogeneity in groundnut sector k
affects the associated trade volumes. , calculated from estimates of (2), is the predicted
probability to trade groundnut product k for the country pair i and j in year t. The inverse Mill’s
ratio, , computed from the estimates in (2), controls for the standard sample selection errors
as in Heckman original model.
0>kδ
kijtIMR
We follow HMR to consistently estimate the model through a two-step procedure.12 In
the first step, (2) is estimated via Maximum Likelihood method, and the predicted probability to
trade and Inverse Mill’s Ratios can be computed accordingly. In the second step, (3)
is estimated via Non-Linear Least Squares.
kijtz k
ijtIMR
The results of the HMR model are reported in Table 4.13 We discuss the estimates in the
selection equations and the outcome equations, in turn. Two interesting findings come from the
estimated selection equation. First, the decision of trade or not is indeed an endogenous outcome
as we expect. The estimates in the selection equations show that a more abundant supply, a
shorter distance, or a common official language will help create new trade partnership between
the African groundnut exporters and the European importers. Second, the MRL policy on
aflatoxin has very little impact on the extensive margin to trade. In other words, the MRL policy
on aflatoxin imposed by the EU does not appear to decrease market access for African exporters.
11 Readers are referred to Equation (14) in HMR for its derivation. 12 Though desirable to estimate the model via a joint Maximum Likelihood method for efficiency consideration, the non-linearity of the outcome equation makes the log-likelihood function intractable. 13 We also estimate the model via standard Heckman Maximum Likelihood method without controlling for the firm-level heterogeneity and report the results in the Appendices. The estimates are very similar to Table 4.
17

The estimates in the outcome equations convey three important messages. First, the MRL
imposed by the EU has negligible effects on the existing trade volumes between Africa and the
EU. The P-values associated with the MRL estimates suggest that the policy is not statistically
significant at 10% level for any groundnut product under consideration.
Second, among all other bilateral trade determinants, African domestic supply is the only
systematic contributor to exporting all three products. The GDP levels in the EU bears negative
signs (statistically significant for the edible groundnut sector), which suggests that groundnut
products from Africa might be considered inferior goods by European consumers. A longer
distance decreases the probability of establishing trade partnership but doesn’t impede the trade
volumes for country pairs trading with each other. The role of colonial ties in history is
somewhat controversial: it promotes trade in groundnut oil but impede trade in shelled
groundnut. A common official language helps create trade relationship as expected.
Thirdly, the potential sample selection problem and the omission of the faction of
exporting firms do not severely bias the conventional trun-OLS estimates. In fact, the estimates
in the outcome equations of the HMR are comparable to Model (1) (3) and (5) of Table 3. The
sample selection term, represented by the Inverse Mill’s Ratio, turn out not statistically
significant for all three groundnut products. Although the faction of exporting firms matters for
the trade volumes of edible groundnuts, it plays a negligible role in the groundnut oil and the
shelled groundnut sectors. This observation suggests that the new exporting firms are probably
much smaller than the incumbents, typically state-run enterprises, in Africa. Consequently, the
trade volumes do not respond much to the number of players in the export market.
18
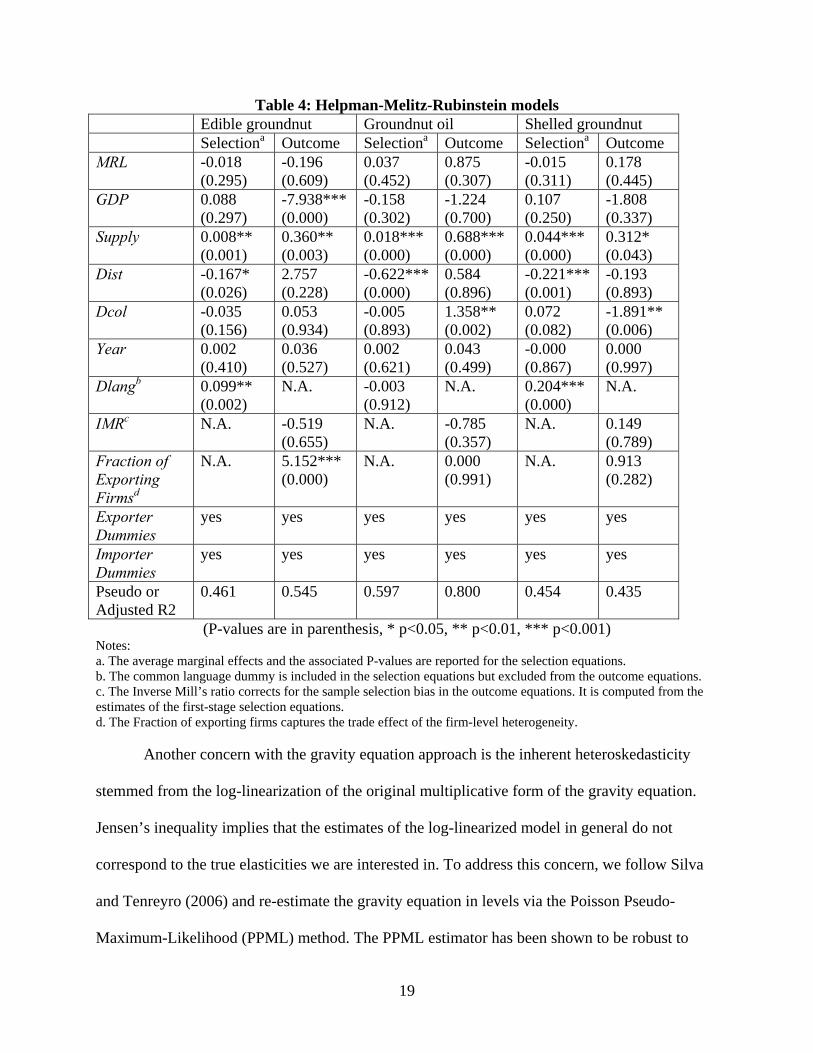
Table 4: Helpman-Melitz-Rubinstein models Edible groundnut Groundnut oil Shelled groundnut Selectiona Outcome Selectiona Outcome Selectiona Outcome MRL -0.018
(0.295) -0.196 (0.609)
0.037 (0.452)
0.875 (0.307)
-0.015 (0.311)
0.178 (0.445)
GDP 0.088 (0.297)
-7.938*** (0.000)
-0.158 (0.302)
-1.224 (0.700)
0.107 (0.250)
-1.808 (0.337)
Supply 0.008** (0.001)
0.360** (0.003)
0.018*** (0.000)
0.688*** (0.000)
0.044*** (0.000)
0.312* (0.043)
Dist -0.167* (0.026)
2.757 (0.228)
-0.622*** (0.000)
0.584 (0.896)
-0.221*** (0.001)
-0.193 (0.893)
Dcol -0.035 (0.156)
0.053 (0.934)
-0.005 (0.893)
1.358** (0.002)
0.072 (0.082)
-1.891** (0.006)
Year 0.002 (0.410)
0.036 (0.527)
0.002 (0.621)
0.043 (0.499)
-0.000 (0.867)
0.000 (0.997)
Dlangb 0.099** (0.002)
N.A. -0.003 (0.912)
N.A. 0.204*** (0.000)
N.A.
IMRc N.A. -0.519 (0.655)
N.A. -0.785 (0.357)
N.A. 0.149 (0.789)
Fraction of Exporting Firmsd
N.A. 5.152*** (0.000)
N.A. 0.000 (0.991)
N.A. 0.913 (0.282)
Exporter Dummies
yes yes yes yes yes yes
Importer Dummies
yes yes yes yes yes yes
Pseudo or Adjusted R2
0.461 0.545 0.597 0.800 0.454 0.435
(P-values are in parenthesis, * p<0.05, ** p<0.01, *** p<0.001) Notes: a. The average marginal effects and the associated P-values are reported for the selection equations. b. The common language dummy is included in the selection equations but excluded from the outcome equations. c. The Inverse Mill’s ratio corrects for the sample selection bias in the outcome equations. It is computed from the estimates of the first-stage selection equations. d. The Fraction of exporting firms captures the trade effect of the firm-level heterogeneity.
Another concern with the gravity equation approach is the inherent heteroskedasticity
stemmed from the log-linearization of the original multiplicative form of the gravity equation.
Jensen’s inequality implies that the estimates of the log-linearized model in general do not
correspond to the true elasticities we are interested in. To address this concern, we follow Silva
and Tenreyro (2006) and re-estimate the gravity equation in levels via the Poisson Pseudo-
Maximum-Likelihood (PPML) method. The PPML estimator has been shown to be robust to
19

various heteroskedastic patterns as long as the conditional variance of the dependent variable is
proportional to its conditional mean. Originating from a count data model, the PPML estimator
naturally allows zero observations.
However, the usefulness of the PPML estimator is constrained by its inability to
distinguish the rounding zeros and true zeros. In our context, zero trade flows can arise either
because exporters are willing to trade but hit by negative trade cost shocks, or because they are
reluctant to participate in the world market. In order to examine the PPML’s capacity of
accommodating the latter self-selected zeros, we also use the Zero Inflated Poisson (ZIP) models
in which zero observations can stem from either a binary decision or the lowest draw out of a
Poisson process (Greene (1994)). A Vuong test can tell whether PPML or ZIP fits the data better.
The specification of the PPML model is as follows:
E(Yijtk | Xijt
k ) = exp[β0k + β1
k ln( MRLjtk ) + β2
k ln(GDPjt ) + β3k ln(Supplyit
k ) + β4k ln(Distij )
+β5k Dcolij + β6
kYeart + αmk
m=1
8
∑ Dexm + γ nk
n=1
13
∑ Dimn], (4)
kijtX
)|()|( kijt
kijt
kijt
kijt XYVarXYE ∞
where is the matrix containing all explanatory variables under consideration. The
consistency of the PPML estimator is insured by the assumption .
The ZIP model is specified in the following way:
Pr(Yijtk = y | xijt
k )=Φ(xijt
kγ k )+ (1−Φ(xijtkγ k ))exp(−exp(xijt
kβk ))
(1−Φ(xijtkγ k ))exp(−exp(xijt
kβk ))exp(xijtkβk y) / y!
⎧⎨⎪
⎩⎪
if y =0
if y >0 ,(5)
)( kkijtx γΦ
))exp(exp( kkijtx β−
)exp( kkijtx β
where is the probability of zero trade flows due to exporters’ self-selection behavior,
is the probability of drawing a zero from a Poisson process with parameter
. Hence, there are two sources of zero trade flows. Either, an exporter decides to not
trade in the first stage, or it decides to trade but is hit by a negative cost shock which makes the
20

trade volumes being zero.
The results of the PPML and ZIP models are reported in Table 5 along with the Vuong
test. 14 The test suggests the ZIP model is preferred for all three products. Table 5 shows that
PPML tends to overestimate the impact of most variables. The reason is as follows. The PPML
model takes all zeros as generated from the Poisson process; to accommodate these excessive
zeros, the estimates are biased upward (the predicted dependent variable is always non negative).
Therefore, we prefer the ZIP estimates and draw the discussion of results upon the latter.
Table 5: PPML and ZIP models Edible groundnut Groundnut oil Shelled groundnut Model PPML ZIP
outcome PPML ZIP
outcome PPML ZIP
outcome MRL -0.474*
(0.036) -0.419* (0.042)
2.630** (0.003)
2.213** (0.008)
0.010 (0.951)
-0.018 (0.914)
GDP 1.631 (0.343)
1.284 (0.473)
-3.069* (0.045)
-1.426 (0.323)
9.131*** (0.000)
5.287* (0.011)
Supply 0.338*** (0.000)
0.313*** (0.000)
1.017*** (0.000)
0.881*** (0.000)
1.012*** (0.000)
0.722*** (0.000)
Dist 0.188 (0.928)
-0.772 (0.573)
-11.672*** (0.000)
-6.684*** (0.000)
-13.022*** (0.000)
-7.325* (0.026)
Dcol -0.588 (0.215)
-0.448 (0.345)
-0.297 (0.537)
0.837* (0.030)
-2.544*** (0.000)
-2.383*** (0.000)
dlang 1.253** (0.002)
0.425 (0.255)
-0.291 (0.595)
-0.381 (0.347)
2.172*** (0.000)
1.421*** (0.000)
Year 0.029 (0.548)
0.024 (0.621)
0.049 (0.077)
0.017 (0.511)
-0.197*** (0.001)
-0.109* (0.030)
Exporter Dummies
yes yes yes yes yes yes
Importer Dummies
yes yes yes yes yes yes
Pseudo R2 0.843 0.951 0.712 Z value of the Vuong test of ZIP vs Poisson
5.44 6.69 13.45
(P-values are in parenthesis, * p<0.05, ** p<0.01, *** p<0.001)
14 The Vuong test is essentially a likelihood ratio test. The associated statistic is normally distributed, with a large positive value in favor of the ZIP model and a large negative value in favor of the ordinary Poisson model. Details of the tests are reported in the Appendix.
21
The results of the ZIP models differ from those of the Trun-OLS, or the HMR models in
several ways. First, the MRL on aflatoxin becomes trade-promoting for edible groundnuts, and
trade-impeding for groundnut oil. The magnitude of its trade-impeding effect on groundnut oil is
somewhat striking: with the estimated elasticity as large as 2.2. Secondly, the ZIP models change
our inference on trade effects of the European GDPs and the distance as well. The sector of the
shelled groundnut exhibits a large income effect, with an estimated elasticity of 5.3. Distance is
found to impede trade to a remarkable extent for both groundnut oil and shelled groundnut. The
estimated elasticity of distance, at around -7, is close to the upper bound reported in Hummels
(2001). Overall the ZIP results although better than the PPML ones, seem extreme to be
plausible.
5. Robustness Check and the Trade Effect of the MRL
In this section, we summarize the results across all estimators and infer the groundnut trade
effects of the MRL set by the EU. Before synthesizing the estimates in the previous section, it is
a legitimate concern that the African supply variable, which is constructed as each African
country’s total exports to the rest of the world, might suffer from the endogeneity or simultaneity
problem: some unobservable determinants of the EU-Africa bilateral trade could affect the
aggregate exports as well. The simultaneity of trade and output determination is a common
problem in the applied trade literature. Several fixes have been recommended. Harrigan (1994)
suggests using factor endowments as the instrumental variables for the output and estimate the
model by two-stage Least Square. However, our application is so disaggregated that it would be
difficult to find a valid factor endowment instrument. Another remedy is simply to constrain the
coefficient of the supply to be one, or in other words let the share of exports be the dependent
22

variable. The disadvantage of this fix is that, we would not able to infer how important the
domestic capacity is to the export potential of Africa. The approach we take to address the
endogeneity is to construct an alternative African supply proxy from the FAOSTAT database.
The database provides food supply series for a wide range of agricultural commodities and
countries. For each of the nine African countries, we extract “groundnut oil”, “groundnuts (in
shell equivalence)”, and “groundnuts (shelled equivalence)” as the alternative supply series for
groundnut oil, shelled groundnuts, and edible groundnuts respectively. This alternative African
supply is considered exogenous to the bilateral trade flows. With this alternative supply proxy,
we re-do all the estimations in Section 3 and report the results in Appendix 2.
We find that most of the findings in Section 3 remain after the replacement of the supply proxy.
The major difference lies on the trade effects of the supply proxy itself. The estimated elasticities
of the FAOSTAT supply proxy sometime exhibit an expected sign and are less significant. The
relatively poor performance of the FAOSTAT supply variable could be attributed to the
discrepancy in data collection processes and commodity classifications between the
COMTRADE and the FAOSTAT.
Table 6 summarizes the trade effects of the MRL variable across all 4 models, 2 supply
variables, and 3 groundnut products. As Table 6 shows, out of the 36 experiments, only 4 cases
imply the trade-impeding role of the MRL on aflatoxin. Two cases suggest the aflatoxin
regulation is actually trade-promoting for the sector of edible groundnuts. Therefore and in
contrast to the previously acknowledged standards-as-barriers argument for the EU’s regulations
on aflatoxins, our findings suggest that the trade effect of the EU’s MRL policy on aflatoxin
contaminants in foodstuffs is null or at best ambiguous: neither the propensity to create new
trade partnership nor the volume exported to the existing trade partners is found to be
23
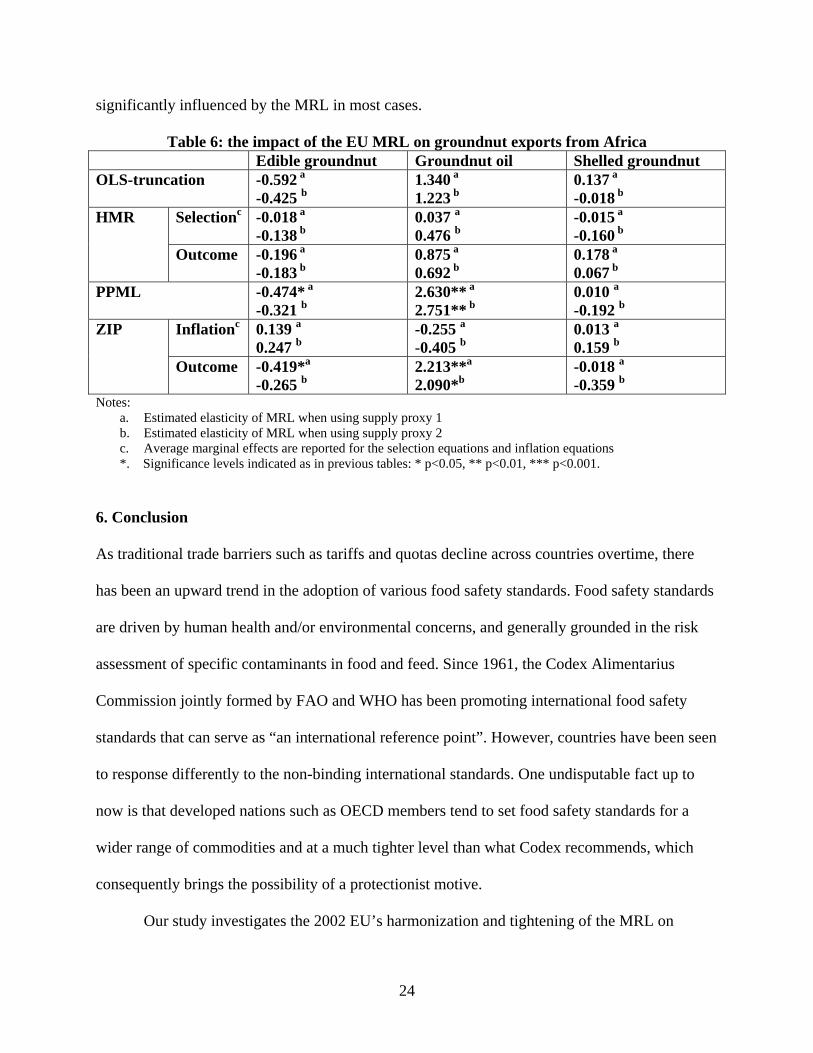
significantly influenced by the MRL in most cases.
Table 6: the impact of the EU MRL on groundnut exports from Africa Edible groundnut Groundnut oil Shelled groundnut OLS-truncation -0.592 a
-0.425 b 1.340 a
1.223 b 0.137 a
-0.018 b Selectionc -0.018 a
-0.138 b 0.037 a
0.476 b -0.015 a
-0.160 b HMR
Outcome -0.196 a
-0.183 b 0.875 a
0.692 b 0.178 a
0.067 b PPML -0.474* a
-0.321 b 2.630** a
2.751** b 0.010 a
-0.192 b Inflationc 0.139 a
0.247 b -0.255 a
-0.405 b 0.013 a
0.159 b ZIP
Outcome -0.419*a
-0.265 b 2.213**a
2.090*b -0.018 a
-0.359 b Notes:
a. Estimated elasticity of MRL when using supply proxy 1 b. Estimated elasticity of MRL when using supply proxy 2 c. Average marginal effects are reported for the selection equations and inflation equations *. Significance levels indicated as in previous tables: * p<0.05, ** p<0.01, *** p<0.001.
6. Conclusion
As traditional trade barriers such as tariffs and quotas decline across countries overtime, there
has been an upward trend in the adoption of various food safety standards. Food safety standards
are driven by human health and/or environmental concerns, and generally grounded in the risk
assessment of specific contaminants in food and feed. Since 1961, the Codex Alimentarius
Commission jointly formed by FAO and WHO has been promoting international food safety
standards that can serve as “an international reference point”. However, countries have been seen
to response differently to the non-binding international standards. One undisputable fact up to
now is that developed nations such as OECD members tend to set food safety standards for a
wider range of commodities and at a much tighter level than what Codex recommends, which
consequently brings the possibility of a protectionist motive.
Our study investigates the 2002 EU’s harmonization and tightening of the MRL on
24

aflatoxin contaminants. We use a panoply of state-of-the-art gravity equation approaches to
quantify the trade effects of the EU’s MRL policies on aflatoxins for the groundnut exporters
from Africa. The contribution of our analysis to the literature is triple. First of all, unlike in
previous econometric analyses of EU aflatoxin policies, our results suggest that the
harmonization and tightening of aflatoxin regulations within the EU has no significant effects on
African groundnut exports, either in terms of the trade volumes, or the propensity to trade. This
empirical result challenges the conventional view that a stricter food safety standard would act
like a barrier to trade.
We offered two rationalizations to interpret the insignificance of the MRL policy. First
and more plausible to us, the food safety policy adopted by the EU is non binding for African
groundnut exporters because their export potential is mostly constrained by the domestic
capacity, such as farming and storage practice, and/or other barriers before the border. Or
alternatively, the stringent EU standard both increases the trade costs for exporters from Africa,
and enhances demand within the EU due to the quality improvement of the groundnut products
such that its overall trade effect is exactly null, which is a bit farfetched.
The second important finding is that domestic groundnut supply conditions in Africa
appear to be a binding constraint for its groundnut exports across all methods of estimation. This
finding implies that it is the domestic issue rather than the accessibility to the world market that
constrains Africa’s export potential. Addressing Africa’s under-trading problem from a
development viewpoint might be more helpful than merely improving international accessibility
for African traders (Bouët et al. (2008); Rios and Jaffee (2008)). Last, our application highlights
the performance of different estimation strategies for the gravity equation model. The omission
of the “multilateral resistance” terms induces severe biases to the estimates of interest; the HMR
25

model explains well both the qualitative and quantitative aspects of bilateral trade if the
exclusion restriction is satisfied; the PPML estimator is not robust when zero trade flows are
pervasive.
Several possible extensions may help better understand the trade effects of the EU’s
MRL policy on aflatoxin. It is desirable to account for the trade diversion effects of the policy: a
tightening of the standard within the EU would encourage African traders to export more to other
destinations with looser standards than the EU standards. It would be also interesting to
decompose the overall trade effect of the food safety standard into its trade cost effect and
demand-enhancing effect, to formerly identify the MRL’s respective influence on producers and
consumers.
26
References
Anderson, James and van Wincoop, Eric. 2003. “Gravity with Gravitas: A Solution to the Border
Puzzle,” The American Economic Review 93(1): 170-192.
Anderson, James, and van Wincoop, Eric. 2004. “Trade Costs,” Journal of Economic Literature,
Vol. XLII (September): 691-751.
Baier, Scott and Bergstrand, Jeffrey. 2001. “The Growth of World Trade: Tariffs, Transport
Costs, and Income Similarity,” Journal of International Economics 53(1): 1-27.
Baldwin, Richard E. and Taglioni, Daria. 2006. “Gravity for Dummies and Dummies for Gravity
Equations” (September 2006). CEPR Discussion Paper No. 5850.
Bouët, Antoine, Santosh Mishra and Devesh Roy. 2008. “Does Africa Trade Less than it Should
and Why” Helsinki, GTAP Conference and International Food Policy Research Institute, IFPRI
discussion paper 770.
Buys, Piet, Uwe Deichmann, and David Wheeler. 2010. “Road Network Upgrading and
Overland Trade Expansion in Sub-Saharan Africa,” Journal of African Economies 19(3):399-
432.
Disdier, Anne-Célia and Head, Keith. 2008. “The Puzzling Persistence of the Distance Effect on
Bilateral Trade,” The Review of Economics and Statistics 90(1): 37-48.
European Commission. 2001. Commission Regulation (EC) No 466/2001 of 8 March 2001,
Official Journal of the European Communities.
European Commission. 2002. Commission Regulation (EC) No 472/2002 of 12 March 2002,
Official Journal of the European Communities.
European Commission. 2006. Commission Regulation (EC) No 1881/2006 of 19 December
2006, Official Journal of the European Communities.
27

FAO (Food and Agricultural Organization). 1995. Worldwide Regulations for Mycotoxins 1995:
a Compendium. Rome: FAO.
FAO (Food and Agricultural Organization). 2004. Worldwide Regulations for Mycotoxins in
Food and Feed in 2003. Rome: FAO.
Greene, William H. 1994. “Accounting for Excess Zeros and Sample Selection in Poisson and
Negative Binomial Regression Models,” NYU Working Paper No. EC-94-10.
Harrigan, James. 1979. “Scale Economies and the Volumes of Trade,” The Review of Economics
and Statistics 76(2): 321-328.
Heckman, James. 1979. “Sample Selection Bias as a Specification Error,” Econometrica 47(1):
153-161.
Helpman, Elhanan, Melitz, Marc, and Rubinstein Yona. 2008. “Estimating Trade Flows: Trading
Partners and Trading Volumes,” Quarterly Journal of Economics 73(2): 441-486.
Henry de Frahan, Bruno, and Vancauteren, Mark. 2006. “Harmonisation of Food Regulations
and Trade in the Single Market: Evidence from Disaggregated Data,” European Review of
Agricultural Economics 33(3): 337-360.
Hummels, David L. 2001. “Toward a Geography of Trade Costs,” Purdue University.
Jaffee, Steve, and Spencer Henson. 2005. “Agro-food Exports from Developing Countries: the
Challenges Posed by Standards, Global Agricultural Trade and Developing Countries,” Chapter
6 in Aksoy, M. A., and J. C. Beghin, eds. Global Agricultural Trade & Developing Countries.
The World Bank.
IFPRI. 2009. “New Project, Funded by a Grant from the Bill & Melinda Gates Foundation, to
Reduce Aflatoxin Contamination of Crops in Kenya and Mali” Pressroom, June 26.
http://www.ifpri.org/pressrelease/new-project-funded-grant-bill-melinda-gates-foundation-
28

reduce-aflatoxin-contamination-c
Jayasinghe, Sampath, Beghin, John and Moschini, Giancarlo. Forthcoming. “Determinants of
World Demand for U.S. Corn Seeds: The Role of Trade Costs,” American Journal of
Agricultural Economics.
Maertens, Miet, and Swinnen, Johan F.M. 2009. “Trade, Standards, and Poverty: Evidence from
Senegal,” World Development Vol 37(1): 161-178.
Martin, Will and Pham, Cong. 2008. “Estimating the Gravity Model When Zero Trade Flows
Are Frequent,” Mimeo, The World Bank.
Maskus, Keith and Wilson, John. 2001. Quantifying the Impact of Technical Barriers to Trade:
Can It Be Done? Ann Arbor, MI: University of Michigan Press.
McCallum, John. 1995. “National Borders Matter: Canada-U.S. Regional Trade Patterns,” The
American Economic Review 85(3): 615-623.
Otsuki, Tsunehiro, Wilson, John, and Sewadeh Mirvat. 2001.“What Price Precaution? European
Harmonization of Aflatoxin Regulations and African Groundnut Exports,” European Review of
Agricultural Economics Vol 28(2): 263-283.
Rios, L.D., and S. Jaffee. 2008. "Barrier, Catalyst, or Distraction? Standards, Competitiveness,
and Africa's Groundnut Exports to Europe." Agriculture and Rural Development Discussion
Paper 39, The World Bank, Washington DC.
Rose, Andrew and van Wincoop, Eric. 2001. “National Money as a Barrier to International
Trade: The Real Case for Currency Union,” The American Economic Review 91(2): 386-390.
Silva, Santos, and Tenreyro, Silvana. 2006. “The Log of Gravity,” The Review of Economics and
Statistics 88(4): 641-658.
29

Appendix to Aflatoxin Redux: Does European Aflatoxin Regulation Hurt Groundnut
Exporters from Africa? (Not intended for publication)
May 27, 2010
Bo Xiong
John Beghin
Appendix 1. Full Regression Results
Table A1-1: Truncated OLS models
Edible groundnut Groundnut oil Shelled groundnut Model (1) (2) (3) (4) (5) (6) MRL -0.592
(0.084) 0.982*** (0.000)
1.340 (0.102)
0.899*** (0.000)
0.137 (0.549)
0.280 (0.085)
GDP -6.555*** (0.001)
1.287*** (0.000)
-3.066 (0.300)
1.153*** (0.000)
-1.469 (0.416)
0.911*** (0.000)
Supply1 0.486*** (0.000)
0.395*** (0.001)
0.915*** (0.000)
0.894*** (0.000)
0.470*** (0.000)
0.453*** (0.000)
Dist -0.153 (0.927)
0.159 (0.907)
-6.756*** (0.001)
-3.531** (0.003)
-0.999 (0.436)
-0.428 (0.647)
Dcol -0.012 (0.985)
0.384 (0.342)
1.061*** (0.001)
1.242*** (0.001)
-0.983* (0.012)
-0.101 (0.740)
Year 0.095 (0.077)
-0.055 (0.109)
0.064 (0.305)
0.030 (0.173)
-0.004 (0.942)
-0.067** (0.007)
Egypt -0.866 (0.649)
-0.823 (0.609)
-8.168** (0.002)
-4.969* (0.021)
-2.545 (0.075)
-1.573 (0.170)
Gambia 0.334 (0.829)
0.121 (0.933)
-4.208** (0.007)
-1.399 (0.165)
-1.106 (0.284)
-0.107 (0.897)
Mali -1.244 (0.449)
-1.521 (0.320)
dropped dropped -0.168 (0.899)
-1.010 (0.390)
Nigeria -2.319* (0.045)
-2.096* (0.026)
-3.486* (0.015)
-1.093 (0.252)
-2.543* (0.017)
-1.954* (0.044)
Sudan 1.571 (0.381)
1.101 (0.543)
-5.206** (0.002)
-1.908 (0.080)
-0.930 (0.345)
-0.203 (0.794)
Senegal 0.105 (0.945)
-0.118 (0.933)
-5.063** (0.001)
-2.537* (0.013)
-1.426 (0.188)
-0.615 (0.471)
Chad dropped dropped -5.521** (0.005)
-1.352 (0.355)
dropped Dropped
Zimbabwe -0.901 (0.099)
-0.738 (0.152)
dropped dropped -2.669*** (0.000)
-2.012** (0.002)
Austria -14.831*** (0.000)
N.A. -8.167 (0.189)
N.A. -5.757 (0.104)
N.A.
30

Belgium-Luxemburg
-9.824** (0.002)
-6.540 (0.187)
-3.799 (0.216)
Switzerland -13.300*** (0.000)
-5.847 (0.272)
-0.706 (0.815)
Germany 3.585*** (0.000)
1.345 (0.280)
1.046 (0.181)
Denmark -17.946*** (0.000)
-9.314 (0.153)
-4.706 (0.240)
Spain -4.674** (0.004)
-12.389*** (0.000)
-1.968 (0.229)
Finland -19.521*** (0.000)
dropped -4.322 (0.327)
United Kingdom
1.975** (0.002)
-0.222 (0.783)
2.287*** (0.000)
Ireland -19.409*** (0.000)
dropped -7.673 (0.118)
Italy -0.114 (0.870)
-0.448 (0.492)
1.230 (0.124)
Netherlands -6.622** (0.006)
-6.250 (0.098)
-0.935 (0.687)
Portugal dropped -17.736* (0.021)
-5.387 (0.241)
Sweden -14.594*** (0.000)
-8.059 (0.127)
-5.240 (0.149)
Constant -10.021 (0.894)
70.401 (0.327)
10.406 (0.839)
-68.639 (0.130)
55.383 (0.383)
110.789* (0.023)
R-Squared 0.562 0.414 0.822 0.630 0.465 0.276 Observations 287 231 462
(P-values are in parenthesis, * p<0.05, ** p<0.01, *** p<0.001)
Table A1-2: Truncated Robust Regression models
Edible groundnut Groundnut oil Shelled groundnut Model (1) (2) (3) (4) (5) (6) MRL -0.629
(0.063) 0.975*** (0.000)
1.361 (0.074)
1.174*** (0.000)
0.128 (0.562)
0.266 (0.101)
GDP -6.446*** (0.001)
1.286*** (0.000)
-2.502 (0.363)
0.837*** (0.000)
-1.805 (0.299)
0.899*** (0.000)
Supply1 0.503*** (0.000)
0.404*** (0.001)
0.891*** (0.000)
0.931*** (0.000)
0.477*** (0.000)
0.451*** (0.000)
Dist -0.280 (0.865)
0.129 (0.924)
-6.807*** (0.001)
-10.85*** (0.000)
-0.923 (0.454)
-0.611 (0.512)
Dcol -0.014 (0.982)
0.413 (0.309)
1.002*** (0.001)
0.962*** (0.000)
-1.011** (0.007)
-0.094 (0.755)
Year 0.091 (0.089)
-0.056 (0.105)
0.053 (0.354)
-0.003 (0.854)
0.007 (0.887)
-0.065** (0.009)
31

Egypt -0.913 (0.627)
-0.803 (0.619)
-8.534*** (0.001)
-12.72*** (0.000)
-2.591 (0.060)
-1.788 (0.117)
Gambia 0.311 (0.839)
0.150 (0.917)
-4.443** (0.002)
-7.035*** (0.000)
-1.142 (0.251)
-0.259 (0.752)
Mali -1.240 (0.445)
-1.498 (0.330)
dropped dropped -0.173 (0.892)
-1.214 (0.299)
Nigeria -2.345* (0.040)
-2.081* (0.028)
-3.712** (0.005)
-6.214*** (0.000)
-2.488* (0.016)
-2.047* (0.034)
Sudan 1.500 (0.397)
1.106 (0.543)
-5.395*** (0.000)
-8.377*** (0.000)
-0.960 (0.311)
-0.358 (0.644)
Senegal 0.101 (0.947)
-0.098 (0.945)
-5.211*** (0.000)
-8.090*** (0.000)
-1.467 (0.160)
-0.789 (0.352)
Chad dropped dropped -5.813** (0.002)
-9.197*** (0.000)
dropped dropped
Zimbabwe -0.914 (0.090)
-0.700 (0.176)
dropped dropped -2.771*** (0.000)
-2.092*** (0.001)
Austria -14.537*** (0.000)
-7.229 (0.211)
-6.356 (0.062)
Belgium-Luxemburg
-9.584** (0.002)
-5.573 (0.226)
-4.422 (0.135)
Switzerland -13.115*** (0.000)
-4.959 (0.316)
-0.914 (0.753)
Germany 3.590*** (0.000)
1.125 (0.330)
1.129 (0.134)
Denmark -17.701*** (0.000)
-8.157 (0.178)
-5.460 (0.157)
Spain -4.543** (0.005)
-11.94*** (0.000)
-2.283 (0.147)
Finland -19.304*** (0.000)
dropped -5.219 (0.219)
United Kingdom
2.056*** (0.001)
-0.295 (0.693)
2.301*** (0.000)
Ireland -19.061*** (0.000)
dropped -8.690 (0.066)
Italy -0.064 (0.926)
-0.392 (0.518)
1.273 (0.098)
Netherlands -6.375** (0.007)
-5.399 (0.124)
-1.377 (0.538)
Portugal dropped -16.386* (0.022)
-6.157 (0.241)
Sweden -14.396*** (0.000)
N.A.
-7.097 (0.148)
N.A.
dropped
N.A.
Constant -2.918 (0.969)
72.292 (0.316)
16.133 (0.735)
71.732* (0.022)
43.073 (0.481)
108.639* (0.025)
Observations 287 231 462 (P-values are in parenthesis, * p<0.05, ** p<0.01, *** p<0.001)
32
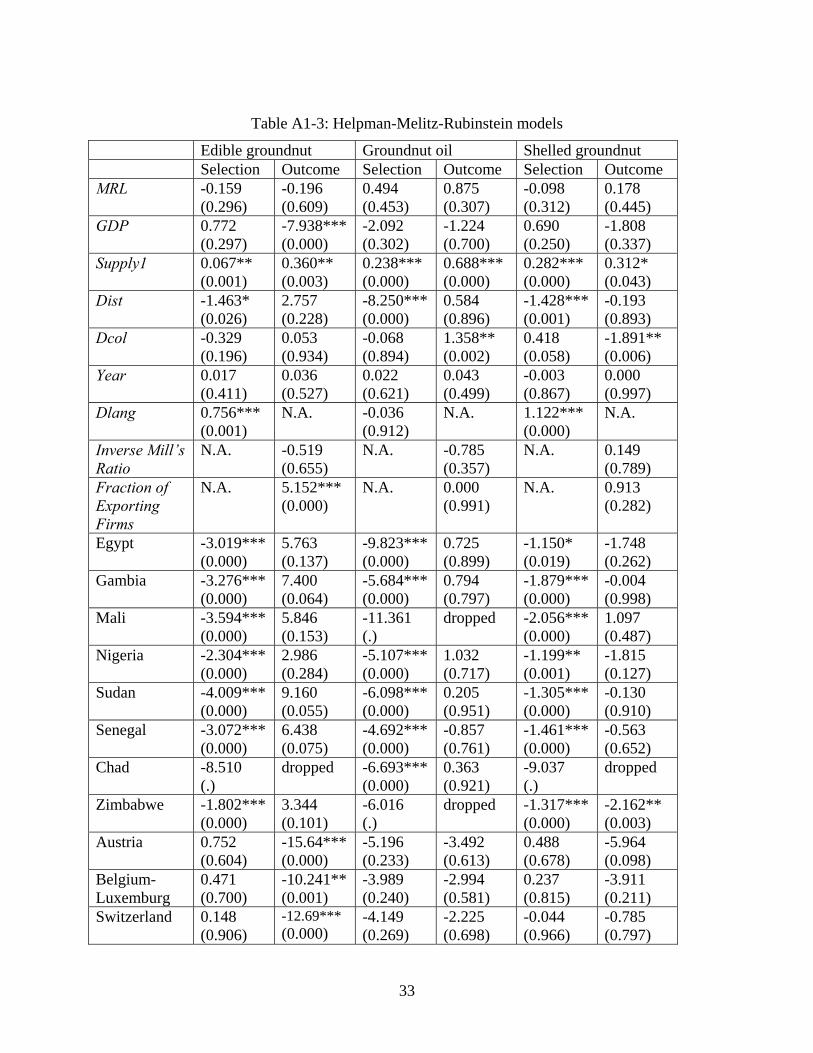
Table A1-3: Helpman-Melitz-Rubinstein models
Edible groundnut Groundnut oil Shelled groundnut Selection Outcome Selection Outcome Selection Outcome MRL -0.159
(0.296) -0.196 (0.609)
0.494 (0.453)
0.875 (0.307)
-0.098 (0.312)
0.178 (0.445)
GDP 0.772 (0.297)
-7.938*** (0.000)
-2.092 (0.302)
-1.224 (0.700)
0.690 (0.250)
-1.808 (0.337)
Supply1 0.067** (0.001)
0.360** (0.003)
0.238*** (0.000)
0.688*** (0.000)
0.282*** (0.000)
0.312* (0.043)
Dist -1.463* (0.026)
2.757 (0.228)
-8.250*** (0.000)
0.584 (0.896)
-1.428*** (0.001)
-0.193 (0.893)
Dcol -0.329 (0.196)
0.053 (0.934)
-0.068 (0.894)
1.358** (0.002)
0.418 (0.058)
-1.891** (0.006)
Year 0.017 (0.411)
0.036 (0.527)
0.022 (0.621)
0.043 (0.499)
-0.003 (0.867)
0.000 (0.997)
Dlang 0.756*** (0.001)
N.A. -0.036 (0.912)
N.A. 1.122*** (0.000)
N.A.
Inverse Mill’s Ratio
N.A. -0.519 (0.655)
N.A. -0.785 (0.357)
N.A. 0.149 (0.789)
Fraction of Exporting Firms
N.A. 5.152*** (0.000)
N.A. 0.000 (0.991)
N.A. 0.913 (0.282)
Egypt -3.019*** (0.000)
5.763 (0.137)
-9.823*** (0.000)
0.725 (0.899)
-1.150* (0.019)
-1.748 (0.262)
Gambia -3.276*** (0.000)
7.400 (0.064)
-5.684*** (0.000)
0.794 (0.797)
-1.879*** (0.000)
-0.004 (0.998)
Mali -3.594*** (0.000)
5.846 (0.153)
-11.361 (.)
dropped -2.056*** (0.000)
1.097 (0.487)
Nigeria -2.304*** (0.000)
2.986 (0.284)
-5.107*** (0.000)
1.032 (0.717)
-1.199** (0.001)
-1.815 (0.127)
Sudan -4.009*** (0.000)
9.160 (0.055)
-6.098*** (0.000)
0.205 (0.951)
-1.305*** (0.000)
-0.130 (0.910)
Senegal -3.072*** (0.000)
6.438 (0.075)
-4.692*** (0.000)
-0.857 (0.761)
-1.461*** (0.000)
-0.563 (0.652)
Chad -8.510 (.)
dropped -6.693*** (0.000)
0.363 (0.921)
-9.037 (.)
dropped
Zimbabwe -1.802*** (0.000)
3.344 (0.101)
-6.016 (.)
dropped -1.317*** (0.000)
-2.162** (0.003)
Austria 0.752 (0.604)
-15.64*** (0.000)
-5.196 (0.233)
-3.492 (0.613)
0.488 (0.678)
-5.964 (0.098)
Belgium-Luxemburg
0.471 (0.700)
-10.241** (0.001)
-3.989 (0.240)
-2.994 (0.581)
0.237 (0.815)
-3.911 (0.211)
Switzerland 0.148 (0.906)
-12.69*** (0.000)
-4.149 (0.269)
-2.225 (0.698)
-0.044 (0.966)
-0.785 (0.797)
33

Germany -0.249 (0.489)
4.046*** (0.000)
0.697 (0.411)
0.697 (0.595)
0.311 (0.283)
0.867 (0.271)
Denmark -0.339 (0.832)
-18.05*** (0.000)
-4.824 (0.288)
-5.070 (0.469)
-0.297 (0.820)
-4.918 (0.220)
Spain 0.441 (0.491)
-5.354** (0.001)
-7.421*** (0.000)
-5.801 (0.216)
-0.380 (0.488)
-1.778 (0.277)
Finland 0.753 (0.674)
-20.03*** (0.000)
-10.392 (.)
dropped 0.901 (0.538)
-4.699 (0.298)
United Kingdom
-0.060 (0.812)
0.866 (0.289)
0.047 (0.944)
-0.314 (0.695)
0.286 (0.154)
2.067*** (0.000)
Ireland 0.657 (0.741)
-21.50*** (0.000)
-14.860 (.)
dropped 0.301 (0.857)
-8.302 (0.101)
Italy -0.254 (0.401)
0.696 (0.355)
-1.523** (0.001)
0.879 (0.379)
-0.841** (0.001)
1.695* (0.048)
Netherlands 1.166 (0.212)
-8.753** (0.001)
-3.018 (0.244)
-3.584 (0.385)
1.819* (0.020)
-1.898 (0.454)
Portugal -5.599 (.)
dropped -13.299** (0.008)
-5.823 (0.576)
0.661 (0.662)
-5.687 (0.224)
Sweden -0.238 (0.853)
-13.31*** (0.000)
-3.907 (0.284)
-4.617 (0.415)
-1.222 (0.275)
-4.780 (0.188)
Constant -41.306 (0.110)
115.576 (0.197)
85.797* (0.027)
-40.557 (0.709)
-4.362 (0.856)
51.978 (0.413)
Pseudo or Adjusted R2
0.461 0.545 0.597 0.800 0.454 0.435
(P-values or Z-values are in parenthesis, * p<0.05, ** p<0.01, *** p<0.001)
Table A1-4: PPML and ZIP models
Edible groundnut Groundnut oil Shelled groundnut Model PPML ZIP
outcome PPML ZIP
outcome PPML ZIP
outcome MRL -0.474*
(0.036) -0.419* (0.042)
2.630** (0.003)
2.213** (0.008)
0.010 (0.951)
-0.018 (0.914)
GDP 1.631 (0.343)
1.284 (0.473)
-3.069* (0.045)
-1.426 (0.323)
9.131*** (0.000)
5.287* (0.011)
Supply1 0.338*** (0.000)
0.313*** (0.000)
1.017*** (0.000)
0.881*** (0.000)
1.012*** (0.000)
0.722*** (0.000)
Dist 0.188 (0.928)
-0.772 (0.573)
-11.67*** (0.000)
-6.684*** (0.000)
-13.022*** (0.000)
-7.325* (0.026)
Dcol -0.588 (0.215)
-0.448 (0.345)
-0.297 (0.537)
0.837* (0.030)
-2.544*** (0.000)
-2.383*** (0.000)
Dlang 1.253** (0.002)
-0.425 (0.255)
-0.291 (0.595)
-0.381 (0.347)
2.172*** (0.000)
1.421*** (0.000)
Year 0.029 (0.548)
0.024 (0.621)
0.049 (0.077)
0.017 (0.511)
-0.197*** (0.001)
-0.109* (0.030)
34

Egypt -2.342 (0.318)
-1.935 (0.248)
-16.90*** (0.000)
-13.02*** (0.000)
-14.938*** (0.000)
-9.221* (0.014)
Gambia -1.256 (0.499)
0.219 (0.841)
-6.689*** (0.000)
-4.516*** (0.000)
-9.578*** (0.000)
-5.279* (0.027)
Mali -5.373** (0.002)
-2.965* (0.038)
-25.22*** (0.000)
dropped -12.397*** (0.000)
-5.830* (0.027)
Nigeria -2.621 (0.067)
-2.396* (0.010)
-6.320*** (0.000)
-4.155*** (0.000)
-8.802*** (0.000)
-5.248* (0.011)
Sudan -3.942* (0.040)
0.568 (0.556)
-7.649*** (0.000)
-5.186*** (0.000)
-9.075*** (0.000)
-5.195* (0.027)
Senegal -2.957 (0.098)
-1.388 (0.247)
-6.633*** (0.000)
-4.893*** (0.000)
-9.860*** (0.000)
-6.006* (0.013)
Chad -13.39*** (0.000)
dropped -8.171*** (0.000)
-5.709*** (0.000)
-31.850*** (0.000)
dropped
Zimbabwe -2.859*** (0.000)
-2.04*** (0.000)
-19.17*** (0.000)
dropped -5.302*** (0.000)
-4.217*** (0.000)
Austria 0.557 (0.867)
-0.111 (0.974)
-8.627* (0.018)
-5.831 (0.082)
12.381** (0.010)
6.413 (0.108)
Belgium-Luxemburg
3.452 (0.224)
3.054 (0.303)
-7.106** (0.006)
-3.443 (0.158)
12.746** (0.003)
6.872* (0.049)
Switzerland 0.051 (0.986)
-0.437 (0.886)
-5.244 (0.078)
-1.738 (0.530)
14.468*** (0.001)
9.267** (0.006)
Germany 0.667 (0.333)
0.772 (0.272)
1.627 (0.078)
1.385 (0.122)
-2.417* (0.012)
-1.520 (0.075)
Denmark -2.918 (0.441)
-4.659 (0.234)
-9.393** (0.008)
-6.543* (0.047)
14.313** (0.008)
8.341 (0.065)
Spain 2.799* (0.040)
2.471 (0.079)
-16.22*** (0.000)
-12.34*** (0.000)
1.306 (0.557)
1.673 (0.354)
Finland 0.937 (0.823)
0.625 (0.886)
-35.70*** (0.000)
dropped 21.750*** (0.000)
12.064* (0.017)
United Kingdom
0.832 (0.129)
1.390* (0.032)
-0.401 (0.650)
0.041 (0.957)
1.375*** (0.000)
1.382*** (0.000)
Ireland 0.407 (0.924)
0.837 (0.849)
-43.44*** (0.000)
dropped 17.517** (0.007)
8.078 (0.135)
Italy 0.875 (0.070)
0.689 (0.157)
-1.835*** (0.000)
-0.462 (0.251)
-1.230 (0.225)
-0.009 (0.993)
Netherlands 4.236 (0.051)
3.743 (0.099)
-6.616*** (0.001)
-3.858* (0.042)
13.561*** (0.000)
7.890** (0.003)
Portugal -15.65*** (0.000)
dropped -26.22*** (0.000)
-17.52*** (0.000)
16.523** (0.007)
10.060 (0.060)
Sweden -1.246 (0.676)
-1.010 (0.741)
-8.508** (0.003)
-6.688* (0.011)
8.416 (0.055)
5.026 (0.157)
Constant -105.36 (0.088)
-77.406 (0.225)
80.689***(0.000)
52.581* (0.011)
248.321*** (0.000)
132.601* (0.016)
Pseudo R2 0.843 0.951 0.712 (P-values are in parenthesis, * p<0.05, ** p<0.01, *** p<0.001)
35
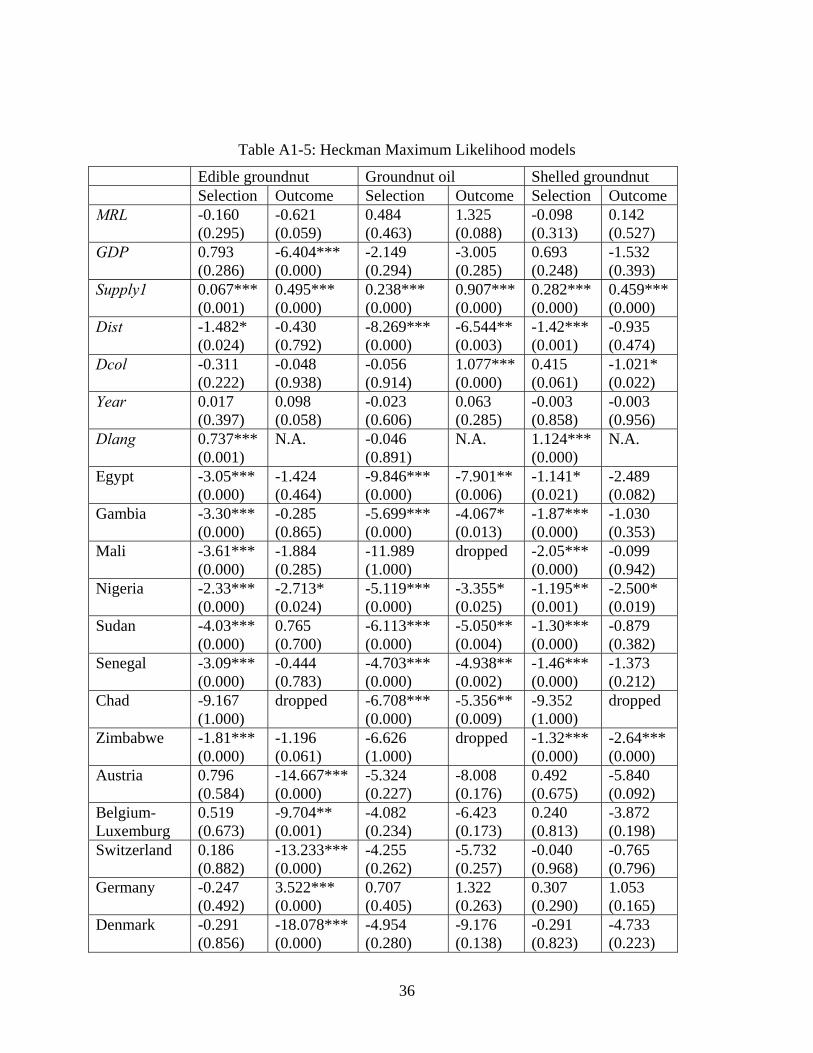
Table A1-5: Heckman Maximum Likelihood models
Edible groundnut Groundnut oil Shelled groundnut Selection Outcome Selection Outcome Selection Outcome MRL -0.160
(0.295) -0.621 (0.059)
0.484 (0.463)
1.325 (0.088)
-0.098 (0.313)
0.142 (0.527)
GDP 0.793 (0.286)
-6.404*** (0.000)
-2.149 (0.294)
-3.005 (0.285)
0.693 (0.248)
-1.532 (0.393)
Supply1 0.067*** (0.001)
0.495*** (0.000)
0.238*** (0.000)
0.907*** (0.000)
0.282*** (0.000)
0.459*** (0.000)
Dist -1.482* (0.024)
-0.430 (0.792)
-8.269*** (0.000)
-6.544** (0.003)
-1.42*** (0.001)
-0.935 (0.474)
Dcol -0.311 (0.222)
-0.048 (0.938)
-0.056 (0.914)
1.077*** (0.000)
0.415 (0.061)
-1.021* (0.022)
Year 0.017 (0.397)
0.098 (0.058)
-0.023 (0.606)
0.063 (0.285)
-0.003 (0.858)
-0.003 (0.956)
Dlang 0.737*** (0.001)
N.A. -0.046 (0.891)
N.A. 1.124*** (0.000)
N.A.
Egypt -3.05*** (0.000)
-1.424 (0.464)
-9.846*** (0.000)
-7.901** (0.006)
-1.141* (0.021)
-2.489 (0.082)
Gambia -3.30*** (0.000)
-0.285 (0.865)
-5.699*** (0.000)
-4.067* (0.013)
-1.87*** (0.000)
-1.030 (0.353)
Mali -3.61*** (0.000)
-1.884 (0.285)
-11.989 (1.000)
dropped -2.05*** (0.000)
-0.099 (0.942)
Nigeria -2.33*** (0.000)
-2.713* (0.024)
-5.119*** (0.000)
-3.355* (0.025)
-1.195** (0.001)
-2.500* (0.019)
Sudan -4.03*** (0.000)
0.765 (0.700)
-6.113*** (0.000)
-5.050** (0.004)
-1.30*** (0.000)
-0.879 (0.382)
Senegal -3.09*** (0.000)
-0.444 (0.783)
-4.703*** (0.000)
-4.938** (0.002)
-1.46*** (0.000)
-1.373 (0.212)
Chad -9.167 (1.000)
dropped -6.708*** (0.000)
-5.356** (0.009)
-9.352 (1.000)
dropped
Zimbabwe -1.81*** (0.000)
-1.196 (0.061)
-6.626 (1.000)
dropped -1.32*** (0.000)
-2.64*** (0.000)
Austria 0.796 (0.584)
-14.667*** (0.000)
-5.324 (0.227)
-8.008 (0.176)
0.492 (0.675)
-5.840 (0.092)
Belgium-Luxemburg
0.519 (0.673)
-9.704** (0.001)
-4.082 (0.234)
-6.423 (0.173)
0.240 (0.813)
-3.872 (0.198)
Switzerland 0.186 (0.882)
-13.233*** (0.000)
-4.255 (0.262)
-5.732 (0.257)
-0.040 (0.968)
-0.765 (0.796)
Germany -0.247 (0.492)
3.522*** (0.000)
0.707 (0.405)
1.322 (0.263)
0.307 (0.290)
1.053 (0.165)
Denmark -0.291 (0.856)
-18.078*** (0.000)
-4.954 (0.280)
-9.176 (0.138)
-0.291 (0.823)
-4.733 (0.223)
36
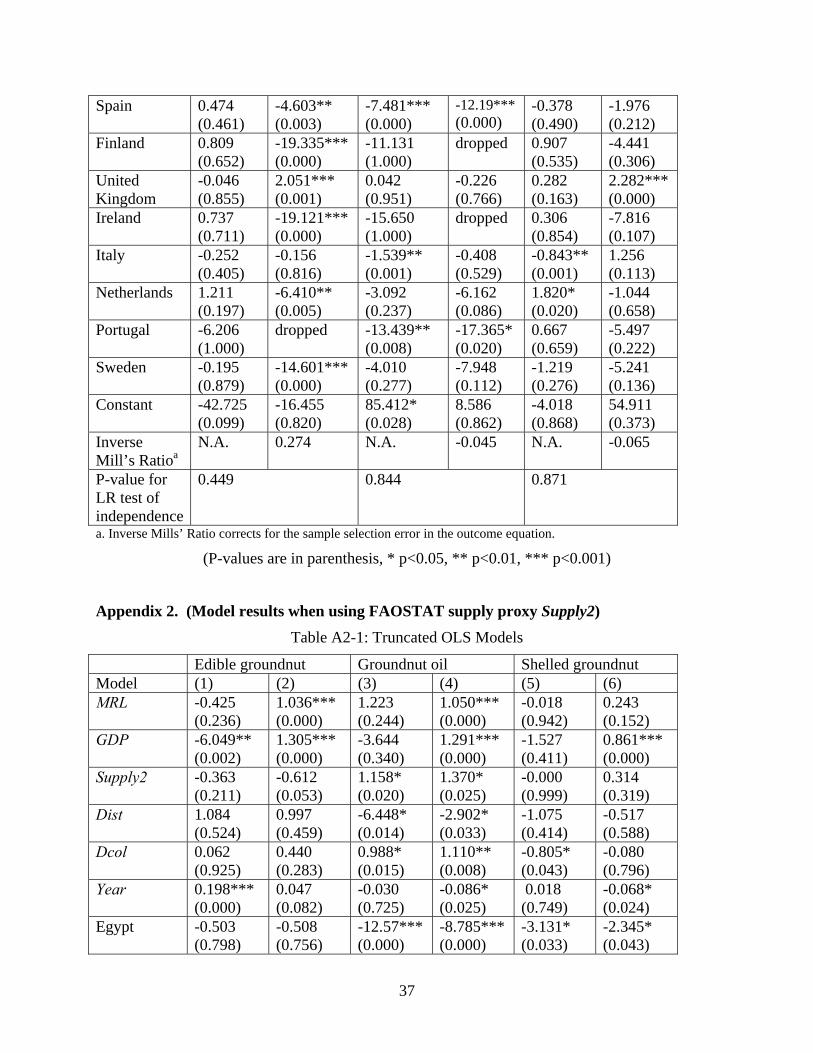
Spain 0.474 (0.461)
-4.603** (0.003)
-7.481*** (0.000)
-12.19*** (0.000)
-0.378 (0.490)
-1.976 (0.212)
Finland 0.809 (0.652)
-19.335*** (0.000)
-11.131 (1.000)
dropped 0.907 (0.535)
-4.441 (0.306)
United Kingdom
-0.046 (0.855)
2.051*** (0.001)
0.042 (0.951)
-0.226 (0.766)
0.282 (0.163)
2.282*** (0.000)
Ireland 0.737 (0.711)
-19.121*** (0.000)
-15.650 (1.000)
dropped 0.306 (0.854)
-7.816 (0.107)
Italy -0.252 (0.405)
-0.156 (0.816)
-1.539** (0.001)
-0.408 (0.529)
-0.843** (0.001)
1.256 (0.113)
Netherlands 1.211 (0.197)
-6.410** (0.005)
-3.092 (0.237)
-6.162 (0.086)
1.820* (0.020)
-1.044 (0.658)
Portugal -6.206 (1.000)
dropped -13.439** (0.008)
-17.365* (0.020)
0.667 (0.659)
-5.497 (0.222)
Sweden -0.195 (0.879)
-14.601*** (0.000)
-4.010 (0.277)
-7.948 (0.112)
-1.219 (0.276)
-5.241 (0.136)
Constant -42.725 (0.099)
-16.455 (0.820)
85.412* (0.028)
8.586 (0.862)
-4.018 (0.868)
54.911 (0.373)
Inverse Mill’s Ratioa
N.A. 0.274 N.A. -0.045 N.A. -0.065
P-value for LR test of independence
0.449 0.844 0.871
a. Inverse Mills’ Ratio corrects for the sample selection error in the outcome equation.
(P-values are in parenthesis, * p<0.05, ** p<0.01, *** p<0.001)
Appendix 2. (Model results when using FAOSTAT supply proxy Supply2) Table A2-1: Truncated OLS Models
Edible groundnut Groundnut oil Shelled groundnut Model (1) (2) (3) (4) (5) (6) MRL -0.425
(0.236) 1.036*** (0.000)
1.223 (0.244)
1.050*** (0.000)
-0.018 (0.942)
0.243 (0.152)
GDP -6.049** (0.002)
1.305*** (0.000)
-3.644 (0.340)
1.291*** (0.000)
-1.527 (0.411)
0.861*** (0.000)
Supply2 -0.363 (0.211)
-0.612 (0.053)
1.158* (0.020)
1.370* (0.025)
-0.000 (0.999)
0.314 (0.319)
Dist 1.084 (0.524)
0.997 (0.459)
-6.448* (0.014)
-2.902* (0.033)
-1.075 (0.414)
-0.517 (0.588)
Dcol 0.062 (0.925)
0.440 (0.283)
0.988* (0.015)
1.110** (0.008)
-0.805* (0.043)
-0.080 (0.796)
Year 0.198*** (0.000)
0.047 (0.082)
-0.030 (0.725)
-0.086* (0.025)
0.018 (0.749)
-0.068* (0.024)
Egypt -0.503 (0.798)
-0.508 (0.756)
-12.57*** (0.000)
-8.785*** (0.000)
-3.131* (0.033)
-2.345* (0.043)
37

Gambia -2.136 (0.181)
-2.342 (0.095)
-2.951 (0.168)
0.505 (0.732)
-1.631 (0.146)
-0.269 (0.770)
Mali -2.775 (0.105)
-3.114* (0.043)
dropped dropped -2.659* (0.037)
-3.130** (0.004)
Nigeria -0.912 (0.500)
-0.287 (0.814)
-7.877*** (0.001)
-5.994** (0.007)
-4.860*** (0.000)
-4.989*** (0.000)
Sudan 0.682 (0.713)
0.635 (0.729)
-6.311** (0.005)
-3.027 (0.056)
-1.637 (0.117)
-1.294 (0.126)
Senegal -1.548 (0.315)
-1.509 (0.261)
-3.513 (0.078)
-0.797 (0.497)
-2.344* (0.033)
-1.656* (0.049)
Chad dropped dropped -8.320** (0.001)
-3.759* (0.024)
Dropped Dropped
Zimbabwe -1.787** (0.001)
-1.239* (0.012)
dropped Dropped -3.578*** (0.000)
-3.173*** (0.000)
Austria -13.990*** (0.000)
-11.308 (0.159)
-5.701 (0.117)
Belgium-Luxemburg
-9.244** (0.005)
-7.775 (0.225)
-3.592 (0.254)
Switzerland -12.465*** (0.000)
-7.109 (0.301)
-0.638 (0.837)
Germany 3.209*** (0.000)
1.508 (0.345)
1.190 (0.143)
Denmark -16.44*** (0.000)
-10.651 (0.205)
-4.536 (0.271)
Spain -4.528** (0.007)
-12.73*** (0.001)
-1.813 (0.279)
Finland -18.56*** (0.000)
dropped -4.257 (0.347)
United Kingdom
1.780** (0.009)
-0.434 (0.674)
2.214*** (0.000)
Ireland -18.355*** (0.000)
dropped -7.561 (0.134)
Italy -0.082 (0.910)
-0.558 (0.508)
1.445 (0.078)
Netherlands -6.243* (0.012)
-7.020 (0.150)
-0.757 (0.751)
Portugal dropped -19.148 (0.053)
-4.974 (0.291)
Sweden -13.565*** (0.000)
N.A.
-9.363 (0.169)
N.A.
-4.628 (0.214)
N.A.
Constant -229.8*** (0.000)
-129.75* (0.020)
215.00** (0.009)
153.73* (0.035)
23.15 (0.751)
119.61* (0.037)
R-Squared 0.530 0.398 0.708 0.515 0.437 0.251 Observations 287 231 462
(P-values are in parenthesis, * p<0.05, ** p<0.01, *** p<0.001)
38

Table A2-2: Truncated Robust Regression Models
Edible groundnut Groundnut oil Shelled groundnut Model (1) (2) (3) (4) (5) (6) MRL -0.476
(0.183) 1.024*** (0.000)
1.207 (0.221)
1.146*** (0.000)
-0.058 (0.805)
0.232 (0.170)
GDP -5.877** (0.003)
1.305*** (0.000)
-3.070 (0.393)
1.035*** (0.000)
-1.947 (0.279)
0.85*** (0.000)
Supply2 -0.365 (0.207)
-0.604 (0.058)
1.084* (0.020)
1.225* (0.013)
-0.037 (0.893)
0.322 (0.304)
Dist 1.145 (0.501)
1.021 (0.451)
-6.416** (0.009)
-8.11*** (0.000)
-1.169 (0.359)
-0.677 (0.477)
Dcol 0.060 (0.928)
0.455 (0.271)
0.972* (0.011)
0.944** (0.005)
-0.804* (0.037)
-0.065 (0.833)
Year 0.194*** (0.000)
0.047 (0.084)
-0.035 (0.666)
-0.099** (0.001)
0.034 (0.530)
-0.06* (0.027)
Egypt -0.387 (0.844)
-0.458 (0.781)
-12.63*** (0.000)
dropped -3.332* (0.019)
-2.537* (0.028)
Gambia -2.152 (0.177)
-2.326 (0.099)
-3.084 (0.125)
-3.668** (0.002)
-1.858 (0.087)
-0.397 (0.665)
Mali -2.732 (0.109)
-3.095* (0.046)
dropped dropped -2.869* (0.020)
-3.302** (0.002)
Nigeria -0.833 (0.537)
-0.270 (0.825)
-7.512*** (0.001)
-8.79*** (0.000)
-4.83*** (0.000)
-5.08*** (0.000)
Sudan 0.701 (0.705)
0.628 (0.733)
-6.247** (0.003)
-7.31*** (0.000)
-1.76 (0.081)
-1.447 (0.086)
Senegal -1.504 (0.328)
-1.499 (0.267)
-3.544 (0.058)
4.603*** (0.000)
-2.495* (0.019)
-1.807* (0.031)
Chad dropped dropped -8.288*** (0.001)
-9.25*** (0.000)
Dropped dropped
Zimbabwe -1.805*** (0.001)
-1.237* (0.013)
dropped dropped -3.69*** (0.000)
-3.24*** (0.000)
Austria -13.61*** (0.000)
-10.28 (0.173)
-6.467 (0.066)
Belgium-Luxemburg
-8.894** (0.007)
-6.678 (0.267)
-4.290 (0.159)
Switzerland -12.18*** (0.000)
-6.200 (0.337)
-0.994 (0.741)
Germany 3.187*** (0.000)
1.271 (0.397)
1.337 (0.089)
Denmark -16.07*** (0.000)
-9.466 (0.231)
-5.436 (0.173)
Spain -4.325* (0.010)
-12.20*** (0.000)
-2.163 (0.182)
Finland -18.21*** (0.000)
N.A.
dropped
N.A.
-5.303 (0.226)
N.A.
39
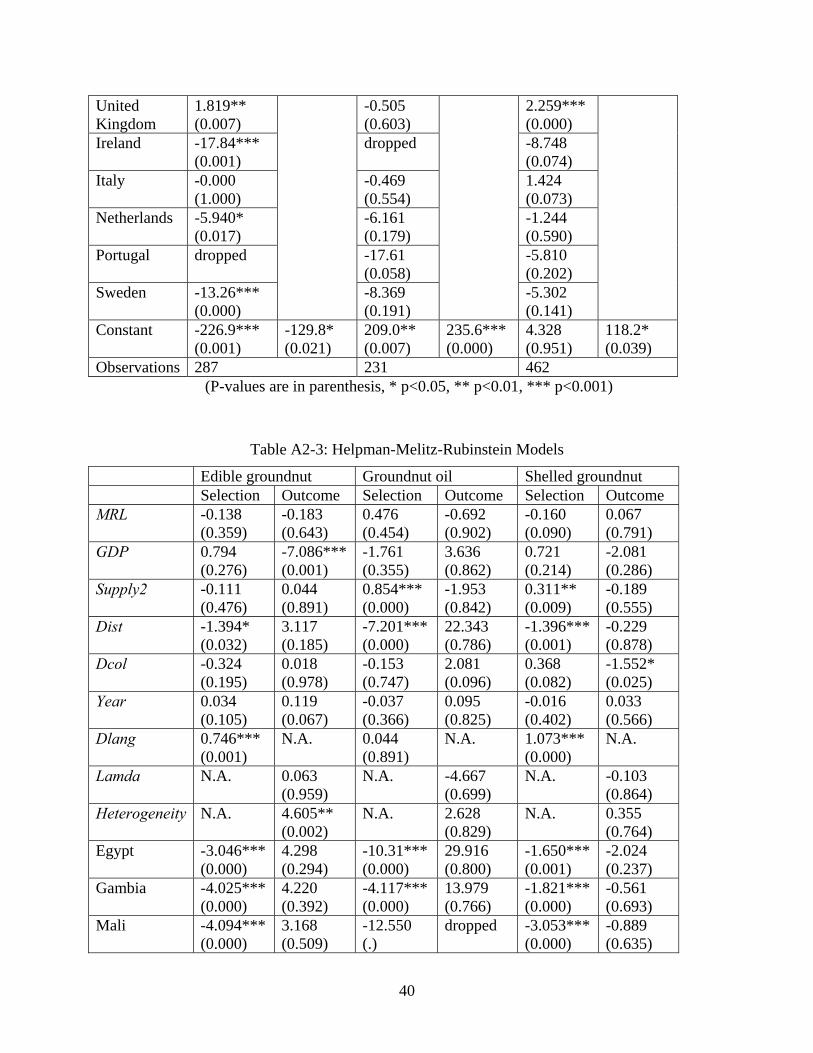
United Kingdom
1.819** (0.007)
-0.505 (0.603)
2.259*** (0.000)
Ireland -17.84*** (0.001)
dropped -8.748 (0.074)
Italy -0.000 (1.000)
-0.469 (0.554)
1.424 (0.073)
Netherlands -5.940* (0.017)
-6.161 (0.179)
-1.244 (0.590)
Portugal dropped -17.61 (0.058)
-5.810 (0.202)
Sweden -13.26*** (0.000)
-8.369 (0.191)
-5.302 (0.141)
Constant -226.9*** (0.001)
-129.8* (0.021)
209.0** (0.007)
235.6*** (0.000)
4.328 (0.951)
118.2* (0.039)
Observations 287 231 462 (P-values are in parenthesis, * p<0.05, ** p<0.01, *** p<0.001)
Table A2-3: Helpman-Melitz-Rubinstein Models
Edible groundnut Groundnut oil Shelled groundnut Selection Outcome Selection Outcome Selection Outcome MRL -0.138
(0.359) -0.183 (0.643)
0.476 (0.454)
-0.692 (0.902)
-0.160 (0.090)
0.067 (0.791)
GDP 0.794 (0.276)
-7.086*** (0.001)
-1.761 (0.355)
3.636 (0.862)
0.721 (0.214)
-2.081 (0.286)
Supply2 -0.111 (0.476)
0.044 (0.891)
0.854*** (0.000)
-1.953 (0.842)
0.311** (0.009)
-0.189 (0.555)
Dist -1.394* (0.032)
3.117 (0.185)
-7.201*** (0.000)
22.343 (0.786)
-1.396*** (0.001)
-0.229 (0.878)
Dcol -0.324 (0.195)
0.018 (0.978)
-0.153 (0.747)
2.081 (0.096)
0.368 (0.082)
-1.552* (0.025)
Year 0.034 (0.105)
0.119 (0.067)
-0.037 (0.366)
0.095 (0.825)
-0.016 (0.402)
0.033 (0.566)
Dlang 0.746*** (0.001)
N.A. 0.044 (0.891)
N.A. 1.073*** (0.000)
N.A.
Lamda N.A. 0.063 (0.959)
N.A. -4.667 (0.699)
N.A. -0.103 (0.864)
Heterogeneity N.A. 4.605** (0.002)
N.A. 2.628 (0.829)
N.A. 0.355 (0.764)
Egypt -3.046*** (0.000)
4.298 (0.294)
-10.31*** (0.000)
29.916 (0.800)
-1.650*** (0.001)
-2.024 (0.237)
Gambia -4.025*** (0.000)
4.220 (0.392)
-4.117*** (0.000)
13.979 (0.766)
-1.821*** (0.000)
-0.561 (0.693)
Mali -4.094*** (0.000)
3.168 (0.509)
-12.550 (.)
dropped -3.053*** (0.000)
-0.889 (0.635)
40
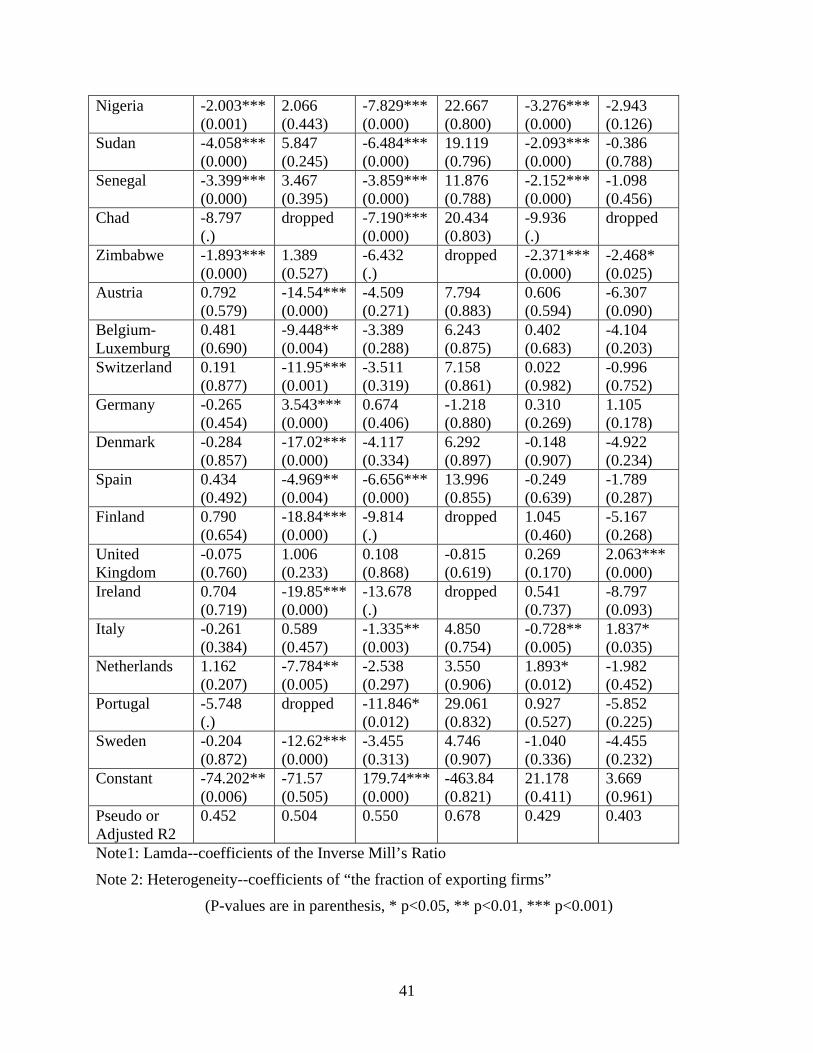
Nigeria -2.003*** (0.001)
2.066 (0.443)
-7.829*** (0.000)
22.667 (0.800)
-3.276*** (0.000)
-2.943 (0.126)
Sudan -4.058*** (0.000)
5.847 (0.245)
-6.484*** (0.000)
19.119 (0.796)
-2.093*** (0.000)
-0.386 (0.788)
Senegal -3.399*** (0.000)
3.467 (0.395)
-3.859*** (0.000)
11.876 (0.788)
-2.152*** (0.000)
-1.098 (0.456)
Chad -8.797 (.)
dropped -7.190*** (0.000)
20.434 (0.803)
-9.936 (.)
dropped
Zimbabwe -1.893*** (0.000)
1.389 (0.527)
-6.432 (.)
dropped -2.371*** (0.000)
-2.468* (0.025)
Austria 0.792 (0.579)
-14.54*** (0.000)
-4.509 (0.271)
7.794 (0.883)
0.606 (0.594)
-6.307 (0.090)
Belgium-Luxemburg
0.481 (0.690)
-9.448** (0.004)
-3.389 (0.288)
6.243 (0.875)
0.402 (0.683)
-4.104 (0.203)
Switzerland 0.191 (0.877)
-11.95*** (0.001)
-3.511 (0.319)
7.158 (0.861)
0.022 (0.982)
-0.996 (0.752)
Germany -0.265 (0.454)
3.543*** (0.000)
0.674 (0.406)
-1.218 (0.880)
0.310 (0.269)
1.105 (0.178)
Denmark -0.284 (0.857)
-17.02*** (0.000)
-4.117 (0.334)
6.292 (0.897)
-0.148 (0.907)
-4.922 (0.234)
Spain 0.434 (0.492)
-4.969** (0.004)
-6.656*** (0.000)
13.996 (0.855)
-0.249 (0.639)
-1.789 (0.287)
Finland 0.790 (0.654)
-18.84*** (0.000)
-9.814 (.)
dropped 1.045 (0.460)
-5.167 (0.268)
United Kingdom
-0.075 (0.760)
1.006 (0.233)
0.108 (0.868)
-0.815 (0.619)
0.269 (0.170)
2.063*** (0.000)
Ireland 0.704 (0.719)
-19.85*** (0.000)
-13.678 (.)
dropped 0.541 (0.737)
-8.797 (0.093)
Italy -0.261 (0.384)
0.589 (0.457)
-1.335** (0.003)
4.850 (0.754)
-0.728** (0.005)
1.837* (0.035)
Netherlands 1.162 (0.207)
-7.784** (0.005)
-2.538 (0.297)
3.550 (0.906)
1.893* (0.012)
-1.982 (0.452)
Portugal -5.748 (.)
dropped -11.846* (0.012)
29.061 (0.832)
0.927 (0.527)
-5.852 (0.225)
Sweden -0.204 (0.872)
-12.62*** (0.000)
-3.455 (0.313)
4.746 (0.907)
-1.040 (0.336)
-4.455 (0.232)
Constant -74.202** (0.006)
-71.57 (0.505)
179.74***(0.000)
-463.84 (0.821)
21.178 (0.411)
3.669 (0.961)
Pseudo or Adjusted R2
0.452 0.504 0.550 0.678 0.429 0.403
Note1: Lamda--coefficients of the Inverse Mill’s Ratio
Note 2: Heterogeneity--coefficients of “the fraction of exporting firms”
(P-values are in parenthesis, * p<0.05, ** p<0.01, *** p<0.001)
41

Table A2-4: PPML and ZIP models
Edible groundnut Groundnut oil Shelled groundnut Model PPML ZIP
outcome PPML ZIP
outcome PPML ZIP
outcome MRL -0.321
(0.222) -0.265 (0.306)
2.751** (0.008)
2.090* (0.027)
-0.192 (0.440)
-0.359 (0.142)
GDP 3.060 (0.115)
2.708 (0.179)
2.462 (0.227)
3.227 (0.092)
8.518** (0.004)
3.164 (0.197)
Supply2 -0.070 (0.596)
-0.094 (0.511)
0.744* (0.014)
0.474 (0.166)
0.254 (0.360)
-0.158 (0.544)
Dist 0.208 (0.918)
-0.448 (0.778)
-11.53*** (0.000)
-5.058** (0.002)
-12.33*** (0.001)
-6.374* (0.032)
Dcol -0.567 (0.216)
-0.345 (0.429)
-0.292 (0.593)
0.888* (0.042)
-2.70*** (0.000)
-2.54*** (0.000)
Dlang 1.243** (0.003)
0.012 (0.976)
-0.280 (0.633)
-0.190 (0.652)
2.439*** (0.000)
1.938***(0.000)
Year 0.075 (0.088)
0.066 (0.144)
-0.132*** (0.001)
-0.127** (0.002)
-0.182* (0.020)
-0.029 (0.641)
Egypt -3.272 (0.156)
-2.547 (0.187)
-23.24*** (0.000)
-17.12*** (0.000)
-15.31*** (0.000)
-8.844* (0.010)
Gambia -3.733* (0.030)
-1.229 (0.351)
-6.463*** (0.000)
-3.098* (0.015)
-9.729*** (0.000)
-5.354* (0.015)
Mali -7.303*** (0.000)
-3.919** (0.006)
-33.13*** (0.000)
dropped -15.58*** (0.000)
-8.52*** (0.001)
Nigeria -2.675 (0.074)
-2.182 (0.057)
-9.581*** (0.000)
-4.515** (0.009)
-13.41*** (0.000)
-7.45*** (0.000)
Sudan -4.739* (0.014)
0.458 (0.684)
-7.831*** (0.000)
-4.152** (0.007)
-10.15*** (0.000)
-5.169* (0.017)
Senegal -4.853** (0.004)
-2.853* (0.050)
-4.499** (0.003)
-2.273 (0.078)
-11.24*** (0.000)
-6.449** (0.004)
Chad -18.17*** (0.000)
-8.091*** (0.001)
-11.46*** (0.000)
-6.607*** (0.000)
-35.82*** (0.000)
dropped
Zimbabwe -3.717*** (0.000)
-2.713*** (0.000)
-25.39*** (0.000)
dropped -8.006*** (0.000)
-5.57*** (0.000)
Austria 3.315 (0.380)
2.441 (0.529)
2.308 (0.629)
2.812 (0.512)
11.495 (0.050)
2.711 (0.572)
Belgium-Luxemburg
5.696 (0.073)
5.307 (0.108)
2.145 (0.537)
4.306 (0.183)
11.837* (0.017)
3.578 (0.388)
Switzerland 2.446 (0.457)
1.983 (0.563)
4.073 (0.304)
5.892 (0.102)
13.414** (0.008)
5.937 (0.142)
Germany 0.106 (0.890)
0.184 (0.814)
-0.275 (0.803)
-0.314 (0.769)
-2.118 (0.071)
-0.652 (0.510)
Denmark 0.055 (0.990)
-1.964 (0.654)
2.517 (0.595)
3.023 (0.489)
13.093* (0.039)
4.085 (0.434)
42

Spain 3.803* (0.011)
3.478* (0.023)
-11.42*** (0.000)
-7.674*** (0.000)
1.076 (0.696)
0.375 (0.866)
Finland 4.258 (0.364)
3.868 (0.425)
-20.74*** (0.000)
dropped 20.425** (0.004)
7.133 (0.226)
United Kingdom
0.613 (0.269)
1.501* (0.021)
-0.643 (0.531)
-0.266 (0.766)
1.418*** (0.001)
1.255** (0.001)
Ireland 3.904 (0.411)
4.770 (0.340)
-26.59*** (0.000)
dropped 15.756* (0.035)
2.495 (0.695)
Italy 1.032* (0.030)
0.888 (0.064)
-0.879 (0.143)
0.603 (0.147)
-0.941 (0.364)
0.400 (0.686)
Netherlands 5.907* (0.015)
5.368* (0.033)
0.454 (0.864)
2.211 (0.369)
13.025*** (0.001)
5.519 (0.082)
Portugal -11.578* (0.015)
dropped -12.44* (0.019)
-4.582 (0.389)
15.767* (0.041)
6.382 (0.332)
Sweden 1.077 (0.746)
1.327 (0.695)
1.022 (0.787)
1.189 (0.734)
7.470 (0.145)
2.469 (0.554)
Constant -232.1*** (0.000)
-198.5*** (0.000)
294.9*** (0.000)
205.0*** (0.000)
243.9** (0.002)
37.0 (0.581)
Pseudo R2 0.830 0.904 0.630 (P-values are in parenthesis, * p<0.05, ** p<0.01, *** p<0.001)
Table A2-5: Heckman Maximum Likelihood models
Edible groundnut Groundnut oil Shelled groundnuta Selection Outcome Selection Outcome Selection Outcome MRL -0.138
(0.360) -0.457 (0.184)
0.465 (0.465)
1.186 (0.233)
-0.160 (0.090)
0.026 (0.916)
GDP 0.821 (0.262)
-5.879** (0.002)
-1.889 (0.326)
-3.513 (0.332)
0.721 (0.214)
-1.938 (0.304)
Supply2 -0.111 (0.480)
-0.369 (0.183)
0.862*** (0.000)
1.109* (0.020)
0.311** (0.009)
-0.072 (0.807)
Dist -1.408* (0.030)
0.772 (0.643)
-7.226*** (0.000)
-5.897* (0.028)
-1.40*** (0.001)
-0.659 (0.636)
Dcol -0.312 (0.213)
0.019 (0.976)
-0.154 (0.746)
1.032** (0.009)
0.368 (0.082)
-1.056* (0.039)
Year 0.034 (0.100)
0.203*** (0.000)
-0.035 (0.395)
-0.029 (0.728)
-0.016 (0.402)
0.026 (0.631)
Dlang 0.732*** (0.001)
N.A. 0.047 (0.884)
N.A. 1.073*** (0.000)
N.A.
Egypt -3.071*** (0.000)
-1.163 (0.566)
-10.34*** (0.000)
-11.71** (0.001)
-1.65*** (0.001)
-2.643 (0.090)
Gambia -4.044*** (0.000)
-2.988 (0.100)
-4.122*** (0.000)
-2.610 (0.221)
-1.821*** (0.000)
-1.133 (0.374)
Mali -4.111*** (0.000)
-3.607 (0.057)
-13.25 (1.000)
dropped -3.053*** (0.000)
-1.931 (0.218)
43

44
Nigeria -2.023*** (0.001)
-1.349 (0.330)
-7.871*** (0.000)
-7.319** (0.003)
-3.276*** (0.000)
-4.053** (0.010)
Sudan -4.078*** (0.000)
-0.262 (0.900)
-6.516*** (0.000)
-5.843* (0.011)
-2.093*** (0.000)
-1.106 (0.370)
Senegal -3.417*** (0.000)
-2.243 (0.180)
-3.881*** (0.000)
-3.220 (0.101)
-2.152*** (0.000)
-1.818 (0.153)
Chad -9.525 (1.000)
dropped -7.213*** (0.000)
-7.768** (0.003)
-9.936 (.)
dropped
Zimbabwe -1.902*** (0.000)
-2.151** (0.001)
-7.087 (1.000)
dropped -2.371*** (0.000)
-3.07*** (0.001)
Austria 0.851 (0.553)
-13.81*** (0.000)
-4.779 (0.247)
-10.93 (0.150)
0.606 (0.594)
-6.255 (0.083)
Belgium-Luxemburg
0.539 (0.656)
-9.116** (0.003)
-3.605 (0.263)
-7.513 (0.215)
0.402 (0.683)
-4.081 (0.191)
Switzerland 0.240 (0.846)
-12.40*** (0.000)
-3.740 (0.293)
-6.849 (0.293)
0.022 (0.982)
-1.018 (0.739)
Germany -0.265 (0.454)
3.137*** (0.000)
0.710 (0.384)
1.461 (0.334)
0.310 (0.269)
1.228 (0.120)
Denmark -0.222 (0.888)
-16.61*** (0.000)
-4.399 (0.306)
-10.34 (0.194)
-0.148 (0.907)
-4.712 (0.239)
Spain 0.475 (0.454)
-4.452** (0.005)
-6.779*** (0.000)
-12.23*** (0.001)
-0.249 (0.639)
-1.878 (0.249)
Finland 0.861 (0.626)
-18.35*** (0.000)
-10.81 (1.000)
dropped 1.045 (0.460)
-5.041 (0.264)
United Kingdom
-0.067 (0.787)
1.867** (0.004)
0.107 (0.870)
-0.438 (0.653)
0.269 (0.170)
2.174*** (0.000)
Ireland 0.796 (0.685)
-18.04*** (0.000)
-14.75 (1.000)
dropped 0.541 (0.737)
-8.511 (0.092)
Italy -0.257 (0.390)
-0.131 (0.850)
-1.364** (0.002)
-0.455 (0.579)
-0.728** (0.005)
1.609 (0.051)
Netherlands 1.215 (0.189)
-6.007* (0.012)
-2.701 (0.271)
-6.822 (0.140)
1.893* (0.012)
-1.487 (0.554)
Portugal -6.410 (1.000)
dropped -12.17* (0.011)
-18.24 (0.054)
0.927 (0.527)
-5.710 (0.222)
Sweden -0.152 (0.905)
-13.587*** (0.000)
-3.681 (0.287)
-9.11 (0.157)
-1.040 (0.336)
-4.601 (0.202)
Constant -76.04** (0.005)
-241.47*** (0.000)
179.55*** (0.000)
203.24* (0.012)
21.18 (0.411)
14.254 (0.843)
Inverse Mill’s Ratiob
N.A. 0.315 N.A. -0.127 N.A. -0.436 (0.452)
independence test (P-value)
0.416 0.612 N.A.
Notes: a. The model is estimated via Two-Step because of the convergence problem with the Maximum Likelihood. b. Inverse Mills’ Ratio corrects for the sample selection error in the outcome equations. *. The associated P-values are in parenthesis. * p<0.05, ** p<0.01, *** p<0.001