Embed Size (px)
Citation preview

Affinity analysis of non-steady-state data obtainedunder mass transport limited conditions usingBIAcore technology
Robert Karlsson*Biacore AB, Rapsgatan 7, S 754 50 Uppsala, Sweden
Binding data obtained with Biacore instrumentation is often evaluated using a kinetic transport modelwhere reaction rate constants and a mass transport coefficient are used to describe the interaction. Here theuse of a simplified model, an affinity transport model, for determination of the affinity (KD) but not thekinetics (ka, kd) has been investigated. When binding rates were highly governed by mass transport effectsthe two models returned the same affinity and gave similar residuals, butka and kd values found with thekinetic transport model were unreliable. On the other hand the affinity transport model failed to describethe data when binding curves were less influenced by mass transport effects. Under such circumstances thekinetic transport model returned correct ka and kd values. Depending on the outcome of the analysis theaffinity transport model can therefore be used to reduce uncertainties of the kinetic parameters or as an easyway to determineKD values from non-steady-state data. The use of the affinity transport model is illustratedwith simulated data and with binding data obtained for the interaction between a 439 Da thrombin inhibitorand immobilized thrombin. Since it is more difficult to resolve high ka values for low molecular weightanalytes, the affinity transport model may be particularly useful for affinity analysis involving fast reactionsbetween such analytes and immobilized protein targets. Copyright# 1999 John Wiley & Sons, Ltd.
Keywords:BIAcore; affinity; kinetics; transport model; thrombin; inogatran
Received 11 June 1999; accepted 15 June 1999
Introduction
Since the introduction of BIAcore in 1991 (Jo¨nssonet al.,1991; Karlssonet al., 1991), the use of surface plasmonresonance technology has facilitated kinetic analysis ofmolecular interactions. Provided that one of the interactionpartners can be covalently immobilized or captured to thesensor surface in active form, the non-label technologyallows interaction analysis involving analytes with mole-cular weights from a few hundred daltons to several hundredthousand daltons.
The fact that binding curves can be recorded does notautomatically mean that kinetic data can be obtained for theinteraction. The range of rate constants that can bedetermined is intimately linked to the design of the sampledelivery system, to the concentration of the immobilizedtarget and to the sensitivity of the detection. In BIAcoreinstrumentation the sample is delivered to the sensor surfacein a flow system. A baseline level is recorded with the bufferin contact with the surface. When the analyte reaches thesurface a binding curve is registered. Later the sample isreplaced by buffer and the dissociation of analyte from thecomplex is observed.
The observed binding rate can be limited either by theinteraction rate itself or by the transport rate. The balancebetween these two rates sets an upper limit to association
rate constants (ka) that can be determined. Since the SPRsignal is related to mass changes on the surface (Stenbergetal., 1991), the upperka limit also depends on the molecularweight of the analyte. To obtain a useful response in thesystem, more molecules of a low molecular weight analytemust bind to the surface than when a high molecular weightanalyte is involved. Consequently higher immobilizationlevels are required for detection of low molecular weightanalytes, and this has a negative impact on the balancebetween the intrinsic binding rate and the transport rate.
An upper limit for the dissociation rate constant (kd) is setby the time it takes to replace analyte with buffer and alower limit for kd is determined by the relation between thedissociation rate and the drift of the BIAcore signal.
Figure 1 illustrates the range of rate constants that can bedetermined at optimal experimental conditions with present(BIAcore 3000) instrumentation and how the technologyhas improved compared to the first BIAcore system. Theimprovements are partly due to a 20–30-fold increase indetector sensitivity and on changes in the flow system,leading to faster sample-to-buffer exchange rates andimproved signal referencing (Karlsson and Sta˚hlberg1995). The major reasons for the widely extendedka rangeare, however, an improved understanding of mass transporteffects (Glaser, 1993; Karlssonet al. 1994; Schuck andMinton, 1996), and the use of numerical integrationtechniques (Fisheret al., 1994; Mortonet al., 1995; Myszkaet al., 1997) to determine both the actual concentration ofanalyte at the sensor surface and the rate constants (ka, kd).
JOURNAL OF MOLECULAR RECOGNITIONJ. Mol. Recognit.1999;12:285–292
Copyright# 1999 John Wiley & Sons, Ltd. CCC 0952–3499/99/050285–08 $17.50
* Correspondence to: R. Karlsson, Biacore AB, Rapsgatan 7, S 754 50Uppsala, Sweden. E-mail: [email protected]
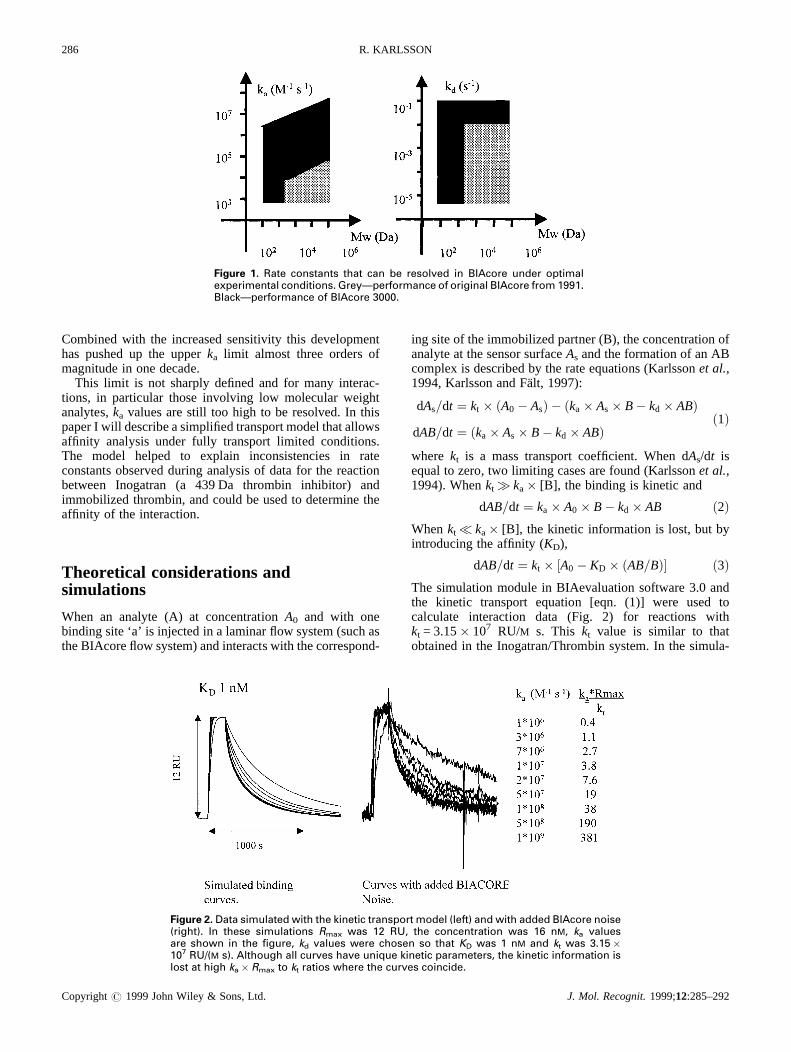
Combined with the increasedsensitivity this developmenthas pushedup the upper ka limit almost three orders ofmagnitudein onedecade.
This limi t is not sharplydefined and for many interac-tions, in particular thoseinvolving low molecular weightanalytes, ka valuesarestill too high to be resolved.In thispaperI will describeasimplified transport modelthatallowsaffinity analysis under fully transport limit ed conditions.The model helped to explain inconsistencies in rateconstants observed during analysisof datafor the reactionbetween Inogatran (a 439Da thrombin inhibitor) andimmobilized thrombin, andcould be usedto determine theaffinity of the interaction.
Theoretical considerationsandsimulations
When an analyte (A) at concentration A0 and with onebindingsite‘a’ is injectedin a laminarflow system(suchastheBIAcoreflow system)andinteractswith thecorrespond-
ing siteof theimmobilized partner(B), theconcentrationofanalyte at thesensor surfaceAs andtheformation of anABcomplex is describedby therateequations(Karlsson et al.,1994, KarlssonandFalt, 1997):
dAs=dt � kt � �A0ÿ As� ÿ �ka� As� Bÿ kd� AB�dAB=dt � �ka� As� Bÿ kd � AB�
�1�
where kt is a masstransport coefficient. When dAs/dt isequalto zero, two limit ing casesarefound(Karlsson et al.,1994). Whenkt� ka� [B], the binding is kinetic and
dAB=dt � ka� A0 � Bÿ kd � AB �2�Whenkt� ka� [B], the kinetic information is lost, but byintroducing the affinity (KD),
dAB=dt � kt � �A0 ÿ KD � �AB=B�� �3�The simulationmodule in BIAevaluationsoftware3.0 andthe kinetic transport equation [eqn. (1)] were used tocalculate interaction data (Fig. 2) for reactions withkt = 3.15� 107 RU/M s. This kt value is similar to thatobtained in the Inogatran/Thrombin system.In the simula-
Figure 1. Rate constants that can be resolved in BIAcore under optimalexperimental conditions. GreyÐperformance of original BIAcore from 1991.BlackÐperformance of BIAcore 3000.
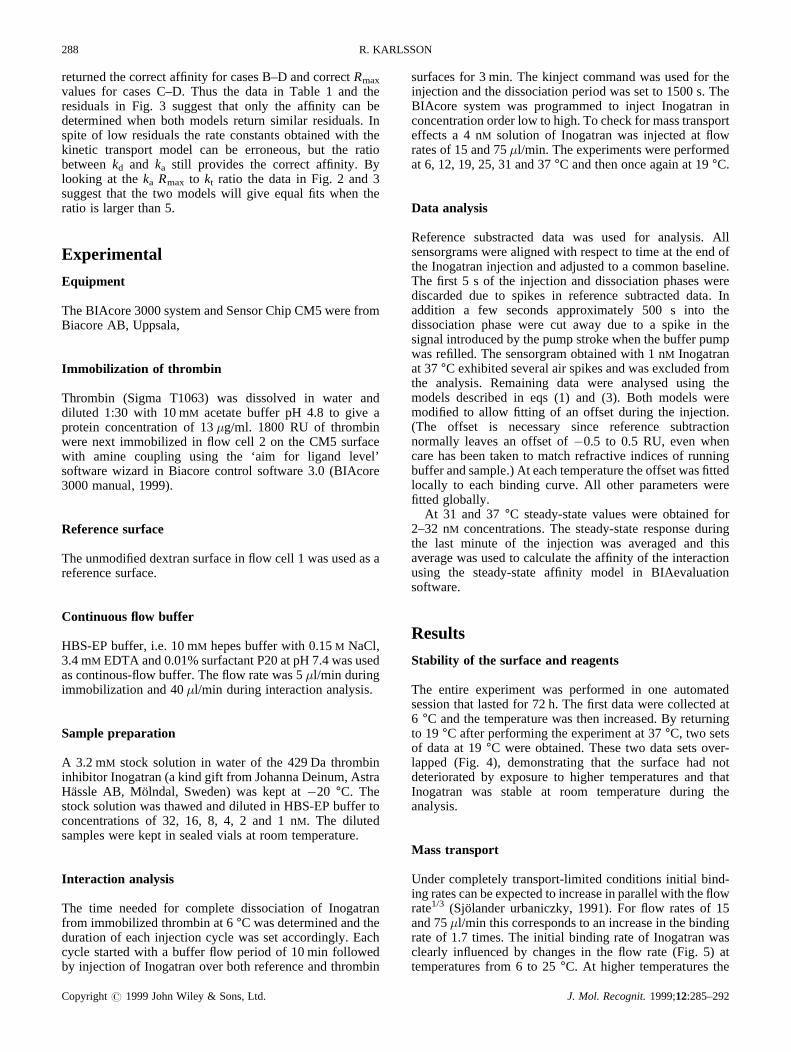
Figure 2. Data simulated with the kinetic transport model (left) and with added BIAcore noise(right). In these simulations Rmax was 12 RU, the concentration was 16 nM, ka valuesare shown in the ®gure, kd values were chosen so that KD was 1 nM and kt was 3.15�107 RU/(M s). Although all curves have unique kinetic parameters, the kinetic information islost at high ka� Rmax to kt ratios where the curves coincide.
286 R. KARLSSON
Copyright# 1999JohnWiley & Sons,Ltd. J. Mol. Recognit.1999;12:285–292

tions the concentration of analyte was 16 nM, theconcentrationof immobilized ligand expressed in termsofthe BIACORE responsewas 12 RU, ka values variedbetween 1� 106 and 1� 109/M/s, and kd values wereadjustedsothattheaffinity, KD, wasconstantand1 nM. Theinteraction curvesin the left panelof Fig. 2 thusrepresentbinding curveswith unique rate constants,but the affinityconstantis thesamefor all curves.It is evidentthatbindingcurves start to overlapat high ka valuesand consequentlythekinetic databecomesblurred.Thedatain theright panelwere obtained by adding real BIAcore noise from blankinjections to the simulated data.The resolution is slightlyimpairedby adding noise,sincethenoise is not sufficientlylow and random to maintain the small (<1 RU) butsignificant differencesseenin theoretical curves.
In Fig. 3 four data sets calculated with the kinetictransportmodel areshown. In eachdatasetconcentrationsof 32,16,8,4,2,1 and0 nM wereused,Rmaxwas12RU andkt was3.15� 107 RU/Ms. ka valueswere 106, 107, 108, and109/M/s andkd valueswere10ÿ3, 10ÿ2, 10ÿ1 and1/ssothattheKD in eachdatasetwas1 nM. To make analysissimilarto thatof realdata,5 s at thebeginning of the injectionanddissociation phaseswere cut away. Remaining data wereanalysedusing the kinetic transport modelandthe affinitytransportmodel leading to the residualsplotted below thebindingcurves.Theparametervaluesfoundaresummarizedin Table1. The kinetic transport model alwaysreturned thecorrect Rmax andaffinity, but astransport effectsstarted todominateat ka valueshigherthan107 M/s, ka andkd valueswere incorrectly determined. The affinity transportmodel
Figure 3. Four sets of simulated data. In case A ka is 106, in case B it is 107, incase C, 108, and in case D, 109/M/s. KD is 1 nM, Rmax 12 RU, kt 3.15� 107 RU/(M s) and analyte concentrations 32, 16, 8, 4, 2, 1 and 0 nM. When these datasets were evaluated with the kinetic transport model the residuals werealways low, but when the af®nity transport model was used large and non-random residuals were seen at low ka� Rmax to kt ratios. At higher ratiosthe models gave rise to identical residuals.
Table 1. Parameter values obtained by evaluating simulated data with kineticand af®nity transport models.
Case ka(1/Ms) kd(1/s) Rmax(RU) kt(RU/Ms) KD(nM)
Data usedin simulationA 1.0� 106 1.0� 10ÿ3 12.0 3.15� 107 1.0B 1.0� 107 1.0� 10ÿ2 12.0 3.15� 107 1.0C 1.0� 108 1.0� 10ÿ1 12.0 3.15� 107 1.0D 1.0� 109 1.0 12.0 3.15� 107 1.0
Data returnedby thekinetic transportmodelA 1.0� 106 1.0� 10ÿ3 12.0 3.14� 107 1.0B 9.5� 106 9.5� 10ÿ3 12.0 3.24� 107 1.0C 6.3� 107 6.2� 10ÿ2 12.0 3.24� 107 1.0D 1.5� 108 1.4� 10ÿ1 12.0 3.24� 107 1.0
Data returnedby theaffinity transportmodelA 12.6 5.70� 106 0.7B 12.3 2.17� 107 1.0C 12.0 3.02� 107 1.0D 12.0 3.14� 107 1.0
AFFINITY ANALYSIS OF NON-STEADY-STATEDATA 287
Copyright# 1999JohnWiley & Sons,Ltd. J. Mol. Recognit.1999;12:285–292
returned thecorrectaffinity for casesB–D andcorrectRmax
values for casesC–D. Thus the data in Table 1 and theresiduals in Fig. 3 suggest that only the affinity can bedetermined when both models return similar residuals. Inspite of low residuals the rate constants obtainedwith thekinetic transport model can be erroneous, but the ratiobetween kd and ka still provides the correct affinity. Bylooking at the ka Rmax to kt ratio the data in Fig. 2 and 3suggest that the two modelswill give equalfits when theratio is largerthan5.
Experimental
Equipment
TheBIAcore3000systemandSensorChipCM5 werefromBiacore AB, Uppsala,
Immobilization of thrombin
Thrombin (Sigma T1063) was dissolved in water anddiluted 1:30 with 10mM acetate buffer pH 4.8 to give aprotein concentration of 13�g/ml. 1800 RU of thrombinwerenext immobilized in flow cell 2 on the CM5 surfacewith amine coupling using the ‘aim for ligand level’software wizard in Biacorecontrol software3.0 (BIAcore3000manual, 1999).
Referencesurface
Theunmodified dextransurfacein flow cell 1 wasusedasareferencesurface.
Continuous flow buffer
HBS-EPbuffer, i.e. 10mM hepesbuffer with 0.15M NaCl,3.4mM EDTA and0.01%surfactantP20atpH 7.4wasusedascontinous-flowbuffer.Theflow ratewas5�l/min duringimmobilization and40�l/min during interaction analysis.
Sample preparation
A 3.2mM stock solution in water of the 429Da thrombininhibitor Inogatran(akind gift from JohannaDeinum,AstraHassle AB, Molndal, Sweden) was kept at ÿ20 °C. Thestocksolutionwasthawedanddiluted in HBS-EPbuffer toconcentrationsof 32, 16, 8, 4, 2 and 1 nM. The dilutedsamples were kept in sealedvials at room temperature.
Inter action analysis
The time needed for complete dissociation of Inogatranfrom immobilized thrombinat 6 °C wasdeterminedandtheduration of eachinjection cycle wassetaccordingly. Eachcycle started with a buffer flow periodof 10min followedby injectionof Inogatranoverboth referenceandthrombin
surfacesfor 3 min. The kinject command wasusedfor theinjection andthedissociationperiod wassetto 1500s.TheBIAcore systemwas programmedto inject Inogatran inconcentrationorderlow to high.To checkfor masstransporteffectsa 4 nM solution of Inogatran was injectedat flowratesof 15 and75�l/min. Theexperimentswereperformedat 6, 12,19,25,31 and37 °C andthenonceagainat 19 °C.
Data analysis
Reference substracted data was used for analysis. Allsensorgramswerealignedwith respectto time at theendofthe Inogatran injection andadjustedto a commonbaseline.The first 5 s of the injection anddissociation phaseswerediscarded due to spikes in referencesubtracted data. Inaddition a few secondsapproximately 500 s into thedissociation phasewere cut away due to a spike in thesignal introducedby thepumpstrokewhen thebufferpumpwasrefilled. Thesensorgramobtainedwith 1 nM Inogatranat 37 °C exhibitedseveral air spikesandwasexcludedfromthe analysis. Remaining data were analysed using themodels described in eqs (1) and (3). Both models weremodified to allow fitting of an offset during the injection.(The offset is necessary since reference subtractionnormally leavesan offset of ÿ0.5 to 0.5 RU, evenwhencarehasbeentaken to matchrefractive indicesof runningbufferandsample.) At eachtemperaturetheoffsetwasfittedlocally to eachbinding curve. All other parameterswerefittedglobally.
At 31 and 37 °C steady-statevalueswere obtained for2–32 nM concentrations. The steady-stateresponseduringthe last minute of the injection was averagedand thisaveragewasusedto calculatetheaffinity of the interactionusing the steady-state affinity model in BIAevaluationsoftware.
Results
Stability of the surface and reagents
The entire experimentwas performedin one automatedsession that lastedfor 72h. The first datawerecollected at6 °C andthe temperaturewasthenincreased.By returningto 19 °C after performing theexperimentat 37 °C, two setsof dataat 19 °C wereobtained.Thesetwo datasetsover-lapped (Fig. 4), demonstrating that the surface had notdeteriorated by exposure to higher temperaturesand thatInogatran was stable at room temperature during theanalysis.
Mass transport
Under completelytransport-limit ed conditionsinitial bind-ing ratescanbeexpectedto increasein parallel with theflowrate1/3 (Sjolanderurbaniczky, 1991). For flow ratesof 15and75�l/min thiscorresponds to anincreasein thebindingrateof 1.7 times.The initial binding rateof Inogatran wasclearly influencedby changesin the flow rate (Fig. 5) attemperaturesfrom 6 to 25 °C. At higher temperaturesthe
288 R. KARLSSON
Copyright# 1999JohnWiley & Sons,Ltd. J. Mol. Recognit.1999;12:285–292
flow rate dependence was less clear mainly because thesignal approachedsteadystaterapidly and initial bindingratesbecamedifficult to measure. The ratios between theinitial bindingrateat75�l/min andtheinitial bindingrateat15�l/min were1.8,2.2, 1.9 and1.7at temperaturesof 6,12,19and25°C, respectively. Consequentlybindingratesweremarkedly influencedby the transportefficiency.
Analysis of data setswith kinetic and affini ty transportmodels
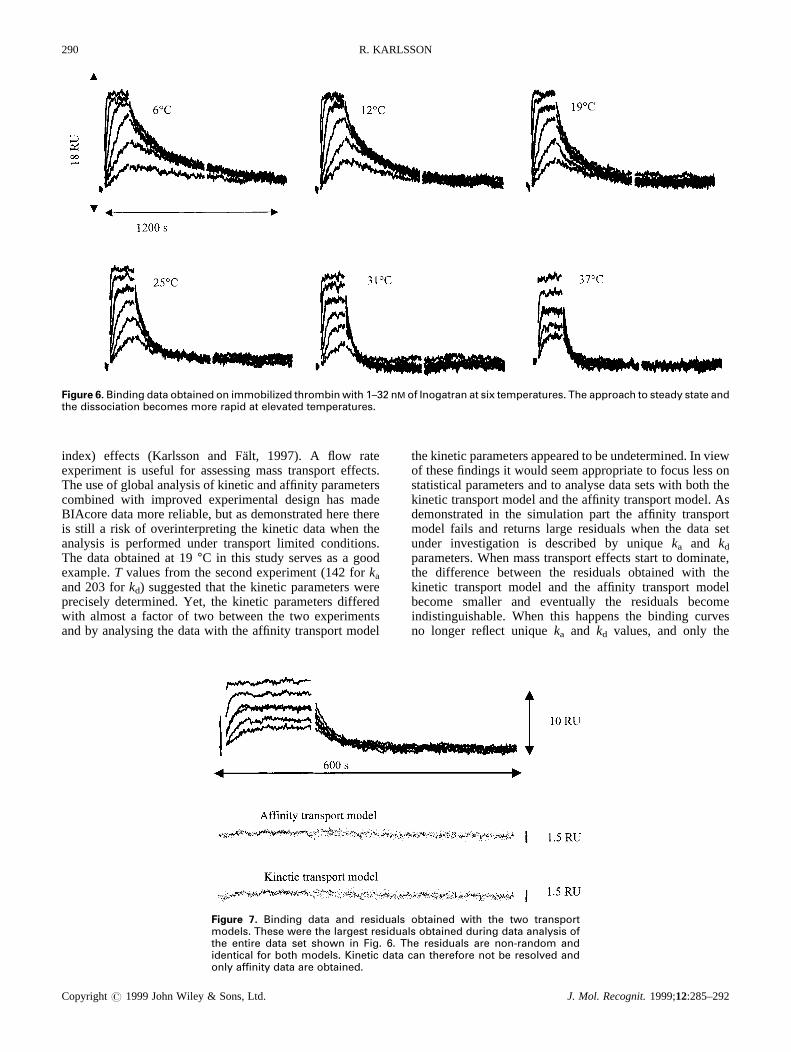
The shapeof the observed binding curves was clearlyinfluenced by the temperature (Fig. 6). The approachtosteadystateandthedissociation rateweremuch morerapidat high temperaturesthanat low temperatures.The analysisof thedataresultedin equallylow andnon-randomresidualsfor both the kinetic transport and the affinity transport
models at all temperatures. The largest residuals wereobtainedat37 °C (Fig. 7), butevenin thiscasetheresidualswere close to the noiselevel of the system. The parametervaluesarelistedin Table2. Thekinetic parametersreturnedby the software exhibited unexpected jumps from onetemperature to another,but the ratio betweenkd and ka
resulted in astepwisedropin KD valuesandtheaffinity was10 times lower at 37 °C than at 6 °C. The T value is thestandarderror of the parameterdivided with the parametervalue.TheT valuesfor thekinetic parametersranged from 2to 203.
The affinities obtainedwith the affinity transport modelwere identical to thoseobtained from thekd/ka ratio, exceptat37°C wheretherewasa30%discrepancybetween theKD
values.The T valuesassociated with the KD valuesrangedfrom 30 to 248.
Rmax andkt valuesweresimilar with bothmodels. Thekt
values increased with temperature,kt valuesare relatedtoD2/3 (D is thediffusioncoefficient of theanalyte, (SjolanderUrbaniczky, 1991) and thereforethe changein kt valuesindicateda 5–8 fold increaseof the diffusion coefficientfrom 6 to 37 °C.
Steady-stateanalysis
Plots of steady-statedataobtained at 31 and 37 °C vs theconcentration of Inogatran (Fig. 8) resulted in affinitiesclose to thosedetermined with the transport modelsandwere3.6nM at31°C and8.2nM at37°C.TheT valueswere10.2and9.9, respectively.
Discussion
Theuseof BIAcore for determinationof kinetic andaffinitydatais in principle simple,but to obtainhigh quality dataitis often necessary to pay careful attention to the experi-mental design (Myszka, 1997). Key parameters are theselectionof immobilization method(Kortt et al., 1997a,b),theimmobilization level thatshouldbelow andtheuseof areference surface for subtraction of solvent (refractive
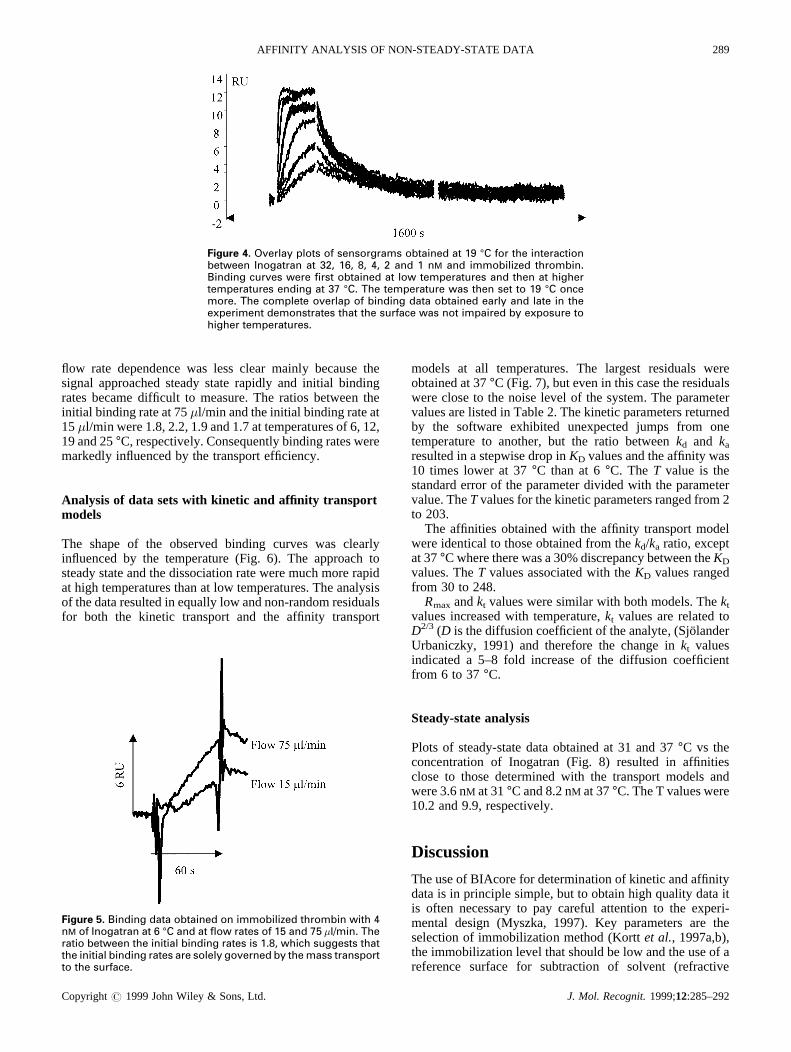
Figure 4. Overlay plots of sensorgrams obtained at 19 °C for the interactionbetween Inogatran at 32, 16, 8, 4, 2 and 1 nM and immobilized thrombin.Binding curves were ®rst obtained at low temperatures and then at highertemperatures ending at 37 °C. The temperature was then set to 19 °C oncemore. The complete overlap of binding data obtained early and late in theexperiment demonstrates that the surface was not impaired by exposure tohigher temperatures.
Figure 5. Binding data obtained on immobilized thrombin with 4nM of Inogatran at 6 °C and at ¯ow rates of 15 and 75 �l/min. Theratio between the initial binding rates is 1.8, which suggests thatthe initial binding rates are solely governed by the mass transportto the surface.
AFFINITY ANALYSIS OF NON-STEADY-STATEDATA 289
Copyright# 1999JohnWiley & Sons,Ltd. J. Mol. Recognit.1999;12:285–292
index) effects (Karlsson and Falt, 1997). A flow rateexperiment is useful for assessing masstransport effects.Theuseof globalanalysisof kinetic andaffinity parameterscombined with improved experimental design has madeBIAcoredatamorereliable, but asdemonstratedherethereis still a risk of overinterpretingthe kinetic datawhen theanalysis is performedunder transportlimited conditions.The dataobtained at 19 °C in this studyservesasa goodexample. T valuesfrom the second experiment (142 for ka
and203 for kd) suggested that the kinetic parameterswereprecisely determined. Yet, the kinetic parameters differedwith almosta factor of two betweenthe two experimentsandby analysing the datawith the affinity transport model
thekineticparametersappearedto beundetermined.In viewof thesefindings it would seemappropriateto focusless onstatistical parametersandto analysedatasets with both thekinetic transport model andtheaffinity transport model. Asdemonstratedin the simulation part the affinity transportmodel fails and returnslarge residuals when the data setunder investigation is described by unique ka and kd
parameters.Whenmasstransport effectsstart to dominate,the difference between the residuals obtained with thekinetic transportmodel and the affinity transportmodelbecome smaller and eventually the residuals becomeindistinguishable. When this happens the binding curvesno longer reflect unique ka and kd values,and only the
Figure 6. Binding data obtained on immobilized thrombin with 1±32 nM of Inogatran at six temperatures. The approach to steady state andthe dissociation becomes more rapid at elevated temperatures.
Figure 7. Binding data and residuals obtained with the two transportmodels. These were the largest residuals obtained during data analysis ofthe entire data set shown in Fig. 6. The residuals are non-random andidentical for both models. Kinetic data can therefore not be resolved andonly af®nity data are obtained.
290 R. KARLSSON
Copyright# 1999JohnWiley & Sons,Ltd. J. Mol. Recognit.1999;12:285–292

affinity is well defined. Another sign that suggests thatkinetic datamay be unreliable is when the ratio betweencalculated ka Rmax and kt is higher than 5. The affinitytransport model thus servesas a safeguard and prevents
undue interpretation of rate constants. The model is alsouseful for determining affinity constantsfrom non-steady-state dataobtained underconditionswhere masstransporteffectsdominate.
References
Fisher, R. J., Fivash, M., Casas-Finet, J., Erickson, J. W., Kondoh,A., Bladen, V., Fisher, C., Watson, D. and Papas, T. (1994).Real-time DNA binding measurements of the ETS1 recombi-nant proteins reveal signi®cant kinetic differences betweenthe p42 and p51 isoforms. Protein Sci. 3, 257±266.
Glaser, R. W. (1993). Antigen-antibody binding and masstransport by convection and diffusion to a surface: a twodimensional computer model of binding and dissociationkinetics. Anal. Biochem. 213, 152±161.
JoÈ nsson, U., FaÈ gerstam, L., Ivarsson, B., Johnsson, B., Karlsson,R., Lundh, K., LoÈ faÊ s, S., Persson, B., Roos, H., RoÈ nnberg, I.,SjoÈ lander, S., Stenberg, E., StaÊ hlberg, R., Urbaniczky, S.,OÈ stlin, H. and Malmqvist, M. (1991). Real-time biospeci®cinteraction analysis using surface plasmon resonance and asensor chip technology. BioTechniques 11, 620±627.
Karlsson, R. and FaÈ lt, A. (1997). Experimental design for kineticanalysis of protein±protein interactions with surface plasmonresonance biosensors. J. Immunol. Meth. 200, 121±133.
Table 2. Parameter values for the interaction between Inogatran and Thrombin at different temperatures
Temperature ka[1/(Ms)] T(ka) kd(1/s) T(kd) KD(1/M) kd/ka T(KD) Rmax(RU) kt[RU/(Ms)] Chi2(RU2) kaRmax/kt
Kinetic transportmodel6 4.4� 107 11 3.3� 10ÿ2 11 7.4� 10ÿ10 11.9 2.1� 107 0.09 25
12 1.1� 1010 34 1.1� 101 4 1.0� 10ÿ9 12.7 2.4� 107 0.09 559219 2.5� 107 13 3.8� 10ÿ2 12 1.5� 10ÿ9 12.2 2.9� 107 0.13 1125 3.3� 1010 33 5.5� 101 33 1.7� 10ÿ9 11.9 3.2� 107 0.14 1239131 1.0� 108 2 3.9� 10ÿ1 2 3.9� 10ÿ9 12.8 4.2� 107 0.20 3137 1.1� 107 11 7.0� 10ÿ2 10 6.5� 10ÿ9 11.7 8.5� 107 0.24 119 3.7� 107 142 5.6� 10ÿ2 203 1.5� 10ÿ9 12.8 3.2� 107 0.12 15
Affinity transportmodelFromfit
6 7.6� 10ÿ10 248 12.2 2.0� 107 0.0912 1.0� 10ÿ9 229 12.7 2.4� 107 0.0919 1.6� 10ÿ9 148 12.6 2.6� 107 0.1325 1.7� 10ÿ9 119 11.9 3.2� 107 0.1431 3.9� 10ÿ9 112 12.8 4.0� 107 0.2037 8.4� 10ÿ9 30 15.6 5.5� 107 0.23
Figure 8. Af®nity analysis of steady-state data obtained at 31 and 37 °C. Themarkers represent measured data and the lines demonstrate the ®t of datato a steady-state af®nity model. The steady-state response, Req = concen-tration� Rmax/(concentration� K).
AFFINITY ANALYSIS OF NON-STEADY-STATEDATA 291
Copyright# 1999JohnWiley & Sons,Ltd. J. Mol. Recognit.1999;12:285–292
Karlsson, R. and StaÊ hlberg, R. (1995). Surface plasmon resonancedetection and multi-spot sensing for direct monitoring ofinteractions involving low molecular weight analytes and fordetermination of low af®nities. Anal. Biochem. 228, 274±280.
Karlsson, R., Michaelsson, A. and Mattson, L. (1991). Kineticanalysis of monoclonal antibody±antigen interactions with anew biosensor based analytical system. J. Immunol. Meth.145, 229±240.
Karlsson, R., Roos, H., FaÈ gerstam, L. and Persson, B. (1994).Kinetic and concentration analysis using BIA technology.Methods 6, 99±110.
Kortt A. A., Gruen L. C., Oddie G. W. (1997a). In¯uence of masstransfer and surface ligand heterogeneity on quantitativeBIAcore binding data. Analysis of the interaction of NC10 Fabwith an anti-idiotype Fab'. J. Mol. Recog. 10, 148±158.
Kortt A. A., Oddie G. W., Iliades P., Gruen L. C., Hudson P. J.(1997b). Nonspeci®c amine immobilization of ligand can be apotential source of error in BIAcore binding experiments andmay reduce binding af®nities. Anal. Biochem. 253, 103±111.
Morton, T. A., Myszka, D. G. and Chaiken, I. M., (1995).Interpreting complex binding kinetics from optical biosen-
sors: a comparison of analysis by linearization, the integratedrate equation and numerical integration. Anal. Biochem. 227,176±185.
Myszka, D. G. (1997). Kinetic analysis of macromolecularinteractions using surface plasmon resonance biosensors.Curr. Opin. Biotechnol. 8, 50±57.
Myszka, D. G., Morton, T. A., Doyle, M. L., Chaiken, I. M. (1997).Kinetic analysis of a protein antigen-antibody interactionlimited by mass transport on an optical biosensor. Biophys.Chem. 64, 127±137.
Schuck, P. and Minton, A. P. (1996). Analysis of mass transport-limited binding kinetics in evanescent wave biosensors. Anal.Biochem. 240, 262±272.
SjoÈ lander, S. and Urbaniczky, C. (1991). Integrated ¯uid handlingsystem for biomolecular interaction analysis. Anal. Chem. 63,2338.
Stenberg, E., Persson, B., Roos, H. and Urbaniczky, C., (1991).Quantitative determination of surface concentration ofprotein with surface plasmon resonance by using radiola-beled proteins. J. Colloid Interface Sci. 143, 513±526.
292 R. KARLSSON
Copyright# 1999JohnWiley & Sons,Ltd. J. Mol. Recognit.1999;12:285–292


