Embed Size (px)
Citation preview
1www.aes.com
AES CORPORATION
August, 2006
AES Investor Presentation

2www.aes.com
Safe Harbor Disclosure
Certain statements in the following presentation regarding AES’s business operations may constitute “forward looking statements.” Such forward-looking statements include, but are not limited to, those related to future earnings, growth and financial and operating performance. Forward-looking statements are not intended to be a guarantee of future results, but instead constitute AES’s current expectations based on reasonable assumptions. Forecasted financial information is based on certain material assumptions. These assumptions include, but are not limited to continued normal or better levels of operating performance and electricity demand at our distribution companies and operational performance at our contract generation businesses consistent with historical levels, as well as achievements of planned productivity improvements and incremental growth from investments at investment levels and rates of return consistent with prior experience. For additional assumptions see the Appendix to this presentation. Actual results could differ materially from those projected in our forward-looking statements due to risks, uncertainties and other factors. Important factors that could affect actual results are discussed in AES’s filings with the Securities and Exchange Commission including but not limited to the risks discussed under Item 1A “Risk Factors” in the Company’s Annual Report on Form 10-K for the year ended December 31, 2005 as well as our other SEC filings. AES undertakes no obligation to update or revise any forward-looking statements, whether as a result of new information, future events or otherwise.

3www.aes.com
AES is Among the Largest Global Power Companies
$11 billion revenue power generation and distribution business$2.2 billion net cash provide by operating activitiesCapacity to serve 100 million people in 26 countries
Note: Results exclude businesses placed in discontinued operations as of June 30, 2006. Countries and locations include projects under construction.
AES OPERATIONS

4www.aes.com
Generation48%
Diversified Utilities and Generation Portfolio
2005 Revenue$11 billion
Regulated Utilities
52%
Generation61%
2005 Gross Margin$3.2 billion
RegulatedUtilities
39%
Generation (1)Regulated Utilities in 7 countries77% Revenue from long-term contracts23% Revenue from short-term contracts
and spot sales
(1) Generation comprises Contract Generation and Competitive Supply segments.Note: Results exclude businesses placed in discontinued operations as of June 30, 2006
5www.aes.com
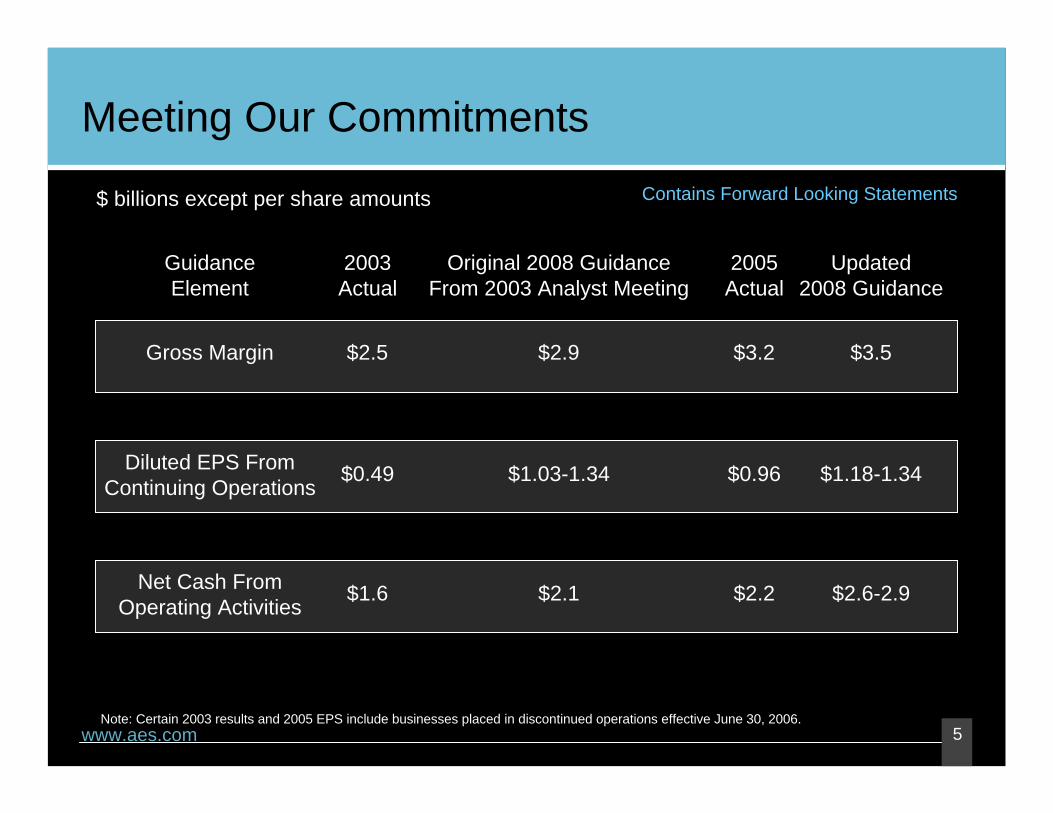
Meeting Our CommitmentsContains Forward Looking Statements
GuidanceElement
Original 2008 GuidanceFrom 2003 Analyst Meeting
2005Actual
Updated2008 Guidance
2003Actual
$ billions except per share amounts
Gross MarginGross Margin $2.5 $2.9 $3.2 $3.5
Net Cash FromOperating Activities $1.6 $2.1 $2.2 $2.6-2.9
Diluted EPS FromContinuing Operations $0.49 $1.03-1.34 $0.96 $1.18-1.34
Note: Certain 2003 results and 2005 EPS include businesses placed in discontinued operations effective June 30, 2006.

6www.aes.com
KPIs – Regulated Utility Example
Lost time accidents (LTA)Near missesPublic safety
Losses rateCollections rateO&M per customerOverhead per customer
System interruption frequency (SAIFI)System interruption duration (SAIDI)Customer satisfaction surveys
Key Performance Indicator (KPI)
Safety Excellence
Operational Excellence
Customer Service Excellence

7www.aes.com
Eletropaulo, BrazilRefocused loss reduction effortsIncreased number and efficiency of theft inspectionsResults: 10% improvement since beginning of 2004 and normalized 188 MWh in 2005
AES El SalvadorImproved meter inspections and follow up (replacement and recalibration)Improved meter reading practicesChanged 73,000 obsolete meters in 2004-2005Result: 10% improvement since 2003
KPI Focus – Utility Losses in Latin America
12.9%
14.4%
12%
13%
14%
15%
1Q04 3Q04 1Q05 3Q05
In 2005 every AES regulated utility improved year-over-year total loss rates
Eletropaulo – Total Losses (1)
9.2%8.7%
9.6%
8%
9%
10%
4Q03 2Q04 4Q04 2Q05 4Q05
AES El Salvador – Total Losses (2)
(1) Trailing 12 months, excludes rebilled energy.(2) Trailing 12 months.
Getting Better
Getting Better
8www.aes.com
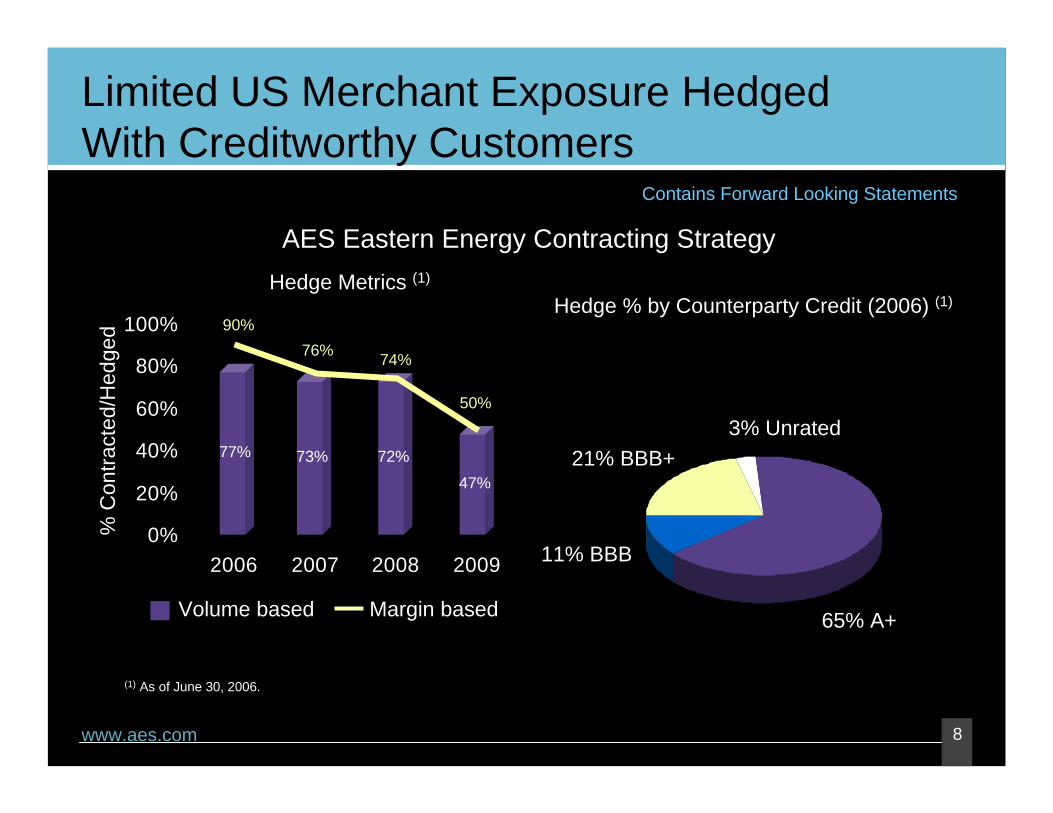
Limited US Merchant Exposure Hedged With Creditworthy Customers
0%
20%
40%
60%
80%
100%
2006 2007 2008 2009
AES Eastern Energy Contracting Strategy
21% BBB+3% Unrated
65% A+
Hedge % by Counterparty Credit (2006) (1)
11% BBB
Margin basedVolume based
% C
ontra
cted
/Hed
ged
Hedge Metrics (1)
77% 73% 72%47%
90%76% 74%
50%
(1) As of June 30, 2006.
Contains Forward Looking Statements

9www.aes.com
Strong Cash Flow Trends Continue
(1) Non-GAAP financial measure. See Appendix.(2) Based on midpoints of 2006 guidance of $2.2 to $2.3 billion net cash provided by operating activities, maintenance capital expenditures of
$800 to $900 million, and free cash flow of $1.3 to $1.5 billion.
Contains Forward Looking Statements
2005 highlights
Net cash from operating activities $2.2 billion
Free cash flow $1.5 billion
2006 guidance reflects:
Higher maintenance capital expenditures
U.S. environmental projects that are expected to generate positive returns
$0.0
$0.5
$1.0
$1.5
$2.0
$2.5
2003 2004 2005 2006E
Net cash fromoperating activities
Maintenance capitalexpenditures
Free cashflow (1)
($ b
illion
s)
(2)
Over $5 billion free cash flow (1)
2003 – 2006E
Note: Results exclude businesses placed in discontinued operations as of June 30, 2006

10www.aes.com
Disciplined Use of Growing Free Cash FlowContains Forward Looking Statements
Free Cash Flow(1)
$1,400 MM
Parent Free Cash
Flow$350 MM
Subsidiary Free Cash
Flow$1,050 MM
2006Strategy
Achieve BB/Ba2 credit metrics
Rebuild development
pipeline
2007-2008 and BeyondStrategy
(1) Non-GAAP financial measure based on midpoint of 2006 guidance of $1.3 to $1.5 billion and is reconciled from 2006 guidance for net cash from operating activities of $2.2 to $2.3 billion less maintenance capital expenditures of $800 – $900 million. Estimated allocation of this midpoint 2006 free cash flow guidance is approximately $350 million at the parent company and $1,050 million at subsidiaries. Guidance excludes businesses placed in discontinued operations as of June 30, 2006.
2006 Free Cash Flow(1) Profile
Optimize Annually
Platform expansion
Dividends (AES and minority owners)
Invest for growth
Alternatives if growth projects don’t develop at adequate returns• Investment grade credit• Cash dividends• Share repurchases
Subsidiary debt reduction

11www.aes.com
$3 Trillion in New Generation Capacity Worldwide Forecasted Through 2015
Contains Forward Looking Statements
Source: CERA. EMEA = Europe, Middle East & Africa. Based on AES regional market alignment as of December 30, 2005
Almost 90% of expected worldwide generation capacity investment through 2015 will be outside North America
0
40
80
120
160
1994 1998 2002 2006 2010 2014 2018
Asia EMEA Latin America North America
Glo
bal C
apac
ity A
dditi
ons
(GW
)

12www.aes.com
Growth Investment and Portfolio Management Strategy
TraditionalDevelopment
Greenfield projects
Platform expansions
Acquisitions
Privatizations
New andAdjacent Markets
LNG regasification
Greenhouse gas emission offsets
Alternative energy
Coal mining
PortfolioManagement
Minority interest sales to partners
Access attractive local capital markets
Asset sales

13www.aes.com
Platform Expansion Example: GenerContains Forward Looking StatementsContains Forward Looking Statements
Los Vientos 120MW diesel-fired power plant$37 million capital cost2006 start-upSupports peaking, fuel diversification and hydrology risk management strategiesFits existing generation tariff structure
Proposed coal-fired power plants200-250MW plants at existing Guacolda and Ventanas sites2009 Start-UpCombined capital costs $600 millionParticipating in Chilean RFP process
Platform expansion revenue potential $175 million by 2010 (combined basis)
Ventanas Plant, Chile
Other examples: 150MW Changuinola, Panama hydroelectric project

14www.aes.com
Greenfield Investment Example: BulgariaContains Forward Looking Statements
Proposed AES Maritza Plant, Bulgaria670MW lignite-fired power plant$1.4 billion project costStrong commercial and financing terms
15 year contract with national utility15 year lignite supply agreement minimizes energy supply risksLetter of government support€790 million non-recourse financing closed in December with commercial and multilateral banks$600 million unsecured corporate credit facility for letter of credit support
Commenced construction May 2006$300 million+ expected annual revenues
Other examples: 1,200MW Cartagena power plant, Spain (in construction)

15www.aes.com
New and Adjacent Markets Investment Example: Wind
Contains Forward Looking StatementsGlobal installed capacity expected to increase by 100% over the next five yearsOperating 600MW of wind projects
Pursuing 2,000MW of additional projects in selected markets including the US, China, India, Europe and Latin America
0
50
100
150
200
2005 2006 2007 2008 2009 2010 2011
GW
Forecasted WorldwideInstalled Wind Capacity
Source: EER.
121MW Buffalo Gap wind farm in Texas recently completed54MW wind acquisition in California announced in AprilWEL wind development acquisition in U.K. announced in July

16www.aes.com
New and Adjacent Markets Investment Example: LNG Regasification
Contains Forward Looking Statements
Supply to the U.S. to increase from 3% today to20% in 2020
Developing LNG regasification terminals in:BahamasBostonBaltimore
12
16
20
24
28
2005 2010 2015 2020 2025 2030
TCF
U.S. Projected Natural Gas Demand
Source: EIA, Annual Energy Outlook.
LNG imports
Conventionalsources

17www.aes.com
New and Adjacent Markets Investment Example: GHG Emissions Offsets
Contains Forward Looking StatementsNew environmental regulations expected to create a $10 billion a year market for emission offset credits
$100 million in investments to date will generate over 17 million tons of carbon reduction
‘05 ‘08 ‘12 ‘20
Allocation Below Business as Usual CaseTons per Year
EU ETS60 Million
KyotoPhase I
550 Million
Kyoto Phase II(Proposed)
1.5 to 3.0 Billion

18www.aes.com
Abundant Capital Creates Portfolio Management Opportunities
Contains Forward Looking Statements
January February March April May$75
Gener Stock Price
$100
$125
$150
(Chi
lean
pes
os)
4/25 Secondary offering of 7.6% of AES’s Gener
shares at CP$130.5
Liquidity Discount
US$500 MM
Market Capitalization US$1.7 billion
Market Capitalization US$1.2 billion
Other examples: Kingston, Canada plant investment sale
19www.aes.com
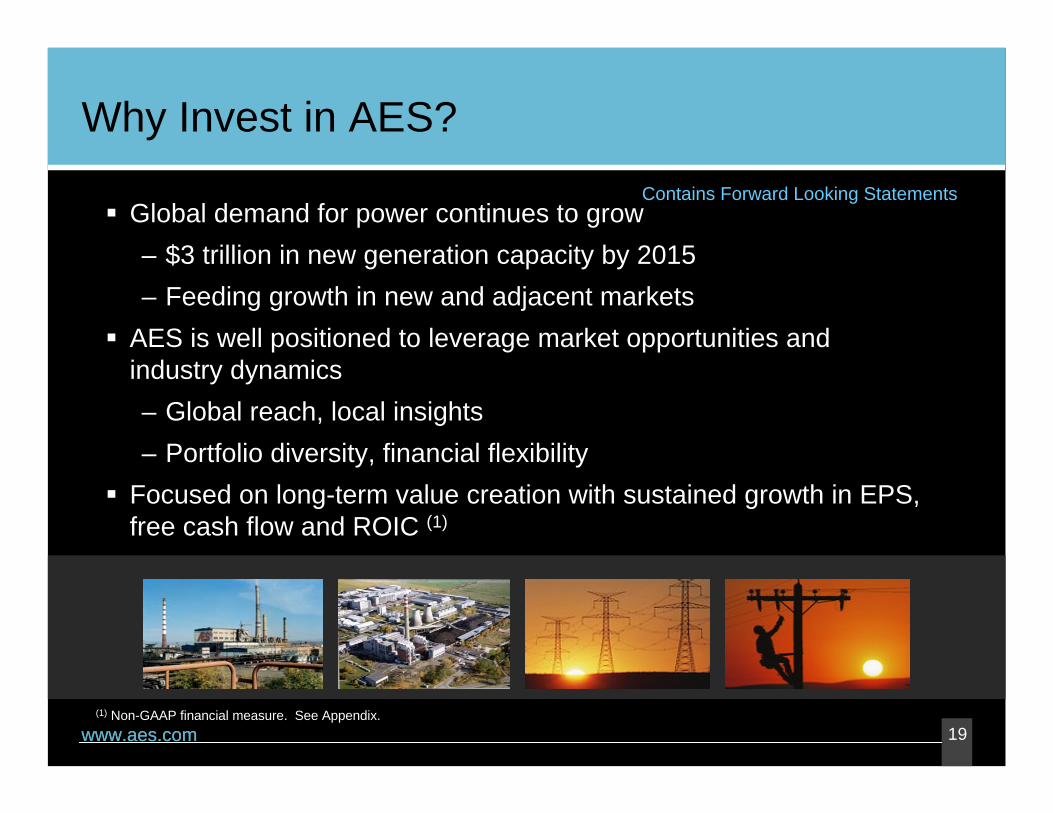
Why Invest in AES?
Global demand for power continues to grow– $3 trillion in new generation capacity by 2015– Feeding growth in new and adjacent markets
AES is well positioned to leverage market opportunities and industry dynamics– Global reach, local insights– Portfolio diversity, financial flexibility
Focused on long-term value creation with sustained growth in EPS, free cash flow and ROIC (1)
www.aes.com
Contains Forward Looking Statements
(1) Non-GAAP financial measure. See Appendix.

20www.aes.com
Appendix: Definitions
EPS – Earnings per share.Free Cash Flow – Net cash from operating activities less maintenance capital expenditures. Maintenance capital expenditures reflect property additions less growth capital expenditures.Interest coverage – The ratio of subsidiary distributions to parent interest expense.O&M – Operation and maintenance.Parent debt is the same as recourse debt.Parent interest expense – Interest expense less non-recourse interest expense.Return on invested capital (ROIC) – Net operating profit after tax (NOPAT) divided by average capital. NOPAT is defined as income before tax and minority expense plus interest expense less income taxes less tax benefit on interest expense at effective tax rate. Average capital is defined as the average of beginning and ending total debt plus minority interest plus stockholders’ equity less debt service reserves and other deposits.Subsidiary distributions – Cash distributions (primarily dividends and interest income) from subsidiary companies to the parent company and qualified holding companies. These cash flows are the source of cash flow to the parent to meet corporate interest, overhead, cash taxes, and discretionary uses such as recourse debt reductions and corporate investments.

21www.aes.com
Appendix: Assumptions
Forecasted financial information is based on certain material assumptions. Such assumptions include, but are not limited to: 1) no unforeseen external events such as wars, depressions, or economic or political disruptions occur; 2 ) businesses continue to operate in a manner consistent with or better than prior operating performance, including achievement of planned productivity improvements including benefits of global sourcing, and in accordance with the provisions of their relevant contracts or concessions; 3) new business opportunities are available to AES in sufficient quantity so that AES can capture its historical market share or increase its share; 4) no material disruptions or discontinuities occur in GDP, foreign exchange rates, inflation or interest rates during the forecast period; 5) negative factors do not combine to create highly negative low-probability business situations; 6) material business-specific risks as described in the Company’s SEC filings do not occur.
In addition, benefits from global sourcing include avoided costs, reduction in capital project costs versus budgetary estimates, and projected savings based on assumed spend volume, which may or may not actually be achieved. Also, improvement in certain KPIs such as EFOR and commercial availability may not improve financial performance at all facilities based on commercial terms and conditions. These benefits will not be fully reflected in the Company’s consolidated financial results.
Also, the cash held at qualifying holding companies (QHCs) represents cash sent to subsidiaries of the Company domiciled outside of the U.S. Such subsidiaries had no contractual restrictions on their ability to send cash to AES, the parent company. Cash at those subsidiaries was used for investment and related activities outside of the U.S. These investments included equity investments and loans to other foreign subsidiaries as well as development and general costs and expenses incurred outside the U.S. Since the cash held by these qualifying holding companies is available to the parent, AES uses the combined measure of subsidiary distributions to parent and qualified holding companies as a useful measure of cash available to the parent to meet its international liquidity needs. AES believes that unconsolidated parent company liquidity is important to the liquidity position of AES as a parent company because of the non-recourse nature of most of AES’s indebtedness.

22www.aes.com
Appendix: Reconciliation of Subsidiary Distributions
See page 22 for definitions of non-GAAP financial measures. Results include businesses placed in discontinued operations effective June 30, 2006.
Total subsidiary distributions& returns of capital to parent
Subsidiary distributions to parentNet distributions to/(from) QHCs
Total subsidiary distributions
Returns of capital distributions to parentNet returns of capital distributions to/(from) QHCs
Total returns of capital distributions
Combined distributions & return of capital receivedLess: combined net distributions & returns
of capital to/(from) QHCs
Total subsidiary distributions & returns of capital to parent
2005
$9885
993
4413
57
1,050
(18)
$1,032
2004
$99113
1,004
11611
127
1,131
(24)
$1,107
2003
$1,00846
1,054
242--
242
1,296
(46)
$1,250

23www.aes.com
Appendix: Reconciliation of Free Cash Flow and Parent Interest Expense
See page 33 for definitions of non-GAAP financial measures. Results include businesses placed in discontinued operations effective June 30, 2006.
2005 2004 2003
Net cash from operating activities $2,165 $1,571 $1,642
Maintenance capital expenditures (631) (507) (542)
Free cash flow $1,534 $1,064 $1,100
Free cash flow reconciliation
Non-recourse interest expense $1,470 $1,459 $1,415
Parent (recourse) interest expense 426 473 569
Total interest expense $1,896 $1,932 $1,984
Parent interest expense
reconciliation
Growth capital expenditures $512 $385 $686
Maintenance capital expenditures 631 507 542
Property additions $1,143 $892 $1,228
Property additions
reconciliation

24www.aes.com
Appendix: Return on Invested Capital (ROIC)
6256591,461201
491Reported Interest Expense
Effective Tax Rate(3)
Net Operating Profit After Tax(1)
Net Operating Profit After Tax
Income Tax Expense(2)
IBT&MI
Average Capital(6)
Total Capital
Debt Service Reserves and Other Deposits
Total Capital(5)
Stockholders’ Equity
Minority Interest
Total Debt
(1) Net operating profit after tax, a non-GAAP financial measure, is defined as income before tax and minority interest expense (IBT&MI) plus interest expense less income taxes less tax benefit on interest expense at the effective tax rate.
(2) Income tax expense calculated by multiplying the sum of IBT&MI and reported interest expense for the period by the effective tax rate for the period.(3) Effective tax rate calculated by dividing reported income tax expense for the period by IBT&MI for the period.(4) Return on invested capital (ROIC), a non-GAAP financial measure, is defined as net operating profit after tax divided by average capital calculated over rolling 12 month basis.(5) Total capital, a non-GAAP financial measure, is defined as total debt plus minority interest plus stockholders’ equity less debt service reserves.(6) Average capital is defined as the average of beginning and ending total capital over the last 12 months.
($ Millions except percent)
ROIC(4)
Rolling TwelveMonths
Second Quarter2006
$21,592
(612)
2,451
2,256
$17,497
$20,879
SecondQuarter
2006
SecondQuarter
2005
$20,072
$20,165
(593)
$18,086
1,462
1,210
497
330
28.2%
2,752
(1,080)
1,824
$2,008
13.2%
$484
(285)
FirstQuarter
2005
448
ThirdQuarter
2005
502
$408
FourthQuarter
2005
29.3% 31.4%
(273)(284)
475
$186
SecondQuarter
2005
43.0%
377
$226
(494)
ThirdQuarter
2004
$204
FourthQuarter
2004
39.2%
511
(330)
466
$375
7.3%
1,929
$991
49.9%
(1,459)
Rolling TwelveMonths
Second Quarter2005
54.4% 71.1%
(393) (203)
442
$483
SecondQuarter
2006
21.9%
722
432
$633
FirstQuarter
2006
30.0%
(320)
745
SecondQuarter
2004
$19,978
(574)
$18,185
981
1,386
Note: Results exclude businesses placed in discontinued operations as of June 30, 2006