Embed Size (px)
Citation preview

Aerosol Polarimetry Sensor for the Glory Mission
Richard J. Peralta,*1 Carl Nardell,
1 Brian Cairns,
2 Edgar E. Russell,
1 Larry D. Travis,
2
Michael I. Mishchenko,2 Bryan A. Fafaul,
2 and Ronald J. Hooker
3
1Raytheon Santa Barbara Remote Sensing, 75 Coromar Dr., Goleta, CA 93117 2NASA Goddard Space Flight Center
3NASA Headquarters
ABSTRACT
This paper describes the Glory Mission Aerosol Polarimetry Sensor (APS) being built by Raytheon under contract to
NASA’s Goddard Space Flight Center. Scheduled for launch in late 2008, the instrument is part of the US Climate
Change Research Initiative to determine the global distribution of aerosols and clouds with sufficient accuracy and
coverage to establish the aerosol effects on global climate change as well as begin a precise long-term aerosol record.
The Glory APS is a polarimeter with nine solar reflectance spectral bands that measure the first three Stokes parameters
vector components for a total of 27 unique measurements. In order to improve the reliability and accuracy of the
measurements, additional 9 redundant measurements are made, yielding a total of 36 channels. The sensor is designed
to acquire spatial, temporal, and spectral measurements simultaneously to minimize instrumental effects and provide
extremely accurate Raw Data Records. The APS scans in the direction close to of the spacecraft velocity vector in
order to acquire multi-angle samples for each retrieval location so that the Stokes parameters can be measured as
functions of view angle.
Keywords: Polarization, polarimetry, global warming, climate forcing, aerosols, black carbon, MODIS, MISR,
POLDER, Glory Mission
1. INTRODUCTION
1.1 Science Overview
The NASA Glory Mission has two main science objectives that will be met by two sensors:
Collect data on the properties of aerosols and clouds in the Earth’s atmosphere.
Collect data on solar irradiance for the long-term effects on the Earth climate record.
The Aerosol Polarimetry Sensor (APS), as the name implies, provides a measurement of aerosol content in the
atmosphere and will satisfy the first goal. The second goal will be fulfilled by providing continuity of data from the
Total Irradiance Monitor (TIM) instrument which has been flying aboard the 2003 launch of the SOlar Radiation and
Climate Experiment [3].
The significant uncertainty in the current effects of aerosols on climate and the consequent uncertainty in predictions of
future climate has led to the need for increased measurement capabilities [4, 6, 7, 9]. Atmospheric aerosols directly
affect the climate by absorbing and reflecting incident solar radiance. In addition aerosols have an indirect effect on
cloud properties since increased aerosol content can lead to a larger number of smaller cloud droplets, which makes
clouds brighter, decreases rainfall, and increases cloud lifetime. It is also the case that the properties and amount of
aerosols that are present in the atmosphere vary considerably both spatially and temporally around the globe [5, 8]. In
order to reduce the uncertainty in the radiative forcing of climate by aerosols it is therefore necessary to make
continuous, global and long-term measurements that effectively and accurately constrain the amount and types of
aerosols.
Of particular concern are anthropogenic aerosols since production of many aerosol species is largely ungoverned. In
particular black carbon soot absorbs incident solar radiation and re-radiates in the infrared spectrum making it an
additional source of global warming [2]. In the 1997 Kyoto Protocol, black carbon was considered to be a significant
Invited Paper
MIPPR 2007: Automatic Target Recognition and Image Analysis; and Multispectral ImageAcquisition, edited by Tianxu Zhang, Carl Nardell, Duane Smith, Hangqing Lu, Proc. of SPIE
Vol. 6786, 67865L, (2007) · 0277-786X/07/$18 · doi: 10.1117/12.783307
Proc. of SPIE Vol. 6786 67865L-1

contributor to global climate change as well as health impacts, an aspect of that protocol that was endorsed by the
current administration. Monitoring black carbon aerosols is important to the Glory mission and a significant part of the
overall science objectives. While black carbon serves to increase global temperature, sulfate aerosols, generated from
the efficient burning of fossil fuels containing sulfur, act to cool the atmosphere by reflecting the solar radiation back
into space. The opposing effects that aerosols can have on climate depending on their composition demonstrates the
need for better knowledge of aerosol emissions, composition and amount in order to determine the best policy forward.
It is exactly this capability that the APS instrument will provide.
Aerosol fields are spatially heterogeneous about the globe and tend to be short-lived in the atmosphere as they mix with
other agents and are then removed by wet (rain), or dry deposition. A low-Earth-orbit polar-orbiting satellite is the only
reasonable method to measure aerosol properties with sufficient spatial and temporal coverage. Other satellite assets do
make aerosol measurements: the MODerate-resolution Imaging Spectroradiometer (MODIS), the Multi-angle Imaging
SpectroRadiometer (MISR) and the POLarization and Directionality of Earth Reflectance (POLDER) [7]. While these
instruments greatly improve upon the capability of the previous generation of sensors, they cannot fully monitor all the
aerosol properties that are important to climate change. Intensity radiometers do retrieve key environmental data
records (EDRs) of aerosol optical thickness and an estimate of size but this is not sufficient to identify the chemical
composition or amount of absorption in the aerosols and determine the number or concentration of aerosols serving as
cloud condensation nuclei. Refractive index, single scattering albedo, particle shape and size distribution are the EDRs
that are needed to effectively study global climate change. These properties can only be retrieved by precise multi-
angle polarized reflectance measurements since the polarization state of the scattered sunlight is very sensitive to cloud
and aerosol microphysics which is not the case for intensity-based measurements [6]. The POLDER sensor has the
ability to measure polarization but is effectively limited to the use of only two spectral bands with central wavelengths
shorter than 1000 nm and does not have the polarimetric accuracy to perform the EDR retrievals.
Land-based intensity measurements are dominated by reflection off the underlying surface and have strong spectral
contrast, which makes the discrimination of the aerosol signature difficult. Polarized intensity measurements have weak
spectral contrast with a strong variation as a function of scattering geometry, which makes it straightforward to
segregate surface from atmospheric effects. Figure 1 illustrates this point.
The APS design is inherently more accurate than the POLDER design since APS employs simultaneous measurements
of the polarized intensity components, whereas POLDER makes sequential measurements. Sequential measurements
are susceptible to error because over the period that all the Stokes parameters are sensed, the scene that is observed may
change so that when the polarization is calculated variations in reflectance create a “false” polarization. Notice that
intensity measurements appear equivalent for simultaneous and sequential measurements while polarized measurements
are quite different, as demonstrated in Figure 2 below.
Figure 1. Intensity measurements (left) are less
sensitive to scattering geometry from polarimetry
(right)
Figure 2. Simultaneous measurements from intensity and polarization (left
picture 1 and 2 respectively) are much more accurate than sequential
measurements of intensity and polarization (right picture 3 and 4
respectively)
The APS was originally conceived as part of the instrument suite aboard NASA’s Earth Observing System (EOS)
platforms in the late 1980’s. Called the Earth Observing Scanning Polarimeter (EOSP), it shared many design elements
of heritage Santa Barbara Remote Sensing (SBRS) planetary polarimeters such as the 1972/1973 Imaging
Proc. of SPIE Vol. 6786 67865L-2

Photopolarimeter (IPP) aboard the Pioneer 10 and 11 missions, the 1978 Cloud Photopolarimeter (CPP) aboard the
Pioneer Venus Orbiter mission, and the 1989 Photopolarimeter Radiometer (PPR) aboard the Galileo mission (Figure
3). While the EOSP hardware development was not funded specifically, the Research Scanning Polarimeter (RSP), an
aircraft version based on the EOSP design [1], was partially funded by NASA’s Goddard Institute for Space Studies
(GISS) and was built by the SpecTIR Corporation. This instrument has been flown in various campaigns since 1999 to
prove the overall sensing technique.
Figure 3. Timeline of legacy polarimeters leading up to the 2008 launch of APS.
1.2 Mission Overview
The Glory mission is composed of 3 segments: the Space Segment, the Ground Segment, and the Launch Segment.
Each segment is logically broken down into a series of systems that perform a major operational or functional task. The
Space Segment is composed of the APS, the TIM provided by the Laboratory for Atmospheric and Space Physics
(LASP) of the University of Colorado/Boulder, the Cloud Cameras (CCs) provided by Ball Aerospace, and the Orbital
Sciences Corporation (OSC) spacecraft. The Space Network, which is an element of the Space Segment, is composed
of existing assets to provide additional means of communication to the Ground Segment. The Ground Segment is
composed of the ground system, the Science Operations Centers (SOCs) for the APS (at GISS) and TIM (at LASP), and
the Distributed Active Archive Center (DAAC). Within the Ground System are the ground stations to communicate
with the Space Network and satellite directly as well as the Mission Operations Center (MOC). The Launch Segment
comprises all elements of the OSC spacecraft, the Taurus XL launch vehicle, and the launch facility at Vandenberg Air
Force Base (VAFB).
The TIM is part of an ongoing program to monitor the solar irradiance. It is mounted on a gimbaled deck in order to
point to the sun regardless of the Spacecraft orientation. The instrument is an active cavity radiometer that observes the
solar output entering the Earth’s atmosphere. Continuously monitoring the balance between the two is necessary to
ensure that the solar output is not confused with environmental change. The two CCs, each a 2-band high resolution
radiometer, augment the APS by helping to differentiate cloud from aerosol within the APS pixel and are a back up to
the MODIS data by providing a cross-track swath of aerosol load and fine mode fraction over the ocean.
Photopolarimeter
Radiometer
Imaging
Photopolarimeter
Cloud
Photopolarimeter
Earth Observing
Scanning Polarimeter
Research Scanning
Polarimeter
19891972/1973 1978 1991 2008
Aerosol Polarimetry
Sensor
1999
Proc. of SPIE Vol. 6786 67865L-3

Figures 4a-b. Glory spacecraft and sensor payloads in launch configuration (left) and APS deployed (right).
The APS will formation fly in a 705 km polar orbit with a 1330 descending equatorial crossing at a 98.2 degree
inclination. This places the APS in the NASA afternoon orbit, or A-Train orbit following the NASA Aqua satellite
carrying the MODIS instrument. APS will be approximately 3 ½ minutes behind MODIS and 270 km offset in the
track direction to maximize the correlation between the two sensors.
2. SYSTEM ARCHITECTURE
2.1 System Optimization
Several key requirements drove the overall architecture of the sensor. Chief amongst these are the science requirements
flowdown of accuracy and precision. The EDR accuracy requirements [4] demand a highly accurate sensor that cannot
be met with current radiometer technologies. A polarimeter is inherently a more accurate device since it provides data
to make ratio-based measurements which divides out systematic errors, leaving only residual differences. As noted
above, it is imperative that the sensor configuration be spatially, temporally, and spectrally simultaneous to avoid the
inaccuracies associated with sequential measurements. If the scene is constant, then the systematic errors are identical
for all channels. In this way, polarimetric accuracy requirements on the order of a few tenths of a percent can be
achieved. While the APS does not measure circular polarization, this has no significant affect on the accuracy of the
EDRs since the circular polarization component is typically at least two orders of magnitude smaller than the linear
components. Since a polarimeter directly measures the absolute radiance, APS also functions as a radiometer and can
achieve accuracies of ~5% with the aid of solar reflectance calibration.
The EDR precision requirements flow directly to sensor polarimetric precision since it is made up of four independent
measurements, each with associated noise. This in turn limits the ability to resolve the difference between the
individual component measurements which is necessary to resolve the scene polarization. Polarimetric precision
directly drives the sensor SNR which is critical to optimize since it drives the overall aperture size, mass, and other key
system parameters.
Originally, the EOSP was oriented to scan across the spacecraft velocity track – similar to typical LEO
imaging/mapping systems. This provides excellent spatial coverage of the globe but leaves large gaps of time to build
up the angular views at a given retrieval site. The APS will be oriented to scan along the velocity axis to acquire all
necessary multi-angle measurements within 300 seconds. This is traded at the expense of continuous global coverage,
but since aerosol fields tend to be large and the mission is observing climactic trends, this is quite acceptable [6]. While
300 seconds is effectively simultaneous on an aerosol timescale, the Earth will rotate in this period and the individual
multi-angle samples will be displaced. To compensate for this effect, the spacecraft and APS will have a 3.2 degree
+Y axis, anti-solar +Z axis, nadir
+X axis, velocity and scan axis Aerosol
Polarimetry
Sensor
Cloud
Cameras
Total
Irradiance
Monitor
Spacecraft
(solar panels folded)
Earthshield
Nadir Door
Scan
Mirror
Assembly
Solar Reference
Assembly
Aperture
–Y
–X
+Z
Proc. of SPIE Vol. 6786 67865L-4

offset about nadir to reduce the effective spread. Since the Earth’s rotational velocity varies as a function of latitude,
the optimal latitude is set at approximately 40 degrees which corresponds to a large population congregation of humans.
The offset is provided by the spacecraft orientation in flight as opposed to an APS offset on the spacecraft. This allows
the localized optimization to be easily changed if desired.
The APS acquires data over a large range angles to characterize the scatter target which directly leads to the sensor scan
angle requirement of +/– 50° plus a near limb view of 60° to one side, or a full angular field of view of 110°. The
relationship of the APS line of sight and the incident solar radiation is the central geometry of the system. In simple
terms, the APS collects scatter data of a target where the sun is the source of illumination and the APS is the detector. It
is planned that periodically throughout the mission, the APS will be maneuvered about the velocity axis to directly view
the solar glint and get an improved measurement of the aerosol absorption.
The APS takes valid data on the day-lit side of the Earth and operates in the solar reflective spectrum from 0.4 to 2.3
m (Figure 6). The band centers and widths are chosen for the atmospheric properties as well as sensor considerations
such as signal-to-noise (SNR) and synergy with MODIS for direct data correlation. Seven of the nine available spectral
bands are used for aerosol retrievals while the 2 remaining bands are used to measure water vapor and to screen for
cirrus clouds (the 910 and 1378 bands, respectively).
The dynamic range requirement is derived from several factors: comparison with similar sensors with similar
applications, forward top of the atmosphere (TOA) radiance models, and considerations to SNR. High-albedo scenes
from either cloud tops or bright land scenes produce the highest radiances and set the maximum radiance (Lmax). The
minimum radiance (Lmin) is the lowest radiance scene that is reasonable to expect and still retrieve EDRs with sufficient
SNR. As the APS approaches the day/night terminator of the Earth, the radiance values will fall below Lmin and not be
sufficient for the EDR retrieval algorithms. In addition, the sensor provides a dark reference view each scan together
with a small electronic offset for each channel to ensure that the signal measurements are not clipped. Similarly, the
upper portion of the sensor dynamic range has a 25% margin and acts as a buffer to avoid saturation. The typical
radiance (Ltyp) is a value that is selected to set the noise- equivalent radiance (NEdL) which in turn is the value where
the SNR is specified. In actual fact, Ltyp is not the typical scene which one would expect to see, rather it is a threshold
that drives the sensor performance and resolution to accommodate Lmin to Lmax measurements.
Figure 6. APS spectral bands (normalized to TOA) and scene
dynamic range.
________________________________________________
_Figure 5 (left). Geometric relationship of the APS, incident solar
vector, and scatter target.
Legend: LTP = latitude of scatter point
LTA = latitude of APS
LTS = latitude of solar vector
LGP = longitude of scatter point
LGA = longitude of APS
LGS = longitude of solar vector
w = APS position relative to equator crossing
eps = angle between APS and scatter target
200
400
600
20001000800 900700500 600400
Wavelength (nm)
Top of the atmosphere
Effects of Rayleigh scattering and
water vapor absorption
APS spectral bands
So
lar
Spec
tral
Rad
ian
ce (
W/m
2/
m/s
r)
200
400
600
20001000800 900700500 600400
Wavelength (nm)
Top of the atmosphere
Effects of Rayleigh scattering and
water vapor absorption
APS spectral bands
So
lar
Spec
tral
Rad
ian
ce (
W/m
2/
m/s
r)
Scattering Angle
Solar Vector
Equator
Ground Track
Terminator
1330 descending
orbit
Scan Line of Sight
Crossing Node
w
eps
Solar Vector
LGS
LGP
LGA
LTS LTA
LTP
APS
Scatter target
Scattering Angle
Solar Vector
Equator
Ground Track
Terminator
1330 descending
orbit
Scan Line of Sight
Crossing Node
w
eps
Solar Vector
LGS
LGP
LGA
LTS LTA
LTP
APS
Scatter target
Proc. of SPIE Vol. 6786 67865L-5

The scan and sampling rate, instantaneous field of view (IFOV), and aperture size comprises a multi-dimensional trade
that sets a large part of the sensor architecture. Several examples illustrate the point: if the scan rate is increased, more
data is available but each sample’s SNR is decreased; increasing the aperture rapidly increases SNR but drives the
overall mass and volume of the system. The APS has loose imaging requirements and is more appropriately referred to
as a scanning sounder type of instrument. As such, the IFOV and integration time were optimized for SNR for a given
footprint (geometric plus integration drag). To minimize scene inhomogeneity, a maximum footprint of 10 km was set.
Solving for maximum SNR yields a factor of 2 between the spatial and temporal components or an 8 mrad IFOV and a
4 mrad integration drag, which corresponds to 0.96 ms. A sufficient number of angular samples as well as the spacing
between them are necessary to balance sensor performance. Plotting scan rate against the ground sample distance
(GSD) for a given spacecraft velocity yields an optimal solution of 40 RPM which corresponds to a GSD of
approximately 10 km. Note, while the GSD and the ground IFOV are the same value, they are independent factors.
The system timing is based on the sample spacing. With 1.92 ms sample centers, there are 768 samples within a scan
revolution or 40.69 RPM. Thus, the timing is based on multiples of 768 to keep the timing synchronous.
The APS was optimized for the 824 km orbit and has subsequently changed to the A-Train 705 km orbit to follow
MODIS aboard the EOS Terra (Figure 7). While this does alter the sampling and spatial geometry, the algorithm
retrievals are insensitive to such minor perturbations and are of no consequence to the quality of the EDRs.
Figure 7. 824 km orbit (left) scanning and timing parameters and A-Train orbit (right) parameters
Since the purpose of the mission is for long-term climate monitoring, stability is critically important so that subtle
instrument changes are not confused with climate changes. Space environment effects such as radiation degradation,
thermal perturbations, optical contamination, etc. alter the sensor’s performance. To account for these variations, the
APS has individual unpolarized and polarized references as well as a radiometric reference. The unpolarized input
accounts for relative changes amongst the channels while the polarized input rescales the channels to a normalized
level. The radiometric source provides an absolute calibration via solar reflectance from a known reflector to reset the
channel gains to the correct radiometric scale. A dark reference is also necessary to subtract the signal offset from the
floor of the ADC and ensure the detectors are returned to a DC level every scan to provide accurate signal levels and
prevent drift out of the dynamic range. Periodic review of the on-orbit calibration data as a function of time data allows
the accuracy to be maintained by adjusting calibration coefficients. This process is described in the calibration and
characterization section of the paper below.
The APS has only 3 modes: OFF, SAFE, and OPERATIONAL (Figure 8a). This minimal set of modes leads to a
simplified operational concept. When the operational power bus is un-powered APS is in the OFF mode; however,
survival heaters and passive temperature sensors are available. The APS is in the OPERATIONAL mode when the
power bus is active – all of the APS functions are active; the sensor produces science and state of health (SOH)
telemetry. The SAFE mode is identical to the operational mode except that the scan mirror is pointed anti-nadir to
protect the optics from contamination or accidental direct solar views. Upon power-up, the APS enters the SAFE mode
and must be commanded to OPERATIONAL. If the scan position is not known from last power up, transitioning to
OPERATIONAL and then to SAFE is necessary to ensure that the scan mirror is located in the stow position. The
preferred order for power-down from operating is SAFE, then OFF. Power can be removed at any time without
IFOV = 8 mrad
(GIFOV = 5.64 km)Altitude = 705 km
Integrate/drag = 4 mrad
(geometric drag = 2.88 km)
GSD = 2 x drag = 5.77 km
Sample 1
Scan
Integrate/drag
Nadir
Sample 2
IFOV = 8 mrad
(GIFOV = 5.64 km)Altitude = 705 km
Integrate/drag = 4 mrad
(geometric drag = 2.88 km)
GSD = 2 x drag = 5.77 km
Sample 1
Scan
Integrate/drag
Nadir
Sample 2
IFOV = 8 mrad
(GIFOV = 6.59 km)
GSD = 2 x drag = 6.74 km
Sample 1
Scan
Integrate/drag
Nadir
Sample 2
Integrate/drag = 4 mrad
(geometric drag = 3.37 km)
Altitude = 824 km IFOV = 8 mrad
(GIFOV = 6.59 km)
GSD = 2 x drag = 6.74 km
Sample 1
Scan
Integrate/drag
Nadir
Sample 2
Integrate/drag = 4 mrad
(geometric drag = 3.37 km)
Altitude = 824 km
Proc. of SPIE Vol. 6786 67865L-6

damage, however, the scan mirror position will not be known unless it is commanded to SAFE before powering off. If
several consecutive time-of-day stamp transmissions from the spacecraft to the APS are missing, it may be that the
spacecraft pointing or state is not known. Correspondingly, the APS will autonomously place itself in the SAFE mode.
The APS operational concept compliments the on-orbit timeline (Figure 8b). The APS is in the OFF mode with
survival heaters enabled during the launch, spacecraft checkout, and orbital maneuvers. The APS is then transitioned to
SAFE and then OPERATIONAL to begin the APS check out and outgas. The spacecraft will then perform a maneuver
to view the moon (with the aperture) and sun (with the solar reference) to establish a radiometric calibration baseline.
Thereafter, the APS will continuously take nominal science data with periodic lunar views to monitor radiometric
stability and glint maneuvers to monitor the absorption of black carbon. At the end of the mission life, the spacecraft
will be decommissioned and brought into the Earth’s atmosphere for disposal.
Figures 8a and 8b. Simple mode transitions and mission operational timeline
One of the key elements in optimizing the system architecture is ensuring that the science requirements do not overly
drive performance margin and manufacturability. As such the science, interface, environment, and mission assurance
requirements are balanced for best value against engineering and production capability. The top level design
characteristics driven by the design are shown in Table 1 below.
Table 1. Key system requirements driving the design with margin
Parameter Requirement Performance Design
Instrument
architecture
Light measuring simultaneous
linear polarimeter By design
6 co-registered refractive telescopes
with polarization canceling scan mirrors
Spectral bands 410, 443, 555, 672, 865, 910,
1378, 1610, 2250 nm By design
3 bands per telescope split by dichroics
and filters
Dynamic range TOA radiances Pedestal and ceiling margin 16-bit ADC per band
Scanning Along-track 40 +/– 1 RPM Along-track 40.69 RPM 3 phase DC-brushless motor
IFOV 8 +/– 0.4 mrad 8.16 mrad (5.6 km) Field stop at telescope focus
Integration period 50% IFOV 0.961 ms (2.9 km) Simultaneous sampling electronics
Field of view +/–50° about nadir +50.5°/–63° Large view with aperture door
GSD 2 x integration time 1.92 ms (5.8 km) Synchronous timing with scanner
Radiometric accuracy 5% all bands except 8% 1378nm > 10% margin Solar diffuser reflector + calibration
Polarimetric accuracy 0.002 for P < 0.2; 0.002 +
0.00375 (P – 0.2) for P > 0.2 > 10% margin
Low instrumental polarization and
depolarization + calibration
Polarimetric stability <0.1% per year <0.1% per year Polarizing prisms/wire grid and crystal
depolarizing calibrators
SNRAll bands > 235, except 910nm >
94, 1378nm > 141 All bands SNR > 30% margin
Low system noise, 1/1.5 cm
VNIR/SWIR apertures
Mass 69 kg 58.4 kg Lightweighted aluminum structure
Stowed dimensions 80 x 110 x 54 cm (x, y, z) 60.8 x 70.2 x 53.5 cm Single housing with deployable doors
Reliability 0.944 0.959 Block redundant electronics
Power Orbit average: < 45W operational,
< 40W survival
33.6W electronics, 5.5W
operational heaters
Efficient power supplies, low power
parts
Data rate <160 kbps <139 kbps Dually redundant 1553 bus
OFF SAFEOPERA-
TIONAL
Operational Power On/Off
Operational Command
SAFE Command or autonomous
SAFE
OFF SAFEOPERA-
TIONAL
Operational Power On/Off
Operational Command
SAFE Command or autonomous
SAFE
Day
1 - 4
Day
5 - 22
Day
23 - 39
Day
40-47
Day 1 – 4 Launch, bus checkout, transition to normal
Day 5 - 22 Orbit raise & verification, additional bus check
Day 23 -39 Outgas period, APS on
Day 40 - 46 Nadir door open, initial lunar and glint moves
Day 47 - … Solar door open, radiometric/lunar calibrations
Nominal science operations
Day
1 - 4
Day
5 - 22
Day
23 - 39
Day
40-47
Day 1 – 4 Launch, bus checkout, transition to normal
Day 5 - 22 Orbit raise & verification, additional bus check
Day 23 -39 Outgas period, APS on
Day 40 - 46 Nadir door open, initial lunar and glint moves
Day 47 - … Solar door open, radiometric/lunar calibrations
Nominal science operations
Proc. of SPIE Vol. 6786 67865L-7

a'S 4 S- a1,' r wI Sr a as aCs - -S- ______ W
a nw_t, -an a —car.riF t
2.2 Sensor Design
The APS is composed of two major modules, the Polarimeter Module (PM) and the Electronics Module (EM) (Figures
9 and 10). The PM functionally collects the scene and calibration data up to and including the pre-amplifier level as
well as supplies the opto-mechanical structure to survive the launch and perform in the thermal environment. The EM
provides the analog signal processing as well as command, control, and data formatting. In turn, the modules are
composed of main assemblies and subassemblies to perform specific functions to meet the system requirements.
Conversely, during integration the subassemblies are built up to the main assemblies, modules, and finally sensor.
Figure 9. Exploded view of system illustrates hardware components.
Earthshield Assembly
Cryoradiator Assembly
Electronics Module
Dark Reference Assembly
Alignment Cube
Solar Reference Assembly
Spacecraft Mounts
Scan Motor Assembly
Mainframe Assembly
Optics & Detector Module
Aperture Door AssemblyUnpolarized Reference Assembly
Polarized Reference Assembly
Cover Assembly
Proc. of SPIE Vol. 6786 67865L-8

Figure 10. APS block diagram of assemblies, information flow, and interfaces (Redundant components are shown in pink shadow
boxes).
The Optics and Detector Module (ODM) (Figures 11–13) houses the optical system which consists of six boresighted
telescopes oriented in a radial bunch, four of which pass the visible and near-infrared (VNIR) bands and two pass the
short-wave infrared (SWIR) bands. The 1 cm aperture afocal VNIR telescopes are each composed of an objective and a
collimator with a field stop located at the focus that defines the IFOV. The SWIR telescopes are similar to the VNIR
but with 1.5 cm apertures to increase SNR to the required levels in those bands.
Wollaston prisms are located behind the telescopes and serve as the polarization analyzers for the system. The S and P
polarization states are spatially separated by a small divergence angle into two beams. Three of the six telescopes have
the Wollaston prisms oriented to resolve the 0°/90° polarization components while the other three conjugate telescopes
have the Wollaston prisms physically rotated by 45° in azimuth with respect to the first set to resolve the 45°/135°
components. In this manner, the four linear polarization components are resolved for each of the 9 spectral bands which
results in 36 simultaneous measurements.
Once processed by the analyzers, the light for each path is passed through a series of dichroic filters that folds the light
orthogonally and provides broadband spectral separation. The tilt axis of the dichroic is aligned such that the two
conjugate channels strike the surface with the same path length to avoid polarization errors that are induced by a varying
polarized spectral response within a scene. A focus lens and narrowband filter is located in each discrete optical path.
Each focused S and P state is re-imaged on one of 36 discrete detector elements.
Auxiliary
Card
Power
Supply
Servo
Controller
Solar
Reference
Dark
Reference
Unpolarized
Reference
Polarized
Reference
1553 1 pps
ADC
SPA
ADC
SPA
ADC
SPA
Collimator Field Lens Wollason
Prism
Dichroic
Beamsplitter
Dichroic
Beamsplitter
Fold
Mirror
Focusing
Lens
Focusing
Lens
Focusing
Lens
Bandpass
Filter
Bandpass
Filter
Bandpass
Filter
Dual
Detectors
Dual
Detectors
Dual
Detectors
Signal
Digital Processor
Fore Optics Aft Optics
6 Optical Paths 6 Optical Paths
Scan Motor
& Encoder
Servo
Controller AUXPower
Supply
Polarimeter
Module
Electronics
Module
Internal
Telemetry
SWIR Detector
Heaters
Polarimeter
Module
Temperature
Sensors
Scan Status
Set point Control
& Digital Telemetry
Synch Timing
& Control
+28 VDC Operational Power
Secondary
Power
Scan
Mirror
Assembly
Processor
Doors
Heaters
Temp Sensors
Power & Telemetry
Proc. of SPIE Vol. 6786 67865L-9

S
S
The VNIR bands utilize blue and red enhanced silicon photo-diodes, whereas the SWIR energy is folded into a
cryogenic dewar and relayed by field lenses to form a pupil image on mercury cadmium telluride detectors to avoid any
detector spatial response variations.
Figure 12. Visible Optics and Detectors Assembly (VODA).
Figure 11. End to end optical path of ODM. Figure 13. SWIR Optics and Detectors Assembly (SODA).
All of the telescopes are continuously scanned 360° by the Scan Motor Assembly (SMA) about the optical axis by a pair
of polarization compensated scan mirrors (Figures 14 and 15). This eliminates response versus scan (RVS) since the
angle of incidence is constant as a function of scan angle. The two matched aluminum mirrors have a 45° out-of-plane
orientation with respect to each other, which results in zero net polarization mismatch. A set of windows encapsulate
the scan mirrors so that they do not become differentially contaminant and thereby change the relative reflectance and
disrupt the inherent polarization compensation.
Polarimetric and radiometric accuracy is maintained by a set of calibrators to ensure that system performance is met
throughout the mission. Four calibration sources are located along the scan plane so that calibration data are measured
each scan (Figure 16). The Unpolarized Reference Assembly (URA) provides intra- and inter-telescope relative
responsivity factors (K1, K2, and C12 factors explained later) which are critical to meet polarization accuracy and
stability. The URA is nadir facing so that the spectral content and dynamic range of the scene is virtually the same as
that measured by the Earth samples. It provides a depolarized view for all of the detectors by means of a polarization
scrambler composed of two wedges of crystalline quartz with the optical axes orientated 45° to each other – a spatially
varying retardance is created which scrambles any scene polarization.
A second nadir-facing polarimetric calibrator, the Polarized Reference Assembly (PRA), contains a set of Glan–Taylor
prisms for the VNIR bands and a wire grid polarizer for the SWIR bands to create a view for all channels that is highly
polarized with a known azimuth. The PRA is used to ensure that the absolute degree of linear polarization of scene
measurements is correct. It is also used to monitor and correct for any change in instrumental polarization that may
occur over the mission lifetime.
The Solar Reference Assembly (SRA) provides for absolute radiometric correction by means of solar reflectance from a
well characterized diffuser plate. The SRA is positioned to view the sun when the spacecraft is just behind the North
Pole terminator.
VNIR telescopes (4)
SWIR telescopes (2)
Wollaston prisms (6)
VNIR detector
assemblies (12)
Dichroic beamsplitters, focus
lenses and spectral filters (18)
Scan mirrors
and windows
Tilt mirrors, dewar
windows, SWIR
detector assemblies (6)
Proc. of SPIE Vol. 6786 67865L-10

The Dark Reference Assembly (DRA) serves two functions: 1) it provides a zero radiance view that is used for offset
subtraction in the calibration routines, and 2) it provides a DC reference so that the Signal Processor can clamp to a
known value at the pedestal of the ADC to mitigate any detector drift within a scan. The DRA is composed of geometry
that will give multiple surface reflections of highly specular black paint and extinguish stray light that is incident upon
it.
Figure 14. Scan mirrors and windows. Figure 15. Scan Mirror Assembly. Figure 16. Calibrators and SMA.
The EM provides all the necessary functions for the APS to perform on orbit and is composed of five separate circuit
elements packaged into slices (Figure 17). The completed housing is EMC tight, utilizes EMI filtering, and provides a
single point ground to the spacecraft. The EM also has a radiator plate as part of the thermal control system to reject
waste heat into space and maintain thermal equilibrium. The EM displaces its volume in the base of the PM to form
the tightly packaged APS. The EM provides fault tolerance by means of full redundancy up to the Signal Processor
slice. The redundancy scheme is driven by the requirement for three years of on-orbit operation (higher probability of
success) which in turn is driven by the 7-year on-orbit operation/15-year design life. The APS possesses a unique
intrinsic redundancy attribute: three of the four channels for each band are necessary to measure polarization; the
remaining channel can be solved using inter-telescope calibration coefficients.
Table 2. Electronics Module slices, CCAs, and functions
Power Supply (PS) Produces all the secondary waveforms from the +28VDC
spacecraft Slice 1
Auxiliary controller
(AUX)
Provides temperature control of the SWIR dewar assembly
Collects and digitizes temperature telemetry of the system
Digital Processor (DP)
Command, control, & telemetry reporting via 1553 bus
Provides overall timing and synchronization with spacecraft clock
Formats science and telemetry data in CCSDS packets Slice 2
Scan Controller (SC)
Controls the SMA to 40 RPM with minimal torque disturbance
Provides stow capability of the SMA to protect against
contamination
Slice 3 Signal Processor (SP)
Simultaneously integrates, gains, and then digitizes all 36
channels
DC restore circuit operation once per scan to eliminate drift
The electronics data stream has 36 discrete channels from each of the four polarization measurements from each of the 9
spectral bands. For the 24 VNIR channels, each pair of detector packages is fitted to a dedicated resistive
transimpedance pre-amplifier. Each of the 12 SWIR channels has a differential JFET input and feedback resistors
telescopes
SMA axis
of rotation
Earth or
calibrator
window
window
mirror
mirror
telescopes
SMA axis
of rotation
Earth or
calibrator
window
window
mirror
mirror
DRA
PRA
URA
SRA
SMA
Earth
DRA
PRA
URA
SRA
SMA
Earth
Proc. of SPIE Vol. 6786 67865L-11

packaged with the detectors in the cold dewar to minimize noise; the remainder of the detector pair preamplifier is
located outside the dewar. The pre-amplified signals are routed from the ODM by 9 discrete cables to the top of the EM
(Slice 3) with 9 dedicated signal processor CCAs, one per spectral band set. All the SPs are identical with exception to
the second stage gain, which is determined by radiometric characterization during the sub-system test program and set
by select resistors. All of the signals are simultaneously integrated for 0.96 ms and then multiplexed into a serial stream
of four channels per band. Nine 16-bit ADCs process the data where they are then flowed into the DP slice for
formatting, packetization, and communication with the spacecraft. Data communication with the spacecraft is
accomplished by means of a dually redundant MIL-STD-1553 bus and synchronized with a 1 pulse per second (PPS)
time marker. Primary and redundant external power feeds for operational power, both the nadir and solar reference
doors, as well as the survival and operational heaters are supplied by the Spacecraft.
Figure 17. Card slices integrate into Electronics Module. Figure 18. Spacecraft interface.
The APS mechanical system is driven by inter-/intra-sensor thermal, structural, and optical requirements. Five pseudo-
kinematic titanium feet mechanically bolt the aluminum mainframe to the spacecraft so that the APS can provide its
own thermal management. Approximately 40W of survival power from dedicated spacecraft power feeds is available to
dually redundant thermostatically controlled heaters throughout the sensor. Within the mainframe, the ODM is
suspended by titanium flexures to provide structural stiffness as well as thermal isolation. Coupled with an operational
heater, the ODM is always maintained at a warm temperature so that thermally induced stresses do no introduce bi-
refringence into the optics. The single stage passive radiative cooler is suspended from the mainframe with low
conductance bi-pod stand-offs and internally shielded with a thermal blanket. The Earthshield is designed so that the
Earth is occluded from the cryoradiator and additionally contains a highly specularly reflective inner surface so that the
cryoradiator has an effective full hemisphere view of space. An inner shroud on the SMA minimizes the radiative loss
out of the scan cavity. An operational heater on the motor ensures that the lubricant is not too viscous for the motor
driver if the sensor should be required to go to operational mode from a cold survival condition. A nadir door covers
the scan cavity during launch to prevent contamination due to shed particles, exhaust, and outgassing materials. After
the outgas phase is complete, the one time deployable door is actuated by a paraffin latch. A Solar Reference Door
Assembly is similar in function and operation to keep the diffuse reflectance calibration surface clean and eliminate UV
degradation which would otherwise compromise radiometric accuracy.
3. DATA PROCESSING
3.1 Data Processing Flow
The APS data products are organized into three groups: raw data records (RDRs), sensor data records (SDRs), and
environmental data records (EDRs, as noted above) (Figure 19). The RDRs are effectively the bundled and packetized
data that are exported from the sensor to spacecraft. This includes 1) all the channel data from all sources from the
ADC output, or digital number (DN), 2) SOH telemetry such as temperatures, voltages, and states, and 3) engineering
Digital Process/Scan Controller
Auxillary/Power Supply
AUX/PS/DP/SC
Signal Processor
All Slices
Radiator Plate
Electronics Module
Digital Process/Scan Controller
Auxillary/Power Supply
AUX/PS/DP/SC
Signal Processor
All Slices
Radiator Plate
Electronics Module
+28Vdc Power
Power Return
Chassis ground
Nadir door latch
Solar ref door latch
Survival heaters
Operational heaters
+28Vdc Power
Power Return
J1 - Primary
J5 - Primary
J2 - Redundant
MIL-STD-1553 Bus A
MIL-STD-1553 Bus B
1 PPS A
MIL-STD-1553 Bus A
MIL-STD-1553 Bus B
1 PPS B
J3 - Primary
J4 - Redundant
J6 - Redundant
Spacecraft Thermal Tlmy A J7 - Primary
J8 - Redundant
Nadir door latch
Solar ref door latch
Survival heaters
Operational heaters
Spacecraft Thermal Tlmy B
+28Vdc Power
Power Return
Chassis ground
Nadir door latch
Solar ref door latch
Survival heaters
Operational heaters
+28Vdc Power
Power Return
J1 - Primary
J5 - Primary
J2 - Redundant
MIL-STD-1553 Bus A
MIL-STD-1553 Bus B
1 PPS A
MIL-STD-1553 Bus A
MIL-STD-1553 Bus B
1 PPS B
J3 - Primary
J4 - Redundant
J6 - Redundant
Spacecraft Thermal Tlmy A J7 - Primary
J8 - Redundant
Nadir door latch
Solar ref door latch
Survival heaters
Operational heaters
Spacecraft Thermal Tlmy B
Proc. of SPIE Vol. 6786 67865L-12

EBPGTJTGI
OJJLLT2
I!TJJUb0!11UD
on EP D
cJ CJJfL
DWQGJOJOC
C0UAG O1U
OLT2G
C0TLG4!0U
CfJ!pL!0U
IAE21JUTJJGL
bJ11GGUOL D1
J{GCO1
J{GCOI 1{D1{
telemetry that captures data timing, spacecraft attitude, and ephemeris data. The RDRs along with instrument
characterization data are used to form the SDRs. Every Earth sample is geolocated given the spacecraft position, sensor
scan angle, and data timing, with acceptable line of sight pointing uncertainties. The scene data are converted to
Lambertian-equivalent reflectances provided that the solar geometry/irradiance and atmospheric reflectances are known.
The radiometric offset (measured from the dark reference) and gain (from initial ground calibration with on-orbit
updates) corrections are applied to the sensor radiance calculations. The unpolarized and polarized reference data are
used to correct the information to an absolute polarimetric scale. Polarization component misalignments caused by
Wollaston azimuthal orientation errors are corrected with ground characterization knowledge. Since the APS optical
axis is about the scan axis, the object rotates 360° in a single scan revolution. As such, the image is de-rotated to a
standard reference plane with errors again corrected with measured characterization knowledge. Finally, the SOH
telemetry is reviewed to ensure that the instrument is within operating limits and the SDR is valid.
The EDR retrieval methodology compares well-known aerosol models against observed phenomena to determine the
best correlation. The SDR input is used to reconstitute an EDR site from the various multi-angle views acquired during
an orbit. With 247 Earth samples, 9 spectral bands, and 3 polarization states (I, Q, and U), there are 6,669
measurements in a data set. The EDR sites are identified as ocean, coastal, or land since the retrieval models vary with
surface type. The radiances are corrected for gas absorption using the Ozone Mapping and Profiler Suite (OMPS) as
well as from other sensors. The scene is flagged for cloud content using the Glory CCs, MODIS, as well as the APS
1378 nm band. The retrieval process will proceed differently for scenes with no clouds, water clouds, or cirrus clouds.
Once the data have been filtered and segregated, they will be compared against a library of model results. Various
search algorithms are used to find the best-fit model to the measured data. When a match has been found, a residual
error will be calculated. This process is iterated until the error is sufficiently small, indicating the best possible match
and highest quality EDR.
Ancillary
Sensors
Forward
Model
Results
Gelolocate
Samples
Create Multi-
angle View
Ocean/land Filter
Initial EDR
Inversin
Calculate
Residual
Calculate EDR
Inversion
Sensor Data
Record (SDR)
Environmental Data
Record (EDR)
Residual
Acceptable?
Figure 19. a) RDR to SDR process. b) SDR to EDR conversion process.
3.2 Calibration and Characterization
Calibration and characterization consists of the set of tests and processes necessary to translate the RDRs into SDRs and
ultimately the EDRs for the entire mission life. The calibration and characterization of the APS instrument consists of a
combination of ground and on-orbit measurements that will allow the instrument to achieve its required polarimetric
accuracies. Initial ground based measurements are needed to define several of the sensor’s attributes that are accounted
for in the calibration process. Additionally, pre-launch performance is measured with calibrated optical references to
establish known radiometric and polarimetric scales. These scales are held as the baseline calibration until an on-orbit
scale is established using on-board calibrators. Once on orbit, the instrument performance is monitored using the
calibrators to ensure that the calibration limits are maintained over the lifetime. If the sensor drifts beyond an
acceptable range, it can be re-calibrated as frequently as needed using a combination of on-board and natural (Earth,
sun, moon) sources.
Proc. of SPIE Vol. 6786 67865L-13

Pre-launch radiometric calibration begins by adjusting the dynamic range by adjusting the Signal Processor’s gain select
resistors after viewing a National Institute of Standards and Technology (NIST) traceable spherical integrating source
(SIS) over a range of radiance levels. The calibrated SIS also provides the DN to radiance conversion after correcting
for gain and offset factors. The conversion is expected to be linear but correction factors can be used to describe any
non-linearities. The linearity over the dynamic range is calibrated by sequentially inserting and removing a single
attenuator at multiple source levels with the previous attenuated signal being approximately equal to that of the
subsequent un-attenuated signal. In this way, a derivative is calculated and any slope or higher order polynomial
indicates non-linearities. The signal to noise ratio (SNR) is also measured in this configuration to measure the precision
as a function of dynamic range. The relative spectral response (RSR) for each band is carefully measured with a
monochromator so that uncertainties due to spectral bandwidth, wavelength interpolation, atmospheric absorption, and
integrated out of band effects are characterized. The response versus scan angle (RVS) is also characterized by viewing
a source with the scan mirror constantly pointed towards it and the instrument rotated about the scan axis through the
full range of scan angles. This measurement accounts for spatially varying reflectances of the scan mirrors and
windows which is also a factor in the polarimetric accuracy error budget. As previously mentioned, the on-orbit
reflectance scale is set by viewing the solar spectral irradiance by means of a well characterized lambertian reflector
(Spectralon) of the SRA. The bi-directional reflectance distribution function (BRDF) and surface flatness is
characterized on the ground so that the angularly dependent reflectance of the diffuser is not confused with the sun’s
angle of incidence variations. The relationship of radiance to reflectance in the form of a calibration co-efficient is
shown in Display 1 below. In order to maintain quality of the on-orbit calibration, the APS will the view the moon via a
spacecraft maneuver shortly after the initial solar calibration and establish a secondary source of known radiance.
Thereafter, the moon will be viewed at the same phase of the lunar cycle and accounting for libration effects to monitor
the radiometric stability of the sensor. This technique is chosen in preference to relying on the SRA since the spectral
properties of Spectralon degrade with UV exposure. However, the SRA can still be used as a short term monitor, since
the degradation occurs rapidly in the first month and thereafter is a relatively long time constant phenomenon. The APS
also can take advantage of transfer calibration from the MODIS instrument and vicarious calibration from viewing sites
such as Railroad Valley Playa, NV.
Display 1. Radiometric calibration coefficient for on-orbit reflectance calibration
2SRA
SRASRAsun BRDF)AOIcos(0C
DL
E
where Esun = solar spectral irradiance, AOIsun = angle of incidence of sun onto SRA, BRDFSRA =
ground BRDF characterization of SRA, LSRA = APS measured radiance of the SRA, and D = distance
between Earth and sun to account for seasonal variation.
The polarimetric characterization and calibration is based on a relative scale as opposed to an absolute scale for
radiometry. This is because polarization accuracy is based on the errors associated between the radiance measurements
that make up the Stokes vector components. There are several errors that are removed in the SDR process. Part of
these errors are accounted for in ground based characterization and supplemented with on-orbit calibration to achieve
the required accuracies. The first order corrections are made by obtaining inter- and intra-telescope calibration
coefficients. These are known by measuring a highly depolarized source for all channels (the URA on-orbit and the SIS
with a polarization scrambler for the ground). The difference between conjugate channel responses can be adjusted by
multiplying a gain correction term (K1, K2 described below). Since both a telescope measuring U and a telescope
measuring Q measure the total radiance of the source, a radiometric gain correction term for each band (C12) relates the
radiance response between the telescopes. Several terms are defined below.
Display 2. Basic definitions of Stokes vectors and components
V
U
Q
I
PP
PP
PP
PP
S
S
S
S
S
LR
13545
900
900
135
45
90
0
)atan(
DOLP
21
22
qu
uqp
IUu
IQq
Proc. of SPIE Vol. 6786 67865L-14
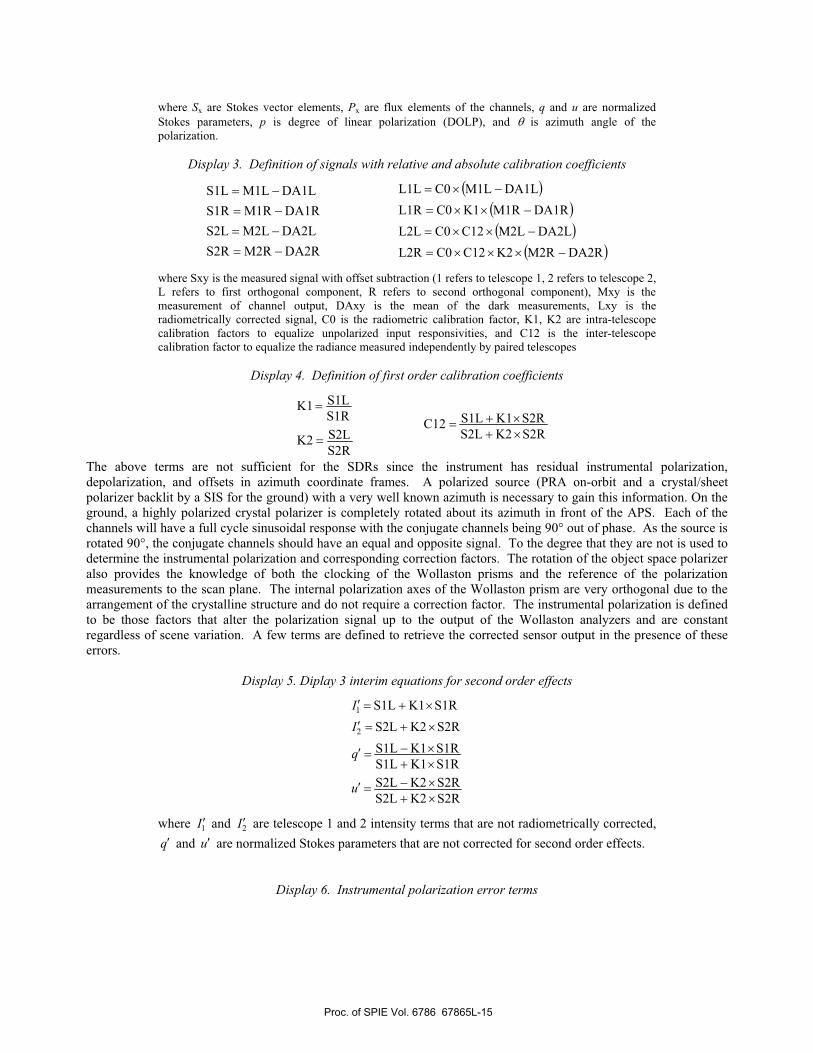
where Sx are Stokes vector elements, Px are flux elements of the channels, q and u are normalized
Stokes parameters, p is degree of linear polarization (DOLP), and is azimuth angle of the
polarization.
Display 3. Definition of signals with relative and absolute calibration coefficients
DA2RM2RS2R
DA2LM2LS2L
DA1RM1RS1R
DA1LM1LS1L
DA2RM2RK2C12C0L2R
DA2LM2LC12C0L2L
DA1RM1RK1C0L1R
DA1LM1LC0L1L
where Sxy is the measured signal with offset subtraction (1 refers to telescope 1, 2 refers to telescope 2,
L refers to first orthogonal component, R refers to second orthogonal component), Mxy is the
measurement of channel output, DAxy is the mean of the dark measurements, Lxy is the
radiometrically corrected signal, C0 is the radiometric calibration factor, K1, K2 are intra-telescope
calibration factors to equalize unpolarized input responsivities, and C12 is the inter-telescope
calibration factor to equalize the radiance measured independently by paired telescopes
Display 4. Definition of first order calibration coefficients
S2R
S2LK2
S1R
S1LK1
S2RK2S2L
S2RK1S1LC12
The above terms are not sufficient for the SDRs since the instrument has residual instrumental polarization,
depolarization, and offsets in azimuth coordinate frames. A polarized source (PRA on-orbit and a crystal/sheet
polarizer backlit by a SIS for the ground) with a very well known azimuth is necessary to gain this information. On the
ground, a highly polarized crystal polarizer is completely rotated about its azimuth in front of the APS. Each of the
channels will have a full cycle sinusoidal response with the conjugate channels being 90° out of phase. As the source is
rotated 90°, the conjugate channels should have an equal and opposite signal. To the degree that they are not is used to
determine the instrumental polarization and corresponding correction factors. The rotation of the object space polarizer
also provides the knowledge of both the clocking of the Wollaston prisms and the reference of the polarization
measurements to the scan plane. The internal polarization axes of the Wollaston prism are very orthogonal due to the
arrangement of the crystalline structure and do not require a correction factor. The instrumental polarization is defined
to be those factors that alter the polarization signal up to the output of the Wollaston analyzers and are constant
regardless of scene variation. A few terms are defined to retrieve the corrected sensor output in the presence of these
errors.
Display 5. Diplay 3 interim equations for second order effects
S2RK2S2L
S2RK2S2L
S1RK1S1L
S1RK1S1L
S2RK2S2L
S1RK1S1L
2
1
u
q
I
I
where 1I and 2I are telescope 1 and 2 intensity terms that are not radiometrically corrected,
q and u are normalized Stokes parameters that are not corrected for second order effects.
Display 6. Instrumental polarization error terms
Proc. of SPIE Vol. 6786 67865L-15

2inst2instinst
1inst1instinst
inst
inst
2sin2cos~
2sin2cos~
2sintanh
2costanh
quu
uqq
u
q
)atan( instnst21
inst
2nst
2nstinst
qu
uqp
i
ii
where qinst, uinst = component instrumental polarization terms (~ indicates re-orientation in
the plane of the Wollaston prisms), = mirror mismatching and telescope error terms, =
orientation of phase angle error, 1 and 2 = clocking offsets of Wollaston prisms, pinst =
resultant of instrumental polarization, and inst = azimuth angle of instrumental polarization.
Display 7. Polarization dependent factor and calibrated SDRs.
(p) can be iterated until it converges to an acceptable level for EDR retrieval.
)atan(
)(
12CC0
)(
0C
~
~
2cos2sin
2sin2cos
)](2cos[
1
)](2cos[1)(
21
scanbias
21
instinst
instinst
12
12
21
instinst
qu
p
I
p
II
upu
qpq
u
q
ppp
u
q
where q and u are polarization scaling factors to adjust for instrumental depolarization, q
and u are the corrected normalized Stokes parameters, bias is the offset of the scan plane
from the true reference, and scan corrects for the rotation of scene polarization azimuth as a
function of scan angle.
Calibration coefficients produced directly by the test equipment are independently compared to that obtained by the on-
board calibrators. That is to say that the quality of the calibrators is compared to that of the test equipment so that any
calibrator uncertainties can also be accounted for in the coefficients. As part of the characterization and calibration
plan, some of the error terms are characterized on the ground and used for the duration of the mission. Other
coefficients are periodically updated with the on-board calibrators. The qinst, uinst, 1, 2, and bias terms are
characterized on the ground and used in the error correction algorithms. The K1, K2, q, and u terms generated from
the URA and PRA respectively are measured during each scan but are not expected to vary significantly during an orbit
in part due to the benign thermal environment, inherit stability of APS, and the stability demonstrated by RSP. As
noted earlier, the radiometric terms C0 and C12 are initially measured by the SRA and then by monthly lunar views
thereafter, but still utilizing the SRA to monitor short term stability.
ACKNOWLEDGEMENTS
The APS project has been funded by NASA. The authors thank the large community of persons dedicated to advancing
the study of global climate change and its implications. We would like to recognize the contribution to Earth sciences
by Yoram J. Kaufman who was tragically taken in June 2006.
REFERENCES
1. B. Cairns, L. D. Travis and E. E. Russell, “The Research Scanning Polarimeter: Calibration and ground-
based measurements”, Proc. SPIE, Vol. 3754, 186–197 (1999).
2. M. Z. Jacobson, “Control of fossil-fuel particulate black carbon and organic matter, possibly the most
effective method of slowing global warming”, J. Geophys. Res., Vol. 107, 4410 (2002).
Proc. of SPIE Vol. 6786 67865L-16

3. G. Kopp, G. Lawrence, and G. Rottman, “The Total Irradiance Monitor design and on-orbit functionality”,
Proc. SPIE, Vol. 5171, 5171-4 (2003).
4. M. I. Mishchenko, B. Cairns, J. E. Hansen, L. D. Travis, R. Burg, Y. J. Kaufman, J. V. Martins, and E. P.
Shettle, “Monitoring of aerosol forcing of climate from space: analysis of measurement requirements”, J.
Quant. Spectrosc. Radiat. Transfer, Vol. 88, 149–161 (2004).
5. M. I. Mishchenko and I. V. Geogdzhayev, “Satellite remote sensing reveals regional tropospheric aerosol
trends”, Opt. Express, Vol. 15, 7423–7438 (2007).
6. M. I. Mishenko, B. Cairns, G. Kopp, C. F. Schueler, B. A. Fafaul, J. E. Hansen, R. J. Hooker, T. Itchkawich,
H. B. Maring, and L. D. Travis, “Accurate monitoring of terrestrial aerosols and total solar irradiance:
Introducing the Glory Mission”, Bull. Amer. Meteorol. Soc., Vol. 88, 677 – 691 (2007).
7. M. I. Mishchenko, I. V. Geogdzhayev, B. Cairns, B. E. Carlson, J. Chowdhary, A. A. Lacis, L. Liu, W. B.
Rossow, and L. D. Travis, “Past, present, and future of global aerosol climatologies derived from satellite
observations: a perspective”, J. Quant. Spectrosc. Radiat. Transfer, Vol. 106, 325–347 (2007).
8. M. I. Mishchenko, I. V. Geogdzhayev, W. B. Rossow, B. Cairns, B. E. Carlson, A. A. Lacis, L. Liu, and L.
D. Travis, “Long-term satellite record reveals likely recent aerosol trend”, Science, Vol. 315, 1543 (2007).
9. L. A. Remer, Y. J. Kaufman, D. Tanré, S. Mattoo, D. A. Chu, J. V. Martins, R.-R. Li, C. Ichoku, R. C. Levy,
R. G. Kleidman, T. F. Eck, E. Vermote, and B. N. Holben, “The MODIS aerosol algorithm, products, and
validation”, J. Atmos. Sci., Vol. 62, 947 – 973 (2005).
Proc. of SPIE Vol. 6786 67865L-17