Embed Size (px)
Citation preview

Atmos. Chem. Phys., 4, 1201–1215, 2004www.atmos-chem-phys.org/acp/4/1201/SRef-ID: 1680-7324/acp/2004-4-1201
AtmosphericChemistry
and Physics
Aerosol-ozone correlations during dust transport episodes
P. Bonasoni1, P. Cristofanelli1, F. Calzolari1, U. Bonafe1, F. Evangelisti1, A. Stohl2, S. Zauli Sajani3, R. van Dingenen4,T. Colombo5, and Y. Balkanski6
1National Research Council, Institute for Atmospheric Science and Climate, via Gobetti 101, 40129, Bologna, Italy2Cooperative Institute for Research in the Environmental Sciences, University of Colorado/NOAA Aeronomy Laboratory,USA3Agenzia Regionale Prevenzione e Ambiente dell’Emilia-Romagna, Struttura Tematica Epidemiologia Ambientale, Modena,Italy4Joint Research Center, Ispra, Italy5Ufficio Generale per la Meteorologia, Pratica di Mare, Roma, Italy6Laboratoire des Sciences du Climat et de l’Environment, Gif-Sur-Yvette Cedex, France
Received: 3 February 2004 – Published in Atmos. Chem. Phys. Discuss.: 16 April 2004Revised: 14 July 2004 – Accepted: 27 July 2004 – Published: 3 August 2004
Abstract. Its location in the Mediterranean region andits physical characteristics render Mt. Cimone (44◦11′ N,10◦42′ E), the highest peak of the Italian northern Apennines(2165 m asl), particularly suitable to study the transport of airmasses from the north African desert area to Europe. Duringthese northward transports 12 dust events were registered inmeasurements of the aerosol concentration at the station dur-ing the period June–December 2000, allowing the study ofthe impact of mineral dust transports on free troposphericozone concentrations, which were also measured at Mt. Ci-mone. Three-dimensional backward trajectories were usedto determine the air mass origin, while TOMS Aerosol In-dex data for the Mt. Cimone area were used to confirm thepresence of absorbing aerosol over the measurement site.
A trajectory statistical analysis allowed identifying themain source areas of ozone and aerosols. The analysis ofthese back trajectories showed that central Europe and northand central Italy are the major pollution source areas forozone and fine aerosol, whereas the north African desert re-gions were the most important source areas for coarse aerosoland low ozone concentrations. During dust events, the Mt.Cimone mean volume concentration for coarse particles was6.18µm3/cm3 compared to 0.63µm3/cm3 in dust-free con-ditions, while the ozone concentrations were 4% to 21%lower than the monthly mean background values. Our obser-vations show that surface ozone concentrations were lowerthan the background values in air masses coming from northAfrica, and when these air masses were also rich in coarseparticles, the lowest ozone values were registered. More-over, preliminary results on the possible impact of the dustevents on PM10 and ozone values measured in Italian urban
Correspondence to:P. Bonasoni([email protected])
and rural areas showed that during the greater number of theconsidered dust events, significant PM10 increases and ozonedecreases have occurred in the Po valley.
1 Introduction
Mineral dust is one of the greatest sources of natural aerosoland represents, with 2150 Tg/yr, about 37% of the total pro-duction of atmospheric primary aerosols by both naturaland anthropogenic sources (Penner et al., 2001). When theweather conditions are favourable to lift dust material, dustparticles rising in the free troposphere can be transportedover long distances by the atmospheric circulation. The pres-ence of mineral dust in the atmosphere may contribute to cli-matic variations and influence the behaviour of some tropo-spheric trace gases, changing the oxidizing capacity of theatmosphere (Arimoto, 2001). Atmospheric aerosol can mod-ify the energy balance through scattering and absorption oflight (Sokolik and Toon, 1996). The radiative effect of min-eral aerosol from natural sources and disturbed soils con-tributes about 8% to total aerosol scattering of incoming so-lar radiation (Andreae, 1995). In particular, those mineralaerosol particles, which are characterised by very large sur-face area, can strongly absorb the shortwave solar radiation,influencing the radiative forcing of climate (Dickerson et al.,1997), or causing a photolysis rate reduction, thus inhibitingozone production. In fact, in the lower atmosphere, mineralaerosol may strongly influence the balance of atmospherictrace gases, including ozone (Prospero et al., 1995; Den-tener and Crutzen, 1993; Zhang et al., 1994; Dickerson etal., 1997). Dentener et al. (1996) in their modelling stud-ies, suggested that the ozone destruction on mineral aerosol
© European Geosciences Union 2004
1202 P. Bonasoni et al.: Aerosol-ozone correlations during dust transport episodes
surfaces could lead to a 10% reduction of O3 concentrationsin the dust source areas. In fact, the large surface area of soliddust particles may play a significant role as a reactive surfaceon which heterogeneous chemistry can take place (Schmitt etal., 1988; Zhang et al., 1994). Recently, from a global mod-elling study, Bauer et al. (2004) have found out that duringthe year 2000 a decrease in global tropospheric ozone massby about 5% could be due to the heterogeneous reactionson dust aerosol. Hanisch and Crowley (2003) have shownthat the ozone loss can be due to decomposition, catalyticdestruction or absorption on mineral oxides.
In order to find out whether air masses coming from theSahara carry depleted O3 concentrations during their traveltowards or passage over the European continent, it wouldbe necessary to know the ozone concentration in the desertsource areas. Unfortunately, due to the lack of measurementsites in these areas the actual concentrations of backgroundO3 in the African deserts are not known. Only few measure-ments in the Lybian desert (Gusten et al., 1996), in Chad andTunisia (Fabian and Pruchniewicz, 1977) were carried out inthe past. Fabian and Pruchniewicz (1977) found that the low-est O3 concentrations were associated with air masses com-ing from Central Africa, while Gusten et al. (1996), in spiteof the limited measurement period (18 days), highlighted aninteresting phenomenon. During their measurements, carriedout in the western Lybia desert (30 km south of the Oasis ofDukhla), relatively small O3 diurnal variations ranging be-tween 45 and 50 ppbv were registered when northerly windsprevailed. On the contrary, under southerly winds comingfrom the desert, very low O3 concentrations with a diurnalvariation between 25 and 45 ppbv were measured (Gusten etal., 1996). Outside the African deserts, but close to the westcoast of north Africa, trace gas measurements, carried out atthe Izana baseline mountain station (Canary Islands), showedmarked surface ozone depletions during Saharan dust events(Prospero et al., 1995; Schmitt et al., 1998), which sig-nificantly influenced the annual mean ozone concentrations(Schmitt et al., 1998; de Reus et al., 2000).
Dust mobilisation over the African deserts supplies a largecontribution to natural mineral aerosol in the atmosphere.Using the Total Ozone Mapping Spectrometer Aerosol In-dex (TOMS-AI), Prospero (1999) showed that the Saharadesert exports more dust than any other desert region. Duringdust storms, aerosol concentrations of more than 1000µg/m3
(Ganor, 1994) can be injected into the atmosphere. Al-though a great part of this mineral aerosol moves westwardinto the Atlantic Ocean and towards the American conti-nent, another considerable part can be transported across theMediterranean basin towards Southern Europe and can oc-casionally even reach Central and Northern Europe (Franzenet al., 1994; Schwikowski et al., 1995; Moulin et al., 1998;Kubilay et al., 2000; Rodriguez et al., 2001). Ansmann etal. (2003) have recently documented the large spatial ex-tent and three-dimensional structure of such a dust trans-port event using data from the European aerosol lidar net-
work. Moulin (1997) estimated in his thesis that 70×106
tons of dust are transported annually over the Mediterraneanand 350×106 tons of dust are transported over the Atlantic.This is in good agreement with work from Schutz (1980) andd’Almeida (1986) who estimated the north Atlantic transportat respectively 260 and 190×106 tons and the Mediterraneantransport at 100×106 tons.
In Southern Europe, Mt. Cimone is one of the first highmountains that is passed by the Saharan air masses and wheremeasurements of the chemical composition of the back-ground atmosphere are regularly carried out. This has per-mitted to register several Saharan dust intrusions since 1991(Bonasoni et al., 1996), showing that low ozone concentra-tions usually accompany these transport events. This fact wasconfirmed by soundings of ozone, humidity and temperaturecarried out in the lowland Po valley (Bonasoni et al., 1998).During the recent MINATROC EU project (Mineral Dust andTropospheric Chemistry), in order to better characterize theinfluence of mineral aerosol on surface ozone concentration,high time resolution in situ measurements of surface ozone,aerosol size distribution and other parameters were carriedout at Mt. Cimone from June to December 2000. This per-mitted to identify all the dust transport events reaching Mt.Cimone. The correlation between ozone concentration andcoarse and fine aerosol was studied also using back-trajectoryand satellite data analyses. Moreover, possible influence ofSaharan dust transport on PM10 and ozone concentrationsmeasured in urban and rural sites in the Po valley, has beenalso considered.
2 Site, experimental procedures, and methods
2.1 Site and measurement description
In order to investigate the relationship between trace gasesand mineral aerosol in the free troposphere, an extended fieldcampaign, with measurements of O3 and PM10, particle sizeand mass distribution and meteorological parameters, wascarried out at the Mt. Cimone baseline station (44◦11′ N,10◦42′ E, 2165 m asl) from June to December 2000. Mt.Cimone (MTC) is the highest mountain peak in the North-ern Apennines. It is considered representative of the Euro-pean continental background conditions (Fischer et al., 2003;Bonasoni et al., 2000) and due to its altitude (2165 m asl)and geographical position (44◦11′ N, 10◦42′ E) to the southof the Alps and the Po valley and to the north of the Mediter-ranean Sea, this measurement site is suitable to study a widespectrum of atmospheric processes. Particularly, the Apen-nines are the first mountain chain met by Saharan air masseson their way to Europe. Usually, dust transport events oc-cur with strong synoptically forced south-westerly windsthat, even during the summer season, prevent the develop-ment of the valley breeze wind regime, which could poten-tially bring locally polluted air masses up to MTC. In fact,
Atmos. Chem. Phys., 4, 1201–1215, 2004 www.atmos-chem-phys.org/acp/4/1201/

P. Bonasoni et al.: Aerosol-ozone correlations during dust transport episodes 1203
Table 1. Saharan dust events recorded at MTC in the period June–December 2000. Travel Time represents the mean travel time of the airmasses from north Africa coastline to Mt. Cimone. The hourly coarse peak value (the hourly minimum for ozone), the hourly mean valuerecorded during each event as well as the monthly mean concentration are reported for coarse aerosol particle (Coarse) and for de-trendedozone (ODET
3 ). Finally, the percentage differences (1ODET3 ) between the monthly ODET
3 mean value and the hourly ODET3 minimum
value are reported.
Coarse concentration (N/cm3) ODET3 concentration (ppbv)
Event Travel Time Peak value Mean value Monthly Minimum value Mean value Monthly1ODET3
(h) during event during event mean value during event during event mean value (%)
2–4 July 47 3.21 0.84 0.23 43 53 55 2220–24 August 53 3.09 0.93 0.14 36 51 55 3526–28 August 45 3.86 0.91 0.14 48 53 55 1317–21 September 56 2.76 0.34 0.13 37 49 56 3426–30 September 80 0.84 0.26 0.13 46 54 56 184–7 October 61 0.40 0.10 0.02 33 49 55 4013–14 October 27 3.88 1.04 0.02 32 48 55 4225–27 October 97 4.17 0.33 0.02 45 51 55 1813–17 November 31 0.28 0.08 0.02 39 45 57 32
29–30 November1–2 December 53 0.58 0.04 0.02 35 46 57 39
8–9 December 27 0.23 0.04 0.03 48 53 55 1313–15 December 100 0.25 0.08 0.03 38 50 55 31
during the considered period, the hourly mean wind velocityrecorded at MTC during the dust transport events (10.1 m/s)was more than twice that during “normal” conditions withoutdust transport. Located at a distance of about 1600 km fromthe African deserts, the Saharan air masses can directly reachthe measurement site in a few days. As obtained from back-trajectory analysis, during the period of the present study(June–December 2000) the mean air mass travel time fromthe north African coast to MTC was 64 hours, but in about50% of the cases it took less than 53 h. The fastest trans-ports occurred during the 13–14 October and 8–9 Decemberevents, when in average African air masses took only 27 h toreach MTC (Table 1).
During the MINATROC project (Mineral Dust and Tro-pospheric Chemistry) an intensive measurement campaigntook place at MTC during the summer of 2000 (see com-panion papers in this issue). After the intensive campaignfrom 1 June to 5 July, measurements of surface ozone andaerosol size distribution were continued till the end of theyear. Ozone was measured with an UV-absorption anal-yser (Dasibi 1108) with an accuracy of better than 5% andone minute time resolution. The air inlet was placed at 8 mabove the ground. Aerosol concentrations and size distribu-tions of particles with aerodynamic diameters between 0.30and 20µm were measured with an optical particle counter(OPC) (Particle Size Analyser Grimm Mod. 1.108) in 15size channels with one minute time resolution. A built-inflow-controlled pump was used to draw in the air samplethrough the sampling head. These measurements permittedus to distinguish between coarse (1µm<Dp<20µm) andfine (0.3µm<Dp≤1µm) aerosol particles (see Hanisch and
Crowley, 2003) which – as we shall show below – have aquite different relationship with ozone. This extensive dataset of aerosol size distribution constitutes the first continuousdust record with high time resolution (interrupted only from6 July to 4 August 2000) carried out in the free tropospherein this part of the northern Mediterranean area.
2.2 Trajectory model description and application to fieldconcentration
We used the Lagrangian model Flextra (Stohl et al., 1995)to calculate three-dimensional 10-day back-trajectories arriv-ing at MTC every three hours. Flextra uses meteorologicalanalysis fields (every 6 h) plus 3-h forecast fields producedby the numerical weather prediction model of the EuropeanCentre for Medium Range Weather Forecasts (ECMWF). Po-sition information along the trajectories was available every3 h. Typical trajectory errors are about 10–20% of the traveldistance (Stohl, 1998), but individual trajectories can havemuch larger errors depending on the meteorological situa-tion. Further errors in tracing the air masses can be causedby the difference between the real topography and the modeltopography around MTC, which can be quite large.
To investigate the correlation between air mass originsand the ozone and aerosol (fine and coarse) concentrationsrecorded at MTC, we applied the trajectory statistics methodof Seibert et al. (1994). This simple method has the potentialto determine the source regions of measured substances us-ing only the measurement data and the trajectories, withoutinvolving a detailed model of the emission, transformationand removal processes occurring in an air mass. Thus, it also
www.atmos-chem-phys.org/acp/4/1201/ Atmos. Chem. Phys., 4, 1201–1215, 2004

1204 P. Bonasoni et al.: Aerosol-ozone correlations during dust transport episodes
Figure 1. Average aerosol number size distribution at MTC during dust events and dust-free conditions.
Fig. 1. Average aerosol number size distribution at MTC duringSaharan dust events and dust-free conditions.
avoids the errors associated with these complex models andyields a measurement-based and receptor-oriented estimateof the sources of atmospheric trace species. In order to iden-tify the source areas of a specific species (in our case ozone oraerosol concentrations) monitored at the measurement site,a so-called concentration field on a geographical grid (hor-izontal resolution 1◦×1◦) is calculated with this method byattributing a measured concentration to every point along thetrajectory arriving at the time of measurement. Consideringall the trajectories and all the data recorded during the periodof study, a mean concentration is obtained for each grid cellof the concentration field.
Assumingm, n to be the indices of the horizontal grid,l
the index of each trajectory,M the total number of the ap-plied trajectories,cl the concentration recorded at the arrivalof trajectoryl andτmnl the time spent in the cell(m, n) by thetrajectoryl, the mean concentration was calculated by usingthe following formula:
log(Cmn) =1
M∑l=1
τmnl
∑M
l=1log(cl) τmnl (1)
The concentration field obtained in this way can be inter-preted as the distribution of sources contributing to the mea-sured values at MTC. In order to eliminate small-scale vari-ations in the concentration field which are not statisticallysignificant, a 9-point smoothing operator was applied foreach cell. To avoid that significant features are removed, thesmoothing procedure was applied only for those values ex-ceeding an interval calculated on the 95% confidence levelfor a t-statistic. The statistic was applied to the number oftrajectories passing across each cell, assuming that individ-ual measured values were independent from each other.
The concentration field method by Seibert et al. (1994) isknown to underestimate the spatial gradients of the sourcefields, since the concentrations measured at the receptor loca-tion are smeared out along the segments of the associated tra-jectory, while actual emissions may take place only in somesegments (Wotawa and Kroger, 1999). However, as we focuson the contributions of a large area (i.e. north Africa) a highspatial resolution of the concentration field is not required inour case. Moreover, the resulting concentration fields have tobe interpreted as source fields contributing specifically to theconcentration at MTC. The actual spatial distribution of theconsidered species or its sources may be different becausethe meteorological conditions (and thus also the emission,transformation and removal processes) are specific for thepathway towards MTC (Stohl, 1998). Furthermore, the den-sity of the trajectory information and thus the reliability ofthe method decreases with distance from MTC. For anotherreceptor site the source field may therefore look slightly dif-ferent.
2.3 TOMS aerosol index
The absorbing aerosol index (AI) from the Total Ozone Map-ping Spectrometer (TOMS), defined as the difference be-tween the backscattered radiation measured in two ultravioletchannels, provides a linear relationship with the aerosol op-tical depth for smoke and dust: the larger the aerosol index,the higher the optical depth. Although negative AI values areusually related to non-absorbing particulate matter for whichaerosol scattering dominates over absorption (Torres et al.,1998), small negative values (i.e. AI>−2) could also be in-dicative for a weakly absorbing particle layer not far fromthe Earth’s surface. The AI archive by TOMS constitutes aneasy-to-use satellite data set available for the entire globe.Maps of the aerosol index are available with a resolution of1.25◦ in longitude by 1◦ in latitude. The “Earth Probe” satel-lite, which hosts the TOMS spectrometer, has a polar orbitwith a local passing time around 11:00 a.m. over MTC, witha shift of about 30 min varying from year to year. Althoughthe absorbing AI has severe drawbacks in terms of quantita-tive validation of the dust emissions, recent studies suggestthat useful information can nevertheless be retrieved with areasonable accuracy (Chiapello and Moulin, 2002; Torres etal., 2002). In fact, in order to highlight persistent dust sources
Atmos. Chem. Phys., 4, 1201–1215, 2004 www.atmos-chem-phys.org/acp/4/1201/

P. Bonasoni et al.: Aerosol-ozone correlations during dust transport episodes 1205
Fig. 2. Time series of the aerosol volume size distribution at MTC during the period June–December 2000.
and typical dust transports in atmosphere, a 13-year climatol-ogy (1980–1992) of TOMS-AI was systematically examinedby Prospero et al. (2002).
2.4 Identification of Saharan dust reaching Mt. Cimone
The identification of Saharan dust episodes was conducted byanalysing the hourly number concentration of coarse aerosolparticles, considered as a marker of mineral dust present atMt. Cimone (Van Dingenen et al., 2001). Applying the low-pass filter of Kolmogrov-Zurbenko (Zurbenko, 1986), thestrong dust transport events characterised by coarse parti-cle peaks higher than the monthly 75 percentile were iden-tified. In order to deduce the origin of coarse peak events,back-trajectories from MTC were calculated. In particular,the strong dust episodes characterized by at least 3 trajecto-ries/day originated from the north Africa geographical box(10◦ N–35◦ N; 15◦ W–30◦ E), have been considered as “Sa-haran dust events”. This guarantees the undoubted origin ofnorth African air masses. This methodology allowed us toselect 12 Saharan dust events at MTC in the period June–December 2000, as summarised in Table 1. In order to cor-roborate the dust events, additional information was obtainedfrom satellite images from SeaWiFS – Sea viewing WideField-of-view Sensor (McClain et al., 1998), model resultsof dust optical depth from NAAPS – Navy Aerosol Anal-ysis and Prediction System (Hogan et al., 1991, 1993) andaerosol loading from IcoD/DREAM – Dust Regional Atmo-spheric Model (Nickovic et al., 2001). The strongest Sa-haran dust event among the 12 recorded at MTC occurredon 25–27 October 2000, when coarse number concentrationof 4.17 N cm−3, compared with the monthly mean value of0.02 N cm−3, was measured. The 50% of dust events was
characterised by coarse peak number concentration greaterthan 2.70 N cm−3.
3 Results and discussion
3.1 Analysis of aerosol during dust transport episodes
3.1.1 Mt. Cimone
Saharan dust episodes brought about pronounced changes inthe aerosol size distribution and in the chemical compositionof aerosols compared to dust free conditions at MTC (VanDingenen et al., 2001). This is illustrated in Fig. 1, whichshows average aerosol number size distributions during Sa-haran dust events and under dust-free conditions at MTC.The episodic appearance of the coarse (dust) mode aerosolduring the period June-December can clearly be seen in thetime series of the aerosol volume size distribution in Fig. 2.It can also be seen that dust events occurred most frequentlyfrom June to October.
In order to identify the major dust production areas duringour period of study, we used the TOMS-AI data. Figure 3shows a map of the average of all positive AI values for theJune–December 2000 period. The areas of maximum meanAI likely correspond to the main source regions for mobi-lized dust and match well with a five-year TOMS-AI analysisfor the Mediterranean region (Israelevich et al., 2002). TheChad basin (about 16◦ N; 16◦ E) and the Eljouf basin in Mali(about 19◦ N; 6◦ W) appeared as the main dust source areas,while minor source areas can be identified in Libya, betweenAlgeria and Tunisia, in the Arabian Peninsula and in North-ern Sudan. In spite of the short period of investigation, it
www.atmos-chem-phys.org/acp/4/1201/ Atmos. Chem. Phys., 4, 1201–1215, 2004

1206 P. Bonasoni et al.: Aerosol-ozone correlations during dust transport episodes
Figure 3: Average spatial distribution of positive TOMS - AI over North Africa and Europe for the period June - December 2000.
Fig. 3. Average spatial distribution of positive TOMS-AI over northAfrica and Europe for the period June–December 2000.
Fig. 4. Concentration field for TOMS-AI retrieved for the MTCpixel area as obtained by the trajectory statistical analysis, June–December 2000.
is evident that enhanced positive AI values extend into theMediterranean region, indicating active dust transport.
In order to confirm the transport of aerosol in the tropo-sphere over the MTC area, we retrieved the daily TOMS-AIvalue for the MTC pixel area (pixel size 1.25◦ Lon., 1.00◦
Lat.) and combined these data with the back-trajectories end-ing at MTC. For our purpose we made the assumption thatthe daily AI values are representative for 24 h, attributing thesame measured value to all the eight daily trajectories. We
Fig. 5. Number concentration (N/cm3) field for fine aerosol(Dp≤1µm) as obtained by the trajectory statistical analysis, June–December 2000.
Fig. 6. Number concentration (N/cm3) field for coarse aerosol(Dp>1µm) as obtained by the trajectory statistical analysis, June–December 2000.
furthermore assumed that usually the trajectories ending atthe altitude of MTC are representative for the dust transport.This is not an unlikely assumption, because the dust is fre-quently transported in layers in the lower free troposphereat about the MTC altitude (Hamonou et al., 1999). In or-der to identify the dust sources contributing to the dust in theMTC pixel (as indicated by the TOMS-AI), trajectory statis-tics were applied to the combined data set. The results of thisanalysis (Fig. 4) clearly show that positive TOMS-AI values
Atmos. Chem. Phys., 4, 1201–1215, 2004 www.atmos-chem-phys.org/acp/4/1201/

P. Bonasoni et al.: Aerosol-ozone correlations during dust transport episodes 1207
Figure 7. Daily positive values of TOMS-AI for the MTC pixel area (A) and coarse aerosol concentration recorded at Mt. Cimone (B) during the period June-December 2000 (Nov.–Dec. right scale). White circles represent days during which back-trajectories originated from North Africa. Grey bars represent the duration of the dust transport events.
Fig. 7. Daily positive values of TOMS-AI for the MTC pixel area(A) and daily coarse aerosol number concentration recorded at Mt. Cimone(B) during the period June–December 2000 (November–December right scale). White circles represent days during which back-trajectoriesoriginated from north Africa. Coloured bars represent the duration of the dust transport events.
at the location of MTC are associated with transport fromnorth Africa, with the principal source region being locatedin Algeria.
In order to determine the main source regions for theaerosols measured in situ, we applied the trajectory statis-tics method to both coarse and fine fractions of the parti-cle number concentrations measured at MTC during the pe-riod June–December 2000. The number concentration fieldfor the fine particle is shown in Fig. 5. The highest num-ber concentrations of fine particles, which are mostly pro-duced by transformation of gaseous compounds into the liq-uid or solid phase (Hering et al., 1998; Raes et al., 2000), aremainly related to regions with strong anthropogenic sourcesof precursor gases like central and Northern Italy, and con-tinental north and North-Eastern Europe. In these areas thecontribution of fine particles directly emitted by combustionprocesses and produced by photochemical reactions is veryimportant, because they take place in an atmosphere rich inammonium nitrate and ammonium sulphate (Bowman et al.,1995). Enhanced values in the number concentration fieldare also found over Northern Africa, possibly indicating dustmobilization as a secondary source for fine-mode aerosols.In fact, as evidenced in Fig. 2, Saharan dust events are of-ten associated not only with enhanced concentrations of thecoarse-mode aerosols, but also with enhancements in smalleraerosols (Gomes et al., 1990).
Figure 6 shows the number concentration field for thecoarse fraction. The highest coarse aerosol number concen-trations measured at MTC are usually associated with low
latitude air masses originating in north Africa lower tropo-sphere, particularly in Algeria (Fig. 6). These trajectoriesoriginated at altitudes below 1500 m, where soil dust is mo-bilized during dust storms. The concentration field for coarseaerosols number concentration is in good agreement with thesimilar analysis carried out for the TOMS AI data (Fig. 4)and confirms that north Africa is the principal source regionfor coarse aerosol measured at MTC. To evaluate the agree-ment between these two concentration fields we calculateda simple linear correlation coefficient. The close agreement(r=0.62) between the TOMS AI concentration fields and thecoarse particle number concentrations is understandable as aconsequence of the strong correlation between the time se-ries of these two parameters (Fig. 7a and b). The maximumof coarse and fine aerosol as well as of TOMS AI concen-tration field north of the Canary Islands is likely an artefactof the statistical methodology applied. It is possibly causedby dust (fine and coarse mode) mobilized over north Africaand transported along an anticyclonic pathway first north-westward over the Atlantic ocean and then north-eastwardover the Mediterranean basin (Rodriguez et al., 2001). Thispathway was observed, for instance, during the episodes on2–4 July, 20–24 August and 26–30 September. As the tra-jectory statistics method applied here attributes the measuredconcentration to the entire trajectory and not to the actual lo-cation of the emission (Stohl, 1996), a maximum can also oc-cur in a region where several of the back trajectories duringthe high-concentration events passed through after passingthe actual source regions.
www.atmos-chem-phys.org/acp/4/1201/ Atmos. Chem. Phys., 4, 1201–1215, 2004

1208 P. Bonasoni et al.: Aerosol-ozone correlations during dust transport episodes
(A)
(B)
(C)
(D)
Fig. 8. Time series of PM10 (black line) and OKZ3 (grey line, see text for definition) concentration measured in the Po valley urban areas:
Parma(A), Modena(B), Ferrara(C) and Cesena(D) from June to December 2000. Coloured bars represent the duration of the dust transportevents as identified at the MTC station.
3.1.2 The Po valley
After Saharan dust plumes have reached MTC, they oftenmove further northward and eastward and eventually reachNorthern Italy, the Alps and central Europe and influence thePM10 aerosol concentrations there. In the Po valley, dur-ing the period of study, several environmental monitoringstations of the “Agenzia Regionale Prevenzione e Ambiente– Emilia Romagna” (ARPA-ER) detected clear increases inthe PM10 concentrations during or shortly after Saharan dustevents at MTC. In fact, after reaching MTC, dust cloudstake some hours to spread over Po valley, and often alsoreach the surface. Daily PM10 concentrations recorded at
the urban stations of Parma (64 m asl), Modena (56 m asl),Cesena (27 m asl) and the rural station of Ferrara (10 m asl)are shown in Fig. 8. For the greater part of the events, theseincreases were significant with respect to the average con-centrations at the 95% level according to Student’s t-test (Ta-ble 2).
The Directive 1999/30/EC of the European Union statesthat the future (from 2010) daily mean PM10 concentrationsmust not exceed 50µg/m3 more often than on 7 days peryear. During the Saharan dust episodes, 12, 19 and 18 daysexceeding the daily PM10 limit were recorded at Parma,Modena and Cesena, while no days exceeding the daily limitwere found at the rural station of Ferrara. This analysis
Atmos. Chem. Phys., 4, 1201–1215, 2004 www.atmos-chem-phys.org/acp/4/1201/
P. Bonasoni et al.: Aerosol-ozone correlations during dust transport episodes 1209
confirms that the contribution of mineral aerosol on the ur-ban PM10 values can be very critical, favouring thresholdexceedances. In order to evaluate the Saharan dust contri-bution on PM10 in the Po valley area during the dust eventsidentified as significant, for each stations we calculated theaverage PM10 increase (1PM10) in respect with the typicalseasonal values calculated by the Kolmogrov-Zurbenko filter(hereinafter KZ). The obtained values, shown as percentageincreases in Table 2, suggest that Saharan dust events couldmodify significantly the PM10 concentrations recorded at ur-ban and rural sites in the Po valley area.
3.2 Ozone analysis and aerosol correlation during dustepisodes
3.2.1 Mt. Cimone
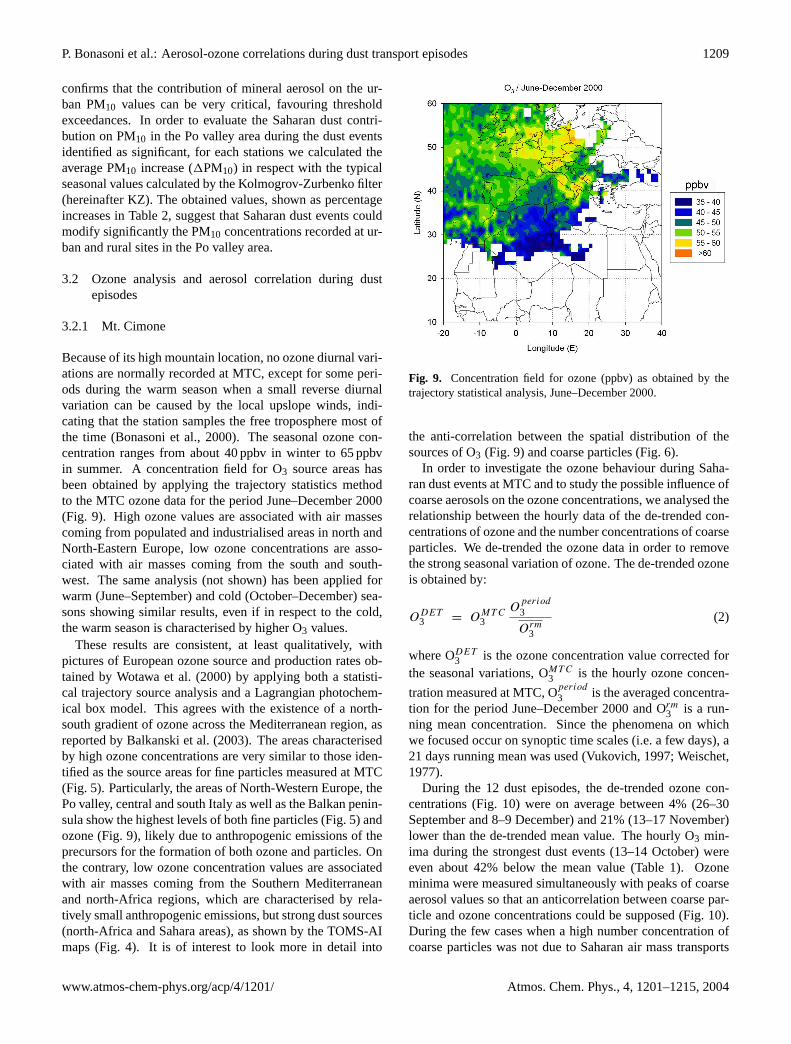
Because of its high mountain location, no ozone diurnal vari-ations are normally recorded at MTC, except for some peri-ods during the warm season when a small reverse diurnalvariation can be caused by the local upslope winds, indi-cating that the station samples the free troposphere most ofthe time (Bonasoni et al., 2000). The seasonal ozone con-centration ranges from about 40 ppbv in winter to 65 ppbvin summer. A concentration field for O3 source areas hasbeen obtained by applying the trajectory statistics methodto the MTC ozone data for the period June–December 2000(Fig. 9). High ozone values are associated with air massescoming from populated and industrialised areas in north andNorth-Eastern Europe, low ozone concentrations are asso-ciated with air masses coming from the south and south-west. The same analysis (not shown) has been applied forwarm (June–September) and cold (October–December) sea-sons showing similar results, even if in respect to the cold,the warm season is characterised by higher O3 values.
These results are consistent, at least qualitatively, withpictures of European ozone source and production rates ob-tained by Wotawa et al. (2000) by applying both a statisti-cal trajectory source analysis and a Lagrangian photochem-ical box model. This agrees with the existence of a north-south gradient of ozone across the Mediterranean region, asreported by Balkanski et al. (2003). The areas characterisedby high ozone concentrations are very similar to those iden-tified as the source areas for fine particles measured at MTC(Fig. 5). Particularly, the areas of North-Western Europe, thePo valley, central and south Italy as well as the Balkan penin-sula show the highest levels of both fine particles (Fig. 5) andozone (Fig. 9), likely due to anthropogenic emissions of theprecursors for the formation of both ozone and particles. Onthe contrary, low ozone concentration values are associatedwith air masses coming from the Southern Mediterraneanand north-Africa regions, which are characterised by rela-tively small anthropogenic emissions, but strong dust sources(north-Africa and Sahara areas), as shown by the TOMS-AImaps (Fig. 4). It is of interest to look more in detail into
Fig. 9. Concentration field for ozone (ppbv) as obtained by thetrajectory statistical analysis, June–December 2000.
the anti-correlation between the spatial distribution of thesources of O3 (Fig. 9) and coarse particles (Fig. 6).
In order to investigate the ozone behaviour during Saha-ran dust events at MTC and to study the possible influence ofcoarse aerosols on the ozone concentrations, we analysed therelationship between the hourly data of the de-trended con-centrations of ozone and the number concentrations of coarseparticles. We de-trended the ozone data in order to removethe strong seasonal variation of ozone. The de-trended ozoneis obtained by:
ODET3 = OMT C
3O
period
3
Orm3
(2)
where ODET3 is the ozone concentration value corrected for
the seasonal variations, OMT C3 is the hourly ozone concen-
tration measured at MTC, Operiod
3 is the averaged concentra-tion for the period June–December 2000 and Orm
3 is a run-ning mean concentration. Since the phenomena on whichwe focused occur on synoptic time scales (i.e. a few days), a21 days running mean was used (Vukovich, 1997; Weischet,1977).
During the 12 dust episodes, the de-trended ozone con-centrations (Fig. 10) were on average between 4% (26–30September and 8–9 December) and 21% (13–17 November)lower than the de-trended mean value. The hourly O3 min-ima during the strongest dust events (13–14 October) wereeven about 42% below the mean value (Table 1). Ozoneminima were measured simultaneously with peaks of coarseaerosol values so that an anticorrelation between coarse par-ticle and ozone concentrations could be supposed (Fig. 10).During the few cases when a high number concentration ofcoarse particles was not due to Saharan air mass transports
www.atmos-chem-phys.org/acp/4/1201/ Atmos. Chem. Phys., 4, 1201–1215, 2004

1210 P. Bonasoni et al.: Aerosol-ozone correlations during dust transport episodes
Table 2. Mean±95% confidence interval for PM10 and O3 measurements in warm (June–September) and cold (October–December) seasonat the ARPA-ER environmental monitoring stations in the Po valley area. Number of significant dust events (see text) for PM10 and O3 amongthose recorded at MTC, together with the average increase and decrease1PM10 and1O3 from their seasonal values are also reported.
PM10 (µg/m3) O3 (µg/m3)Station Warm Cold Significant 1PM10 Warm Cold Significant 1O3
events events
Parma 36±3 59±6 8 36.7% 71±3 10±1 7 −6.2%Modena 50±3 71±7 8 33.5% 51±4 5±1 7 −4.8%Cesena 39±3 55±6 11 21.9% 71±4 15±2 11 −2.7%Ferrara 27±2 21±2 12 19.2% 61±3 16±2 8 −12.8%
Figure 10. Coarse aerosol concentration (black line) and de-trended ozone (grey line) recorded at MTC during the period June-December 2000 (for coarse aerosol: Nov.–Dec. right scale). White circles represent days during which back-trajectories originated from North Africa. Grey bars indicate the periods of the dust transport events. See text for the definition of the de-trented ozone concentration
Fig. 10. Daily coarse aerosol concentration (black line) and daily de-trended ozone (grey line) recorded at MTC during the period June–December 2000 (for coarse aerosol: November–December right scale). White circles represent days during which back-trajectories originatedfrom north Africa. Coloured bars indicate the periods of the dust transport events. See text for the definition of the de-trended ozoneconcentration.
(e.g. an episode on 10 November when the air came from theGulf of Genoa), an ozone increase was recorded.
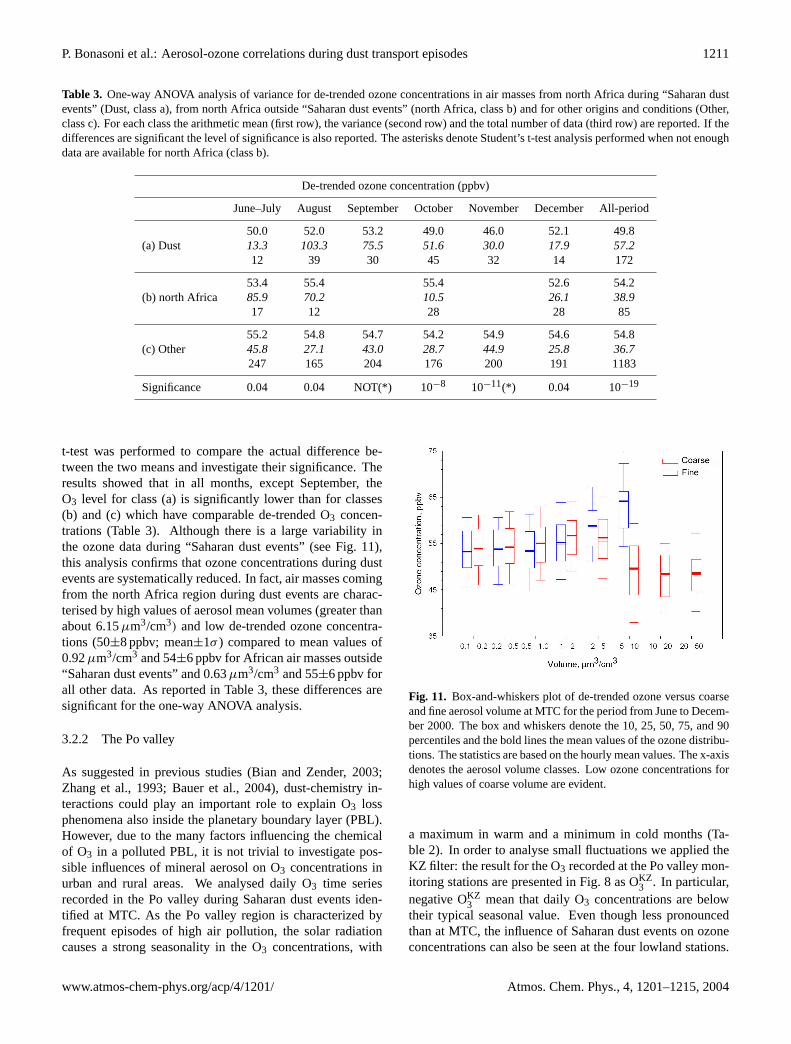
The relationship between the values of the de-trendedozone concentration with the fine and coarse aerosol vol-ume has been analysed using a box-and-whiskers plot. Theboxes and whiskers denote the 10, 25, 50, 75 and 90 per-centiles, and the bold lines the mean values of the ozone dis-tributions for different classes of the fine- and coarse-modeparticle volume concentrations (Fig. 11). The whole distri-bution of the de-trended ozone concentrations shifts towardshigher values with increasing aerosol volume concentrationsof the fine-mode particles. Particularly the highest O3 values,which occur in polluted air masses, are associated to highfine aerosol volume concentrations ranging between 2 and10µm3/cm3. In contrast, Fig. 11 shows the lowest ozonevalues for high values of the coarse-mode aerosol volumeconcentrations which are typical for the intrusions of Saharandust, with the lowest ozone values recorded for coarse-modeaerosol volumes≥5–10µm3/cm3. In fact, the high aerosolvolume classes (>2–5µm3/cm3) occurred only during theSaharan dust events.
To further explore the relation between ozone concen-trations and dust loading, three cases were distinguished,based on coarse-mode particle volume concentrations and
the source region of back trajectories: (a) north African ori-gin during “Saharan dust events”, (b) north African originoutside “Saharan dust events”, (c) all the other data. In or-der to select air masses coming from north Africa, we con-sidered back-trajectories originating from the geographicalbox defined in the paragraph 2.4 and roughly coincident withthe major dust production areas as shown in Fig. 3. Thus,for classes (a) and (b) we analysed mean de-trended ozonevalues calculated for a 3-h period centred around the timeof back-trajectory arrival at MTC. During the period of ourstudy 16% of the calculated back-trajectories were charac-terized by a north African origin, and only 26% of thesewere not accompanied by strong dust transport. On averagethe trajectories coming from North Africa are characterisedby travel altitudes of 2000–2500 m asl. Table 3 shows themean de-trended ozone concentrations for the three classesand different months. Correlation between de-trended ozonedata and air mass characteristics was investigated using one-way ANOVA analysis (Formenti et al., 2001). This testcompares means of 3 or more samples to estimate if themeans can be considered significantly different. Due tothe few cases available for condition (b) in September andNovember, the ozone-averaged values were not calculatedfor this case and ANOVA not applied. Instead, a Student’s
Atmos. Chem. Phys., 4, 1201–1215, 2004 www.atmos-chem-phys.org/acp/4/1201/
P. Bonasoni et al.: Aerosol-ozone correlations during dust transport episodes 1211
Table 3. One-way ANOVA analysis of variance for de-trended ozone concentrations in air masses from north Africa during “Saharan dustevents” (Dust, class a), from north Africa outside “Saharan dust events” (north Africa, class b) and for other origins and conditions (Other,class c). For each class the arithmetic mean (first row), the variance (second row) and the total number of data (third row) are reported. If thedifferences are significant the level of significance is also reported. The asterisks denote Student’s t-test analysis performed when not enoughdata are available for north Africa (class b).
De-trended ozone concentration (ppbv)
June–July August September October November December All-period
50.0 52.0 53.2 49.0 46.0 52.1 49.8(a) Dust 13.3 103.3 75.5 51.6 30.0 17.9 57.2
12 39 30 45 32 14 172
53.4 55.4 55.4 52.6 54.2(b) north Africa 85.9 70.2 10.5 26.1 38.9
17 12 28 28 85
55.2 54.8 54.7 54.2 54.9 54.6 54.8(c) Other 45.8 27.1 43.0 28.7 44.9 25.8 36.7
247 165 204 176 200 191 1183
Significance 0.04 0.04 NOT(*) 10−8 10−11(*) 0.04 10−19
t-test was performed to compare the actual difference be-tween the two means and investigate their significance. Theresults showed that in all months, except September, theO3 level for class (a) is significantly lower than for classes(b) and (c) which have comparable de-trended O3 concen-trations (Table 3). Although there is a large variability inthe ozone data during “Saharan dust events” (see Fig. 11),this analysis confirms that ozone concentrations during dustevents are systematically reduced. In fact, air masses comingfrom the north Africa region during dust events are charac-terised by high values of aerosol mean volumes (greater thanabout 6.15µm3/cm3) and low de-trended ozone concentra-tions (50±8 ppbv; mean±1σ ) compared to mean values of0.92µm3/cm3 and 54±6 ppbv for African air masses outside“Saharan dust events” and 0.63µm3/cm3 and 55±6 ppbv forall other data. As reported in Table 3, these differences aresignificant for the one-way ANOVA analysis.
3.2.2 The Po valley
As suggested in previous studies (Bian and Zender, 2003;Zhang et al., 1993; Bauer et al., 2004), dust-chemistry in-teractions could play an important role to explain O3 lossphenomena also inside the planetary boundary layer (PBL).However, due to the many factors influencing the chemicalof O3 in a polluted PBL, it is not trivial to investigate pos-sible influences of mineral aerosol on O3 concentrations inurban and rural areas. We analysed daily O3 time seriesrecorded in the Po valley during Saharan dust events iden-tified at MTC. As the Po valley region is characterized byfrequent episodes of high air pollution, the solar radiationcauses a strong seasonality in the O3 concentrations, with
Figure 11. Box-and-whiskers plot of de-trended ozone versus coarse and fine aerosol volume at MTC for the period from June to December 2000. The box and whiskers denote the 10, 25, 50, 75, and 90 percentiles and the bold lines the mean values of the ozone distributions. The statistics are based on the hourly mean values. The x-axis denotes the aerosol volume classes. Low ozone concentrations for high values of coarse volume are evident.
Fig. 11. Box-and-whiskers plot of de-trended ozone versus coarseand fine aerosol volume at MTC for the period from June to Decem-ber 2000. The box and whiskers denote the 10, 25, 50, 75, and 90percentiles and the bold lines the mean values of the ozone distribu-tions. The statistics are based on the hourly mean values. The x-axisdenotes the aerosol volume classes. Low ozone concentrations forhigh values of coarse volume are evident.
a maximum in warm and a minimum in cold months (Ta-ble 2). In order to analyse small fluctuations we applied theKZ filter: the result for the O3 recorded at the Po valley mon-itoring stations are presented in Fig. 8 as OKZ
3 . In particular,negative OKZ
3 mean that daily O3 concentrations are belowtheir typical seasonal value. Even though less pronouncedthan at MTC, the influence of Saharan dust events on ozoneconcentrations can also be seen at the four lowland stations.
www.atmos-chem-phys.org/acp/4/1201/ Atmos. Chem. Phys., 4, 1201–1215, 2004

1212 P. Bonasoni et al.: Aerosol-ozone correlations during dust transport episodes
In fact, a statistical analysis showed that during the greaternumber of dust events, significant (at the 95% level accord-ing to Student’s t-test) negative OKZ
3 were recorded (Table 2).By using the same methodology applied to calculate1PM10(Sect. 3.1.2), we evaluated the O3 reduction (1O3) in the Povalley area during Saharan dust events to be significant. Foreach station, the obtained values are shown in Table 2 as per-centage decreases. These preliminary results suggest that airmasses rich in Saharan dust could modify not only O3 con-centrations in a baseline area (Mt. Cimone), but also in urbanand rural sites in the Po valley.
3.3 Discussion
The analysis performed at MTC presented a clear statisti-cal relationship between high dust loadings and low ozoneconcentrations. A similar relationship was also found forurban and rural sites in the Po valley. It is likely that thisstatistical relationship is due to the change of the photoly-sis rates in dust plumes and the heterogeneous destructionof ozone on mineral dust, two mechanisms that several au-thors (Schmitt et al., 1998; Zhang et al., 1994; Dentener etal., 1996; Martin et al., 2002; Bian and Zender, 2003) havesuggested to be important. From our data, the relative role ofthese processes cannot be determined and it cannot be ruledout entirely that this relationship is caused by differences inthe source regions of the air masses and associated differ-ences in their chemical composition. Perhaps the dust-loadenair masses already carried lower ozone concentrations beforethey received the dust injections. However, as the air massesarriving from the same north African source regions with-out strong dust loading had higher ozone concentrations thanthe dust-loaden ones, this is an unlikely scenario. Further-more, Saharan air masses usually travel at altitudes aboveabout 800–700 mb (Sancho et al, 1992; Hamonou et al.,1999) and are very dry (Charlson and Prospero, 1972), asalso seen in vertical profiles of humidity, temperature andozone carried out at the S. Pietro Capofiume WMO station,which is located in the Po valley and close to MTC (Bona-soni et al., 1998). Therefore, ozone destruction by homo-geneous chemical reactions is very slow in these air masses.Thus, our analysis can provide independent confirmation ofthe hypothesis put forward in other studies (Hanisch andCrowley, 2003; Bauer et al., 2004) that significant hetero-geneous ozone destruction can occur on the surfaces of thedust aerosols and that desert aerosols can cause a decreasein photolysis rate throughout the troposphere, having a nega-tive impact on ozone concentration in the lower troposphere(He and Carmichel, 1999; Balis et al., 2000; Dentener et al.,1996).
4 Conclusions
In this paper we have investigated the relationship betweentropospheric ozone and mineral aerosol in the free tropo-sphere of the Northern Mediterranean basin during an ex-perimental campaign performed at the Mt. Cimone baselinestation in the period June–December 2000. Saharan dusttransport episodes, occurring during this period, were identi-fied using three-dimensional backward trajectories, TOMSaerosol index analysis, aerosol size and mass distributionconcentrations. A statistical analysis of the back trajectoriescombined with the ozone, coarse and fine aerosol measure-ments as well as the TOMS aerosol index at the location ofMTC was done. The result of the trajectory statistics areso-called concentration fields of the respective parameters,which indicate their source regions.
The ozone concentration field showed a positive gradientfrom north Africa to Europe, mainly due to the large dif-ferences between the anthropogenic emissions of ozone pre-cursors, which characterise the two continental regions. Infact, the industrialised regions in north-central Europe andnorth-central Italy appear as the main source regions for bothfine particles and surface ozone. Indeed, a significant posi-tive correlation between surface ozone and fine aerosol con-centrations has been found. On the contrary, the Saharandesert is the main source region for coarse particles, clearlysuggesting desert dust as the main contributor to coarse-mode aerosols. Furthermore, we found a strong anticor-relation between the concentrations of coarse particles andozone. When southerly winds transported dust clouds fromnorth Africa to MTC, the concentrations of surface ozone atMTC showed a marked decrease compared to normal free-tropospheric conditions. On the other hand, there was only aslight reduction in the O3 concentrations when air masses ar-riving from the south carried no dust. This suggests that highconcentrations of coarse mineral aerosol in the atmospheremay lead to significant heterogeneous ozone destruction onthe particle surface, thereby affecting the ozone concentra-tions even in areas very far away from the dust mobilizationregions. Nevertheless, it cannot be excluded that absorptionby aerosol played a role in reducing photochemistry, thusproducing a negative impact on ozone concentrations in thelower troposphere.
Finally, the PM10 and ozone measurements carried out inurban and rural areas of the Po valley during the period ofour study, showed that a not negligible influence of Saharandust transport could be present even in a polluted region ofSouthern Europe. In fact, high PM10 concentrations in thePo valley were recorded during the Saharan dust events iden-tified at MTC, leading to several exceedances of the futureEU air quality limits. Moreover, influence of Saharan duston daily O3 concentrations in urban and rural areas is possi-ble. However, because of many uncertainties connected withthese analyses, this should be considered as an exploratorystudy that needs further improvement. In particular, chemical
Atmos. Chem. Phys., 4, 1201–1215, 2004 www.atmos-chem-phys.org/acp/4/1201/

P. Bonasoni et al.: Aerosol-ozone correlations during dust transport episodes 1213
analysis composition of aerosol in urban and rural areas ap-pears as a necessary step to identify unambiguously the pres-ence of mineral dust at the measurement sites.
Acknowledgements.This work was supported by the EuropeanCommission (DG XII) within the framework of the MINATROC(EVK2-1999-00003) and STACCATO (EVK2-1999-00316)projects. We thank the “Ufficio Generale per la Meteorologia” ofthe Italian Air Force and P. Giambi, C. Magera, D. and P. Amidei,F. Nizzi for their support in the Mt. Cimone MINATROC fieldcampaign. TOMS data were provided by NASA/Goddard SpaceFlight Center from their Web site. Images of SeaWiFS-NASAsatellite as well as DREAM (Euro-Mediterranean Centre onInsular Coastal Dynamics – IcoD) and NAAPS (Naval ResearchLaboratory – NRL) analysis were provided by the Naval ResearchLaboratory (Monterey) from their Web site.
Edited by: H. Wernli
References
Andreae, M. O.: Climate effects of changing atmospheric aerosollevels, in World Survey of Climatology, Future Climate of theWorld, Vol. 16, edited by Henderson-Sellers, A., 341–392, Else-vier, Amsterdam, 1995.
Ansmann, A., Bosenberg, J., Chaikovsky, A., Comeron, A., Eck-hardt, S., Eixmann, R., Freudenthaler, V., Ginoux, P., Komguem,L., Linne, H., Marquez, M.A. L., Matthias, V., Mattis, I., Mitev,V., Muller, D., Music, S., Nickovic, S., Pelon, J., Sauvage,L., Sobolewsky, P., Srivastava, M. K., Stohl, A., Torres, O.,Vaughan, G., Wandinger, U., and Wiegner, M.: Long-rangetransport of Saharan dust to northern Europe: The 11–16 Octo-ber 2001 outbreak observed with EARLINET, J. Geophys. Res.,108, 4782, doi:10.1029/2003JD003757, 2003.
Arimoto, R.: Eolian dust and climate: relationships to sources, tro-pospheric chemistry, transport and deposition, Earth-Sci. Rev.,54, 29–42, 2001.
Balkanski, Y., Bauer, S. E., van Dingenen, R., Bonasoni, P.,Schulz, M., Fischer, H., Gobbi, G. P., Hanke, M., Hauglus-taine, D., Putaud, J. P., Stohl, A., and Raes, F.: The Mt Ci-mone, Italy, free tropospheric campaign: principal characteristicsof the gaseous and aerosol composition from European pollution,Mediterranean influences and during African dust events, Atmos.Chem. Phys. Discuss., 3, 1753–1776, 2003.
Balis, D. S., Zerefos, C. S., Kourtidis, K., Bais, F., Hofzumahaus,A., Kraus, R., Schmitt, M., and Gobbi, G. P.: Measurements andmodeling of photolysis rates during the Photochemical Activityand Ultraviolet Radiation (PAUR) II campaign, J. Geophys. Res.,107, D18, 8138, doi:10.1029/2000DJ000136, 2002.
Bauer, S. E., Balkanski, Y., Schulz, M., Hauglustaine, D. A., andDentener, F.: Global modeling of heterogeneous chemistry onmineral aerosol surfaces: Influence on tropospheric ozone chem-istry and comparison to observations, J. Geophys. Res., 109,D02304, doi:10.1029/2003JD003868, 2004.
Bian, H. and Zender, C. S.: Mineral dust and global troposphericchemistry: Relative role of photolysis and heterogeneous uptake,J. Geophys. Res., 108, D21, 4672, doi: 10.1029/2002JD003143,2003.
Bonasoni, P., Colombo, T., Lenaz, R., Giovanelli, G., Evangelisti,F., Ravegnani, F., Santaguida, R., and Tesi, G.: Effect of saharandust transport on ozone and carbon dioxide concentration, Theimpact of african dust across the Mediterranean, EnvironmentalScience and Technology Library, Vol. 11, edited by Guerzoni,S. and Chester, R., 313–322, Kluwer Academic Publishers, TheNetherlands, 1996.
Bonasoni, P., Bonafe, U., Colombo, T., Santaguida, R., Lenaz,R., and Tesi, G.: Effects of Saharan dust transport on tracegases concentration, in Proceedings of XVIII Quadrennial OzoneSymposium-96, edited by Bojkov, R. D. and Visconti, G., 323–326, l’Aquila, Italy, 1998.
Bonasoni, P., Stohl, A., Cristofanelli, P., Calzolari, F., Colombo, T.,and Evangelisti, F.: Background ozone variations at Mt. CimoneStation, Atmos. Environ., 34, 5183–5189, 2000.
Bowman, F. M., Pilinis, C., and Seinfeld, J. H.: Ozone and aerosolproductivity of reactive organics, Atmos. Environ., 29, 579–589,1995.
Charlson, T. N. and Prospero, J. M.: The Large Scale movementof Sahara air outbreaks over the Northern equatorial Atlantic, J.Appl. Meteorol, 11, 283–297, 1972.
Chiapello, I. and Moulin C.: TOMS and METEOSAT satelliterecords of the variability of Saharan dust transport over the At-lantic during the last two decades (1979–1997), Geophys. Res.Lett., 29, 1176, doi:10.1029/2001GL013767, 2002.
D’Almeida, G. A.: A model for Saharan dust transport, J. Clim.Appl. Meteor., 25, 903–916, 1986.
Dentener, F. J. and Crutzen, P.: Reaction of N2O5 on troposphericaerosol: Impact on the global distributions of NOx, O3 and OH,J. Geophys. Res., 98, 7149–7163, 1993.
Dentener, F. J., Carmichael, G. R., Zhang, Y., Lelieveld, J., andCrutzen, P. J.: The role of mineral aerosols as a reactive surfacein the global troposphere, J. Geophys. Res., 101, 22 869–22 889,1996.
Dickerson, R. R., Kondragunta, S., Stenchikov, G., Civerolo, K.L., Doddrige, B. G., and Holben, B. N.: The impact of aerosolson solar ultraviolet radiation and photochemical smog, Science,278, 827–830, 1997.
Fabian, P. and Pruchniewicz, P. G.: Meridional distribution of ozonein the troposphere and its seasonal variations, J. Geophys. Res.,82, 2063–2073, 1977.
Fischer, H., Kormann, R., Klupfel, T., Gurk, C., Konigstedt, R.,Parchatka, U., Muhle, J., Rhee, T. S., Brenninkmeijer, C. A. M.,Bonasoni, P., and Stohl, A.: Ozone production and trace gas cor-relations during the June 2000 MINATROC intensive measure-ment campaign at Mt. Cimone, Atmos. Chem. Phys., 3, 725–738,2003.
Franzen, L. G., Hjelmroos, M., Kaalberg, P., Brostroem-Lunden, E.,Juntto, S., and Savolainen, A. L.: The “Yellow snow” episodeof northern Fennoscandia, March 1991 – A case study of longdistance transport of soil, pollen and stable organic compounds,Atmos. Environ., 28, 3587–3604, 1994.
Formenti, P., Andreae, M. O., Andreae, T. W., Galani, E., Vasaras,A., Zerefos, C., Amiridis, V., Orlovsky, L., Karnieli, A.,Wendisch, M., Wex, H., Holben, B. N., Maenhaut, W., andLelieveld, J.: Aerosol optical proprieties and large-scale trans-port of air masses: Observation at a coastal and a semiarid sitein the eastern Mediterranean during summer 1998, J. Geophys.Res., 106, D9, 9807–9826, 2001.
www.atmos-chem-phys.org/acp/4/1201/ Atmos. Chem. Phys., 4, 1201–1215, 2004

1214 P. Bonasoni et al.: Aerosol-ozone correlations during dust transport episodes
Ganor, E.: The frequency of Saharan dust episodes over Tel Aviv,Israel, Atmos. Environ., 28, 2867–2871, 1994.
Gomes, L., Bergametti, G., Coude-Gaussen, G., and Rognon, P.:Submicron Desert Dusts: A Sandblasting Process, J. Geophys.Res., 95, 13 927–13 935, 1990.
Gusten, H., Heinrich, G., Monnich, E., Sprung, D., Weppner, J., Ra-madan, A. B., Ezz El-Din, M. R. M., Ahmed, D. M., and Hassan,G. K. Y.: On-line measurements of ozone surface fluxes: Part II;Surface-level ozone fluxes onto the Sahara desert, Atmos. Envi-ron., 30, 911–918, 1996.
Hamonou, E., Chazette, P., Balis, D., Dulac, F., Schneider, X.,Galani, E., Ancellet, G., and Papayannis, A.: Characterization ofthe vertical structure of Saharan dust export to the Mediterraneanbasin, J. Geophys. Res., 104, 22 257–22 270, 1999.
Hanisch, K. and Crowley, J. N.: Ozone decomposition on Saha-ran dust: an experimental investigation, Atmos. Chem. Phys., 3,119–130, 2003.
He, S. and Carmichel, G. R.: Sensitivity of photolysis rates andozone production in the troposphere to aerosol properties, J. Geo-phys. Res., 104, D21, 26 307–26 324, 1999.
Hering, A. M., Staehelin, J., Baltensberger, U., Prevot, A. S.H., Kok, G. L., Schillawski, R. D., and Waldvogel, A.: Air-borne measurements of atmospheric aerosol particles and tracegases during photosmog episodes over the Swiss Plateau andthe Southern Pre-Alpine Region, Atmos. Environ, 32, 20, 3381–3392, 1998.
Hogan, T. F. and Rosmond, T. E.: The description of the Navy oper-ational global atmospheric prediction system’s spectral forecastmodel, Mon. Wea. Rev., 119, 1786–1815, 1991.
Hogan, T. F. and Brody, L. R.: Sensitivity studies of the Navy’sglobal forecast model parameterizations and evaluation of im-provements to NOGAPS, Mon. Wea. Rev., 121, 2373–2395,1993.
Kubilay, N., Nickovic, S., Moulin, C., and Dulac, F.: An illustrationof the transport and deposition of mineral dust onto the easternMediterranean, Atmos. Environ, 34, 8, 1293–1303, 2000.
Israelevich, P. L., Levin, Z., Joseph, J. H., and Ganor, E.: DesertAerosol Transport in the Mediterranean Region as Inferred fromthe TOMS Aerosol Index, J. Geophys. Res., 107, D21, 4572,doi:10.1029/2001JD002011, 2002.
McClain, C. R., Cleave, M. L., Feldman, G. C., Gregg, W. W.,Hooker, S. B., and Kuring, N.: Science quality SeaWiFS data forglobal biosphere research, Sea Technol., 39, (9), 10–15, 1998.
Martin, R. V., Jacob, D. J., Logan, J. A., et al.: Interpretation ofTOMS observations of tropical tropospheric ozone with a globalmodel and in situ observation, J. Geophys. Res., 107, D18, 4351,doi: 10.1029/2001JD001480, 2002.
Moulin, C.: Atmospheric transport of African dust over theMediterranean and the Atlantic: satellite climatology from ME-TEOSAT Vis images (1983–1994) and relationship with climate,In French, Ph.D. thesis, Paris University, 246, 1997.
Moulin, C., Lambert, C. E., Dayan, U., Masson, V., Ramonet, M.,Bousquet, P., Lagrand, M., Balkanski, Y. J., Guelle, W., Mar-ticorena, B., Bergametti, G., and Dulac, F.: Satellite climatol-ogy of African dust transport in the Mediterranean atmosphere,J. Geophys. Res, 103, 13 137–13 144, 1998.
Nickovic, S., Kallos, G., Papadopoulos, A., and Kakaliagou, O.: Amodel for prediction of desert dust cycle in the atmosphere, J.Geophys. Res., 106, 18 113–18 130, 2001.
Penner, J. E., Andreae, M., Annegarn, H., Barrie, L., Feichter, J.,Hegg, D., Jayaraman, A., Leaitch, R., Murphy, D., Nganga, J.,and Pitari, G.: Aerosols, their Direct and Indirect Effects, Cli-mate Change 2001: the Scientific basis, Contribution of Work-ing Group 1 to the Third Assessment Report of Intergovernmen-tal Panel on Climate Change, edited by Houghton, J. T., Ding, Y.,Griggs, D. J., Noguer, M., van der Linden, P. J., Dai, X., Maskell,K., and Johnson, C. A., Cambridge Univ. press, Cambridge, UKand New York, NY USA, 881, 2001.
Prospero, J. M.: Long-term measurements of the transport ofAfrican mineral dust to the southeastern United States: impli-cations for regional air quality, J. Geophys. Res, 104, 15 917–15 927, 1999.
Prospero, J. M., Schmitt, R., Cuevas, E., Savoie, D. L., Graustein,W. C., Turekian, K. K., Volz-Thomas, A., Diaz, A., Oltmans, S.J., and Levy II, H.: Temporal variability of summer-time ozoneand aerosol in the free troposphere over the eastern North At-lantic, Geophys. Res. Lett., 22, 21, 2925–2928, 1995.
Prospero, J. M., Ginoux, P., Torres, O., Nicholson, S. E., and Gill,T. E.: Environmental characterization of global sources of at-mospheric soil dust identified with the Nimbus 7 Total OzoneMapping Spectrometer (TOMS) absorbing aerosol product, Rev.Geophys., 40, 1002, doi:10.1029/2000RG000095, 2002.
Raes, F., Van Dingenen, R., Vignati, E., Wilson, J., and Putaud, J.F.: Formation and cycling of aerosol in the global troposphere,Atmos. Environ., 34, 25, 4215–4240, 2000.
de Reus, M., Dentener, F., Thomas, A., Borrmann, S., Stom, J., andLelieveld, J.: Airborne Observations of Dust Aerosol over theNorth Atlantic Ocean During ACE 2: Indications for Heteroge-neous Ozone Destruction, J. Geophys. Res., 105, D12, 15 263–15 276, doi:10.1029/2000JD900164, 2000.
Rodriguez, S., Querol, X., Alastuey, A., Kallos, G., and Kakaliagou,O.: Saharan dust contribution to PM10 and TSP levels in South-ern and Eastern Spain, Atmos. Environ., 34, 25, 4215–4240,2001.
Sancho, P., de la Cruz, J., Diaz, A., Martin, F., Hernandez, E.,Valero, F., and Albarran, B.: A five-years climatology of back-trajectories from the Izana baseline station, Tenerife, Canary Is-lands, Atmos. Environ., 26, 1081–1096, 1992.
Schmitt, R. and Schreiber, B.: Effect of long-range transport on at-mospheric trace constituents at the baseline station Tenerife (Ca-nary Islands), J. Atmos. Chem., 1, 335–351, 1998.
Schutz, L.: Long range transport of desert dust with special empha-sis on the Sahara, Ann. N. Y. Acad. Sci., 338, 15–20, 1980.
Schwikowski, M., Seibert, P., Baltensberger, U., and Gaggeler,H. W.: A study of an outstanding saharan dust event at thehigh-alpine site Jungfraujoch, Switzerland, Atmos. Environ., 29,1829–1842, 1995.
Sebald, L., Treffeisen R., Reimer, E., and Hies, T.: Spectral analysisof air pollutants, Part 2: ozone time series, Atmos. Environ., 34,3503–3509, 2000.
Seibert, P., Kromp-Kolb, H., Baltensberger, U., Jost, D. T., andSchwikowski, M.: Trajectory analysis of high-alpine air pollu-tion data, Air Pollution Modelling and its Application X, editedby Gryning, S. E. and Millian, M. M., 595–596, Plenum Press,New York, 1994.
Sokolik, I. N. and Toon, O. B.: Direct radiative forcing by anthro-pogenic airborne mineral aerosols, Nature, 381, 681–683, 1996.
Stohl, A.: Trajectory statistics – A new method to establish source-
Atmos. Chem. Phys., 4, 1201–1215, 2004 www.atmos-chem-phys.org/acp/4/1201/

P. Bonasoni et al.: Aerosol-ozone correlations during dust transport episodes 1215
receptor relationship of air pollutants and its application to thetransport of particulate sulfate in Europe, Atmos. Environ., 30,579–587, 1996.
Stohl, A.: Computation, accuracy and applications of trajectories –a review and bibliography, Atmos. Environ., 32, 947–966, 1998.
Stohl, A., Wotawa, G., Seibert, P., and Kromp-Kolb, H.: Interpo-lation errors in wind fields as a function of spatial and temporalresolution and their impact on different types of kinematic tra-jectories, J. Appl. Meteorol., 34, 2149–2165, 1995.
Torres, O., Bhartia, P. K., Herman, J. R., Ahmad, Z., and Gleason,K.: Derivation of aerosol properties from satellite measurementsof backscattered ultraviolet radiation: theoretical basis, J. Geo-phys. Res., 103, 17 099–17 110, 1998.
Torres, O., Bhartia, P. K., Herman, J. R., Sinyuk, A., Ginoux, P.,and Holben, B.: A long-term record of aerosol optical depthfrom TOMS observation and comparison to AERONET mea-surements, J. Atmos. Sci., 59, 398–413, 2002.
Van Dingenen, R., Putaud, J. P., Roselli, D., Dell’Acqua, A., Per-rone, M. G., Bonasoni, P., and Facchini, M. C.: Aerosol proper-ties at Monte Cimone (Italy) during and outside a saharan Dusttransport event, A changing atmosphere, Proceedings of the 8th
European Symposium on the Physico-Chemical behaviour of At-mospheric Pollutants, edited by Hjorth, J., Raes, F., and An-geletti, G., Torino, Italy, 2001.
Vukovich, F. M.: Time scale of surface ozone variations in the re-gional non-urban environment, Atmos. Environ., 31, 1513–1530,1997.
Weischet, W.: Introduction to General Climatology: Physical andMeteorological Basics, Vol. 1, Teubert Verlag, Stuttgart, 1977.
Wotawa, G. and Kroger, H.: Testing the ability of trajectory statis-tics to reproduce emission inventories of air pollutants in casesof negligible measurement and transport errors, Atmos. Environ.,33, 3037–3043, 1999.
Wotawa, G., Kroger, H., and Stohl, A.: Horizontal ozone transportstowards the Alps – results from trajectory analyses and photo-chemical model studies, Atmos. Environ., 34, 1367–1377, 2000.
Zhang, Y., Sunwoo, Y., Kotamarthi, V., and Carmichael, G. R.: Pho-tochemical oxidant pro-processes in the presence of dust: Anevaluation of the impact of dust on particulate nitrate and pro-cesses ozone formation, J. Appl. Met., 33, 813–824, 1994.
Zurbenko, I. G.: The spectral analysis of time series, North-Holland, Amsterdam, 1986.
www.atmos-chem-phys.org/acp/4/1201/ Atmos. Chem. Phys., 4, 1201–1215, 2004