Embed Size (px)
Citation preview
Atmospheric Environment 38 (2004) 1313–1323
ARTICLE IN PRESS
AE International – Asia
*Correspond
E-mail addr
1352-2310/$ - se
doi:10.1016/j.at
Aerosol optical depth during episodes of Asian dust stormsand biomass burning at Kwangju, South Korea
K.O. Ogunjobi*, Z. He, K.W. Kim, Y.J. Kim
Advanced Environmental Monitoring Research Center (ADMRC), Department of Environmental Science and Engineering,
Kwangju Institute of Science and Technology, No. 1, Oryong-Dong, Buk-Ku, Kwangju 500-712, South Korea
Received 18 June 2003; received in revised form 18 November 2003; accepted 27 November 2003
Abstract
Spectral daily aerosol optical depths (tal) estimated from a multi-filter radiometer over Kwangju were analyzed from
January 1999 to August 2001 (total of 277 days). Optical depths obtained showed a pronounced temporal trend, with
maximum dust loading observed during spring time and biomass burning aerosol in early summer and autumn of each
year. Result indicates that ta501 nm increased from spring average of 0.4570.02 to values >0.7 on 7 April 2000, and 13April 2001. Daily mean spectral variations in the (Angstr .om exponents a were also computed for various episode periodsunder consideration. A dramatic change in a value is noted especially at high aerosol optical depth when coarse modeaerosol dominates over the influence of accumulation-mode aerosol. High values of tal associated with high values of ain early June and October are characteristics of smoke aerosol predominantly from biomass burning aerosol. Also,
volume size distribution is investigated for different pollution episodes with result indicating that the peak in the
distribution of the coarse mode volume radius and fine mode particles of dust and biomass-burning aerosol respectively
increases as aerosol optical depth increases at Kwangju. Air-mass trajectory were developed on 7–8 April and 19–20
October, 2000 to explain the transport of Asian dust particle and biomass burning to Kwangju.
r 2003 Elsevier Ltd. All rights reserved.
Keywords: Yellow sand; Visibility; Aerosol optical depths; Trajectory; Volume size distribution
1. Introduction
Troposphere aerosol optical depth (AOD) is an
important parameter for studying atmospheric pollution
visibility degradation, aerosol radiation–climate effects,
and atmospheric corrections in remote sensing among
others. The passive spectral extinction method has
proofed to be one of the most reliable methods for the
measurements of aerosol optical depth (Qiu, 1998). The
extinction method uses a sun-photometer to detect
narrowband direct solar radiation and then estimate
atmospheric tal from the irradiance measurements
(King et al., 1978; Vaughan et al., 2001). This paper
has employed similar method to determine aerosol
ing author.
ess: [email protected] (K.O. Ogunjobi).
e front matter r 2003 Elsevier Ltd. All rights reserve
mosenv.2003.11.031
optical depth from total direct solar irradiance measure-
ments taken by a multi-filter radiometer (MFR-7).
Dust storms from inland China causes seasonal
peaks in dust pollution over Korea peninsula and the
rest of Northeast Asia region. Each year Asian dust
storms (often called yellow sand) is transported to
Korea from March to April (Chung and Yoon, 1996).
Dust storms in deserts of Asia also tend to cause major
aerosol events well beyond the Asian continents to as far
as the eastern shores of USA (Mizohata and Mamuro,
1978; Iwasaka et al., 1983; Husar et al., 2001; Choi et al.,
2001).
The importance of the aerosol optical depths,
Angstrom parameters and the size distribution functions
in atmospheric and remote sensing studies point out the
need for extensive measurements and analysis of spectral
optical depths and turbidity parameters at as many
d.

ARTICLE IN PRESSK.O. Ogunjobi et al. / Atmospheric Environment 38 (2004) 1313–13231314
locations on the globe as possible. The observation
of dust properties is complicated by the occurrence
of different types of aerosol composition in the
atmosphere. However, it is convenient to study dust
storms during major dust outbreaks and when one
can safely assume that the observed radiative effects
are caused mainly by the dust aerosol component.
This paper presents observation made during out-
breaks of major Asian dust plume and biomass burn-
ing observed in Kwangju, South Korea, reducing
visibility, relative humidity, solar radiation and tem-
perature along its path. Day-to-day variations of
aerosol optical depth, particle size distribution, and
other aerosol optical properties will be presented for
the dust and biomass burning episode events of
1999–2001.
2. Study site
The solar radiation measurement station is located on
the rooftop of the tallest building at the Kwangju
Institute of Science and Technology (K-JIST) campus.
Kwangju, (Lat.35.13N, Long.126.53E) is a metropolitan
city surrounded by high mountains with an altitude of
50m above sea level. The city is characterized by high
population density of B1.4 million with limited
industries but predominant agricultural activities and
high fossil fuel combustion.
Climatologically, the annual amount of precipitation
in this study area is about 1350mm, and half of this
amount occurs in the warm summer season, especially in
June and July. Korea is located in the mid-latitude and
westerlies dominate almost all the year except July and
August when the warm maritime air from the Pacific
plays a predominant role in the Peninsula. However,
with the westerlies, the Korean Peninsula is in the down
wind side of China for almost 10 months. Asian dust
rising from the dust storms that occur in the arid
regions at high altitudes in China and Mongolia is
easily delivered into the free troposphere and travels a
long distance to the Korea peninsular during spring
by the Westerlies (Chung and Yoon, 1996; Luo et al.,
2001).
Synoptically, the year can be subdivided into four
seasons: (1) winter (December–February) is usually very
cool and dry; (2) Spring (March–May) which is
characterized by the transfer of aerosols with down-
stream wind from north-east China impact severe
changes on the environment and its climate; (3) Summer
(June–August), high and transparent cloud prevails with
high solar irradiance while some days are wet with
varying forms and intensity of cloudiness; (4) Autumn
(September–November) often associated with moder-
ately transparent skies with morning mist, high relative
humidity and high biomass burning.
3. Methodology
3.1. Radiation measurements and calibration
A multi-filter rotating shadow-band radiometer
(MFRSR) has been used to measure direct-normal,
total-horizontal and diffuse-horizontal irradiance at
Kwangju, South Korea from January 1999–present
date. However due to difficulty of maintaining yearlong
measurement there have been cases of missing data for
some days during the period of measurements.
The multi-filter rotating shadow-band radiometer uses
an independent interference filter photodiode detector
and an automated rotating shadow-band technique to
make spectral measurement at seven different wave-
length with a nominal 10-nm FWHM bandwidth
(chosen at 416, 515, 616, 675, 870 and 940 nm and a
broadband channel). The instrument has been tested to
achieve accuracy in direct-normal spectral irradiance
comparable with that of tracking radiometers. All
measurements were made at every 15 s and stored at
every 1-min average in a data logger. Calibration of the
instrument is carried out regularly (every 6 months) in
addition to factory calibration at the Yankee calibration
chamber. The calibration procedure employed every 6
months is the inter-calibration method, obtained by
using an instrument calibrated previously by the
Langley method (Harrison et al., 1994) at Yankee
Environmental Systems Incorporated, MA, USA.
3.2. Determination of total and aerosol optical depths
The atmospheric total optical depth is determined for
each cloud-free day through the Langley analysis, which
is based on the Lambert–Beer’s law describing attenua-
tion of light passing through a plane parallel layer of
material with non-zero extinction coefficient (Iqbal,
1983)
Il ¼ Ilo exp ðmrtlÞ; ð1Þ
where Il represents the spectral irradiance (wm�2 nm),
Ilo is the extraterrestrial radiation at the top of the
atmosphere, mr is the air mass number, tl is the totalspectral optical depth comprising of the optical depths
caused by Rayleigh scattering trl, and atmospheric
absorptions of gases such as ozone, to3l. Langleyanalysis provides a means of estimating the total optical
thickness, as the negative slope of the regression of the
logarithm of irradiance Il, against air mass (Vaughan
et al., 2001; Kasten and Young, 1989). The intercept is
the logarithm of Ilo which provides an estimate of the
extraterrestrial radiation.
ln ðIlÞ ¼ tlmr þ lnðIloÞ: ð2Þ
Once the total optical depths (tl) have been computed,one can determine corresponding values of tal by

ARTICLE IN PRESS
Jan Mar Jul Sep Nov --
0.5
0.6
0.7
mon
thly
ave
rage
aer
osol
opt
ical
dep
thmonths of year
416nm 501nm 616nm 672nm 870nm
0.4
0.3
0.2
0.1May
Fig. 1. Spectral monthly average of aerosol optical depth at
Kwangju, from January 1999–August 2001.
K.O. Ogunjobi et al. / Atmospheric Environment 38 (2004) 1313–1323 1315
subtracting from tl the contributions due to molecularscattering trl, the contribution of the ozone Chappiusabsorption band to3l, known as the ozone optical depth.
3.3. Determination of (Angstr .om turbidity parameter
The spectral dependence of aerosol optical depth is
typically approximated using (Angstr .om’s formula that
proposed that extinction of solar radiation by aerosols is
a continuous function of wavelength, without selective
bands or lines for scattering or absorption. Thus the(Angstr .om turbidity formula is given as
tal ¼ bl�a; ð3Þ
where, along with the symbols described previously, b, isa turbidity coefficient and a is the wavelength coefficient( (Angstr .om, 1961). Cacharro et al. (2000), showed that(Angstr .om formula provides a good spectral representa-
tion of atmospheric aerosol attenuation. From Eq. 3, bknown to vary from 0 to 0.5 or even higher, is an index
representing the amount of aerosols present in the
atmosphere in the vertical direction. The a parametercharacterizes the spectral features of the aerosols and it
relates to the size of the particles (Shifrin, 1995). Large
values of a indicate a relatively high ratio of small
particles to large particles. It is expected that when the
aerosol particles are very small of the order of air
molecules, a should approach 4 and it should approach0 for very large particles (Holben et al., 2001; Pinker
et al., 2001).
4. Results and discussion
4.1. Optical properties of dust aerosol
The monthly averages of aerosol optical depths
estimated at different wavelengths during the course of
a cloud-free day is plotted in Fig. 1. The standard error
of the mean aerosol optical depth represented by the
vertical bar over each month is a measure of the scatter
of individual optical depths that have been used to
obtain the monthly averages. The plot shows significant
month-to-month variation in aerosol optical depth and
its dependence on wavelength. The monthly means
aerosol optical depth at 416, 501, 616, 672, and 870 nm
indicate maximum value during the spring and mini-
mum during winter. Similar pattern of seasonal varia-
tion of tal has been reported by Qiu (1998) and Luoet al., (2001) for other sites in Northeast Asia. The
seasonal peak in spring may be attributed to the long-
range transport of primarily Asian aerosol dust to
Korea. The increase in tal at all wavelengths during themonths of October is largely due to biomass burning
activities prominent around the site during this period
(Park et al., 2002). It is also interesting to note a decrease
in tal from June to September due to the dust-free clean
air condition by cloud scavenging and wet removal
processes during summer and early fall at Kwangju.
However, cases of tal>0.3 during June–September maybe attributed to biomass burning in early summer or
other anthropogenic pollution. The minimum aerosol
optical depth recorded during winter months of
December and January at this site and other locations
in North East Asia may be due to the weak generation
mechanisms and also the remote chance of hygroscopic
growth of aerosol due to less water vapor content
present during the winter season. Also evident from
Fig. 1 is that the aerosol optical depth decreases as
wavelength increases. Thus, annual average aerosol
optical depth for the whole period of observations
increases from 0.2170.11 to 0.4070.15 at 870–416 nmwavelengths, respectively.
The derived daily aerosol optical depth at 501 nm and
the (Angstr .om wavelength exponential a for 501 and
870 nm are shown in Figs. 2 and 3 for the whole period
of measurements. The daily average values of ta501 nmshow large day-to-day variations. The annual pattern
with an increase to maximum turbidity in the spring
period (March–May) is apparent in all years. Also
indicated are periods with Asian dust outbreaks, and the
biomass burning periods in October of each year and
occasionally in June. These observation also indicated
that the optical depth at Kwangju rarely exceed 0.6
except during the indicated Asian dust days. The June–
September minimum is also in evidence and daily
averages of ta501 nm drops below 0.1 on a few occasions

ARTICLE IN PRESS
0 50 100 150 200 250 300 350
0 2 150 175 200 225 250 275 300 325 3500.0
0.2
0.4
0.6
0.8
1.0
0
Julian days
2001
Dust storm episode 1999Biomassburning
Aer
osol
opt
ical
dep
th (
500n
m)
0.0
0.2
0.4
0.6
0.8
1.0
0.0
0.2
0.4
0.6
0.8
1.0
Dust storm episode
Dust storm episode
2000
Biomassburning
Fig. 2. Daily aerosol optical depth for l=501nm at Kwangju for cloud-free days during the period of January 1999–August 2001.
K.O. Ogunjobi et al. / Atmospheric Environment 38 (2004) 1313–13231316
in this period. Dusty conditions prevailed starting from
March and tal remains high until the end of the May.The seasonal average values of ta501 nm for the whole
period of measurements are 0.2670.05, 0.417 0.02,
0.3370.03 and 0.3170.04 in winter, spring, summer,and fall, respectively. Computed daily maximum values
of ta501 nm yield 0.76, 0.75 and 0.71 during the Asian duststorm episodes of 29-March-1999, 27-March-2000 and
13-April-2001, respectively.
One interesting features to note from Figs. 2 and 3 is
the inverse dependence of the aerosol optical depth and
the (Angstr .om wavelength exponent. For example on
7 April 2000, and 13 April 2001, ta501 nm increased fromthe spring average of 0.4570.02 to values >0.7 as themean a shows a dramatic change fromB1.05 on 6 April2000 to 0.37 on 7 April 2000, and also from 1.16 on
4 April 2001 to 0.35 on 13 April 2001. Similar trend of
changes was equally noted from 21 April 2001 to 24–25
April 2001. This indicates a strong contribution to the
extinction from large dust particle during these major
dust days. The (Angstr .om exponent also varies from 0.6
to 2.7 for small aerosol optical depth from June–
September and October–January, typical of urban
(including local) air pollution and biomass burning
aerosol. This relationship is in good agreement with the
result of desert dust spectral optical thickness and(Angstr .om wavelength exponent over Alexandria, Egypt
reported by Sabbah et al. (2001). Other similar works
include Pinker et al. (2001), which reported similar trend
during ‘‘Harmattan dust Haze’’ at Ilorin, Nigeria and
Holben et al. (2001) at Banizoumbou, Niger. High daily
averages of a from September to February reflect the
presence of a significant fraction of fine particles in the
aerosol size distribution. The origin, which may be from
local anthropogenic pollutants.
Approximately 26% of the daily average a values areless than 0.5, indicating that less fine particles dom-
inates. Less than 8% of the observations exceed 1.6 that
would likely be caused from dominance of accumulation
mode aerosol emission generated by biomass burning

ARTICLE IN PRESS
0 50 100 150 200 250 300 3500.0
0.5
1.0
1.5
2.0
2.5
3.0
Ang
stro
m w
avel
engh
t exp
onen
t
2000
1999
Julian days
2001
0.0
0.5
1.0
1.5
2.0
2.5
3.0
0.0
0.5
1.0
1.5
2.0
2.5
3.0
Fig. 3. Same as Fig. 2 but measurements are for mean daily
values of (Angstr.om wavelength exponent.
0 50 100 150 200 250 300 3500
50
100
150
200
0
50
100
150
200
Biomass- burningBiomass-burning
Dust episode 2001
Julian day
PM
10 (
µg /
m3 )
0
50
100
150
200
Biomass- burning
Dust episode2000
Biomass- burning1999
Biomass- burning
Fig. 4. Mean daily values of PM10 at Kwangju during 1999,
2000 and 2001.
0.00.0
0.5
1.0
1.5
2.0
2.5
3.0
3.5
4.0
n=277 clear daysLocal antropogenic pollution
Biomass Burning aerosol
Dust aerosol
Ang
stro
m p
aram
eter
α
aerosol optical depth (501nm)
0.2 0.4 0.6 0.8 1.0
Fig. 5. Scatter grams of (Angstr .om parameter versus aerosol
optical depth.
K.O. Ogunjobi et al. / Atmospheric Environment 38 (2004) 1313–1323 1317
during fall season. Low values of a during the Asiandust storm period of March to May indicate that the
prevailing aerosol types is clearly dust particles. Large
values of tal associated with high values of a in Octoberare typical characteristics of smoke aerosol predomi-
nantly from biomass burning aerosol. Comparison of ameasurements for forest smoke in Canada (Markham
et al., 1997), Mongu, Zambia and Cuiaba, Brazil
(Holben et al., 2001), show great similarity but of
somewhat higher values than that of Kwangju possibly
due to mixture of other aerosol types that has been
advected from moderate distance with the smoke.
Fig. 4 shows the daily averages of PM10 mass
concentration, at Kwangju during June 1999–December
2001. It shows high PM10 mass concentration during the
major springtime dust storm episodes of 2000 and 2001
and during evident of biomass burning in June 2000 and
2001 and October 1999, 2000 and 2001, respectively.
PM10 increased from springtime average of 50.9723.4mg/m3 and 55.6730.2mg/m3 to 84.3 and 98.9mg/m3 during Asian dust storm episodes of 7 April 2000 and
13 April 2001. It also increases from annual average of
44.2723.9mg/m3 to as high as 134.9mg/m3 on 4 June2001 when biomass burning was reported at this site.
Fig. 5 illustrates the scatter gram of daily averages
ta501 nm with a during the whole period of measurementsrepresenting 277 clear days. It shows a weak trend of
decreasing values of a as ta501 nm increases. This may bethe result of some of the highest observations of the
transport of Asian dust to Kwangju composed of course
mode size particles. Some of the values of a >0.5 atAOD > 0.45, shown in Fig. 5 are values from the Asian
dust period when there is a higher than normal level of
transport of dust aerosol to Kwangju. These episodes of

ARTICLE IN PRESSK.O. Ogunjobi et al. / Atmospheric Environment 38 (2004) 1313–13231318
relatively high values of a at higher values ta501 nm maybe attributed to biomass burning or possibly mixed
industrial and dust pollution. Lower values of ta501 nm athigh a(a>2.0) suggest transport of industrial pollution.The values of a ranged from 0.01 to 2.78 with yearly
average value of 0.8270.46. In comparison, Holben
et al. (2001) computed a value of 0.75 at Ilorin, a sub-Sahel station yearly influenced by the Saharan dust
while Sabbah et al. (2001), observed that a varies from 1
to 2 for urban air pollution and near zero for heavy dust
at Alexandria, Egypt.
The measured wavelength dependence of dust and
biomass burning optical depths is shown in Fig. 6. A
linear regression fit is applied to the measurements. In
this figure, the ta501 nm exhibit different optical char-
acteristics. The wavelength dependence of the atmo-
spheric aerosol in the month of April (Asian dust) for
instance, differs significantly from those of October
when biomass burning is predominant. A distinct
feature of Fig. 6 is the pronounced curvature in the ln
ta and ln l for Asian dust days when coarse mode
aerosols are present in an appreciable amount. However
a weak curvature with a steeply slope is noted for
biomass burning days. The positive curvature observed
during the Asian dust period is similar to that reported
for Dalanzadgad, Mongolia by Eck et al. (1999).
1.0
0.8
0.6
0.4
0.2
0.6
0.4
0.2500
Linear fit (All WLs)7 Apr = 0.698 Apr = 0.499 Apr = 0.38
7 April 2000 8 April 2000 9 April 2000
2nd
order polynomial linear fit
900
7 Apr α(501-870nm) = 0.56
Asian Dust days
800700600400300
Biomass burning days
aero
sol o
ptic
al d
epth
wavelength ( nm )
8 October 2000 19 October 2000 20 October 2000 Linear fit
2nd
order polynomial
8 Apr α(501-870nm) = 0.319 Apr α(501-870nm) = 0.29
Linear fit (All WLs)7 Oct = 1.168 Oct = 1.329 Oct = 1.11
8 Oct α (501-870nm) = 1.2319 Oct α (501-870nm) = 1.3020 Oct α (501-870nm) = 1.05
Fig. 6. Wavelength dependence of aerosol optical depth for
selected major dust and biomass burning days during 2000. The
linear fits and the second-order polynomial fit of ln ta versus ln lto the measurements are also shown. The uncertainty in is also
indicated as error bars.
Attempt was made to characterize various pollution
levels at Kwangju in relation to the aerosol optical depth
(ta501 nm), (Angstr .om parameter a, visibility (VR), Finemode particle, coarse mode particles and other chemical
properties (Table 1). Routine aerosol monitoring was
carried out to collect aerosol samples using two
samplers; a versatile air pollutant sampler URG-VAPS
(model 2000J) with three filter packs and a Wide Inlet
Sequential air sampler (WINS, R&P Partisol-Plus
Model 2025) with one filter pack. Two arms of the
URG-VAPS collect both fine particles with aerody-
namic diameter p2.5 mm on nylon (Nylasorb) and a
quartz filter, and coarse particles with aerodynamic
diameter up to 10 mm on a polycarbonate (Nuclepore)
filter. Detailed chemical analysis and visibility impair-
ment of the various pollution levels during Asia dust
storm at Kwangju has been reported in detailed in an
earlier work of Kim et al. (2001). On a relatively clean
day of 26 October 2000 (Kim et al., 2001), with values of
visibility, fine and coarse mode of dust particles equal
38.4 km, 6.3 and 11.7 mg/m3, respectively, and computedta501 nm was observed to yield 0.09. Cases with
ta501 nmp0.1 were therefore classified as clean condi-
tions. During the springtime Asia dust period of 1999–
2001 at Kwangju (see Table 1), visibility reduces to as
low as 3.472.7 km with an increase in average ta501 nm toB0.5770.13. For cases with ta501 nm>0.1, furtherclassification was based on the values a, visibility, sulfateand organic carbon (OC), being categorized as dust for
ao 0.35 and biomass burning for a> 0.90, and OC
>16 mg/m3. Sulfate and coarse mode of dust yield
maximum values of 126.17104.5 and 11.673.9mg/m3
due to the mixture of locally generated pollution and
dust in Northeastern China advecting into Kwangju
during the Asian dust storm episode. Hazy/urban
pollution days are categorized as cases with high avalues (a=1.7070.27) with average elemental carbonand Nitrate particle in the atmosphere 4.373.1 and6.272.8mg/m3, respectively.
4.2. Air-mass back trajectories and size distribution
analysis
To fully explain the trends shown by the aerosol
optical depth during the Asian dust storm and biomass
burning periods in this study, the air-mass flow patterns
were utilized. This involved the analysis of the 5-day air-
mass back trajectory developed from meteorological
data provided by the National Center for Environ-
mental Prediction (NCEP). We have limited the analysis
to 2 major dust outbreak days, 7–8 April 2000 and
2 biomass-burning period of 19–20 October 2000 as
shown in Fig. 7. For each of the selected days, the back
trajectories were generated at 200, 1000 and 2000m,
respectively. The trajectory arrival time for all the days
was set at 1800 h (LST). The trajectories were examined
ARTICLE IN PRESS
Table 1
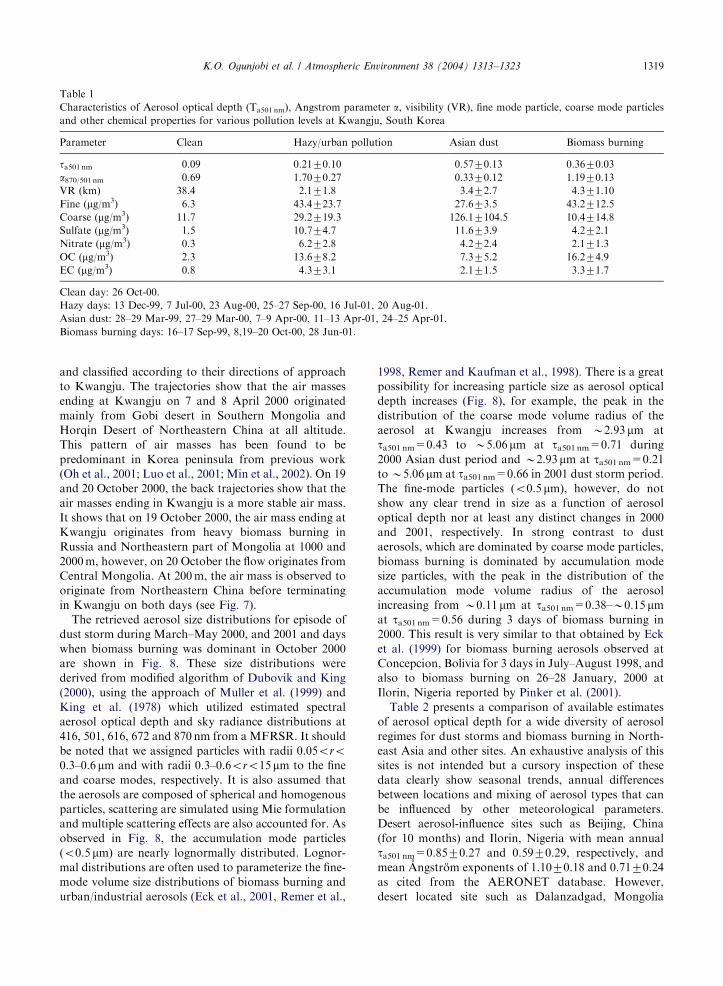
Characteristics of Aerosol optical depth (Ta501 nm), Angstrom parameter a, visibility (VR), fine mode particle, coarse mode particlesand other chemical properties for various pollution levels at Kwangju, South Korea
Parameter Clean Hazy/urban pollution Asian dust Biomass burning
ta501 nm 0.09 0.2170.10 0.5770.13 0.3670.03a870/501 nm 0.69 1.7070.27 0.3370.12 1.1970.13VR (km) 38.4 2.171.8 3.472.7 4.371.10Fine (mg/m3) 6.3 43.4723.7 27.673.5 43.2712.5Coarse (mg/m3) 11.7 29.2719.3 126.17104.5 10.4714.8Sulfate (mg/m3) 1.5 10.774.7 11.673.9 4.272.1Nitrate (mg/m3) 0.3 6.272.8 4.272.4 2.171.3OC (mg/m3) 2.3 13.678.2 7.375.2 16.274.9EC (mg/m3) 0.8 4.373.1 2.171.5 3.371.7
Clean day: 26 Oct-00.
Hazy days: 13 Dec-99, 7 Jul-00, 23 Aug-00, 25–27 Sep-00, 16 Jul-01, 20 Aug-01.
Asian dust: 28–29 Mar-99, 27–29 Mar-00, 7–9 Apr-00, 11–13 Apr-01, 24–25 Apr-01.
Biomass burning days: 16–17 Sep-99, 8,19–20 Oct-00, 28 Jun-01.
K.O. Ogunjobi et al. / Atmospheric Environment 38 (2004) 1313–1323 1319
and classified according to their directions of approach
to Kwangju. The trajectories show that the air masses
ending at Kwangju on 7 and 8 April 2000 originated
mainly from Gobi desert in Southern Mongolia and
Horqin Desert of Northeastern China at all altitude.
This pattern of air masses has been found to be
predominant in Korea peninsula from previous work
(Oh et al., 2001; Luo et al., 2001; Min et al., 2002). On 19
and 20 October 2000, the back trajectories show that the
air masses ending in Kwangju is a more stable air mass.
It shows that on 19 October 2000, the air mass ending at
Kwangju originates from heavy biomass burning in
Russia and Northeastern part of Mongolia at 1000 and
2000m, however, on 20 October the flow originates from
Central Mongolia. At 200m, the air mass is observed to
originate from Northeastern China before terminating
in Kwangju on both days (see Fig. 7).
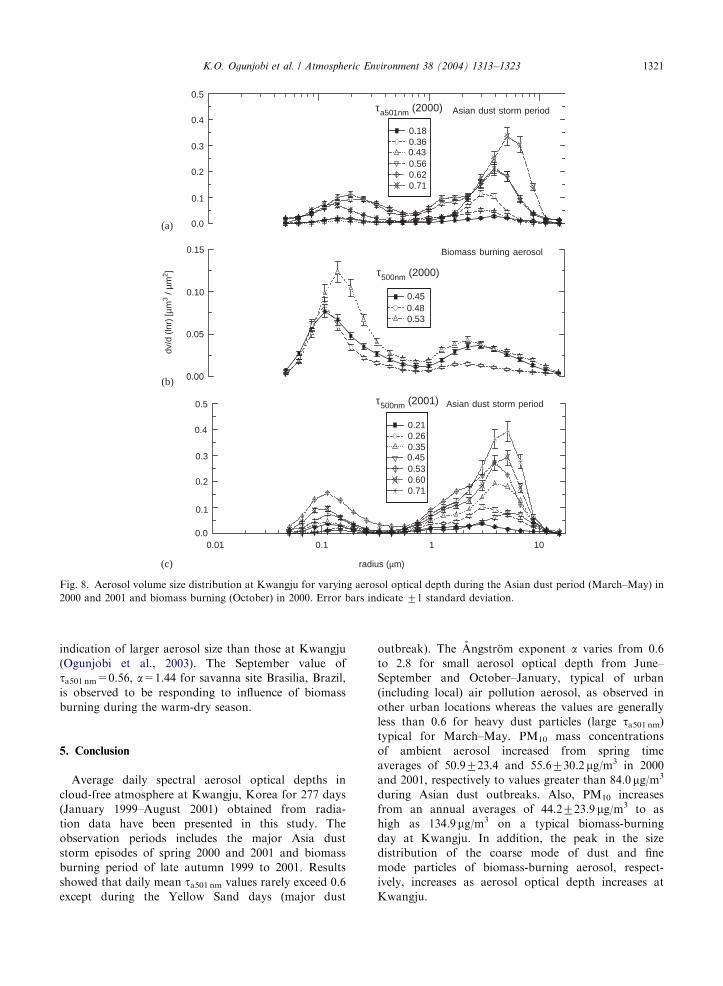
The retrieved aerosol size distributions for episode of
dust storm during March–May 2000, and 2001 and days
when biomass burning was dominant in October 2000
are shown in Fig. 8. These size distributions were
derived from modified algorithm of Dubovik and King
(2000), using the approach of Muller et al. (1999) and
King et al. (1978) which utilized estimated spectral
aerosol optical depth and sky radiance distributions at
416, 501, 616, 672 and 870 nm from aMFRSR. It should
be noted that we assigned particles with radii 0.05oro0.3–0.6 mm and with radii 0.3–0.6oro15mm to the fine
and coarse modes, respectively. It is also assumed that
the aerosols are composed of spherical and homogenous
particles, scattering are simulated using Mie formulation
and multiple scattering effects are also accounted for. As
observed in Fig. 8, the accumulation mode particles
(o0.5 mm) are nearly lognormally distributed. Lognor-mal distributions are often used to parameterize the fine-
mode volume size distributions of biomass burning and
urban/industrial aerosols (Eck et al., 2001, Remer et al.,
1998, Remer and Kaufman et al., 1998). There is a great
possibility for increasing particle size as aerosol optical
depth increases (Fig. 8), for example, the peak in the
distribution of the coarse mode volume radius of the
aerosol at Kwangju increases from B2.93mm at
ta501 nm=0.43 to B5.06mm at ta501 nm=0.71 during
2000 Asian dust period and B2.93mm at ta501 nm=0.21toB5.06 mm at ta501 nm=0.66 in 2001 dust storm period.The fine-mode particles (o0.5mm), however, do not
show any clear trend in size as a function of aerosol
optical depth nor at least any distinct changes in 2000
and 2001, respectively. In strong contrast to dust
aerosols, which are dominated by coarse mode particles,
biomass burning is dominated by accumulation mode
size particles, with the peak in the distribution of the
accumulation mode volume radius of the aerosol
increasing from B0.11mm at ta501 nm=0.38–B0.15 mmat ta501 nm=0.56 during 3 days of biomass burning in2000. This result is very similar to that obtained by Eck
et al. (1999) for biomass burning aerosols observed at
Concepcion, Bolivia for 3 days in July–August 1998, and
also to biomass burning on 26–28 January, 2000 at
Ilorin, Nigeria reported by Pinker et al. (2001).
Table 2 presents a comparison of available estimates
of aerosol optical depth for a wide diversity of aerosol
regimes for dust storms and biomass burning in North-
east Asia and other sites. An exhaustive analysis of this
sites is not intended but a cursory inspection of these
data clearly show seasonal trends, annual differences
between locations and mixing of aerosol types that can
be influenced by other meteorological parameters.
Desert aerosol-influence sites such as Beijing, China
(for 10 months) and Ilorin, Nigeria with mean annual
ta501 nm=0.8570.27 and 0.5970.29, respectively, andmean (Angstr .om exponents of 1.1070.18 and 0.7170.24as cited from the AERONET database. However,
desert located site such as Dalanzadgad, Mongolia

ARTICLE IN PRESS
Fig. 7. Sample 5-day back trajectories illustrating typical air-mass flow configurations at Kwangju during some selected dust outbreaks
in 2000 and 2001.
K.O. Ogunjobi et al. / Atmospheric Environment 38 (2004) 1313–13231320
(ta501 nm=0.13), has mean (Angstr .om exponent of 1.14
(Holben et al., 2001). Additionally, the rural Korean
sites, such as Anmoyondo (ta501 nm=0.38) with similar
characteristics to the study site Kwangju (ta501 nm=0.33)has mean annual (Angstr .om exponents equal to 1.20 and
0.85, respectively. The higher a at Anmyondo is an
ARTICLE IN PRESS
1
0.0
τ500nm (2001)
radius (µm)
0.21 0.26 0.35 0.45 0.53 0.60 0.71
(a)
Biomass burning aerosol
dv/d
(ln
r) [µ
m3 /
µm2 ]
0.1
0.2
0.3
0.4
0.5
0.00.01 0.1 10
0.1
0.2
0.3
0.4
0.5
0.00
0.05
0.10
0.15
Asian dust storm period
Asian dust storm period
τ500nm (2000)
0.45
0.53 0.48
0.18 0.36 0.43 0.56 0.62 0.71
τa501nm (2000)
(b)
(c)
Fig. 8. Aerosol volume size distribution at Kwangju for varying aerosol optical depth during the Asian dust period (March–May) in
2000 and 2001 and biomass burning (October) in 2000. Error bars indicate 71 standard deviation.
K.O. Ogunjobi et al. / Atmospheric Environment 38 (2004) 1313–1323 1321
indication of larger aerosol size than those at Kwangju
(Ogunjobi et al., 2003). The September value of
ta501 nm=0.56, a=1.44 for savanna site Brasilia, Brazil,is observed to be responding to influence of biomass
burning during the warm-dry season.
5. Conclusion
Average daily spectral aerosol optical depths in
cloud-free atmosphere at Kwangju, Korea for 277 days
(January 1999–August 2001) obtained from radia-
tion data have been presented in this study. The
observation periods includes the major Asia dust
storm episodes of spring 2000 and 2001 and biomass
burning period of late autumn 1999 to 2001. Results
showed that daily mean ta501 nm values rarely exceed 0.6except during the Yellow Sand days (major dust
outbreak). The (Angstr .om exponent a varies from 0.6
to 2.8 for small aerosol optical depth from June–
September and October–January, typical of urban
(including local) air pollution aerosol, as observed in
other urban locations whereas the values are generally
less than 0.6 for heavy dust particles (large ta501 nm)typical for March–May. PM10 mass concentrations
of ambient aerosol increased from spring time
averages of 50.9723.4 and 55.6730.2 mg/m3 in 2000
and 2001, respectively to values greater than 84.0mg/m3
during Asian dust outbreaks. Also, PM10 increases
from an annual averages of 44.2723.9 mg/m3 to as
high as 134.9mg/m3 on a typical biomass-burning
day at Kwangju. In addition, the peak in the size
distribution of the coarse mode of dust and fine
mode particles of biomass-burning aerosol, respect-
ively, increases as aerosol optical depth increases at
Kwangju.

ARTICLE IN PRESS
Table 2
Monthly average values of AOD (l=500nm) for Kwangju, Korea and other sites. Ilorin, Nigeria, Dalazadgad, Mongolia andKaashidhoo, Maldives and Brasilia, Brazil is as given by Holben et al. (2001), while Beijing, China, is from cloud screened AERONET
data and Anmyondo Korea, Cheju, Korea is as given by Korea meteorological station (KMA)
Kwangju
(1999–2001)
Beijing
(2001–2002)
Anmyondo
(1999–2002)
Cheju-Island
(2001)
Ilorin
(1998–1999)
Dalanzadgad
(1997–2000)
Kaashidhoo
(1998–1999)
Brasilia
(1993–1995)
Jan 0.26 — — 1.01 0.07 0.27 —
Feb 0.29 — 0.35 — 1.16 0.10 0.28 0.11
Mar 0.41 0.60 0.47 — 0.9 0.21 0.30
Apr 0.42 0.92 0.45 0.43 0.75 0.22 0.26 0.07
May 0.40 0.65 0.48 0.40 0.46 0.25 0.19 0.10
Jun 0.31 1.05 0.65 0.65 0.41 0.14 0.13 0.08
Jul 0.33 0.89 0.35 — 0.28 0.14 0.20 0.09
Aug 0.34 1.24 0.24 — 0.3 0.15 0.15 0.23
Sep 0.27 0.66 0.19 — 0.28 0.11 0.11 0.56
Oct 0.35 1.02 0.38 — 0.36 0.06 0.13 0.35
Nov 0.33 0.38 0.30 — 0.41 0.06 0.17 0.16
Dec 0.22 1.06 0.25 — 0.8 0.05 0.17 0.14
K.O. Ogunjobi et al. / Atmospheric Environment 38 (2004) 1313–13231322
Acknowledgements
This work was supported in part by the Korea Science
and Engineering Foundation (KOSEF) through the
Advanced Environmental Monitoring Research Center
(ADRMC), at Kwangju Institute of Science and
Technology. Much thanks is expressed to the Principal
Investigators for their effort in establishing and main-
taining the AERONET Beijing site.
References
Angstrom, A., 1961. Techniques of determining the turbidity of
the atmosphere. Tellus 13, 214–223.
Cachorro, V.A., Duran, P., Vergaz, R., de Frutos, A.M., 2000.
Measurements of the atmospheric turbidity of the north-
center continental area in Spain: spectral aerosol optical
depth and Angstrom turbidity parameters. Aerosol Science
and Technology 31, 687–702.
Choi, J.C., Lee, M., Chun, Y., Kim, J., Oh, S., 2001. Chemical
composition and source signature of spring aerosol in Seoul,
Korea. Journal of Geophysical Research 106, 18067–18074.
Chung, Y.S., Yoon, M.B., 1996. On the occurrence of yellow
sand and atmospheric loadings. Atmospheric Environment
30, 2387.
Dubovik, O., King, M.D., 2000. A flexible inversion algorithm
for the retrieval of aerosol optical properties from sun
and sky radiance measurements. Journal of Geophysical
Research 105, 20673–20696.
Eck, T.F., Holben, B.N., Reid, J.S., Dubovik, O., Smirnov, A.,
O’Neill, N.T., Slutsker, I., Kinne, S., 1999. Wavelength
dependence of the optical depth of biomass, urban, and
dust aerosols. Journal of Geophysical Research 104,
31333–31349.
Eck, T.F., Holben, B.N., Ward, D.E., Dubovik, O., Reid, J.S.,
Smirnov, A., Mukelabai, M.M., Hsu, N.C., O’Neill, N.T.,
Slutsker, I., 2001. Characterization of the optical properties
of biomass burning aerosols in Zambia during the 1997
ZIBBEE field campaign. Journal of Geophysical Research
106, 3425–3448.
Harrison, L., Michalsky, J., Berndt, J., 1994. Automatic
multifilter rotating shadow-band radiometer: an instrument
for optical depth and radiation measurements. Applied
Optics 33, 5118–5125.
Holben, B.N., Tanre, D., Smirnov, A., Eck, T.F., Slutsker, I.,
Abuhassan, N., Newcomb, W.W., Schafer, J.S., Chatenet,
B., Lavenu, F., Kaufman, Y.J., Castle, J.V., Setzer, A.,
Markham, B., Clark, D., Frouin, R., Halthore, R., Karneti,
A., O’Neil, N.T., Pietras, C., Pinker, R.T., Voss, K.,
Zibordi, G., 2001. An emerging ground-based aerosol
climatology: aerosol optical depth from AERONET.
Journal of Geophysical Research 106 (11), 12067–12097.
Husar, R.B., Tratt, D.M., Schictel, B.A., Falke, S.R., Li, F.,
Jaffe, D., Gasso, S., Gill, T., Laulainen, N.S., Lu, F.,
Reheis, M.C., Chun, Y., Westphal, D., Holben, B.N.,
Gueymard, C., McKendry, I., Kuring, N., Feldman, G.C.,
McClain, C., Frouin, R.J., Merrill, J., duBois, D., Vignola,
F., Murayama, T., Nickovic, S., Wilson, W.E., Sassen, K.,
Sugimoto, N., Malm, W.C., 2001. Asian dust of April 1998.
Journal of Geophysical Research 106 (D16), 18317–18330.
Iqbal, M., 1983. An Introduction to Solar Radiation. Academic
Press, New York, p. 360.
Iwasaka, Y., Minoura, H., Nagaya, K., 1983. The transport
and spatial scale of Asia dust-storm clouds: a case study
of the dust-storm event of April 1979. Tellus 35B,
189–196.
Kasten, F., Young, A.T., 1989. Revised optical air mass tables
and approximation formula. Applied Optics 28, 4735–4738.
Kim, Y.J., Kim, K.W., Oh, S.J., 2001. Seasonal characteristics
of haze observed by continuous visibility monitoring in the
urban atmosphere of Kwangju, Korea. Environmental
Monitoring and Assessment 70, 35–46.
King, M.D., Byran, D.M., Herman, B.M., Reagan, J.A., 1978.
Aerosol size distribution obtained by inversion of spectral
optical depth measurements. Atmospheric Science 35, 2153–
2167.

ARTICLE IN PRESSK.O. Ogunjobi et al. / Atmospheric Environment 38 (2004) 1313–1323 1323
Luo, Y., Lu, D., Zhou, X., Li, W., He, Q., 2001. Characteristics
of the spatial distribution and yearly variation of aerosol
optical depth over china in last 30 years. Journal of
Geophysical Research 106 (13), 14501–14513.
Markham, B.L., Schafer, J.S., Holben, B.N., Halthore, R.N.,
1997. Atmospheric aerosol and water vapor characteristics
over north central Canada during BOREAS. Journal of
Geophysical Research 102, 29737–29745.
Min, H.K., Kim, J., Choi, B., Oh, S.M., 2002. Characteristics of
spectral aerosol optical depth retrieved from ground based
Sun photometer measurements in Seoul, Korea: an applica-
tion of cloud screening algorithm (CSA). Journal of the
Korean Meteorological Society 38 (1), 25–38.
Mizohata, A., Mamuro, T., 1978. Some information about
loss aerosol over Japan. Japan Society of Air Pollution 13,
289–297.
Muller, D., Wandinger, U., Ansmann, A., 1999. Microphysical
particle parameters from extinction and backscatter lidar
data by inversion with regularization: theory. Applied
Optics 38 (12), 2346–2357.
Ogunjobi, K.O., Kim, Y.J., He, Z., 2003. Aerosol optical
properties during Asian dust storm episode in South Korea.
Journal of Theoretical and Applied Climatology 76, 65–75.
Oh, S.M., Min, H.K., Cha, J.W., Lee, S.S., 2001. Aerosol
optical properties from ACE-Asia at Kosan Jeju and
Anmyondo GAW Korea. Korean Journal of Atmospheric
Sciences 4, 95–104.
Park, S.S., Kim, Y.J., Fung, K., 2002. PM carbon measure-
ments in two urban areas: Seoul and Kwangju, Korea.
Atmospheric Environment 36, 1287–1297.
Pinker, R.T., Pandithurai, G., Holben, B.N., Dubovik, O.,
Aro, T.O., 2001. A dust outbreak episode in sub-Sahel
West Africa. Journal of Geophysical Research 106,
22923–22930.
Qiu, J., 1998. A method to determine atmospheric aerosol
optical depth using direct solar radiation. Journal of the
Atmospheric Sciences 55, 744–757.
Remer, L.A., Kaufman, Y.J., 1998. Dynamic aerosol model:
urban/ industrial aerosol. Journal of Geophysical Research
103, 13859–13871.
Remer, L.A., Kaufman, Y., Holben, B.N., Thompson, A.M.,
McNamara, D.P., 1998. Biomass burning aerosol size
distribution and modeled optical properties. Journal of
Geophysical Research 103, 31879–31892.
Sabbah, I., Ichoku, C., Kaufman, Y.J., Remer, L., 2001. Full
year cycle of desert dust spectral optical thickness and
precipitable water vapor over Alexandria, Egypt. Journal of
Geophysical Research 106, 18305–18316.
Shifrin, K.S., 1995. Simple relationships between the Angstrom
parameter of disperse system. Applied Optics 34, 4480–
4485.
Vaughan, J.K., Claiborn, C., Finn, D., 2001. April 1998 Asian
dust event over the Columbia Plateau. Journal of Geophy-
sical Research 106, 18381–18402.