Embed Size (px)
Citation preview
Naval Research LaboratoryMonlwW, CA 39-5
NRLIRMR7540-.06-8870
Aerosol Optical Depth Analysiswith NOAA GOES and POES inthe Western Atlantic
ARUNAS P. KUaAUSKAS
Meteorological Applications Development BranchMarine Meteorology Division
PHnip A. Dum
Department of MeteorologyNaval Postgraduate SchoolMonterey, CA
DOUGLAS L. WEsmqiAL
Atmospheric Dynamics and Prediction BranchMarine Meteorology Division
February 17, 2006
Approved for public release; distribution is unlimited.
R DForm ApprovedI OMB No. 0704-0188
Public reporting burden for this collection of information Is estimated to average 1 hour per response, including the time for reviewing Instructions, searching existing data sources, gathering andmaintaining the data needed, and completing and reviewing this collection of Information. Send comments regarding this burden estimate or any other aspect of this collection of Information, includingsuggestions for reducing this burden to Department of Defense, Washington Headquarters Services, Directorate for Information Operations and Reports (0704-0188), 1215 Jefferson Davis Highway,Suite 1204, Arlington, VA 22202-4302. Respondents should be aware that notwithstanding any other provision of law, no person shall be subject to any penalty for failing to comply with a collection ofinformation if it does not display a currently valid OMB control number, PLEASE DO NOT RETURN YOUR FORM TO THE ABOVE ADDRESS.
1. REPORT DATE (DD-MM-YYYY) 2. REPORT TYPE 3. DATES COVERED (From - To)17-02-2006 Memorandum Report
4. TITLE AND SUBTITLE 5a. CONTRACT NUMBERN0003905 WXFR 151
Aerosol Optical Depth Analysis with NOAA GOES and POES in the Western Atlantic 5b. GRANT NUMBER
5c. PROGRAM ELEMENT NUMBER
6. AUTHOR(S) 5d. PROJECT NUMBER
Arunas P. Kuciauskas, Philip A. Durkee,* and Douglas L. Westphal 5e. TASK NUMBER
5f. WORK UNIT NUMBER
7. PERFORMING ORGANIZATION NAME(S) AND ADDRESS(ES) 8. PERFORMING ORGANIZATION REPORTNUMBER
Naval Research LaboratoryMarine Meteorology Division NRLIMRI754O--06-88707 Grace Hopper Avenue, Stop 2Monterey, CA 93943-5502
9. SPONSORING / MONITORING AGENCY NAME(S) AND ADDRESS(ES) 10. SPONSOR / MONITOR'S ACRONYM(S)
Tom PiwowarPMW- 1804301 Pacific Highway 11. SPONSOR / MONITOR'S REPORTCode OT-1 NUMBER(S)San Diego, CA 92110
12. DISTRIBUTION / AVAILABILITY STATEMENT
Approved for public release; distribution is unlimited.
13. SUPPLEMENTARY NOTES
*Professor Durkee is with the Department of Meteorology, Naval Postgraduate School, Monterey, CA.
14. ABSTRACT
An aerosol optical depth retrieval algorithm in the visible wavelengths for the NOAA POES AVHRR and GOES-8 visible imager is presentedfor the cloud free, marine atmosphere. The algorithm combines linearized single-scatter theory with an estimate of surface reflectance. Phasefunctions are parameterized using an aerosol size distribution model and the ratio of radiance values measured in channels I and 2 of the AVHRR.Retrieved satellite aerosol optical depth (AOD) is compared to three land-based sun photometer stations located on islands in the western Atlanticduring July and September, 2001. GOES-8 channel I (visible wavelength) radiance values were initially calibrated using techniques developedby Rao and Zhang (1999). Additional corrections to the channel 1 GOES-8 radiances were made by applying a linear offset factor obtained dur-ing the experimental time period through comparison with AVHRR radiances. The results for the GOES-derived AOD compare favorable to theAerosol Robotic NETwork (AERONET) AOD values. For both NOAA and GOES data, the comparison dataset has a correlation coefficient of0.67 with a standard error of 0.7. During dusty conditions with corresponding higher AOD levels > 0.25, the general trend was for the satellite-derived AOD values to underestimate AERONET AOD values. Within these conditions, the scattering phase function pattern deviated from theexpected pattern, especially between the scattering angles of 1400 to 180'. Overall, the more accurate calculations of AOD occurred over scatterangles between 1400 to 1500 and 1700 to 1800.
15. SUBJECT TERMSRadiative transfer POES Aerosol optical depth DustNOAA AVHRR GOES AOD Caribbean Sea
16. SECURITY CLASSIFICATION OF: 17. LIMITATION 18. NUMBER 19a. NAME OF RESPONSIBLE PERSONOF ABSTRACT OF PAGES Arunas P. Kuciauskas
a. REPORT b. ABSTRACT c. THIS PAGE LTL 41 19b. TELEPHONE NUMBER (include areaUT. 41code)
Unclassified Unclassified Unclassified (831) 656-4836
Standard Form 298 (Rev. 8-98)Prescribed by ANSI Sid. Z39.18
CONTENTS
1. Introduction ........................................................................................................................................... 1
2. Satellite Aerosol Optical Depth Retrieval M ethod ............................................................................... 3
3. D ata and M ethodology .......................................................................................................................... 5
3.1 NOAA Polar Orbiting Environmental Satellite AdvancedVery H igh Resolution Radiom eter (AVHRR) .......................................................................... 5
3.2 NOAA Geostationary Orbiting Environmental Satellite (GOES-8) Imager ............................ 63.3 AERONET Sun-sky Scanning Spectral Radiom eter .............................................................. 6
4. GOES-8 Calibration and Correction Processes ................................................................................... 7
5. Results ................................................................................................................................................... 9
5.1 A Case Study of High AOD Conditions ................................................................................. 105.2 Results from 22 Cases ................................................................................................................ 12
6. Conclusions ........................................................................................................................................... 16
List of References ....................................................................................................................................... 19
111.i
Aerosol Optical Depth Analysis with NOAA GOESand POES in the Western Atlantic
1. Introduction
Monitoring tropospheric aerosols on a global scale is essential for evaluating the
earth's radiation budget. Aerosols impact the radiation process partly by scattering
incident solar radiation back to space and by interacting with clouds in a way that
increases overall albedo (Charlson et al., 1992, Twomey et al., 1977, IPCC, 1996). King
et al. (1999) reports the impact of aerosol radiative forcing, both directly (scattering) and
indirectly (interaction with clouds), produces a cooling range of
-1.4±1.5 W m2 to -2.5±2 W m-2. This result offsets the well-known concept of the
greenhouse warming impact, estimated to be +2.5±0.3 W m-2.
Another research area of global aerosol impact focuses on the transport of dust
and pollutants from one region to another. ACE-Asia (Huebert, et al., 2003) was a 4-year
project (2001 - 2004) devoted to the study of aerosol profiles in the Pacific basin
generated by desert dust and industrial pollution over Asia. The Puerto Rico Dust
Experiment (PRIDE) in 2000 (Reid, et al., 2002) studied the impacts of African desert
dust that is transported over to the Caribbean and the eastern U.S.
Given the challenges listed above, there is a developing interest to globally
quantify aerosol properties on fine spatial and temporal scales. Thus far, this analysis has
proven to be a daunting task, since most established aerosol sensing is land-based,
providing poor spatial and temporal coverage. Higurashi et al. (1999) suggests that
aerosol concentration, size distribution, composition, and optical properties will have to
be measured globally, and that satellite remote sensing is an effective tool for such a task.
Over the past few decades, scientists have developed algorithms to convert satellite
upwelling radiances into aerosol properties such as optical depth. So far, most of the
Manuscript approved April 21, 2005.
aerosol remote sensing studies have used the Polar Orbiting Environment Satellite
(POES) National Oceanographic and Atmospheric Administration (NOAA) Advanced
Very High Resolution Radiometer (AVHRR) sensor channel 1 and 2 data. Table 1
provides the channel characteristics for the AVHRR sensor. These algorithms were
developed by assuming certain aerosol characteristics such as scattering phase function
and single scatter albedo before processing the upwelling radiances (Durkee et al. 2000,
Durkee et al. 1991, Kaufman et al. 1990, Higurashi and Nakajima, 1999).
This study focuses on one such algorithm developed by Durkee et al. (1990) and
Durkee et al. (1999) (hereafter referred to as the NPS algorithm). The NPS algorithm
ingests AVHRR data within a cloud-free, single scatter environment. The scattering
phase function was parameterized based on the ratio of channel 1 and 2 radiances; a
necessary step in solving the radiative transfer problem. During three recent field
campaigns, Durkee et al. (2000) has shown that the NPS algorithm performs well for
aerosol optical depths (AOD) below 0.4 at 0.63 pim wavelength. But the results only
provided once or twice-daily snapshots of AOD over experimental regions, since the
polar orbiting AVHRR sensor passes over non-polar regions a few times per dayl. For
this study, the NPS algorithm has been adapted to estimate AOD using GOES visible
data. Table 2 provides channel characteristics for the GOES GVAR sensor. Since the
GOES data contains only 1 visible channel, an estimate of the aerosol size distribution is
not directly made available to GOES AOD processing. Instead, the aerosol information
obtained from each pixel within the NOAA AVHRR AOD processing is passed into the
1 This statement applies over mid-latitude and tropical regions since passes converge over the poles,resulting in decreasing frequency toward the equator.
2
GOES AOD processing. A more elaborate description of this process can be found in
Brown (1997) and Kuciauskas (2002).
The focus of this article is to evaluate the algorithm over open water regions near
islands in the western Atlantic Ocean. The following issues will be addressed:
"* Proper radiance calibration of the visible sensor on GOES platforms
"* Validation of the AOD derived from the retrieval algorithm using AERONET
estimates over the Caribbean and eastern Atlantic Ocean
"* Evaluation of the phase function parameters used in the retrieval algorithm
Section 2 describes the radiative transfer theory and the simplifying atmospheric
assumptions used in the satellite optical depth retrievals. Section 3 describes the data sets
and basic instrumentation used. Section 4 describes the calibration and correction
techniques applied to the retrieved GOES channel 1 radiance. Section 5 discusses the
results and Section 6 presents the conclusions.
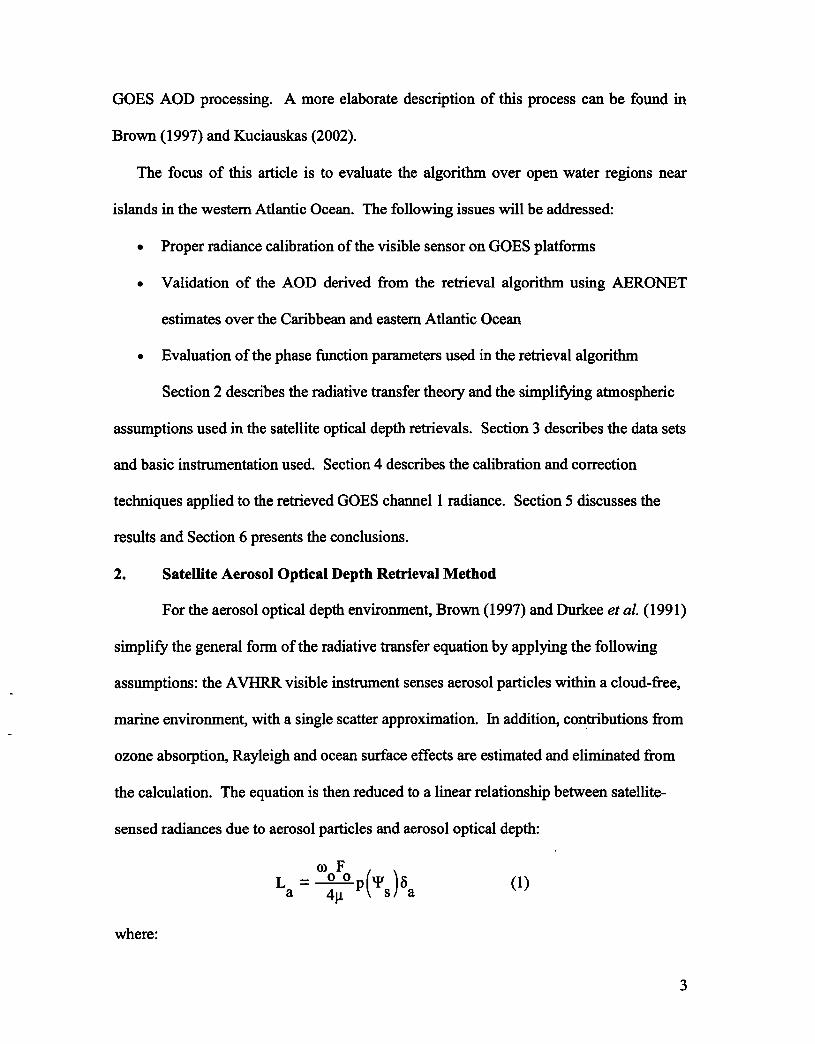
2. Satellite Aerosol Optical Depth Retrieval Method
For the aerosol optical depth environment, Brown (1997) and Durkee et al. (1991)
simplify the general form of the radiative transfer equation by applying the following
assumptions: the AVHRR visible instrument senses aerosol particles within a cloud-free,
marine environment, with a single scatter approximation. In addition, contributions from
ozone absorption, Rayleigh and ocean surface effects are estimated and eliminated from
the calculation. The equation is then reduced to a linear relationship between satellite-
sensed radiances due to aerosol particles and aerosol optical depth:
co0FL a= 0 O p(TS,) (1)a 41L
where:
3
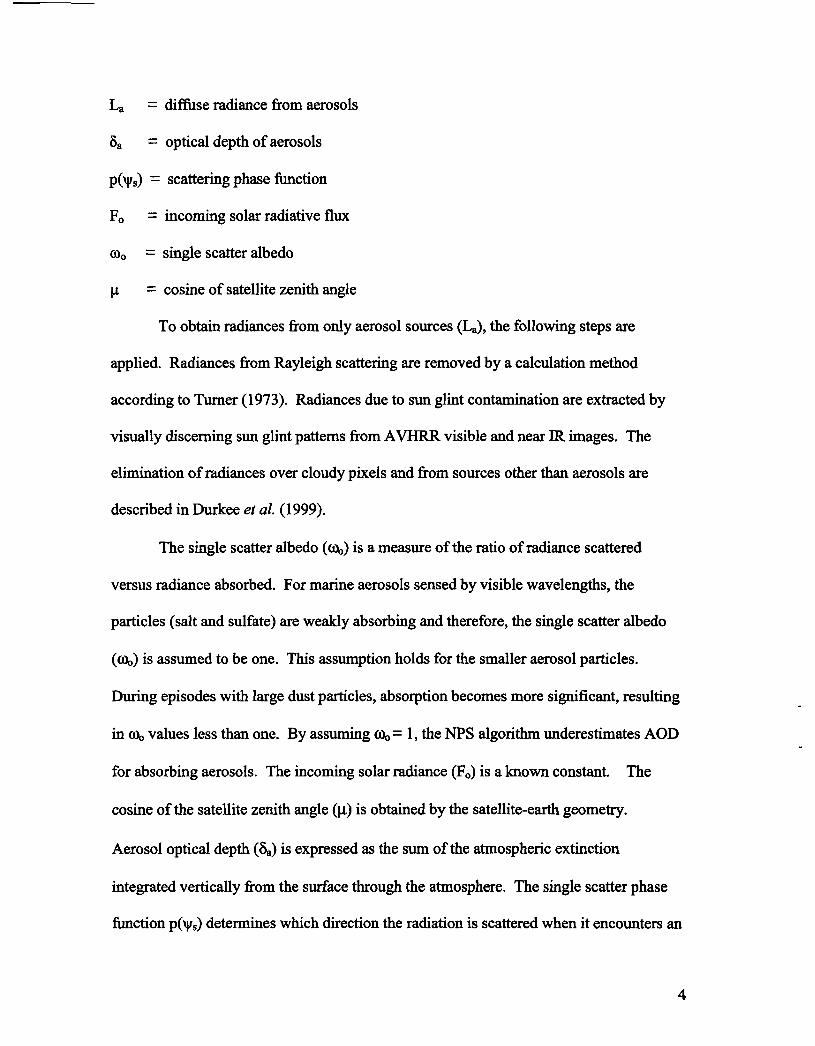
La = diffuse radiance from aerosols
8,, = optical depth of aerosols
p(xV') = scattering phase function
F. = incoming solar radiative flux
Co) = single scatter albedo
[ = cosine of satellite zenith angle
To obtain radiances from only aerosol sources (La), the following steps are
applied. Radiances from Rayleigh scattering are removed by a calculation method
according to Turner (1973). Radiances due to sun glint contamination are extracted by
visually discerning sun glint patterns from AVHRR visible and near IR images. The
elimination of radiances over cloudy pixels and from sources other than aerosols are
described in Durkee et al. (1999).
The single scatter albedo (Co,) is a measure of the ratio of radiance scattered
versus radiance absorbed. For marine aerosols sensed by visible wavelengths, the
particles (salt and sulfate) are weakly absorbing and therefore, the single scatter albedo
(wo,) is assumed to be one. This assumption holds for the smaller aerosol particles.
During episodes with large dust particles, absorption becomes more significant, resulting
in ao) values less than one. By assuming c% = 1, the NPS algorithm underestimates AOD
for absorbing aerosols. The incoming solar radiance (F,) is a known constant. The
cosine of the satellite zenith angle (g) is obtained by the satellite-earth geometry.
Aerosol optical depth (8a) is expressed as the sum of the atmospheric extinction
integrated vertically from the surface through the atmosphere. The single scatter phase
function P(xys) determines which direction the radiation is scattered when it encounters an
4
aerosol particle. Determining P(Ays) requires knowledge of the aerosol composition and
size distribution, which are not routinely available. Therefore, P(XVs) must be
parameterized. Durkee et al. (1991), Brown (1997) and Durkee et al. (1999) developed
the parameterization technique for the NPS algorithm of using the ratio of the channel 1
(visible) and channel 2 (near-IR) data for each NOAA AVHRR pixel to select one of 7
models of maritime aerosol size distributions, ranging from pristine to dusty conditions
and then estimating the phase function values using a lookup table and the viewing
geometry. Previous applications of this method may be found in Brown (1997), Smith
(1998), Durkee et al. (1999) and Kuciauskas (2002).
As mentioned in the previous section, the aerosol size distribution information is
passed from each AVHRR pixel to the corresponding GOES pixel. An assumption that
aerosol conditions don't appreciably change between the NOAA AVHRR and GOES
times is applied.
3. Data and Methodology
To validate the optical depth retrieval method, a case study approach was
developed wherein cases were selected based on the availability of collocated and
concurrent data from NOAA POES and GOES, and AERONET ground-based
radiometers. This section describes the datasets and methods used for this study.
3.1. NOAA Polar Orbiting Environmental Satellite Advanced Very HighResolution Radiometer (AVItRR)
The AVHRR instrument senses upwelling radiances of 5 channels, ranging from
the visible to the infrared. Over the experimental region, the NOAA-16 AVHRR
provided the local afternoon data (-1800 UTC) while the NOAA-14 AVHRR provided
5
data late in the afternoon (-2100 UTC). The data from the NOAA-14 was at times
degraded due to low sun angle problems. Therefore, the NOAA- 16 data was considered
the more reliable dataset. All AVHRR channels are calibrated prior to launch. Channels
1 and 2 have no onboard calibration systems. Post calibration methods for these channels
were developed by the NOAA/NESDIS Office of Research Applications, based on results
of Rao and Chen (1995) and Rao et al. (1999).
The visible channel 1 data, centered at 0.63 pm, is used in the AOD calculations.
Channel 1 and the near-IR channel 2 data (centered at 0.86 pm) are used to select the
aerosol model, as mentioned in section 2.1.
3.2. NOAA Geostationary Orbiting Environmental Satellite (GOES-8) Imager
The GOES-8 imager is onboard the Geosynchronous Operational Environmental
Satellite (GOES) series of satellites and covers the western Atlantic region. The GOES
imager scans in 5 channels: channel 1 in visible, channels 2 - 5 in IR. For this study,
channel 1 (central wavelength -0.65 pmo) is used in the AOD calculations. Like the
NOAA AVHRR, the visible channel does not have an onboard calibration system.
Immediately after the launch, there was a nonlinear decrease in signal strength within the
GOES-8 imager. Furthermore, the GOES imager is much noisier than the AVHRR
sensor. For this study, the visible radiances were adjusted in order to be comparable to
the AVHRR visible radiances. Section 4 describes these correction procedures.
3.3. AERONET Sun-sky Scanning Spectral Radiometer
Data collected from the AERONET automated radiometers are used as the ground
truth AOD for this study. AERONET consists of a global network of ground-based
automated CIMEL Electroniques 318A spectral radiometers that make direct sun or sky
6
measurements. The direct sun measurements are made in 8 spectral bands centered at
0.34, 0.38, 0.44, 0.50, 0.67, 0.87, 0.94, and 1.02 pm.The 0.67 pm wavelength data is
comparable to that used in the optical depth calculation from both the GOES and NOAA
retrievals and is used in the comparison. Under cloud free conditions, the AOD
uncertainty at 0.67 pm is less than ± 0.01. Detailed information about the operations and
instruments of the AERONET system is provided in Holben et al. (1998).
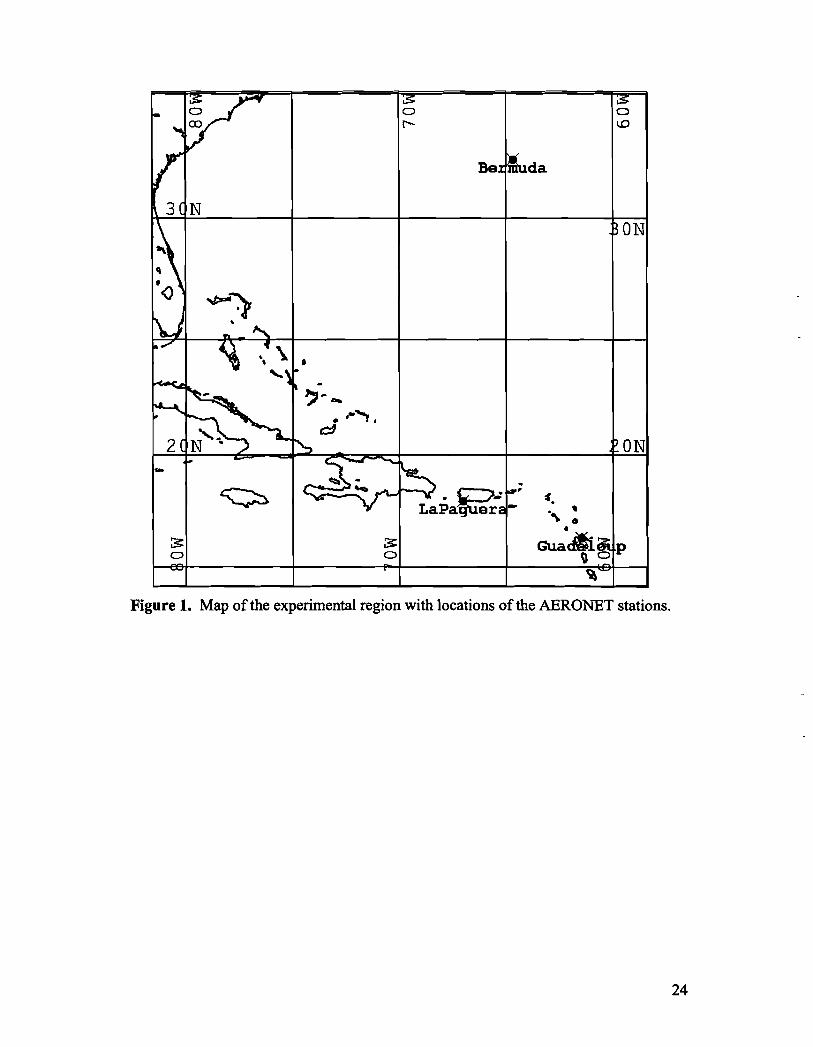
AERONET data was obtained from instruments installed on three island sites:
eastern Bermuda, (U.K.) (320 22'N, 640 41'W), La Paguera, Puerto Rico (170 58'N, 670
02'W) and Guadaloup, Island (Fr.) (16' 19'N, 610 30'W), all within the western Atlantic
Basin (see Figure 1). For all 3 sites, the dataset contains only the times that have not
been contaminated by clouds. Cloud events were flagged as missing data within the
AERONET measurements.
4. GOES-8 Calibration and Correction Processes
Compared to the AVIRR, calibrating the GOES-8 channel 1 radiances was
significantly more challenging, resulting in less accurate data. There have been several
attempts to perform vicarious calibration techniques to adjust for the weakening signal
strength and to take into account the post-launch degradation. There is an additional
problem with noise and the signal radiometric resolution, inherent within the GOES
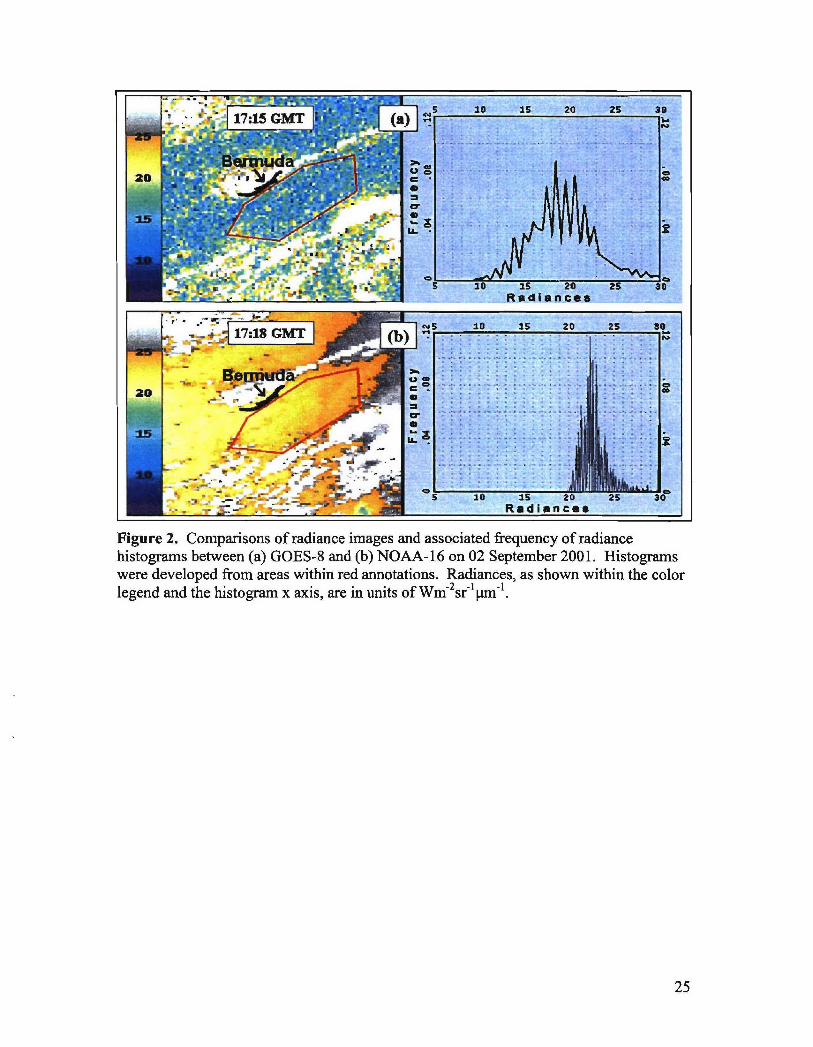
sensors. Figure 2 displays an example of radiance comparisons between the calibrated
GOES and AVHRR datasets. The image passes occurred at a similar time and were
registered over the same 100 km by 100 Ikn domain surrounding Bermuda. In addition,
both satellites had similar viewing geometries (scatter angles were 1 0. l of each other).
The atmospheric conditions immediately south of Bermuda (outlined in red) were clear
7
and homogeneous at this time. The right side panels within Figure 2 are plots of the
histogram frequency distribution of radiances that were extracted within the outlined
region. As expected, the NOAA-16 image in Figure 2(b) displays a relatively
homogeneous field of radiances. Its corresponding frequency histogram shows a
pronounced signal peak with a narrow radiometric width, indicative of the pristine
atmospheric conditions. In contrast, the GOES-8 sensor, situated in an orbit that is 40
times the distance of the NOAA sensor, produces an image (shown in Figure 2(a)) that is
significantly noisier. Its corresponding histogram displays a weaker signal peak and
wider radiometric range. As atmospheric conditions become hazier, the GOES-8 peak
signal and radiometric resolutions become even less discernable, thus reducing the
confidence level of processed AOD calculations. In addition, the GOES-8 signal peak of
S16 Wnm2sf' ILm 1 is significantly weaker than the NOAA-16 signal peak of -22.5
Wm-2sr"1 pmn1, thus necessitating a further correction factor to GOES-8 before further
processing.
To match GOES with NOAA data during AOD processing, two correction
techniques were applied to the GOES channel 1 radiance data. Rao and Zhang (1999)
and Rao et al. (1999) developed a calibration methodology of GOES-8 channel radiance
by a vicarious technique, selecting a radiometrically stable calibration site located in the
Sonoran desert (34.0 0N/l 14.1 0W). Radiometrically stable calibration is defined as the
long term mean albedo at the top of the atmosphere remaining uniform in time.
The gain factor determined by Rao (1999) increases with time, corresponding to
the weakening signal within the GOES-8 channel 1 sensor. For this report, the gain
factor ranged from 1.727 during the earliest case (27 July) to 1.740 during the latest case
8
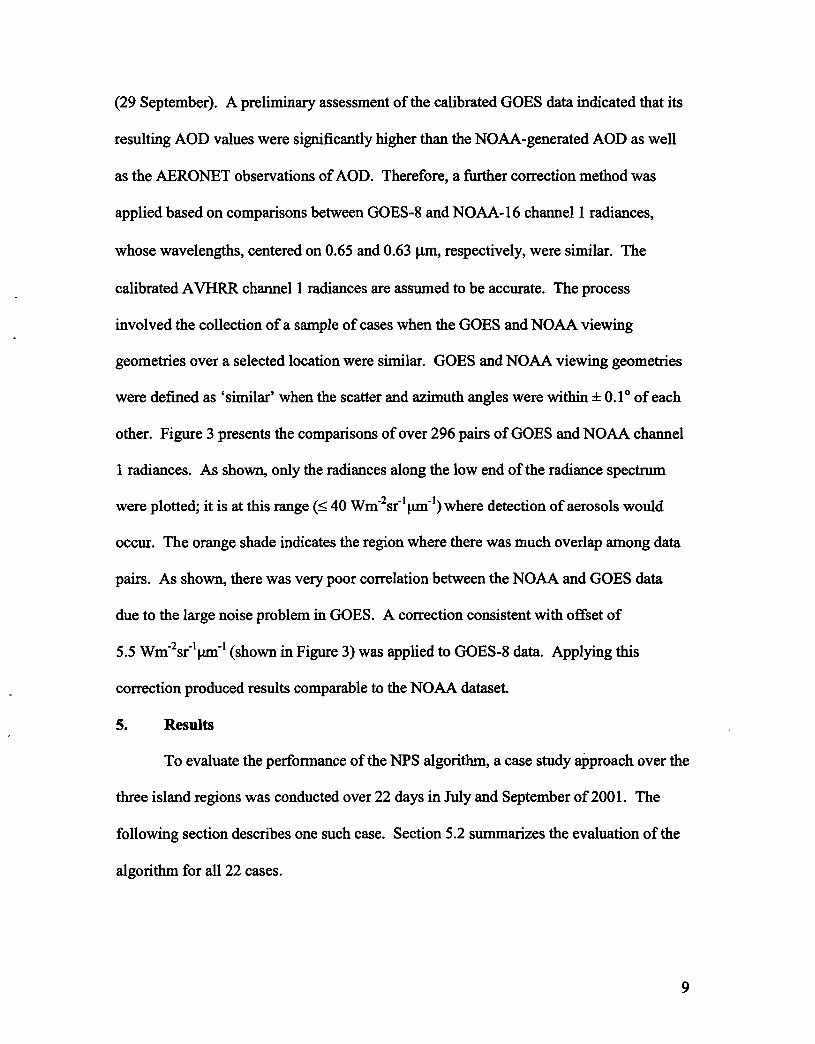
(29 September). A preliminary assessment of the calibrated GOES data indicated that its
resulting AOD values were significantly higher than the NOAA-generated AOD as well
as the AERONET observations of AOD. Therefore, a further correction method was
applied based on comparisons between GOES-8 and NOAA-16 channel 1 radiances,
whose wavelengths, centered on 0.65 and 0.63 pm, respectively, were similar. The
calibrated AVHRR channel 1 radiances are assumed to be accurate. The process
involved the collection of a sample of cases when the GOES and NOAA viewing
geometries over a selected location were similar. GOES and NOAA viewing geometries
were defined as 'similar' when the scatter and azimuth angles were within ± 0.1 0 of each
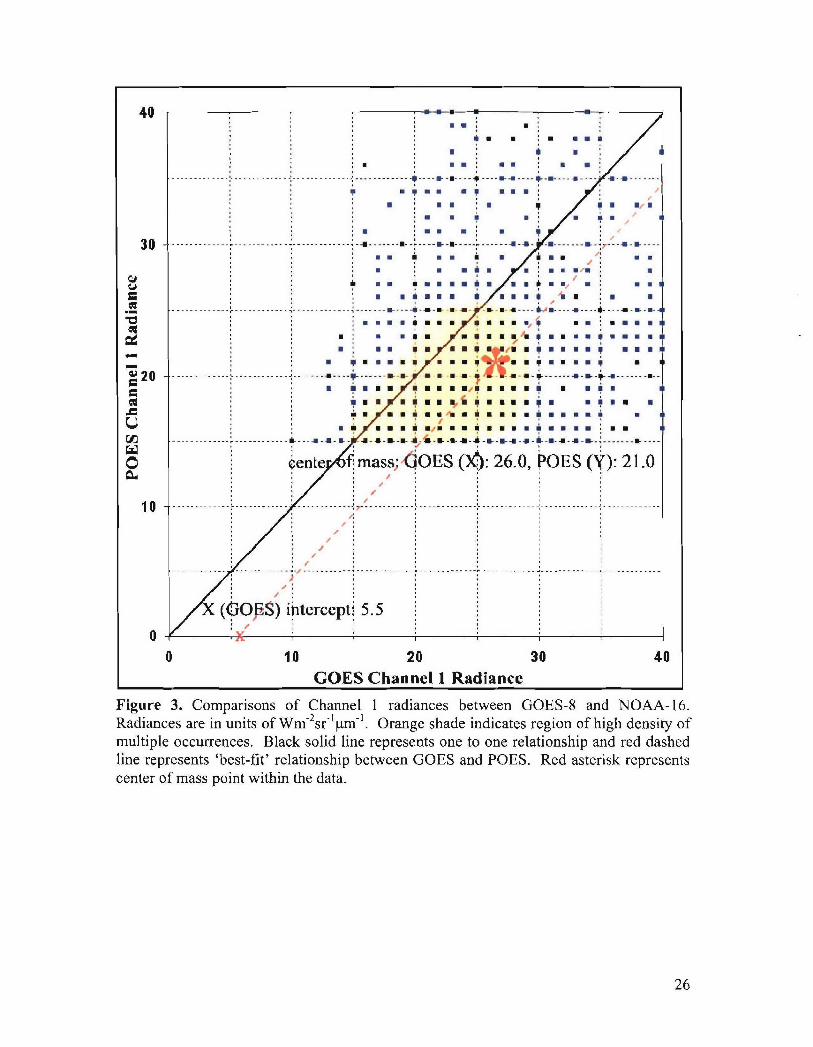
other. Figure 3 presents the comparisons of over 296 pairs of GOES and NOAA channel
1 radiances. As shown, only the radiances along the low end of the radiance spectrum
were plotted; it is at this range (< 40 Wmf2srepIM-1) where detection of aerosols would
occur. The orange shade indicates the region where there was much overlap among data
pairs. As shown, there was very poor correlation between the NOAA and GOES data
due to the large noise problem in GOES. A correction consistent with offset of
5.5 Wm-2sr'lpfm- (shown in Figure 3) was applied to GOES-8 data. Applying this
correction produced results comparable to the NOAA dataset.
5. Results
To evaluate the performance of the NPS algorithm, a case study approach over the
three island regions was conducted over 22 days in July and September of 2001. The
following section describes one such case. Section 5.2 summarizes the evaluation of the
algorithm for all 22 cases.
9
5.1. A Case Study of High AOD Conditions
5.1.1. Synoptic Discussion
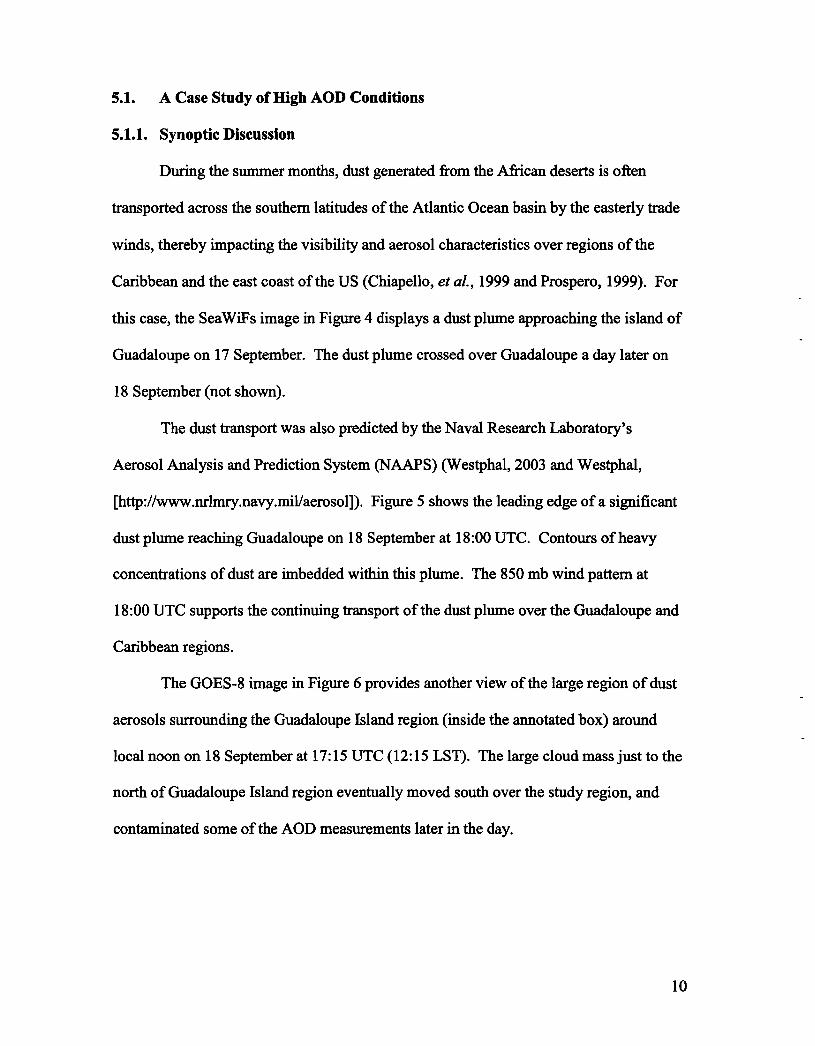
During the summer months, dust generated from the African deserts is often
transported across the southern latitudes of the Atlantic Ocean basin by the easterly trade
winds, thereby impacting the visibility and aerosol characteristics over regions of the
Caribbean and the east coast of the US (Chiapello, et al., 1999 and Prospero, 1999). For
this case, the SeaWiFs image in Figure 4 displays a dust plume approaching the island of
Guadaloupe on 17 September. The dust plume crossed over Guadaloupe a day later on
18 September (not shown).
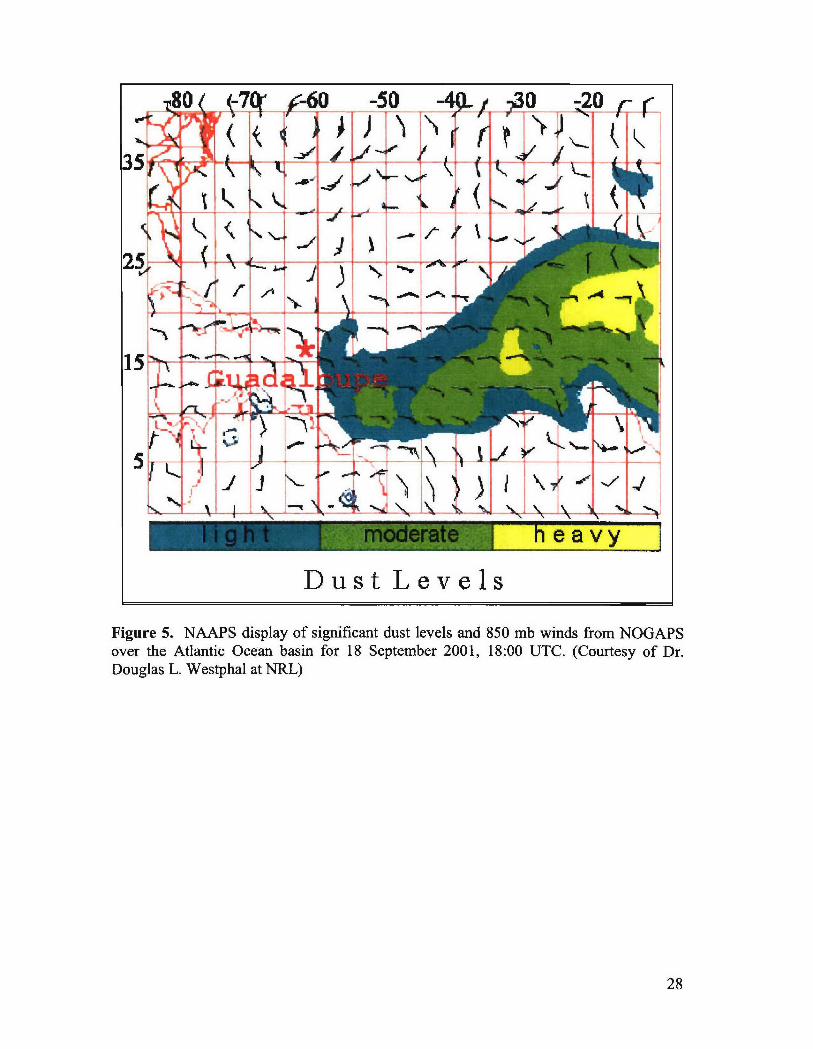
The dust transport was also predicted by the Naval Research Laboratory's
Aerosol Analysis and Prediction System (NAAPS) (Westphal, 2003 and Westphal,
[http://www.nrhmry.navy.mil/aeroso.]). Figure 5 shows the leading edge of a significant
dust plume reaching Guadaloupe on 18 September at 18:00 UTC. Contours of heavy
concentrations of dust are imbedded within this plume. The 850 mb wind pattern at
18:00 UTC supports the continuing transport of the dust plume over the Guadaloupe and
Caribbean regions.
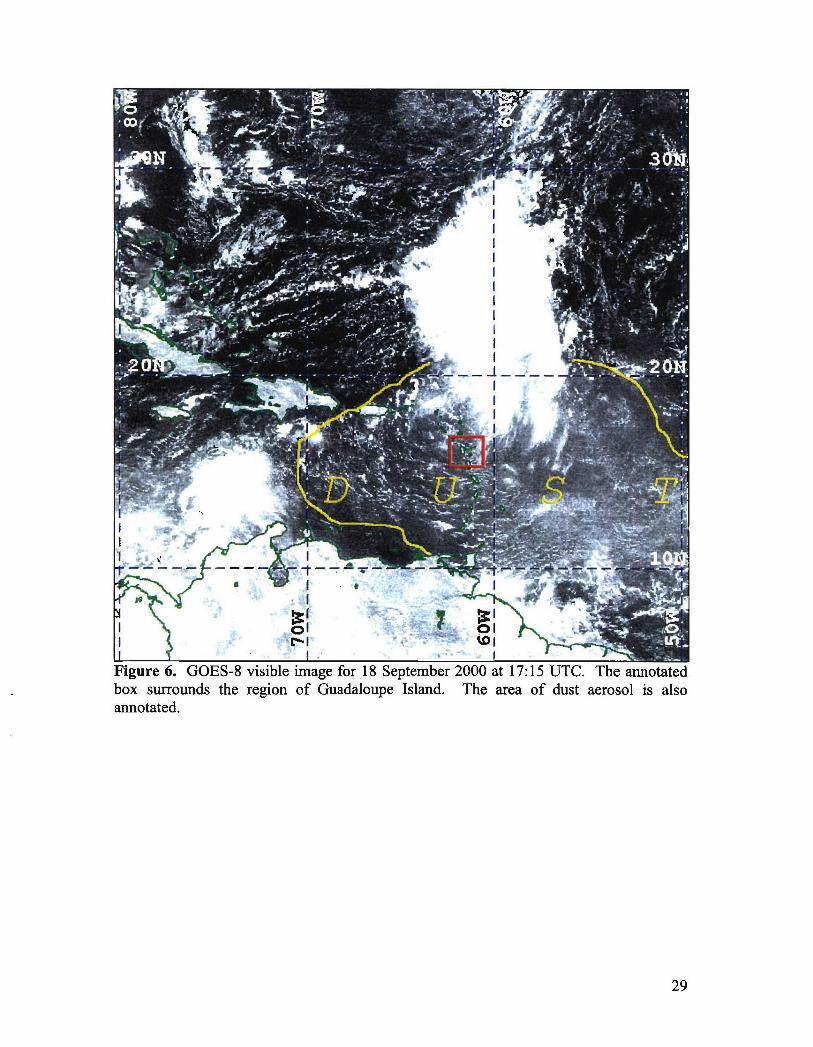
The GOES-8 image in Figure 6 provides another view of the large region of dust
aerosols surrounding the Guadaloupe Island region (inside the annotated box) around
local noon on 18 September at 17:15 UTC (12:15 LST). The large cloud mass just to the
north of Guadaloupe Island region eventually moved south over the study region, and
contaminated some of the AOD measurements later in the day.
10
5.1.2. AOD and Phase Function Analysis
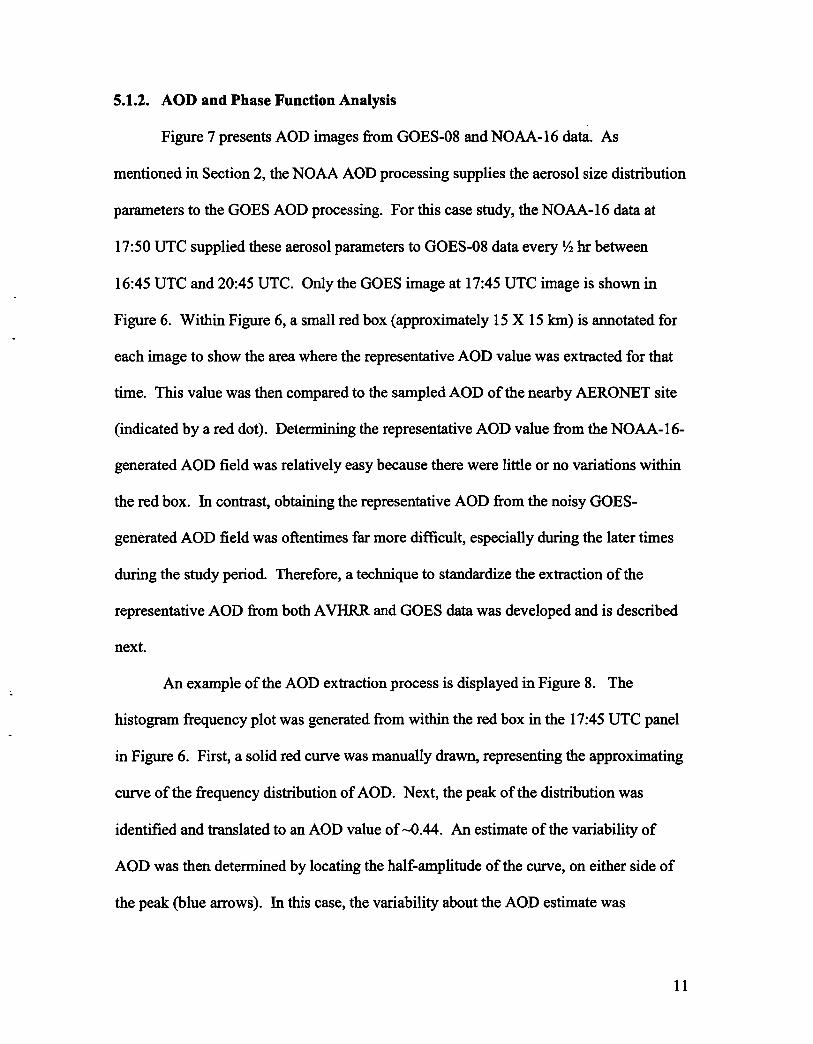
Figure 7 presents AOD images from GOES-08 and NOAA-16 data. As
mentioned in Section 2, the NOAA AOD processing supplies the aerosol size distribution
parameters to the GOES AOD processing. For this case study, the NOAA-16 data at
17:50 UTC supplied these aerosol parameters to GOES-08 data every 1/2 hr between
16:45 UTC and 20:45 UTC. Only the GOES image at 17:45 UTC image is shown in
Figure 6. Within Figure 6, a small red box (approximately 15 X 15 kin) is annotated for
each image to show the area where the representative AOD value was extracted for that
time. This value was then compared to the sampled AOD of the nearby AERONET site
(indicated by a red dot). Determining the representative AOD value from the NOAA-16-
generated AOD field was relatively easy because there were little or no variations within
the red box. In contrast, obtaining the representative AOD from the noisy GOES-
generated AOD field was oftentimes far more difficult, especially during the later times
during the study period. Therefore, a technique to standardize the extraction of the
representative AOD from both AVHRR and GOES data was developed and is described
next.
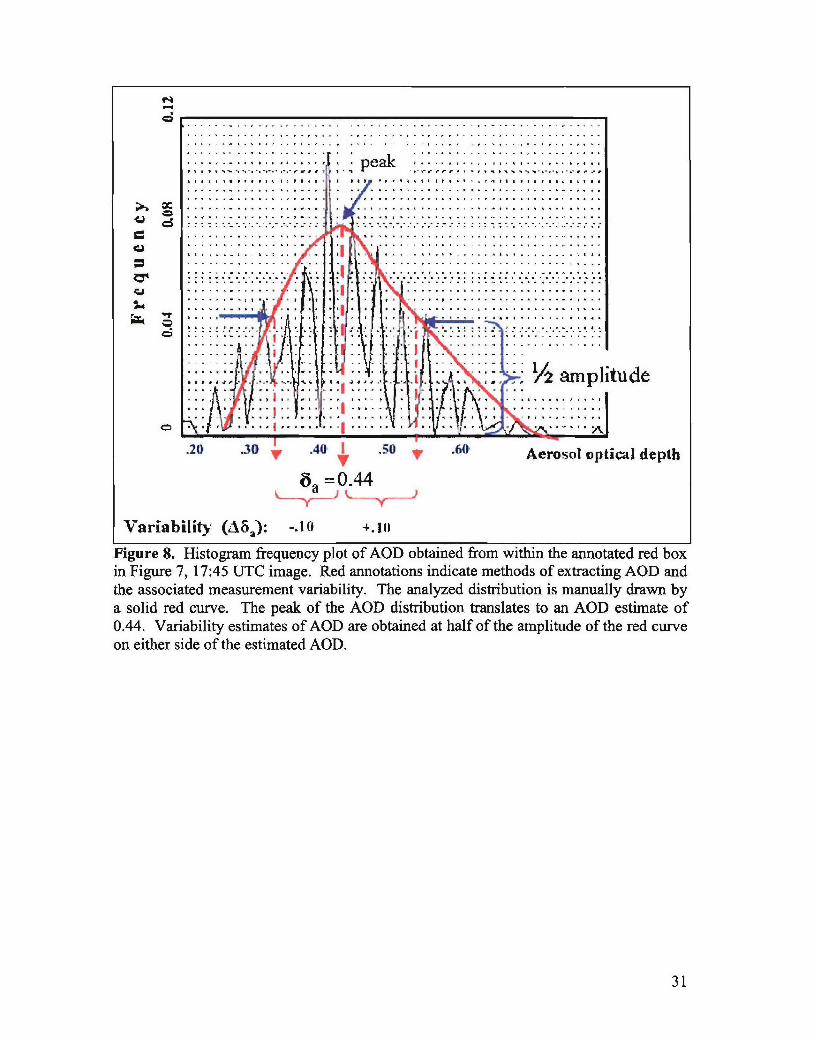
An example of the AOD extraction process is displayed in Figure 8. The
histogram frequency plot was generated from within the red box in the 17:45 UTC panel
in Figure 6. First, a solid red curve was manually drawn, representing the approximating
curve of the frequency distribution of AOD. Next, the peak of the distribution was
identified and translated to an AOD value of-0.44. An estimate of the variability of
AOD was then determined by locating the half-amplitude of the curve, on either side of
the peak (blue arrows). In this case, the variability about the AOD estimate was
11
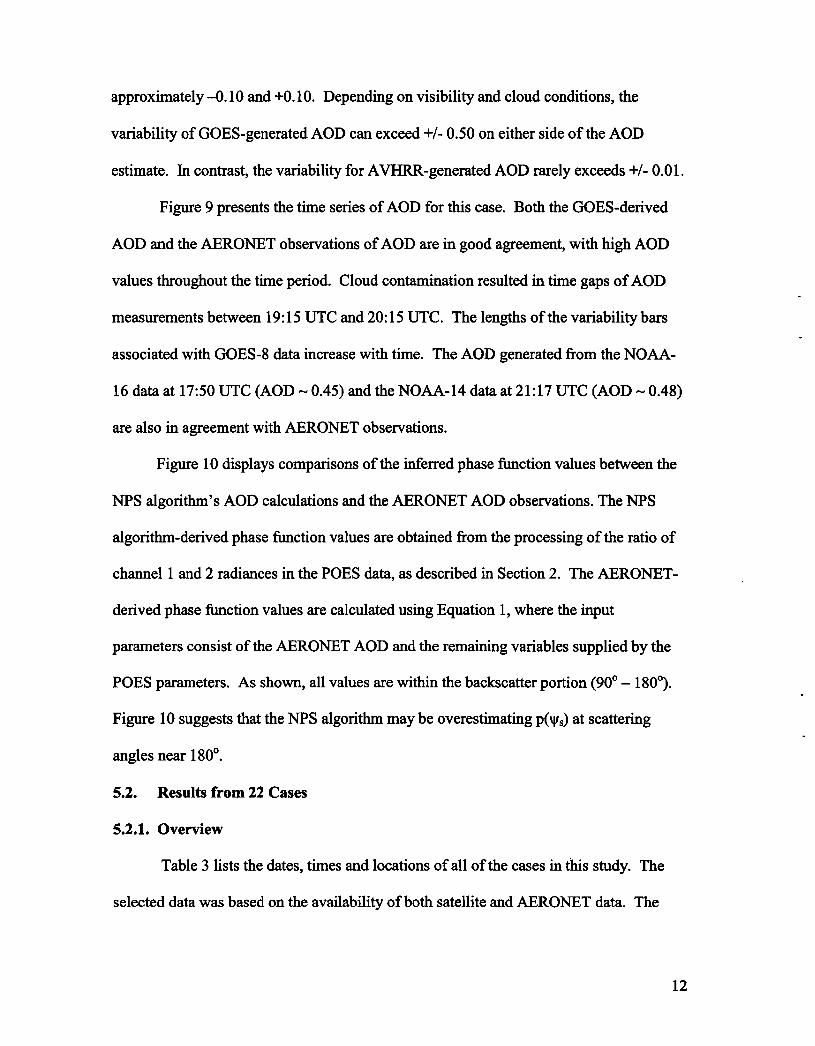
approximately -0.10 and +0.10. Depending on visibility and cloud conditions, the
variability of GOES-generated AOD can exceed +/- 0.50 on either side of the AOD
estimate. In contrast, the variability for AVHRR-generated AOD rarely exceeds +/- 0.01.
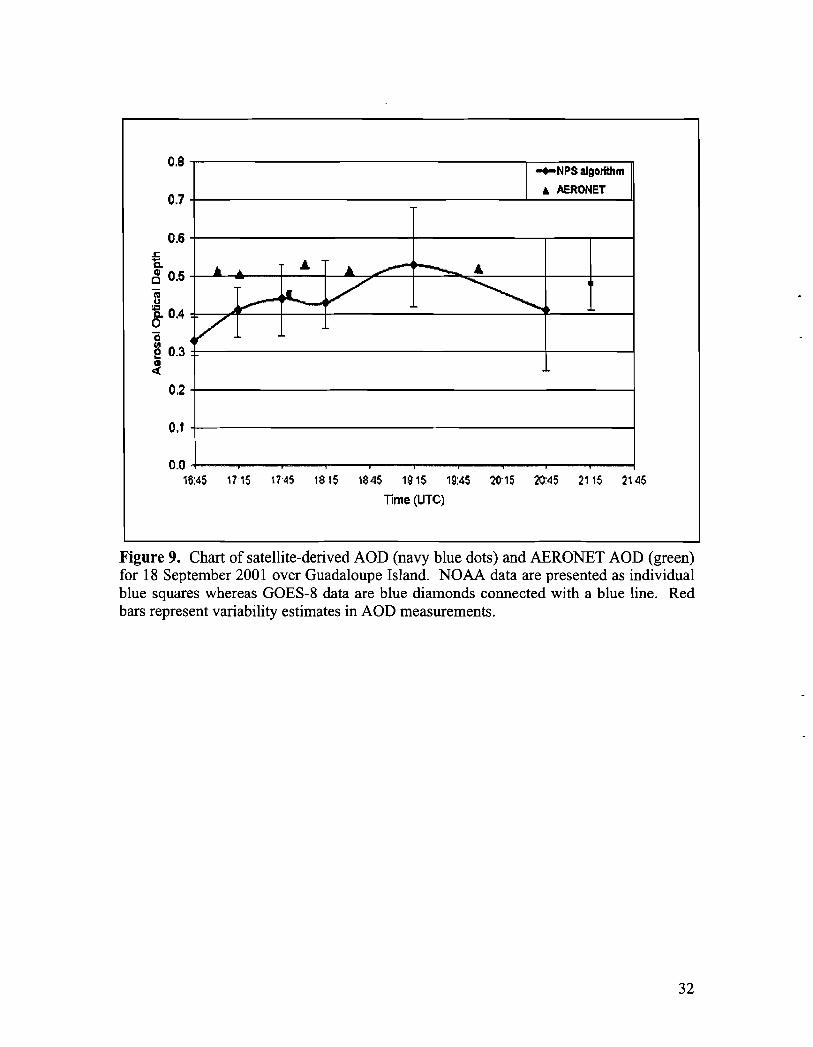
Figure 9 presents the time series of AOD for this case. Both the GOES-derived
AOD and the AERONET observations of AOD are in good agreement, with high AOD
values throughout the time period. Cloud contamination resulted in time gaps of AOD
measurements between 19:15 UTC and 20:15 UTC. The lengths of the variability bars
associated with GOES-8 data increase with time. The AOD generated from the NOAA-
16 data at 17:50 UTC (AOD - 0.45) and the NOAA-14 data at 21:17 UTC (AOD - 0.48)
are also in agreement with AERONET observations.
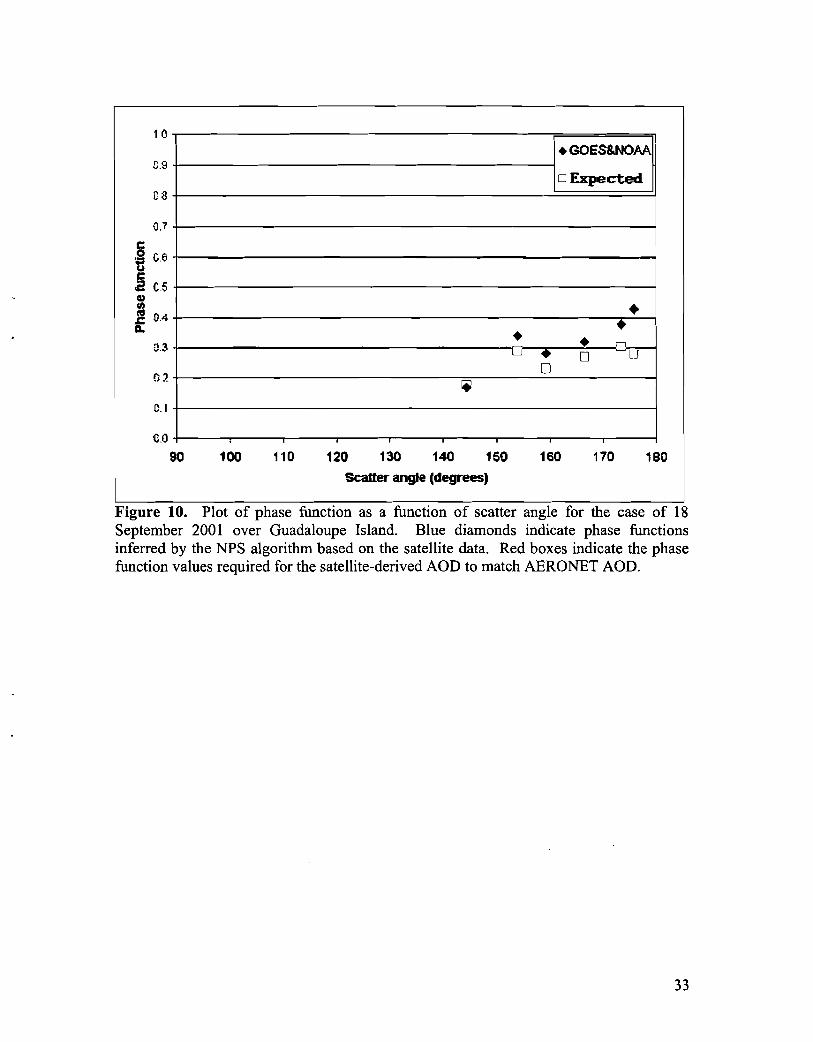
Figure 10 displays comparisons of the inferred phase function values between the
NPS algorithm's AOD calculations and the AERONET AOD observations. The NPS
algorithm-derived phase function values are obtained from the processing of the ratio of
channel 1 and 2 radiances in the POES data, as described in Section 2. The AERONET-
derived phase function values are calculated using Equation 1, where the input
parameters consist of the AERONET AOD and the remaining variables supplied by the
POES parameters. As shown, all values are within the backscatter portion (90' - 1800).
Figure 10 suggests that the NPS algorithm may be overestimating p(xVs) at scattering
angles near 1800.
5.2. Results from 22 Cases
5.2.1. Overview
Table 3 lists the dates, times and locations of all of the cases in this study. The
selected data was based on the availability of both satellite and AERONET data. The
12
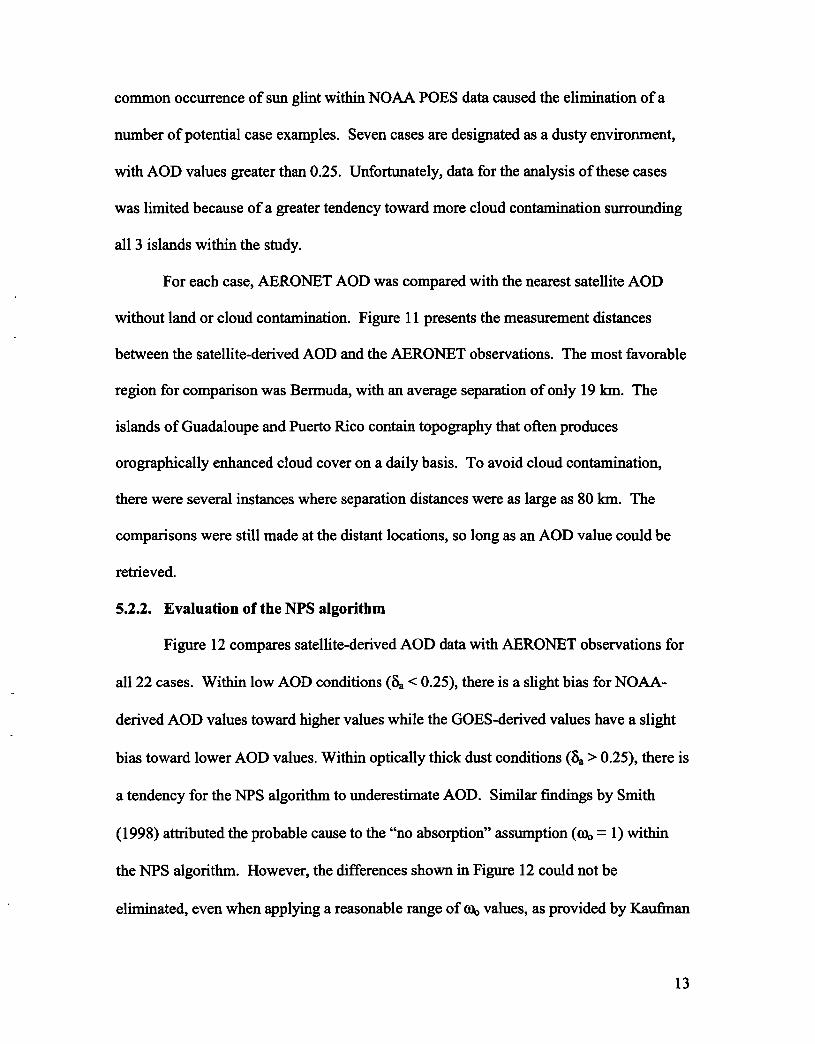
common occurrence of sun glint within NOAA POES data caused the elimination of a
number of potential case examples. Seven cases are designated as a dusty environment,
with AOD values greater than 0.25. Unfortunately, data for the analysis of these cases
was limited because of a greater tendency toward more cloud contamination surrounding
all 3 islands within the study.
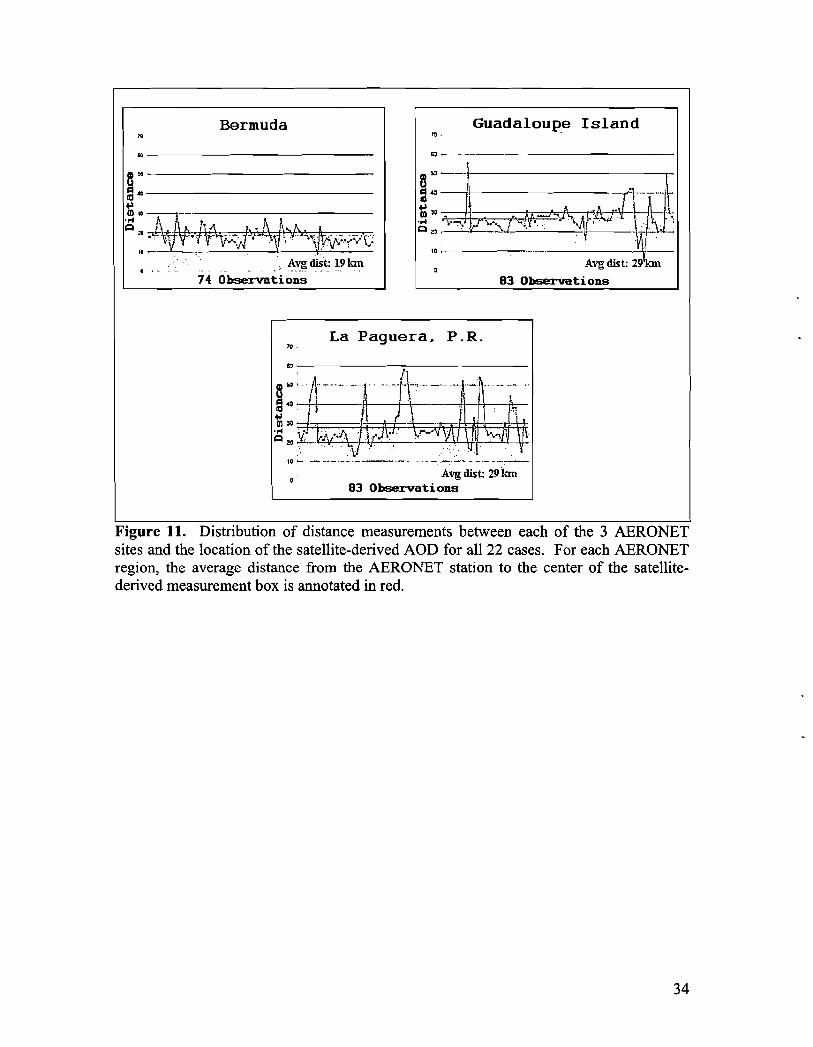
For each case, AERONET AOD was compared with the nearest satellite AOD
without land or cloud contamination. Figure 11 presents the measurement distances
between the satellite-derived AOD and the AERONET observations. The most favorable
region for comparison was Bermuda, with an average separation of only 19 kmn. The
islands of Guadaloupe and Puerto Rico contain topography that often produces
orographically enhanced cloud cover on a daily basis. To avoid cloud contamination,
there were several instances where separation distances were as large as 80 kIn. The
comparisons were still made at the distant locations, so long as an AOD value could be
retrieved.
5.2.2. Evaluation of the NPS algorithm
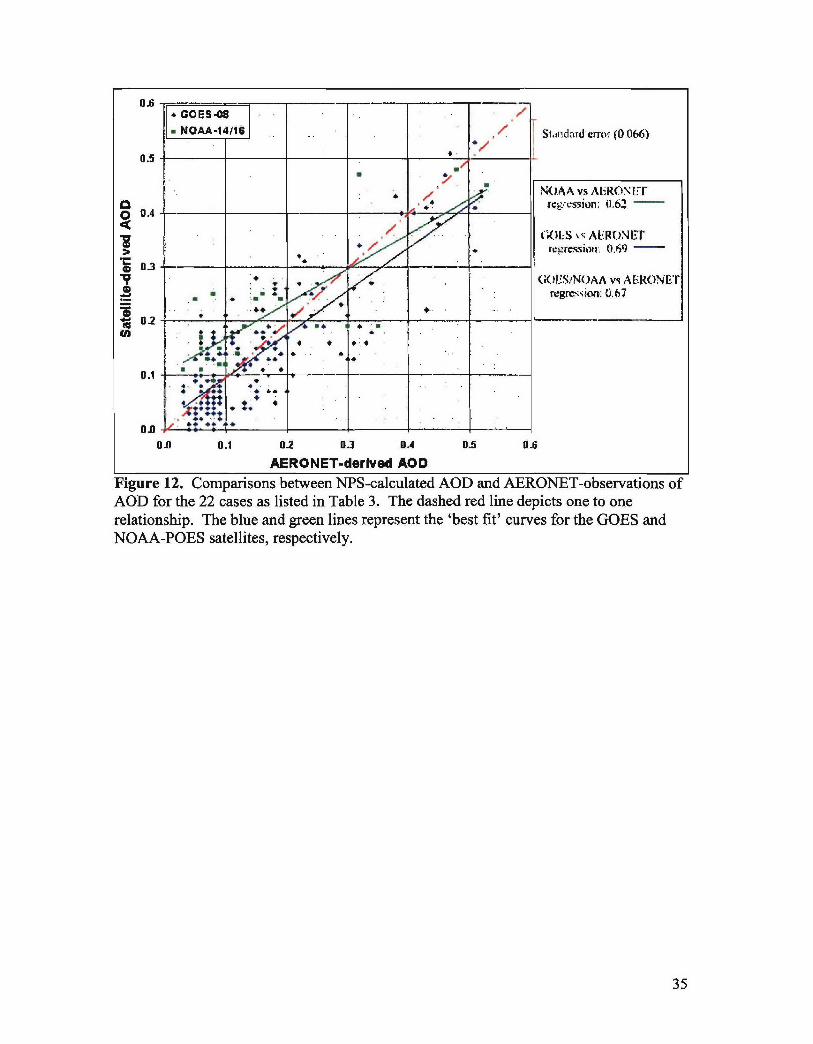
Figure 12 compares satellite-derived AOD data with AERONET observations for
all 22 cases. Within low AOD conditions (8a < 0.25), there is a slight bias for NOAA-
derived AOD values toward higher values while the GOES-derived values have a slight
bias toward lower AOD values. Within optically thick dust conditions (8a > 0.25), there is
a tendency for the NPS algorithm to underestimate AOD. Similar findings by Smith
(1998) attributed the probable cause to the "no absorption" assumption (aco = 1) within
the NPS algorithm. However, the differences shown in Figure 12 could not be
eliminated, even when applying a reasonable range of oo values, as provided by Kaufman
13
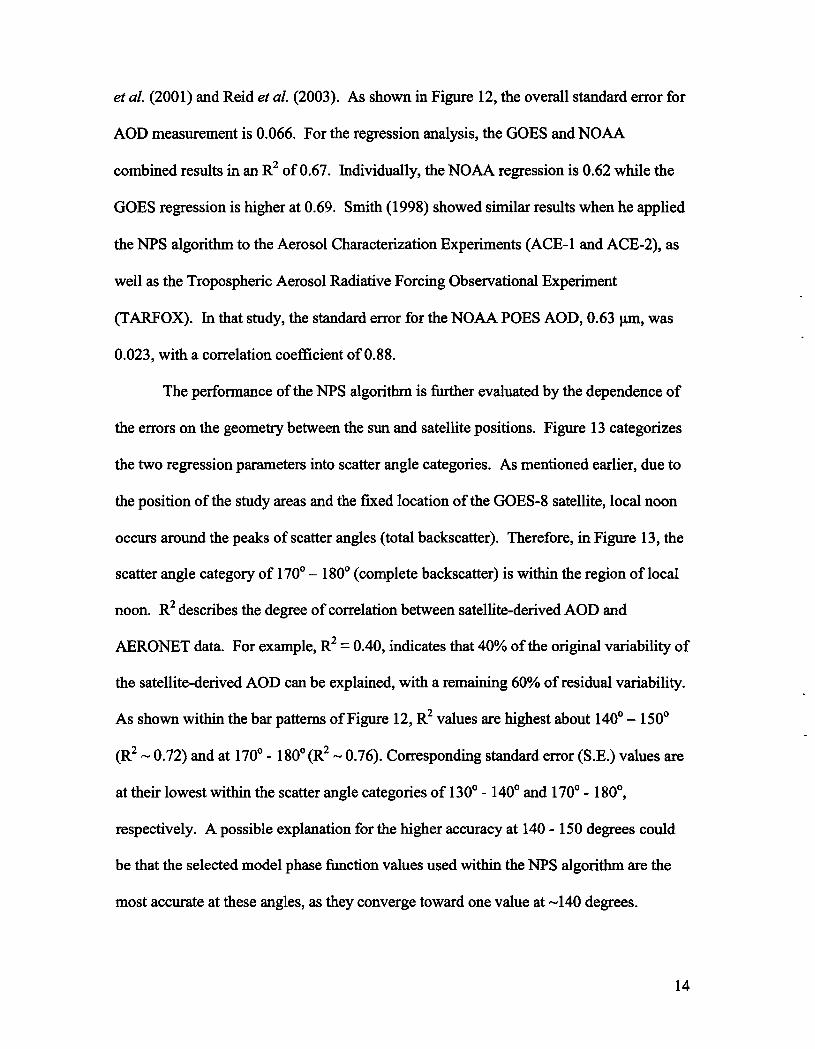
et aL (2001) and Reid et al. (2003). As shown in Figure 12, the overall standard error for
AOD measurement is 0.066. For the regression analysis, the GOES and NOAA
combined results in an R2 of 0.67. Individually, the NOAA regression is 0.62 while the
GOES regression is higher at 0.69. Smith (1998) showed similar results when he applied
the NPS algorithm to the Aerosol Characterization Experiments (ACE-I and ACE-2), as
well as the Tropospheric Aerosol Radiative Forcing Observational Experiment
(TARFOX). In that study, the standard error for the NOAA POES AOD, 0.63 gim, was
0.023, with a correlation coefficient of 0.88.
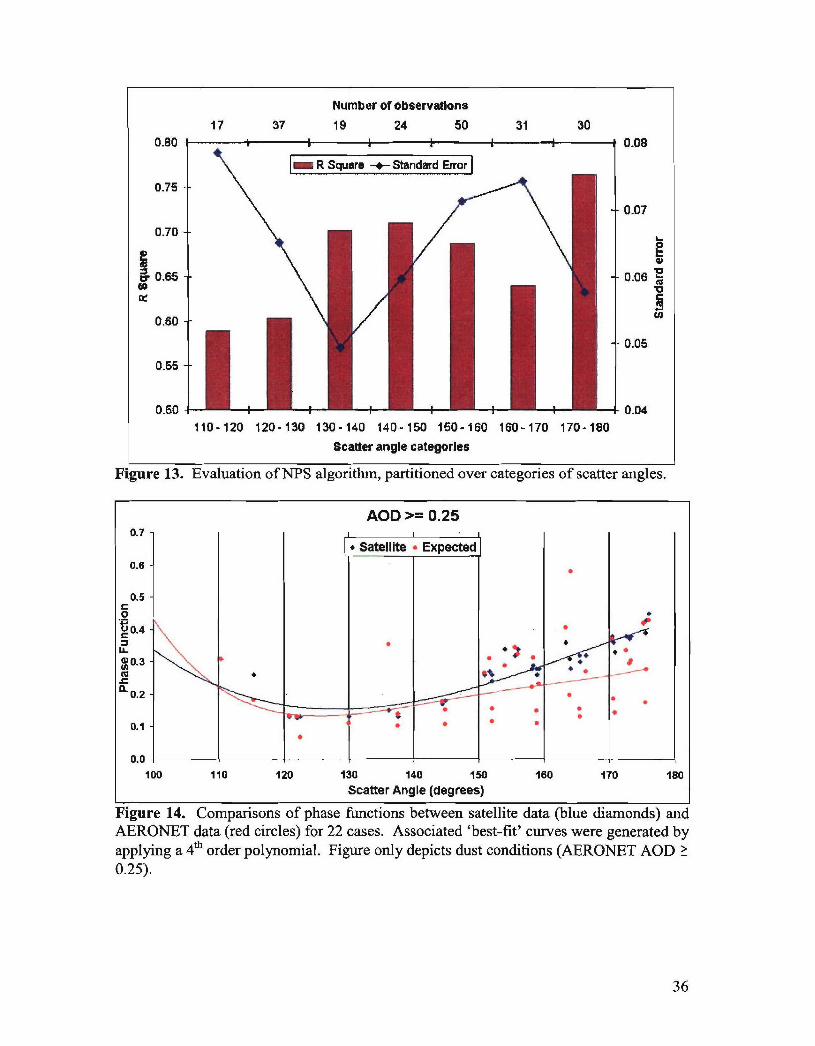
The performance of the NPS algorithm is further evaluated by the dependence of
the errors on the geometry between the sun and satellite positions. Figure 13 categorizes
the two regression parameters into scatter angle categories. As mentioned earlier, due to
the position of the study areas and the fixed location of the GOES-8 satellite, local noon
occurs around the peaks of scatter angles (total backscatter). Therefore, in Figure 13, the
scatter angle category of 1700 - 1800 (complete backscatter) is within the region of local
noon. R2 describes the degree of correlation between satellite-derived AOD and
AERONET data. For example, R2 = 0.40, indicates that 40% of the original variability of
the satellite-derived AOD can be explained, with a remaining 60% of residual variability.
As shown within the bar patterns of Figure 12, R2 values are highest about 1400 - 1500
(R2 - 0.72) and at 1700 - 1800 (R2 - 0.76). Corresponding standard error (S.E.) values are
at their lowest within the scatter angle categories of 1300 - 1400 and 1700 - 1800,
respectively. A possible explanation for the higher accuracy at 140 - 150 degrees could
be that the selected model phase function values used within the NPS algorithm are the
most accurate at these angles, as they converge toward one value at -140 degrees.
14
Therefore, there are no aerosol size distribution selection errors at this scatter angle
provided the size distribution of the aerosol are well represented by the a priori models
used in NPS algorithm.
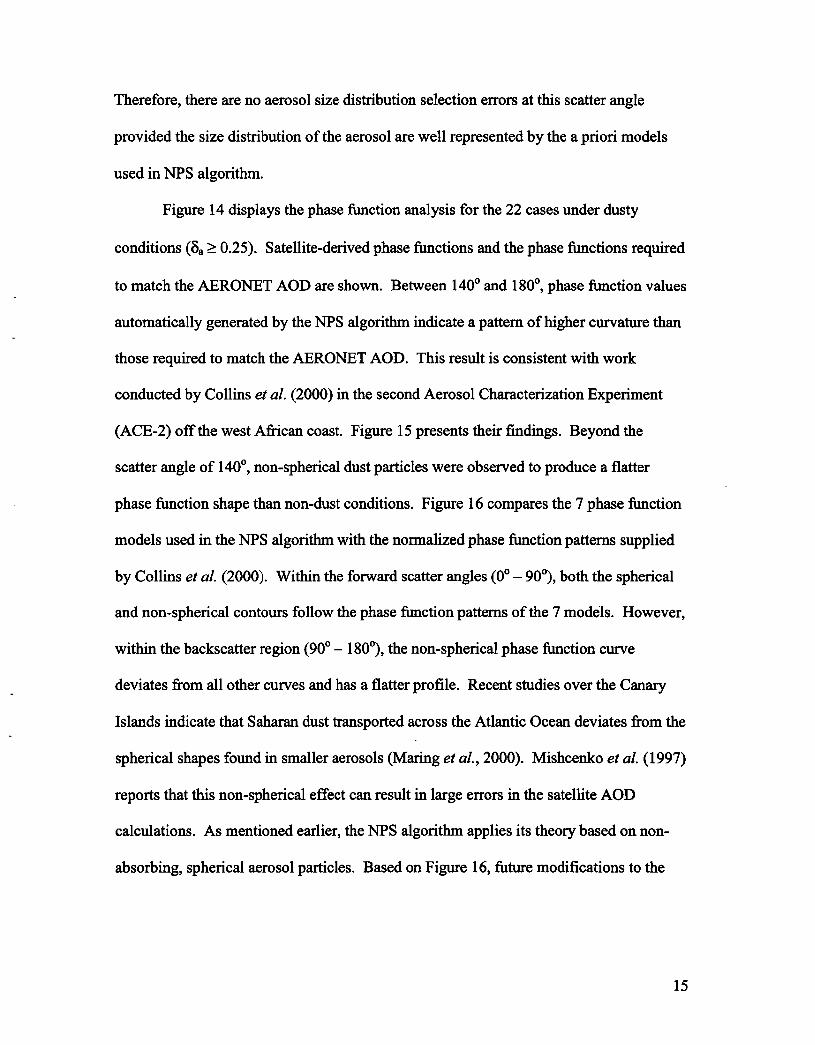
Figure 14 displays the phase function analysis for the 22 cases under dusty
conditions (5a > 0.25). Satellite-derived phase functions and the phase functions required
to match the AERONET AOD are shown. Between 1400 and 1800, phase function values
automatically generated by the NPS algorithm indicate a pattern of higher curvature than
those required to match the AERONET AOD. This result is consistent with work
conducted by Collins et al. (2000) in the second Aerosol Characterization Experiment
(ACE-2) off the west African coast. Figure 15 presents their findings. Beyond the
scatter angle of 140', non-spherical dust particles were observed to produce a flatter
phase function shape than non-dust conditions. Figure 16 compares the 7 phase function
models used in the NPS algorithm with the normalized phase function patterns supplied
by Collins et al. (2000). Within the forward scatter angles (0' - 900), both the spherical
and non-spherical contours follow the phase function patterns of the 7 models. However,
within the backscatter region (900 - 1800), the non-spherical phase function curve
deviates from all other curves and has a flatter profile. Recent studies over the Canary
Islands indicate that Saharan dust transported across the Atlantic Ocean deviates from the
spherical shapes found in smaller aerosols (Maring et aL, 2000). Mishcenko et al. (1997)
reports that this non-spherical effect can result in large errors in the satellite AOD
calculations. As mentioned earlier, the NPS algorithm applies its theory based on non-
absorbing, spherical aerosol particles. Based on Figure 16, future modifications to the
15
NPS algorithm warrant the incorporation of a modified phase function profile for dust
conditions.
6. Conclusions
A radiative transfer algorithm (NPS algorithm) that estimates AOD within a
cloud-free maritime atmosphere was presented for the NOAA POES and GOES imagers.
This algorithm applies linearized, single-scatter theory with an estimate of bi-directional
surface reflectance. Durkee et al. (1991) and Durkee et al. (2000) relate the ratio of
channel 1 and 2 radiances of the AVHRR to a representative aerosol model over maritime
conditions. Then, based on the viewing geometry and the assumed aerosol model, the
algorithm assigns the phase function value from a lookup table. Then the GOES scheme
uses the same aerosol model for the nearest pixel both in space and time. The remaining
parameters used to calculate AOD are straightforward, as described in Equation 1.
Due to the unexpected post-launch degradation of signal strength, the GOES-8
visible radiance data required an additional calibration (Rao et al., 1999 and Rao and
Zhang, 1999). During the analysis period of this paper (July and September, 2001) signal
gain factors ranging from 1.727 during the first case study (July 27, 2001) through 1.740
during the last study (September 25, 2001) were applied to the GOES raw channel 1
albedo data. In addition, preliminary comparisons of AOD between GOES and NOAA,
and AERONET revealed that an additional GOES-8 channel 1 correction offset of-
5.5Wm"2 sr'lp n-1 was necessary.
To validate the NPS algorithm, retrieved AOD data was collected from 22 cases
during July and September of 2001 and compared to AERONET radiometers positioned
within 3 island locations of the western Atlantic Ocean. Overall, the comparison dataset
16
yields a correlation coefficient of 0.67 with a standard error of 0.07. Within higher AOD
cases, the general trend was for the NPS algorithm to produce AOD values that under-
estimate AERONET-observed conditions. Attempts to vary the single scatter albedo (o0o)
could not explain the discrepancies. When related to scatter angles, these AOD
calculations performed best within the backscatter angle ranges of 1300 - 1400 and 1700 -
1800.
A major part of the uncertainty to the AOD processing is the proper selection of
the scattering phase function. The AOD results generated from GOES data assumed that
the AVHRR-determined aerosol model was unchanging throughout the entire time
period, which might last as long as 8 hours. More confidence was placed on GOES-
generated AOD results nearer in time to the AVHRR AOD retrieved.
Between the scatter angles of 1400 through 1800, the phase function required to
match the AERONET observations was flatter than that produced by the NPS algorithm.
This fitted phase function profile is supported by Collins et al. (2000) for non-spherical
dust aerosols.
Overall, the NPS AOD algorithm performed reasonably well (compared to other
AOD products) as a tool in assessing global climatological parameters. The standard
error values fall well within the noise range for collecting information about parameters
in the earth's radiation budget studies. However, users would be greatly cautioned in
applying the output from the NPS AOD algorithm toward more sensitive applications
such as visibility assessments in military tactical decision aids.
Acknowledgements. We gratefully acknowledge the support of our research sponsors,
the Oceanographer of the Navy through the program office at PEO C41 & Space PMW-
17
150 (PE-0603207N). We would also wish to thank the following individuals: Mr. Kurt
Nielsen of NPS and Dr. Robert Wade of Science Applications International Corporation
(SAIC) for their support in various satellite processing algorithms, Mr. Brent Holben and
Ms. Rose Petit from AERONET for providing us with sun photometer data, Mr. Norman
Kuring of NASA/Goddard Space Flight Center for providing SeaWiFs images, Dr.
Jeffrey Reid from NRL for his insight into Saharan dust properties, and finally to Mr.
Jeffrey Hawkins and Dr. Joseph Turk from NRL for providing us with a variety of
satellite-related resources. Finally, we want to thank NRL for the time allotment and
funding of this research effort through the Edison Memorial Graduate Training Program.
18
LIST OF REFERENCES
Brown, B. B., 1997: Remote measurement of aerosol optical properties using the NOAAPOES AVHRR and GOES Imager during TARFOX. M.S. Thesis, Naval PostgraduateSchool, Monterey, CA, 73 pp.
Charlson, R. J., S. E. Swartz, J. M. Hales, R. D. Cess, J. A. Coakley, Jr., J. E. Hansen andD. J. Hoffman, 1992: Climate forcing by anthropogenic aerosols. Science, 255, 423-430.
Chiapello, I., J. M. Prospero, J. R. Herman and N. C. Hsu, 1999: Detection of mineraldust over the North Atlantic Ocean and Africa with the Numbus 7 TOMS. J Geophys.Res., 104, 9277-9291.
Collins, D. R., H. H. Jonsson, J. H. Seinfeld, R. C. Flagan, S. Gass6, D. A. Hegg, P. B.Russell, B. Schmid, J. M. Livingston, E. Ostr6m, K. J. Noone, L. M. Russell and J. P.Putaud, 2000: In situ aerosol -size distributions and clear-column radiative closureduring ACE-2. Tellus, 52B, 498-525.
Durkee, P. A., F. Pfeil, E. Frost, and R. Shema, 1991: Global analysis of aerosol particlecharacteristics. Atmos. Env., 25A, 2457-2471.
Durkee, P. A., K. E. Nielsen, P. J. Smith, P. B. Russell, B. Schmid, J. M. Livingston, B.N. Holben, C. Tomasi, V. Vitale, D. Collins, R. C. Flagan, J. H. Seinfeld, K. J. Noone, E.Ostr6m, S. Gasso, D. Hegg, L. M. Russell, T. S. Bates and P. K. Quinn, 2000: Regionalaerosol optical depth characteristics from satellite observations: ACE-1, TARFOX andACE-2 results. Tellus, 52B, 484-497.
Higurashi, A. and T. Nakajima, 1999: Development of a two channel aerosol retrievalalgorithm on global scale using NOAA/AVHRR. J. Atmos. Sci., 56, 924-94 1.
Higurashi, A. T., T. Nakajima, B. N. Holben, A. Smirnov, R. Frouin, and B. Chateret,1999: A study of global aerosol optical climatology with two channel AVHRR remotesensing. J. Climate, 13, 2011-2027.
Holben, B. N., T. F. Eck, I. Slutsker, D. Tanr6, J. P. Buis, A. Setzer, E. Vermote, J. A.Reagan, Y. J. Kaufman, T. Nakajima, F. Lavenu, I. Jankowiak, and A. Smirnov, 1998:AERONET - A federated instrument network and data archive for aerosolcharacterization. Remote Sens. Environ., 66, 1-16.
Huebert, B., T. Bates, P. Russell, G. Shi, Y. J. Kim, and K. Kawamura, 2003: Anoverview of ACE-Asia: strategies for quantifying the relationships between Asianaerosols and their climatic impacts. J. Geophys. Res. (in press).
Intergovernmental Panel on Climate Change (IPCC), 1996. Climate Change 1995, J. T.Houghton et al. (Eds.). Cambridge University Press, New York.
19
Kauffman, Y. J., D. Tanr6, 0. Dubovik, A. Karnieli, and L. A. Remer, 2001: Absorptionof sunlight by dust as inferred from satellite and ground-based remote sensing. Geophys.Res. Lett., 24, 1479-1482.
King, M. D., Y. J. Kaufman, D. Tanr6, and T. Nakajima, 1999: Remote sensing oftropospheric aerosols from space: past, present and future. Bull. Am. Meteor. Soc., 80,2229-2259.
Kuciauskas, A. P., 2002: Aerosol optical depth analysis with NOAA GOES and POES inthe western Atlantic. M.S. Thesis, Naval Postgraduate School, Monterey, CA, 81 pp.
Maring, H., D. L. Savoie, M. A. Izaguirre, C. McCormick, R. Arimoto, J. M. Prospero,and C. Pilinis, 2000: Aerosol physical and optical properties and their relationship toaerosol composition in the free troposphere at Izana, Tenerife, Canary Islands, duringJuly 1995, J. Geophys. Res., 105, 14677-14700.
Mischenko, M. I., L. D. Travis, R. A. Kahn, and R. A. West, 1997: Modeling phasefunctions for dust-like tropospheric aerosols using a shape mixture of randomly orientedpolydisperse spheroids, J. Geophys. Res., 102, 16831-16847.
Prospero, J.M., 1999: Long-term measurements of the transport of African mineral dustto the southeastern United States: Implications for regional air quality. J. Geophys. Res.,104, 15917-15927.
Rao, C. R. N. and J. Chen, 1995: Inter-satellite calibration linkages for the visiblechannels of the Advanced Very High Resolution Radiometer on the NOAA-7, -9, and -11. Int. J Rem. Sen., 16, 1931-1942.
Rao, C. R. N. and N. Zhang, 1999: Calibration of the visible channel of the GOESimages using the Advanced Very High Resolution Radiometer. Pre-print volume, 10thAtmospheric Radiation Conference (Madison, Wisconsin), 560-563.
Rao, C. R. N., C. J. Sullivan, and N. Zhang, 1999: Post-launch calibration ofmeteorological satellite sensors. Adv Space Res., 23, 1357-1365.
Reid, J. S., J. E. Kinney, D. L. Westphal, B. N. Holben, E. J. Welton, S. Tsay, D. P.Eleuterio, J. R. Campbell, S. A. Christopher, P. R. Colarco, H. H. Jonsson, J. M.Livingston, H. B. Maring, M. L. Meier, P. Pilewskie, J. M. Prospero, E. A. Reid, L. A.Remer, P. B. Russell, D. L. Savoie, A. Smimov, and D. Tanr6, 2003: Analysis ofmeasurements of Saharan dust by airborne and ground-based remote sensing methodsduring the Puerto Rico Dust Experiment (PRIDE), J. Geophys. Res. (in press).
Smith, P. J., 1998: Remote measurement of aerosol optical properties using the NOAAPOES AVHRR during ACE-l, TARFOX, and ACE-2. M.S. Thesis, Naval PostgraduateSchool, Monterey, CA, 58 pp.
20
Turner, R., 1973: Atmospheric effects in remote sensing. In Remote Sensing of the EarthResources, IL, 549-583, F. Shahrocki (ed.), University of Tennessee.
Twomey, S., M. Piepgrass and T. L. Wolfe, 1977: An assessment of the impact ofpollution on global cloud albedo. Tellus, 36B, 356-366.
Westphal, D. L., 2003: Real-time applications of a global multicomponent aerosol model,J. Geophys. Res., in press, 2003.
21
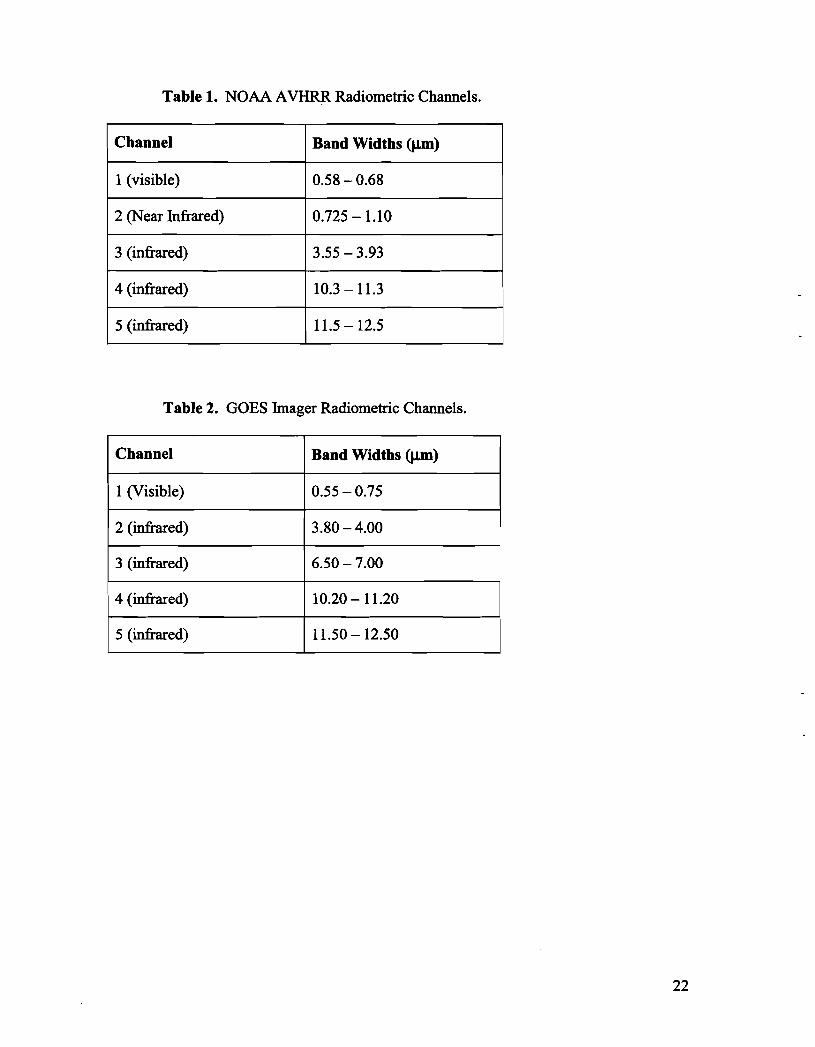
Table 1. NOAA AVHRR Radiometric Channels.
Channel Band Widths (jIm)
1 (visible) 0.58-0.68
2 (Near Infrared) 0.725 - 1.10
3 (infrared) 3.55-3.93
4 (infrared) 10.3-11.3
5 (infrared) 11.5-12.5
Table 2. GOES Imager Radiometric Channels.
Channel Band Widths (gim)
1 (Visible) 0.55 - 0.75
2 (infrared) 3.80 - 4.00
3 (infrared) 6.50 - 7.00
4 (infrared) 10.20 - 11.20
5 (infrared) 11.50-12.50
22
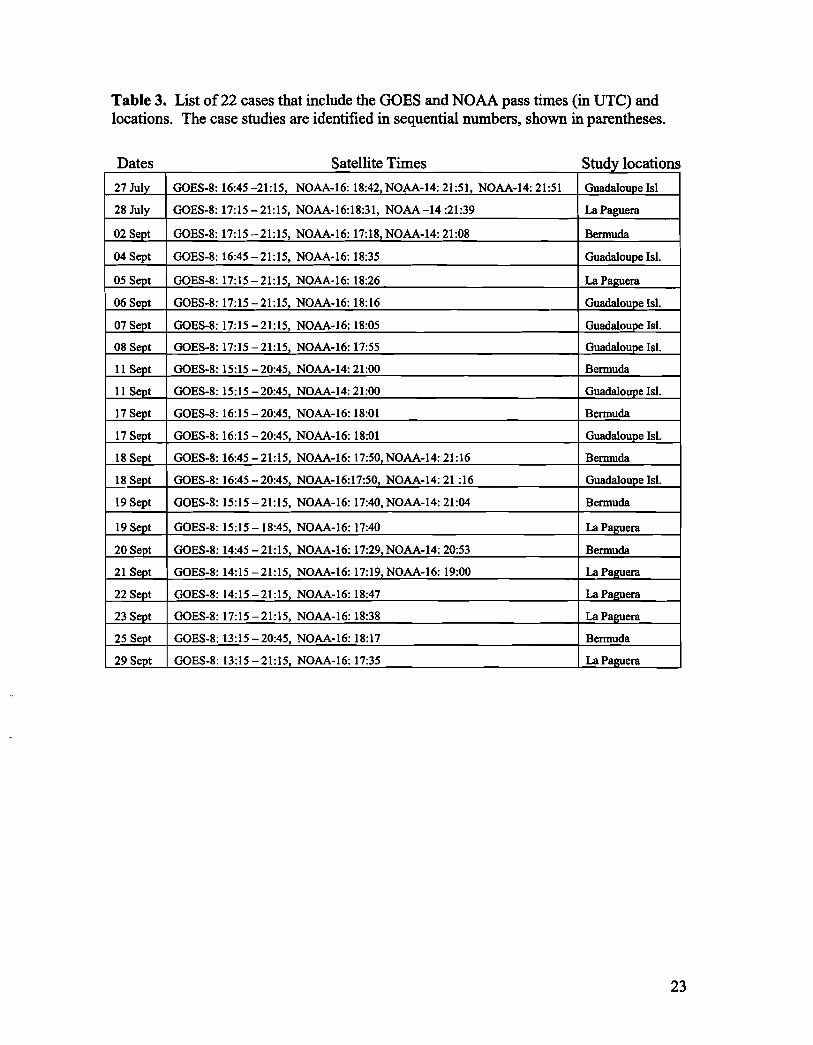
Table 3. List of 22 cases that include the GOES and NOAA pass times (in UTC) andlocations. The case studies are identified in sequential numbers, shown in parentheses.
Dates Satellite Times Study locations
27 July GOES-8:16:45 -21:15, NOAA-16: 18:42, NOAA-14: 21:51, NOAA-14:21:51 Guadaloupe Isl
28 July GOES-8:17:15 - 21:15, NOAA-16:18:31, NOAA-14:21:39 La Paguera
02 Sept GOES-8:17:15-21:15, NOAA-16: 17:18, NOAA-14:21:08 Bermuda
04 Sept GOES-8: 16:45-21:15, NOAA-16:18:35 Guadaloupe IsI.
05 Sept GOES-8: 17:15-21:15, NOAA-16:18:26 La Paguera
06 Sept GOES-8: 17:15-21:15, NOAA-16:18:16 Guadaloupe IsI.
07 Sept GOES-8: 17:15 - 21:15, NOAA-16:18:05 Guadaloupe IsI.
08 Sept GOES-8: 17:15 - 21:15, NOAA-16:17:55 Guadaloupe IsI.
11 Sept GOES-8: 15:15-20:45, NOAA-14:21:00 Bermuda
11 Sept GOES-8: 15:15-20:45, NOAA-14:21:00 Guadaloupe IsI.
17 Sept GOES-8: 16:15 - 20:45, NOAA-16:18:01 Bermuda
17 Sept GOES-8: 16:15 - 20:45, NOAA-16:18:01 Guadaloupe Isl.
18 Sept GOES-8: 16:45 - 21:15, NOAA-16: 17:50, NOAA-14:21:16 Bermuda
18 Sept GOES-8: 16:45 - 20:45, NOAA-16:17:50, NOAA-14: 21:16 Guadaloupe IsI.
19 Sept GOES-8:15:15-21:15, NOAA-16: 17:40, NOAA-14:21:04 Bermuda
19 Sept GOES-8: 15:15 - 18:45, NOAA-16:17:40 La Paguera
20 Sept GOES-8:14:45 -21:15, NOAA-16: 17:29,NOAA-14:20:53 Bermuda
21 Sept GOES-8:14:15-21:15, NOAA-16: 17:19, NOAA-16:19:00 La Paguera
22 Sept GOES-8: 14:15-21:15, NOAA-16:18:47 La Paguera
23 Sept GOES-8:17:15-21:15, NOAA-16:18:38 La Paguera
25 Sept GOES-8: 13:15-20:45, NOAA-16:18:17 Bermuda
29 Sept GOES-8: 13:15-21:15, NOAA-16:17:35 La Paguera
23
C C C
r Bez da
3N
__ __ ____ ___ ____ ON
La~algura
GuaCI&A pC) CC)
Figure 1. Map of the experimental region with locations of the AERONET stations.
24
-0 is 20 25; so
20PC
Radiances
Figure 2. Comparisons of radiance images and associated frequency of radiancehistograms between (a) GOES-8 and. (b) NOAA- 16 on 02 September 2001. Histogramswere developed from areas within red annotations. Radiances, as shown within the colorlegend and the histogram x axis, are in units of Wm 2srlpm-'.
25
40 'U*U U____
di N EU 6U aU
--- -- --- -- -- -- --- -- -- --- -- ----- --- - -- - 4--N--U -E - -, 4 - 1 - a--U - ---- - M-- -4 - -U .
a m M ',, S • m #i
N N!U NeuE EU NU
N N N B a maN
30 ------------- ', ---- - -------- --- ....--- .... .i- ....-- -i -... --- ---.-- ----------
* • ! *, ! ,.m ,, Um ,
-- - - --- -- - - --- --- - --- - - ----- i- .- -I -- -- - -- - ----- ------ E.- I -- -- -- -- --- -- U--- -- --
(P 9 ihtre t 5..•5 i , ,+
20 X ~ ~
Fiur 3. Copaisn of Chane I rdacsbt we iO S- an [] i A • / ' , , 6, .
= u.., ,E,, EU.,,, U, ::
c o wit f /Ohin the 26.0, -
10 ,,,
, • ,~~~~~ " "•••9."••" ""• ," "'
', ,GOE Channeli I Ii Rad liancI e liII
Figure... ........ 3..omprionsofChane 1 radiancsbetwee GOE....and NO. 1..Raine r i nt fWm'm)O:gesaeidcae eino hig desiyOfmlipl curne.Baksldln ersnsoet n eainhpadrddse
linereprsent 'bs-ft reaiosi bewe OSadE.Reseikrpeetcenter... , ....of..,.mass... ...point .......within.........the..... data......
ii : •i i 26
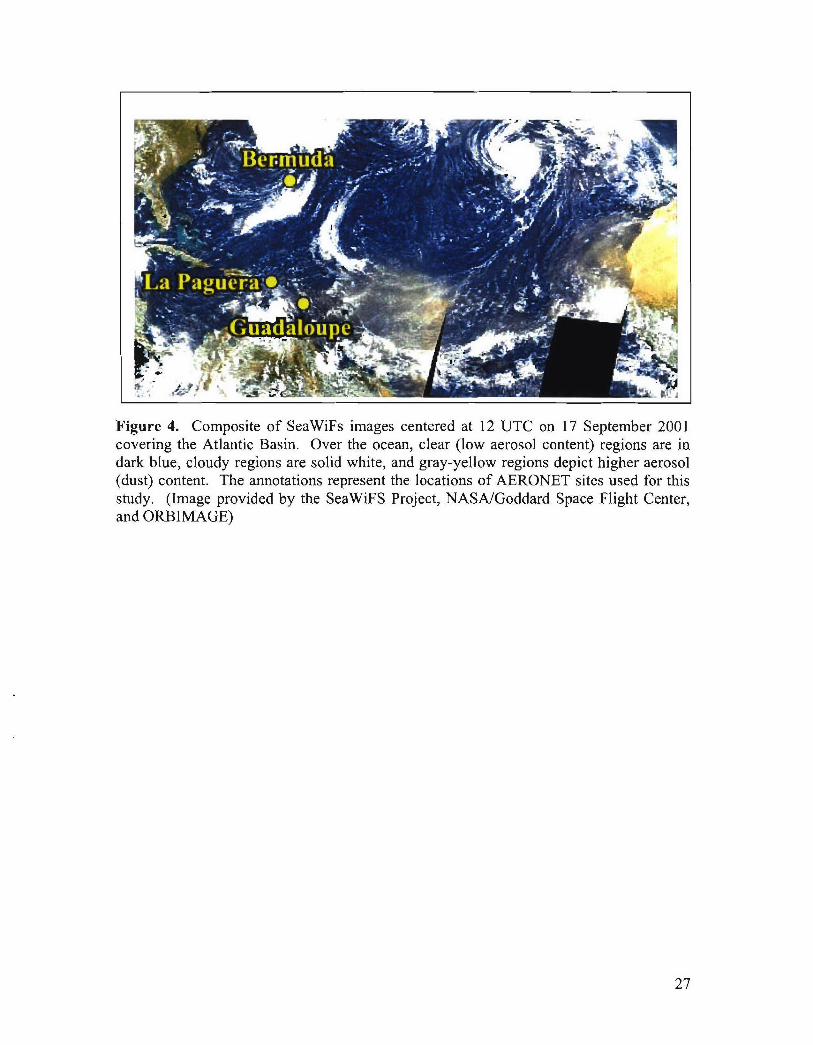
Figure 4. Composite of SeaWiFs images centered at 12 UTC on 17 September 2001covering the Atlantic Basin. Over the ocean, clear (low aerosol content) regions are indark blue, cloudy regions are solid white, and gray-yellow regions depict higher aerosol(dust) content. The annotations represent the locations of AERONET sites used for thisstudy. (Image provided by the SeaWiFS Project, NASA/Goddard Space Flight Center,and ORBIMAGE)
27
T80 -7W Ip0_ -50 -49 _e--
355O
'ea vy
Dust Levels
Figure 5. NAAPS display of significant dust levels and 850 mb winds from NOGAPSover the Atlantic Ocean basin for 18 September 2001, 18:00 UTC. (Courtesy of Dr.Douglas L. Westphal at NRL)
28
. 101
Figure 6. GOES-8 visible image for 18 September 2000 at 17:15 U3TC. The annotatedbox surrounds the region of Guadaloupe Island. The area of dust aerosol is alsoannotated.
29
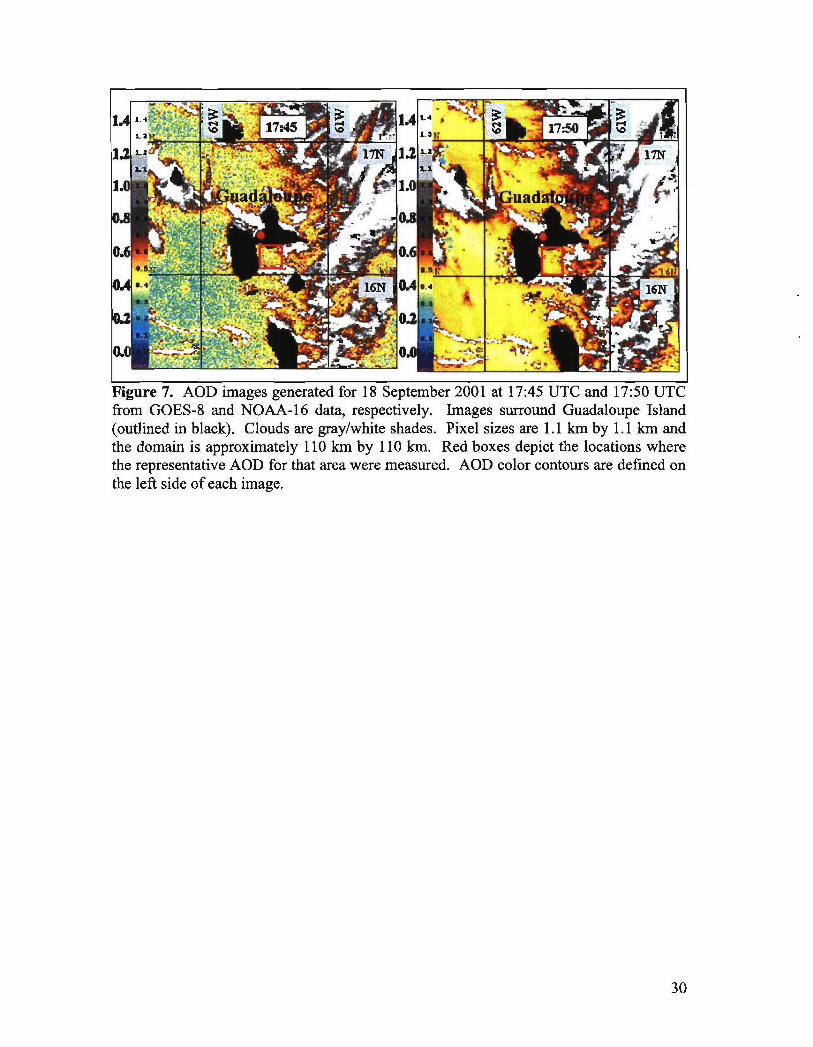
Figure 7. AOD iages generated for 18 September 2001 at 17:45 UTC and 17:50 UTC
from GOES-8 and NOAA-16 data, respectively. Images surround Guadaloupe Island(outlined in black). Clouds are gray/white shades. Pixel sizes are 1.1 km by 1.1 km andthe domain is approximately 110 km by 110 km. Red boxes depict the locations wherethe representative AOD for that area were measured. AOD color contours are defined onthe left side of each image.
30
peak,€,*1
.. . ..... ..... .... . . p a . . . . . . . . . . . . .
& . . . . . . • [ ... .... ... . . . .. . ... .. . . . . . . . . . .s
0C .. .. .i -:.:::::? . . . . @ - ?-- ! 1! .. 1iii?? iii?
:: -...............S.. .. ... . . ..
, .1.. .......... .
.20 . o 0 , .Al.o 6. 1 .50 v .60 Aerosol optical depth
V43a =0.44
Variability (AS,): -.10 4.101
Figure 8. Histogram frequency plot of AOD obtained from within the annotated red boxin Figure 7, 17:45 UTC image. Red annotations indicate methods of extracting AOD andthe associated measurement variability. The analyzed distribution is manually drawn bya solid red curve. The peak of the AOD distribution translates to an AOD estimate of0.44. Variability estimates of AOD are obtained at half of the amplitude of the red curveon either side of the estimated AOD.
31
0.8 -
0.7-• AERONET
0.6-
S0.3
0.2
0.1
0.016:45 17,15 1745 1815 1845 1915 19:45 20"15 20:45 2115 214$
Time (UTC)
Figure 9. Chart of satellite-derived AOD (navy blue dots) and AERONET AOD (green)for 18 September 2001 over Guadaloupe Island. NOAA data are presented as individualblue squares whereas GOES-8 data are blue diamonds connected with a blue line. Redbars represent variability estimates in AOD measurements.
32
10• GO ES&NOAA
F- Expected
0.7
0QC
0 4'IL
•0.2 1 2D
o. 1
0.0 ........ I
90 100 110 120 130 140 160 160 170 180
Scatter angle (degrees)
Figure 10. Plot of phase function as a function of scatter angle for the case of 18September 2001 over Guadaloupe Island. Blue diamonds indicate phase functionsinferred by the NPS algorithm based on the satellite data. Red boxes indicate the phasefunction values required for the satellite-derived AOD to match AERONET AOD.
33
Bermuda Guadaloupe Island
:1P ...." '" Avgl disit: 19Ia %gds:Ao - . - • : 'i ... . . . . . . ..: . ....... . . . .. .
74 Observations 83 Observations
La Paguerao P.R.20 ýý .4 Ak
A A-gg dist: 29 !a.
83 Observations
Figure 11. Distribution of distance measurements between each of the 3 AERONETsites and the location of the satellite-derived AOD for all 22 cases. For each AERONETregion, the average distance from the AERONET station to the center of the satellite-derived measurement box is annotated in red.
34
0. & GOES-8. /l
w NOAA-14/16 / Standardremrr (0,066)
0.5 V/2/'" * "• ' /NOAA vs AIFRON 1"."
0 a.4 regression: 0.62 N
GOLS %s ATRONEF0.3•.rcr-sot:06
GOL'S/NOAA vs AURONEF.6D .,regression: 0,67i _____"_.___ ______
0.24
0.0 / ? : '" ":-
0.0 0.1 0.2 03 0.4 0.5 0.6
AERONET-derived AODFigure 12. Comparisons between NPS-calculated AOD and AERONET-observations ofAOD for the 22 cases as listed in Table 3. The dashed red line depicts one to onerelationship. The blue and green lines represent the 'best fit' curves for the GOES andNOAA-POES satellites, respectively.
35
Number of observations
17 37 19 24 50 31 300.80 1 1 1 1 0.08
-m R Square -s- Standard Error
0.75 '
0.07
0.70/%E I-
E. 0.65 0.06 '
0.60
- 0.06
0.55
0.50 0.04
110-120 120-130 130-140 140-150 160-160 160-170 170-180
Scatter angle categories
Figure 13. Evaluation of NPS algorithm, partitioned over categories of scatter angles.
AOD >= 0.250.7 -
. Satellite * Expected
0.6
0.5--.o
150.4
LL
00.3-
0.12
0.1
100 110 120 130 140 150 160 170 180
Scatter Angle (degrees)
Figure 14. Comparisons of phase fuinctions between satellite data (blue diamonds) andAERONET data (red circles) for 22 cases. Associated 'best-fit' curves were generated byapplying a 4th order polynomial. Figure only depicts dust conditions (AERONIET AOD Ž0.25).
36
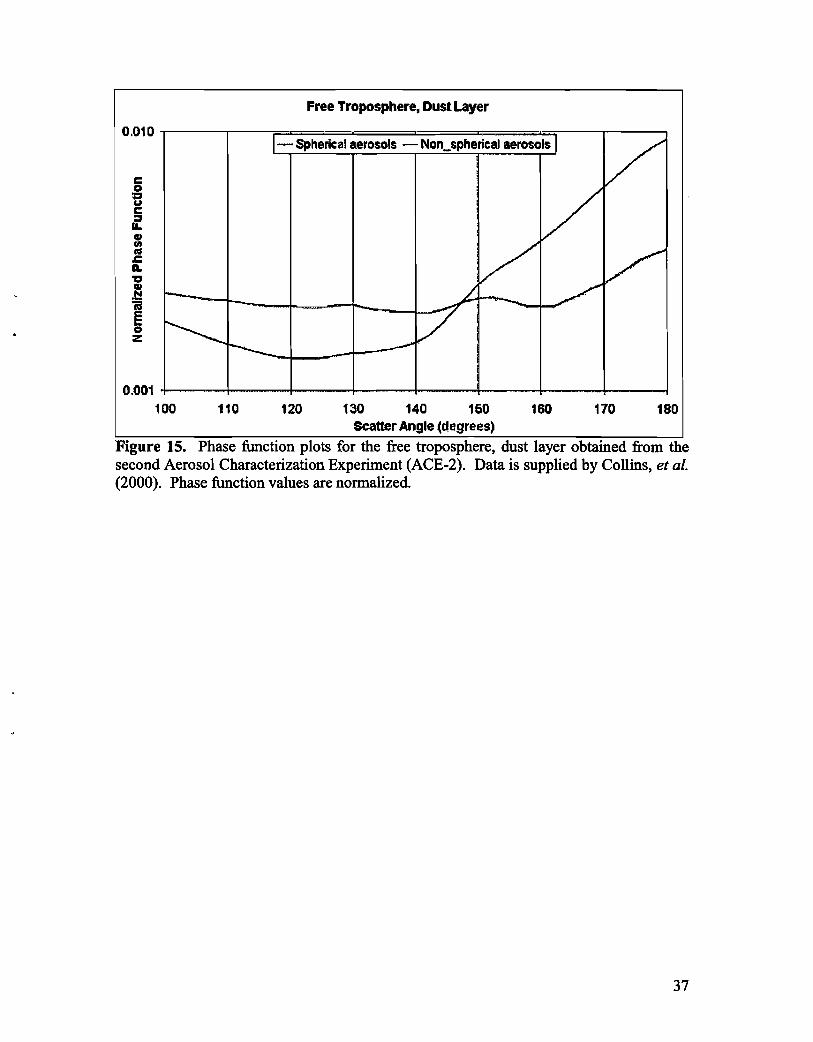
Free Troposphere, Dust Layer0,010 ... ..
0.010K-- Spherical aerosols - Nornspherical aersolsI
0C
0to
0.001100 110 120 130 140 150 160 170 180
Scatter Angle (degrees)
Figure 15. Phase function plots for the free troposphere, dust layer obtained from thesecond Aerosol Characterization Experiment (ACE-2). Data is supplied by Collins, et al.(2000). Phase function values are normalized.
37
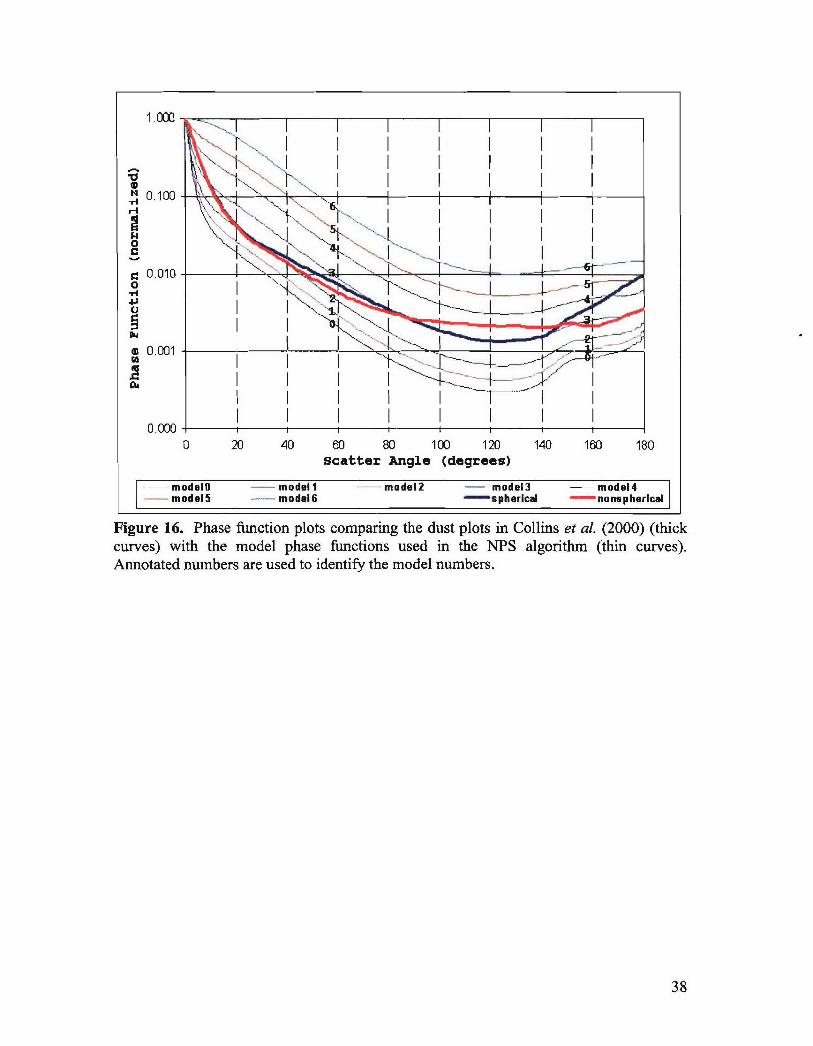
1. 000
0
~4
*0.000II I I I I I I
0 ,000 I I I I
0 20 40 60 80 100 120 140 160 180Scatter Angle (degrees)
-- modelO model1 - model2 model3 model4model5 - modelS6 spherical inonhpherlcal
Figure 16. Phase function plots comparing the dust plots in Collins et al (2000) (thickcurves) with the model phase functions used in the NPS algorithm (thin curves).Annotated numbers are used to identify the model numbers.
38