Embed Size (px)
Citation preview

Copyright © ESI Group, 2009. All rights reserved. Copyright © ESI Group, 2012. All rights reserved. 1
Aeronautic seat solution
User-friendliness & Multi domain optimization
August 2012 / Wichita
Christophe Jacob, PhD

Copyright © ESI Group, 2012. All rights reserved. 2
USER-FRIENDLINESS
End-to-end virtual prototyping for seats

Copyright © ESI Group, 2012. All rights reserved.
One compute model / One process
3
The Dummy compute model: Hybrid II Ready for automation
Equipped with standard belts
The Process Positioning
Pitch & Roll
Relaxation
Sled test
One click solution All the steps can be chained
VIRTUAL SEAT PROTOTYPING VIRTUAL PERFORMANCE
Safety

Copyright © ESI Group, 2012. All rights reserved. 4
Positioning phase Can predict a final position or reproduce experiment
Find position
The dummy is pulled by bars in order to reproduce the gravity effects in a very short time (150ms)
The so found position respects gravity equilibrium and can be used for sled test of pitch&roll
Here, the pelvis is just pulled downward and backward while feet are pulled to predefined positions
Force position
While performing a sled test experiment, it is common to use a 3D measurement device to get the exact location of some points of the seat and dummy
In this case, it is possible to pull the dummy points toward these locations (yellow targets), keeping reasonable efforts
Here, the pelvis, knees, head and ankles are pulled toward point measured during experiment tests. Like this the simulation is as near as possible from the experimental conditions
VIRTUAL SEAT PROTOTYPING VIRTUAL PERFORMANCE
Safety

Copyright © ESI Group, 2012. All rights reserved. 5
Pitch & Roll
It is possible to reproduce in a fast simulation the Pitch&Roll loads
With the belted dummy in its seat The position when determined in the previous phase (find or force position)
From the positioning phase, pre-stresses in the dummy and in the seat are retrieved
For frontal or aft sled tests The center of Pitch can be either on the front anchors either on the rear anchor
The dummy moves together with the seat
It becomes easy to determine the worse Pitch&Roll situation
Just change the sign of the angle (+/- 10° for both pitch and roll movements)
Easy to set-up
Changing orientation of Pitch&Roll take less than 2 minutes
Then the simultation takes around 2~3 hours
VIRTUAL SEAT PROTOTYPING VIRTUAL PERFORMANCE
Safety
Copyright © ESI Group, 2012. All rights reserved. 6
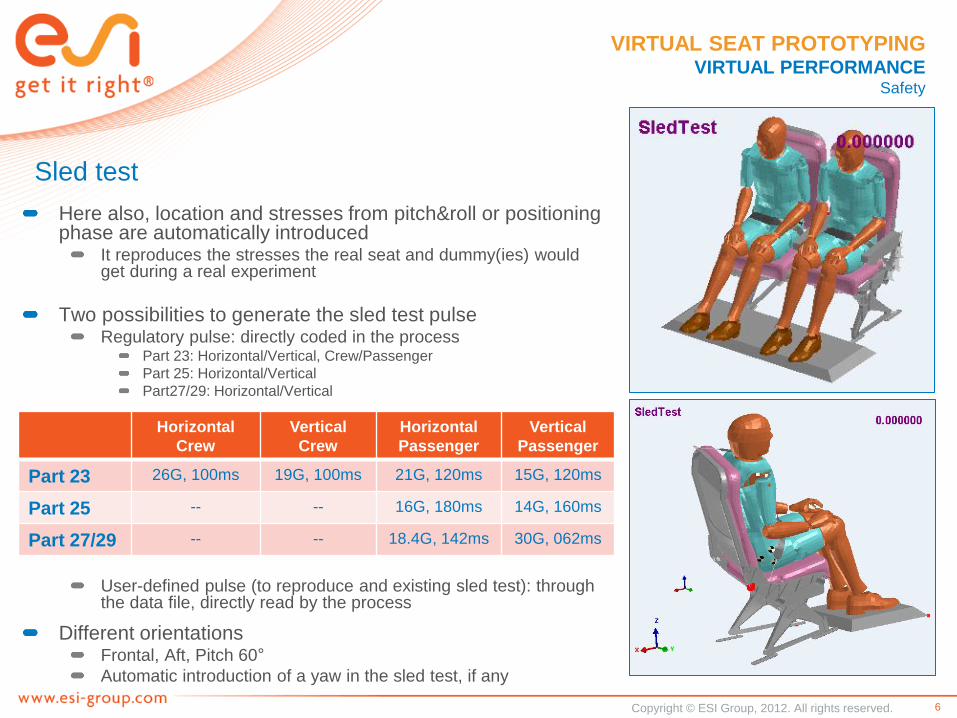
Sled test
Here also, location and stresses from pitch&roll or positioning phase are automatically introduced
It reproduces the stresses the real seat and dummy(ies) would get during a real experiment
Two possibilities to generate the sled test pulse Regulatory pulse: directly coded in the process
Part 23: Horizontal/Vertical, Crew/Passenger
Part 25: Horizontal/Vertical
Part27/29: Horizontal/Vertical
User-defined pulse (to reproduce and existing sled test): through the data file, directly read by the process
Different orientations Frontal, Aft, Pitch 60°
Automatic introduction of a yaw in the sled test, if any
Horizontal
Crew
Vertical
Crew
Horizontal
Passenger
Vertical
Passenger
Part 23 26G, 100ms 19G, 100ms 21G, 120ms 15G, 120ms
Part 25 -- -- 16G, 180ms 14G, 160ms
Part 27/29 -- -- 18.4G, 142ms 30G, 062ms
VIRTUAL SEAT PROTOTYPING VIRTUAL PERFORMANCE
Safety
Copyright © ESI Group, 2012. All rights reserved.
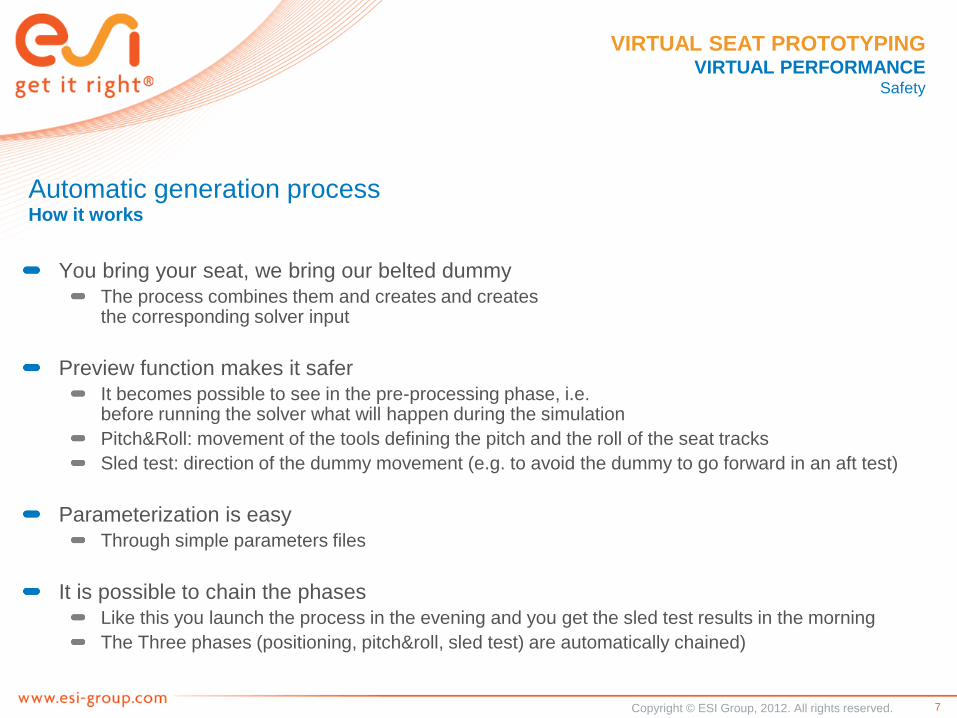
You bring your seat, we bring our belted dummy
The process combines them and creates and creates the corresponding solver input
Preview function makes it safer
It becomes possible to see in the pre-processing phase, i.e. before running the solver what will happen during the simulation
Pitch&Roll: movement of the tools defining the pitch and the roll of the seat tracks
Sled test: direction of the dummy movement (e.g. to avoid the dummy to go forward in an aft test)
Parameterization is easy
Through simple parameters files
It is possible to chain the phases
Like this you launch the process in the evening and you get the sled test results in the morning
The Three phases (positioning, pitch&roll, sled test) are automatically chained)
7
Automatic generation process How it works
VIRTUAL SEAT PROTOTYPING VIRTUAL PERFORMANCE
Safety

Copyright © ESI Group, 2012. All rights reserved. 8
Lap belt Pitch 0°
VIRTUAL SEAT PROTOTYPING VIRTUAL PERFORMANCE
Safety

Copyright © ESI Group, 2012. All rights reserved. 9
Lap belt Pitch 60°
VIRTUAL SEAT PROTOTYPING VIRTUAL PERFORMANCE
Safety
Copyright © ESI Group, 2012. All rights reserved. 10
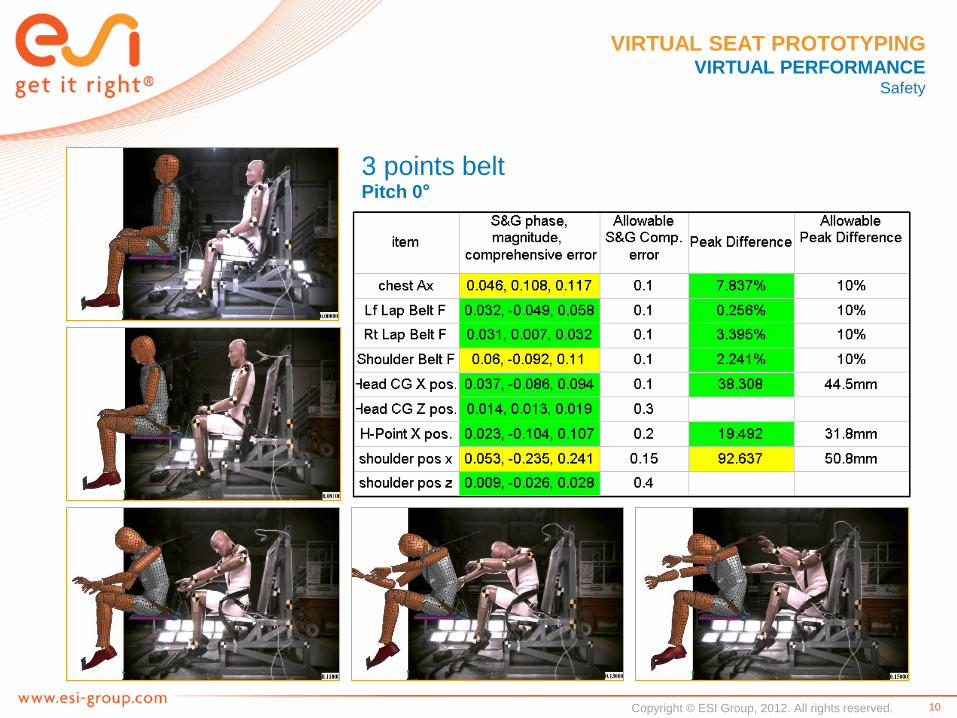
3 points belt Pitch 0°
VIRTUAL SEAT PROTOTYPING VIRTUAL PERFORMANCE
Safety

Copyright © ESI Group, 2012. All rights reserved. 11
Harness Pitch 0°
VIRTUAL SEAT PROTOTYPING VIRTUAL PERFORMANCE
Safety

Copyright © ESI Group, 2012. All rights reserved. 12
MULTI-DOMAIN OPTIMIZATION
End-to-end virtual prototyping for seats

Copyright © ESI Group, 2012. All rights reserved.
VIRTUAL SEAT PROTOTYPING HOW TO ACHIEVE THIS GOAL ?
What does ESI propose ? Virtual Performances
13
Sustainable only with a single core model
and an end-to-end solution
Seat single core model virtually manufactured
Seat crash model
14 CFR 23.562
14 CFR 25.562
14 CFR 27.562
…
Seat comfort model
H-Point with HPM1
Pressure with Human (take off, cruising, landing)
Pressure with Human (sleeping
mode)
…
Seat NVH model
Transfer function
Acoustic absorption of
porous materials
Durability
…
Seat thermal model
Water dummy
Human model
…
Crash NVH
Comfort
Thermal
comfort

Copyright © ESI Group, 2009. All rights reserved. Copyright © ESI Group, 2009. All rights reserved. 14
COMFORT Pressure distribution

Copyright © ESI Group, 2009. All rights reserved. Copyright © ESI Group, 2009. All rights reserved.
Backrest: experiment
Backrest: simulation
1 4 7
10
13
16
19
22
25
28
31
34
37
40
43
46
S1
S3
S5
S7
S9
S11
S13
S15
S17
S19
S21
S23
S25
S27
S29
S31
S33
S35
S37
S39
S41
S43
S45
S47Pressure (g/cm2)
125-150
100-125
75-100
50-75
25-50
0-25
Cushion: physical test Cushion: simulation Cushion pressure
0
500
1000
1500
2000
2500
3000
0 5 10 15 20 25 30 35 40 45 50
Column number
Pre
ss
ure
su
m (
g/c
m2)
Exp _ Pressure Column
Simulation _ Pressure Column
Left Right
Cushion pressure
0
500
1000
1500
2000
2500
3000
3500
4000
0 5 10 15 20 25 30 35 40 45 50
Row number
Pre
ssu
re s
um
(g
/cm
2)
Exp _ Pressure Row
Simulation _ Pressure Row
Rear Front
Example of PAM-Comfort results: Physical tests vs simulation for contact pressure rows & columns
15
Courtesy Hyundai Courtesy Renault
COMFORT Pressure distribution

Copyright © ESI Group, 2009. All rights reserved. Copyright © ESI Group, 2009. All rights reserved. 16
Ex. Renault: « Virtual Seat Comfort Assessment for Low-Frequency Ride Comfort », SIA 2008
VIBRATIONS

Copyright © ESI Group, 2009. All rights reserved. Copyright © ESI Group, 2009. All rights reserved.
The seat is initialized at 22°C
The oscillations on the experimental curve
are due to the thermostat.
17
THERMAL COMFORT

Copyright © ESI Group, 2009. All rights reserved. Copyright © ESI Group, 2009. All rights reserved. 18
FINALLY
End-to-end virtual prototyping for seats

Copyright © ESI Group, 2009. All rights reserved. Copyright © ESI Group, 2009. All rights reserved.
With the same model, you can achieve many analysis
First step toward the multi-domain optimization
Less expensive: same software & hardware
You can easily perform safety analysis
You bring your seat model, we bring the dummy and the process
We have automatic converters for Nastran, LS-Dyna and RADIOSS
Lowers the risk of mistakes
19
FINALLY

Copyright © ESI Group, 2009. All rights reserved.