Embed Size (px)
Citation preview

© 2017 Discovery Publication. All Rights Reserved. www.discoveryjournals.org OPEN ACCESS
ARTICLE
Pag
e61
4
ANALYSIS
Aeromagnetic mapping of the basement
architecture of the Ibadan region, South-Western
Nigeria
Cyril Chibueze Okpoli☼, Victor Ekere
Department of Earth Sciences, Faculty of Science, Adekunle Ajasin University, PMB 1, Akungba-Akoko, Ondo State, Nigeria
☼Corresponding Author:
Department of Earth Sciences,
Faculty of Science,
Adekunle Ajasin University,
PMB 1, Akungba-Akoko,
Ondo State, Nigeria
E-mail: [email protected]; [email protected]
Article History
Received: 21 September 2017
Accepted: 07 November 2017
Published: 1 December 2017
Citation
Cyril Chibueze Okpoli, Victor Ekere. Aeromagnetic mapping of the basement architecture of the Ibadan region, South-Western
Nigeria. Discovery, 2017, 53(264), 614-635
Publication License
This work is licensed under a Creative Commons Attribution 4.0 International License.
General Note
Article is recommended to print as color digital version in recycled paper.
ABSTRACT
Potential-field data of Ibadan sheet was processed to interpret the subsurface geology and estimate the depth to basement sources
in order to evaluate and deduce structural lineaments, basement configuration trends. Aeromagnetic data were acquired, filtered,
inverted, and enhanced using appropriate software packages to generate a model of the subsurface topography. The Butterwort
ANALYSIS 53(264), December 1, 2017
Discovery ISSN 2278–5469
EISSN
2278–5450

© 2017 Discovery Publication. All Rights Reserved. www.discoveryjournals.org OPEN ACCESS
ARTICLE
Pag
e61
5
ANALYSIS
magnetic intensity ranges from -17.297 to 128.757 nT; Reduction to the Pole varies from –81.242-202.554nT; Derivatives ranges from
-0.092 to +0.079 and -0.082 to +0.088 respectively, upward continuation at 100m and 1.8km ranges from -17.453 to +128.587 and
17.076 to +108.696 nT and analytical signal varies from -27.647 to + 187.416 nT. The average radial power analysis delineated the
deeper magnetic source 0 to 1 km with low magnetic intensity ranging from -27.647 nT to +29.527 nT and deeper sources ranging
1km - 5 km with anomaly of high magnetic intensity values varying from 116.113 nT to +187.416 nT. The Wenner deconvolution
depth to basement profile of 97m to 9.797km ranges between 20m and 472m while Euler deconvolution ranges from 1263m to
5918m. The magnetic intensity distributions depend on the size, depth of burial, and the thickness of low susceptibility superficial
material overlying the magnetite rich crystalline rocks.
Keywords: Aeromagnetic, Ibadan, Derivatives, Deconvolutions and Basement topography.
1. INTRODUCTION
Aeromagnetic survey maps the variation in geomagnetic field, which occurs due to the changes in the percentage of magnetite in
rock. It reveals the variation in the distribution and type of magnetic minerals in the subsurface. Magnetic minerals can be mapped
from the surface to greater depth in crustal rocks depending on dimension, shape, and the magnetic property of the rock.
Sedimentary configurations do not usually have appreciable magnetic properties, this is because of the minute role of detrital
remnant magnetism while igneous and metamorphic rocks exhibit greater differentiations and become useful in exploring bedrock
geology.
Magnetic anomalies determined from aeromagnetic surveys (Ravat et al. 2002) characteristically have their sources in the deep
crust or uppermost mantle. Anomalies over Earth’s continental shields and modern mobile belts require cross dissimilarity in
magnetization of 1.5–10 A m−1 (Wasilewski and Mayhew 1982; Mayhew and LaBrecque 1987; Hahn and Roeser 1989; Mayhew et al.
1991; Pilkington and Percival 2001; McEnroe et al. 2004), greater than usually observed in near surface rocks (Grant, 1985; Henkel,
1991, 1994; Clark, 1997, 1999). The characteristic of rock magnetic sources–the magnetic minerals involved, their domain structures,
and whether or not remanent as well as induced magnetization is significant–remain unclear.
Nigeria is covered with Precambrian basement as well as variable thickness of sedimentary and regolith material, which obscures
most direct geological signatures of the basement architecture (Figure 1). Analysis of magnetic and gravity potential field survey
data present an indirect insight into the underlying geology, and the Nigeria is well covered by such data (Milligan et al., 2003;
Okpoli and Eyitoyo, 2016; Cyril Chibueze Okpoli et al. 2017). Mineral exploration usually extends from areas of outcropping and
subcropping basement into areas with greater thickness of cover. One of the most useful deductions from potential field data is the
depth of crystalline basement beneath the regolith. Many of the exposed/near-exposed mineral resources have probably now been
found, and the next target areas are in basement regions underlying shallow cover.
High resolution magnetic and gravity data are mostly situated in areas of high petroleum interest like the Niger Delta, Dahomey,
Anambra, Chad basin zones basins and Gulf of Guinea are usually the property of petroleum companies, and thus not always
available for academic studies while the primary objective of the government-funded airborne geophysical programme is to provide
the industry and the geoscientific community with modern data that are relevant to the exploration for mineral resources and for
the general understanding of the geology of Nigeria. Most of the previous surveys have covered onshore areas. However, the survey
started from 7th of December 2006 to 31st of May 2007. The study area is located within the Precambrian basement complex region
of Nigeria and indicators that have been found useful in mineral exploration includes faults, fractures (lineaments), arched, or domed
structures in addition to oxidized and hydrothermally altered areas (Peterson et al., 1976; Okpoli and Adedibu, 2016), and the
application of aeromagnetic methods amplifies the recognition of the difference in depths of magnetic sources, structures like faults,
dike, lineaments, and layered magnetic susceptibility given in the unevenness of complexes.
Ibadan Southwestern Nigeria and its adjoining areas has experienced several geophysical investigations electrical resistivity
probing- ERT and VES (vertical electrical sounding) studies, electromagnetic surveys - VLF (very low frequency), borehole logging
(lithologic and geophysical), surface mapping among others to determine its groundwater potential and evaluate its geologic and
economic values but little has been done in the area of magnetic mineral exploration. The purpose of this paper is to report rock
magnetic data for the need for a cost effective, rapid result, risk reduction and faster technique like aeromagnetic method which can
give quick and reliable information about the subsurface basement structures, subsurface lithology, trend, depth to magnetic source,
and structural features of large and inaccessible areas is necessary hence, this study.

© 2017 Discovery Publication. All Rights Reserved. www.discoveryjournals.org OPEN ACCESS
ARTICLE
Pag
e61
6
ANALYSIS
1.1. Description of the study area
The study area covered 55km by 55km which is 3,025 square kilometers (Figure 1). The study area is part of the Precambrian
basement complex of southwestern Nigeria and is Archean to early Proterozoic in age as described by Talabi (2013). More so,
Olanrewaju (1981) indicated that the study area is composed of migmatite-gneiss complex with little supra-crustal rock relics. The
basement complex of Nigeria is zoned in the western part of the Pan-African shield as described by McMurry (1976) and Ball (1980),
occurring in the mobile zone of the Pan-African to Eburnean reactivation area between the West-African craton to the west and the
Congo craton to the southeast.
The Basement complex is one of the three major litho-petrological components that make up the geology of Nigeria. Within the
basement complex of Nigeria, four major petrolithological units are distinguishable namely: the migmatite – Gneiss complex, the
schist belt, the older Granite and the undefined Acid and Basic dykes. The study area is characterized by heterogeneous assemblage
comprising migmatites, orthogeneises, paragneisses, and a series of basic and ultrabasic metamorphosed rocks. The migmatite-
Gneiss complex has ages ranging from Pan-African to Eburnean. It makes up about 60% of the surface area of the Nigerian
basement.
Ibadan area is underlain by the following distinguishable lithologies- biotite granite gneiss, migmatite biotite gneiss, biotite
muscovite granite, hornblende granite and schists (Figure 2). These crystalline rocks are composed primarily of banded gneiss in
which the hornblende-biotite rich bands alternate with quartz-oligoclase rich bands. The banded gneiss, which originated as part of
a sedimentary sequence, contains large lenses of granite gneiss and thin intercolated layers of quartzite and amphibolite
(Adetoyinbo et al., 2010).
Figure 1 location map of the study area.

© 2017 Discovery Publication. All Rights Reserved. www.discoveryjournals.org OPEN ACCESS
ARTICLE
Pag
e61
7
ANALYSIS
Figure 2 Geological map of Nigeria showing the part of the study area (Modified after NGSA).
2. MATERIALS AND METHODS
2.1. Aeromagnetic Data and Analysis
2.1.1 Data Acquisition
The nationwide mandate of acquisition of high resolution airborne geophysical survey aimed at assisting and promoting mineral
exploration in Nigeria, aeromagnetic data was acquired between 2003 and 2009 by Fugro Airborne Survey Limited for the Nigerian
Geological Survey Agency (NGSA) (MMSD, 2010). The data was acquired systematically by dividing the country into geological
blocks with divergent measurement parameters for each block with the eventual production of an aeromagnetic map for the whole
country (Figure 3).
The following equipment specifications were used-Scintrex CS3 Cesium Vapor magnetometer, Data Acquisition System FASDAS,
Magnetic Counter FASDAS, Radar Altimeter KING KR405/KING KR405B, Barometric Altimeter ENVIRO BARO/DIGIQUARTZ. Scintrex
CS3 optically pumped Cesium Vapor magnetometer was used for scalar measurement of the Earth’s magnetic field. It can be used in
a variety of applications such as airborne, satellite, ground magnetometry, or gradiometry. It is highly sensitive and measures in the
range of pT (1 pT = 0.001 nT) in a measuring bandwidth of 1 Hz and this sensitivity does not deteriorate as the measured ambient
field decreases. It measures between 15,000 nT and 100,000 nT. The sensor head has an electrode-less discharge lamp (containing
cesium vapor) and absorption cell. Electrical heaters bring the lamp and the cell to optimum operating temperatures with control
and driving circuits located in the electronics console. Heating currents are supplied to the sensor head through the interconnecting
cable.
The area under study, Ibadan Southwest and its environs designated as Sheet 261; is part of Block B and was surveyed in Phase 1
of the project. The survey was carried out by fixed wing (Cessna) caravan -208B ZS-FSA, 208 ZS-MSJ,406 ZS-SSC aircrafts covering a

© 2017 Discovery Publication. All Rights Reserved. www.discoveryjournals.org OPEN ACCESS
ARTICLE
Pag
e61
8
ANALYSIS
total of 235,000 line kilometers with a flight spacing of 200 meters and a terrain clearance of 80 meters, The flight direction was NW-
SE with tie-line spacing of 200 meters and tie-line direction of NE-SW.
A recording interval of 0.1 secs and a grid mesh size of 50 meters were applied in the World Geodetic System of 1984 (WGS84)
within UTM Zone 36S,central median 33oC East, Central scaling factor 0.999 6and with the Spheroid Clark 1880/Arc 1960 coordinate
system.
2.1.2 Data Processing
The data is that of total field and is in a gridded form as a total magnetic intensity (TMI) map (Figure 4). This method fits minimum
curvature curves (which is the smoothest possible surface that would fit the given data values) to data point using method described
by Briggs (1974).
Figure 3 Nigeria Fixed- wing Airborne TMI Map (Superimposed federal Survey half Degree Sheets); Source: NGSA.
© 2017 Discovery Publication. All Rights Reserved. www.discoveryjournals.org OPEN ACCESS
ARTICLE
Pag
e61
9
ANALYSIS
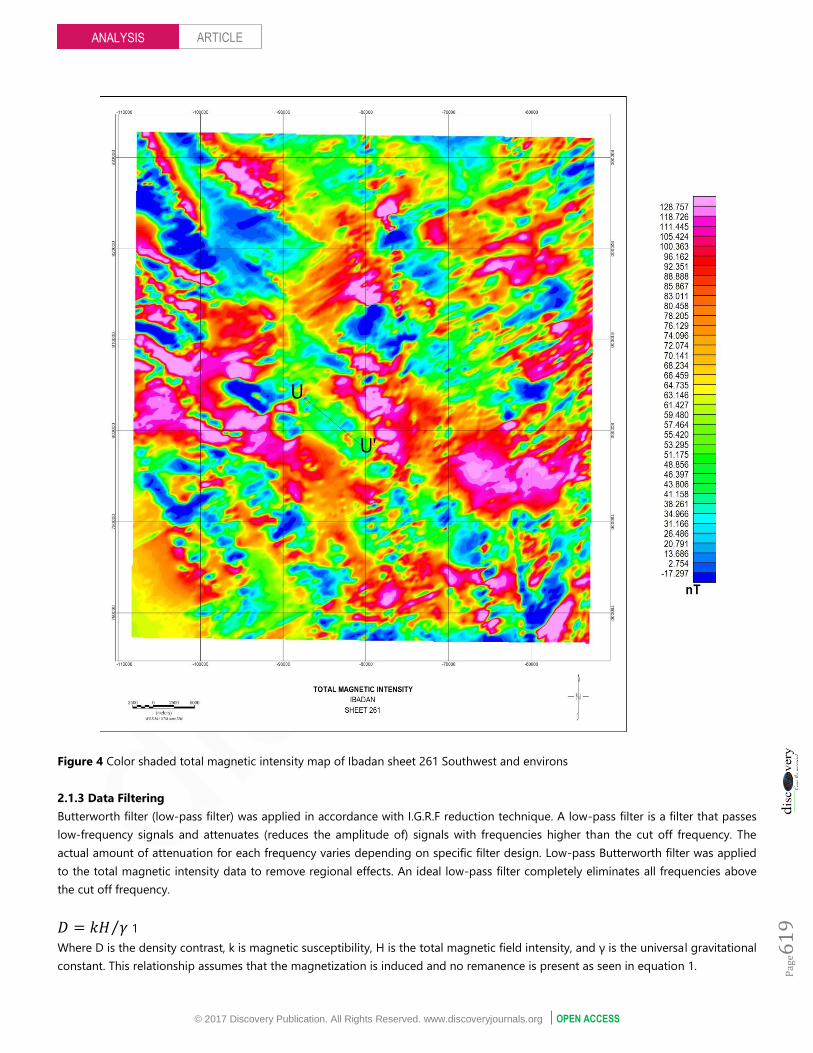
Figure 4 Color shaded total magnetic intensity map of Ibadan sheet 261 Southwest and environs
2.1.3 Data Filtering
Butterworth filter (low-pass filter) was applied in accordance with I.G.R.F reduction technique. A low-pass filter is a filter that passes
low-frequency signals and attenuates (reduces the amplitude of) signals with frequencies higher than the cut off frequency. The
actual amount of attenuation for each frequency varies depending on specific filter design. Low-pass Butterworth filter was applied
to the total magnetic intensity data to remove regional effects. An ideal low-pass filter completely eliminates all frequencies above
the cut off frequency.
𝐷 = 𝑘𝐻 𝛾⁄ 1
Where D is the density contrast, k is magnetic susceptibility, H is the total magnetic field intensity, and γ is the universal gravitational
constant. This relationship assumes that the magnetization is induced and no remanence is present as seen in equation 1.

© 2017 Discovery Publication. All Rights Reserved. www.discoveryjournals.org OPEN ACCESS
ARTICLE
Pag
e62
0
ANALYSIS
Upward Continuation, Vertical Derivative, and Reduction to pole, total magnetic intensity, analytical signal, 3-D Euler
deconvolution, radial power spectrum were determined using Oasis MontajTM.
In this study, the Euler deconvolution algorithm using Oasis MontajTM for location and depth determination of causative
anomalous bodies from gridded aeromagnetic data was used. The map thus produced shows the locations and the corresponding
depth estimation of geologic sources. Also, Extended Euler deconvolution was carried out to determine the depth to the magnetic
basement from profiles at estimated level of certainty Reid et al., 1990. Table 1 shows the summary of the structural indices for
simple models in magnetic field where the following structural Index (ŋ) values 1.0 and 2.0 were used based on the geological
models of the source to be individual dikes, sills, and horizontal cylinder as in the case of large plutons respectively (Osinowo and
Olayinka, 2013; El Dawi et al., 2004).
.
Table 1 Summary of the structural indices for simple models in magnetic field
Structural
index, n Types of magnetic model Characteristics
0.0 Contact with large extent Circles are intertwined with no particular pattern
0.5 Contact with small extent Circles are intertwined in a pattern that is linear and in rows
1.0 Sills and dyke, thin prism with large
circles Circles are intertwined in a straight line
2.0 Vertical and horizontal cylinder Occurs like a vertical pipe and Circles intertwined neatly with
regular circumference
3.0 sphere Occur has sphere bodies of circles with a common axis
connecting them.
3. RESULTS AND DISCUSSION
3.1. Total Magnetic Intensity
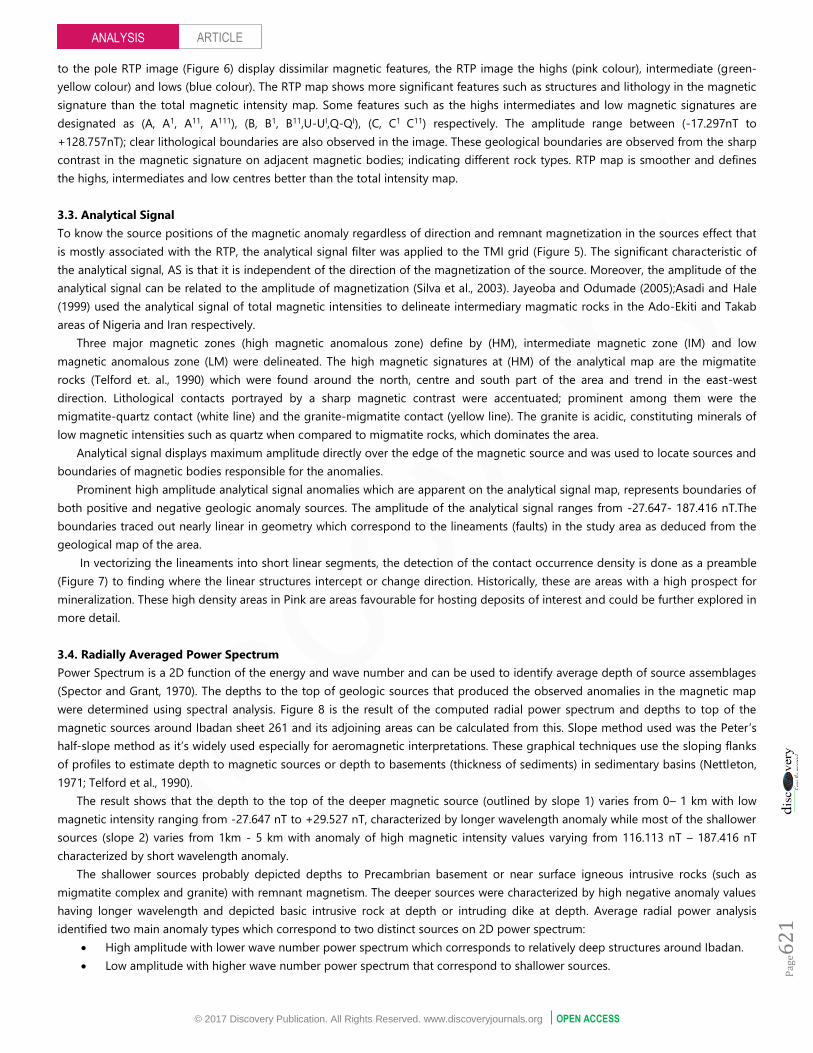
The Total Magnetic Intensity (TMI) Map as shown in Figure 5 is characterized majorly by positive magnetic anomalies with only a few
negative magnetic anomalies. The amplitude of a magnetic anomaly is directly proportional to the magnetization which depends on
magnetic susceptibility if the rocks (Gunn et al., 1997). Close to the earth‘s equator low (points of low magnetic equator) susceptible
magnetic features appear as high magnetic anomalies and vice versa (Gunn et al., 1997). The TMI image show high magnetic
susceptible areas in low magnetic values (blue) while less magnetic susceptible areas are depicted as high magnetic values (pink
colour) except for the analytical signal image and reduction to the pole image where high magnetic susceptible areas are shown as
high anomalies. The range of these anomalies is between -17.297nT to +128.757nT. High magnetic values were observed which may
be attributed to the presence of moderately high magnetic rocks (Granite, Migmatite Gneiss complex, quartzite). Negative magnetic
values were observed in the area which may be due to the present of low magnetic rocks (e.g sandstone, schist, weathered
sediments) in the area, that are noted for low magnetic signatures. The total magnetic field intensity data was gridded using the
minimum curvature method (Figure 5). To highlight the appearance of anomalies near surfaces, the colour-shade grid with
illumination inclination of 45 and declination at 45 was applied. The total magnetic image showed the difference in locations of
high and low magnetic intensities (Figure 5). It also shows the difference in locations of high and low magnetic intensities and many
crustal magnetization patterns. The magnetic zone division was based on the intensity, shape, and pattern in magnetic signatures.
Magnetic highs mostly trend in the E-W and NE-SW directions. The high magnetic anomalies correspond to regions with high
magnetite content which in the study area is the crystalline basement rocks of southwestern Nigeria. Low magnetic anomaly
characterized regions with relatively low magnetite content.
3.2. Reduction to Pole (RTP)
Reduction to the pole, (RTP) filter was applied to the total magnetic intensity (TMI) grid in order to locate the observed magnetic
anomalies directly over the magnetic source bodies that caused the anomaly as well as to remove the influence of magnetic latitude
on the residual anomalies (Murphy, 2007). After performing the Reduction Pole (RTP) filtering operation on the gridded data for this
work, it was apparent that the contour shows a significant change on comparison to the unfiltered contoured map which is a
combined signals of regional, residual and noise. The RTP magnetic anomaly map (Figure 6) shows both low and high magnetic
frequencies representing points of low and high magnetic signatures respectively in the area. The TMI (Figure 5) and the reduction
© 2017 Discovery Publication. All Rights Reserved. www.discoveryjournals.org OPEN ACCESS
ARTICLE
Pag
e62
1
ANALYSIS
to the pole RTP image (Figure 6) display dissimilar magnetic features, the RTP image the highs (pink colour), intermediate (green-
yellow colour) and lows (blue colour). The RTP map shows more significant features such as structures and lithology in the magnetic
signature than the total magnetic intensity map. Some features such as the highs intermediates and low magnetic signatures are
designated as (A, A1, A11, A111), (B, B1, B11,U-UI,Q-QI), (C, C1 C11) respectively. The amplitude range between (-17.297nT to
+128.757nT); clear lithological boundaries are also observed in the image. These geological boundaries are observed from the sharp
contrast in the magnetic signature on adjacent magnetic bodies; indicating different rock types. RTP map is smoother and defines
the highs, intermediates and low centres better than the total intensity map.
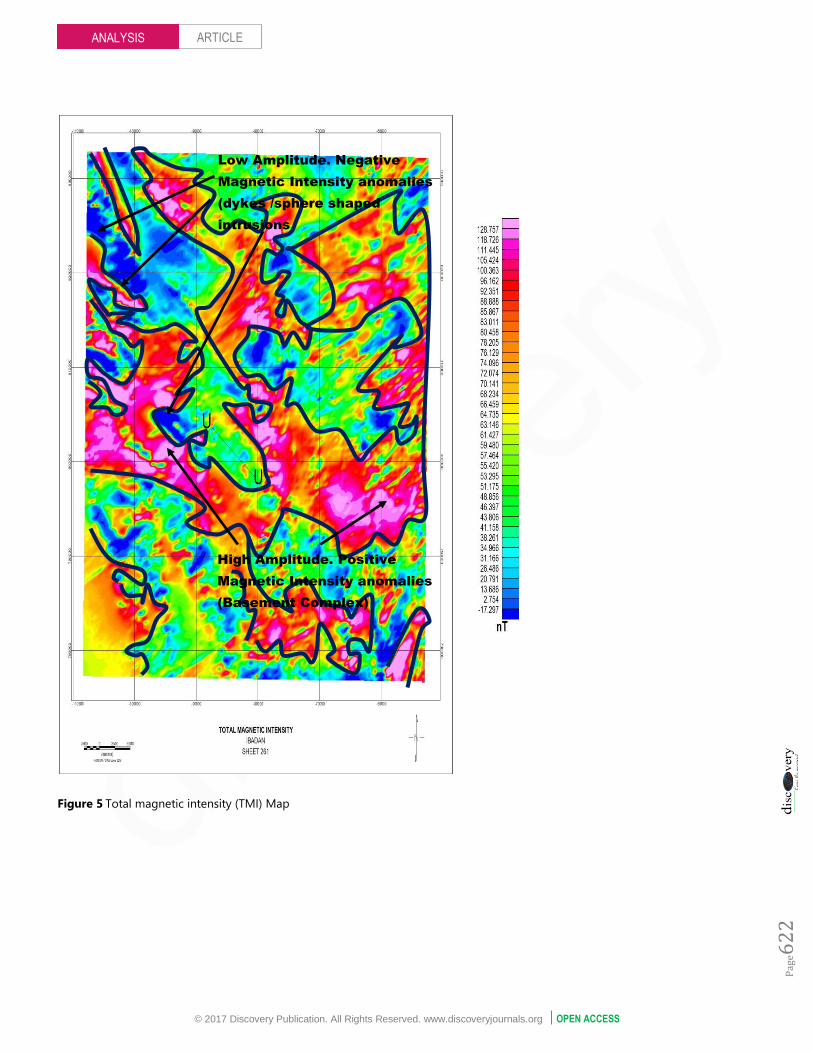
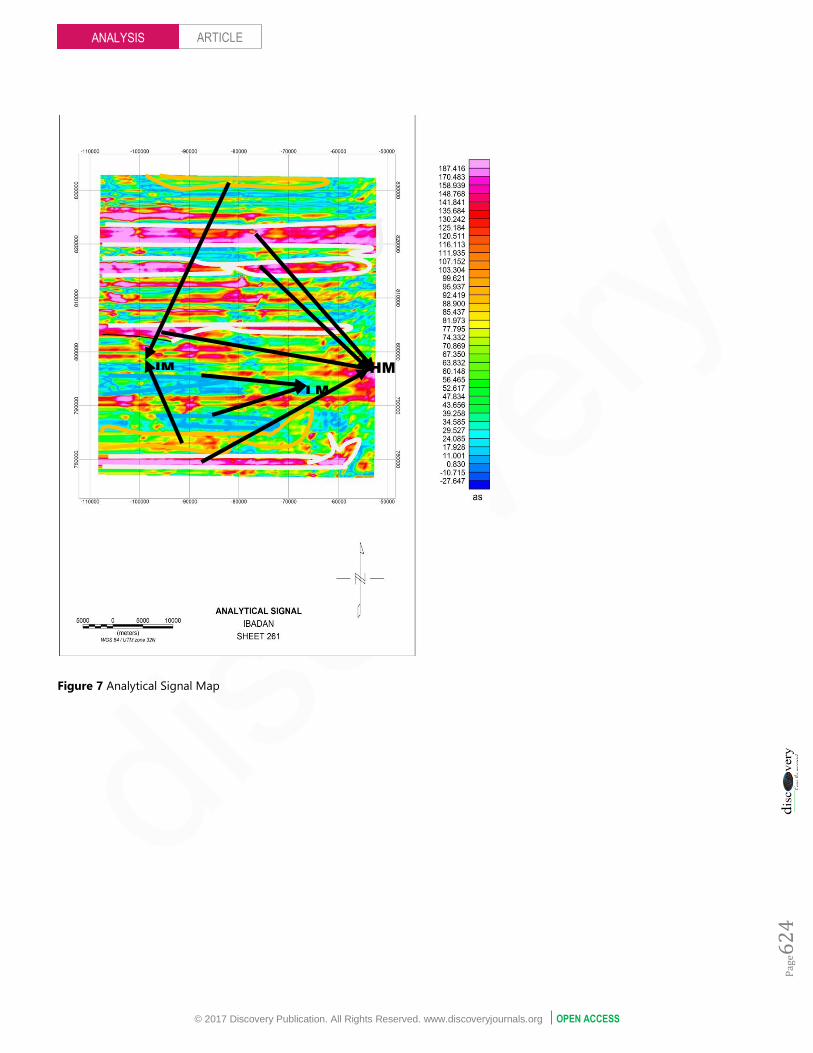
3.3. Analytical Signal
To know the source positions of the magnetic anomaly regardless of direction and remnant magnetization in the sources effect that
is mostly associated with the RTP, the analytical signal filter was applied to the TMI grid (Figure 5). The significant characteristic of
the analytical signal, AS is that it is independent of the direction of the magnetization of the source. Moreover, the amplitude of the
analytical signal can be related to the amplitude of magnetization (Silva et al., 2003). Jayeoba and Odumade (2005);Asadi and Hale
(1999) used the analytical signal of total magnetic intensities to delineate intermediary magmatic rocks in the Ado-Ekiti and Takab
areas of Nigeria and Iran respectively.
Three major magnetic zones (high magnetic anomalous zone) define by (HM), intermediate magnetic zone (IM) and low
magnetic anomalous zone (LM) were delineated. The high magnetic signatures at (HM) of the analytical map are the migmatite
rocks (Telford et. al., 1990) which were found around the north, centre and south part of the area and trend in the east-west
direction. Lithological contacts portrayed by a sharp magnetic contrast were accentuated; prominent among them were the
migmatite-quartz contact (white line) and the granite-migmatite contact (yellow line). The granite is acidic, constituting minerals of
low magnetic intensities such as quartz when compared to migmatite rocks, which dominates the area.
Analytical signal displays maximum amplitude directly over the edge of the magnetic source and was used to locate sources and
boundaries of magnetic bodies responsible for the anomalies.
Prominent high amplitude analytical signal anomalies which are apparent on the analytical signal map, represents boundaries of
both positive and negative geologic anomaly sources. The amplitude of the analytical signal ranges from -27.647- 187.416 nT.The
boundaries traced out nearly linear in geometry which correspond to the lineaments (faults) in the study area as deduced from the
geological map of the area.
In vectorizing the lineaments into short linear segments, the detection of the contact occurrence density is done as a preamble
(Figure 7) to finding where the linear structures intercept or change direction. Historically, these are areas with a high prospect for
mineralization. These high density areas in Pink are areas favourable for hosting deposits of interest and could be further explored in
more detail.
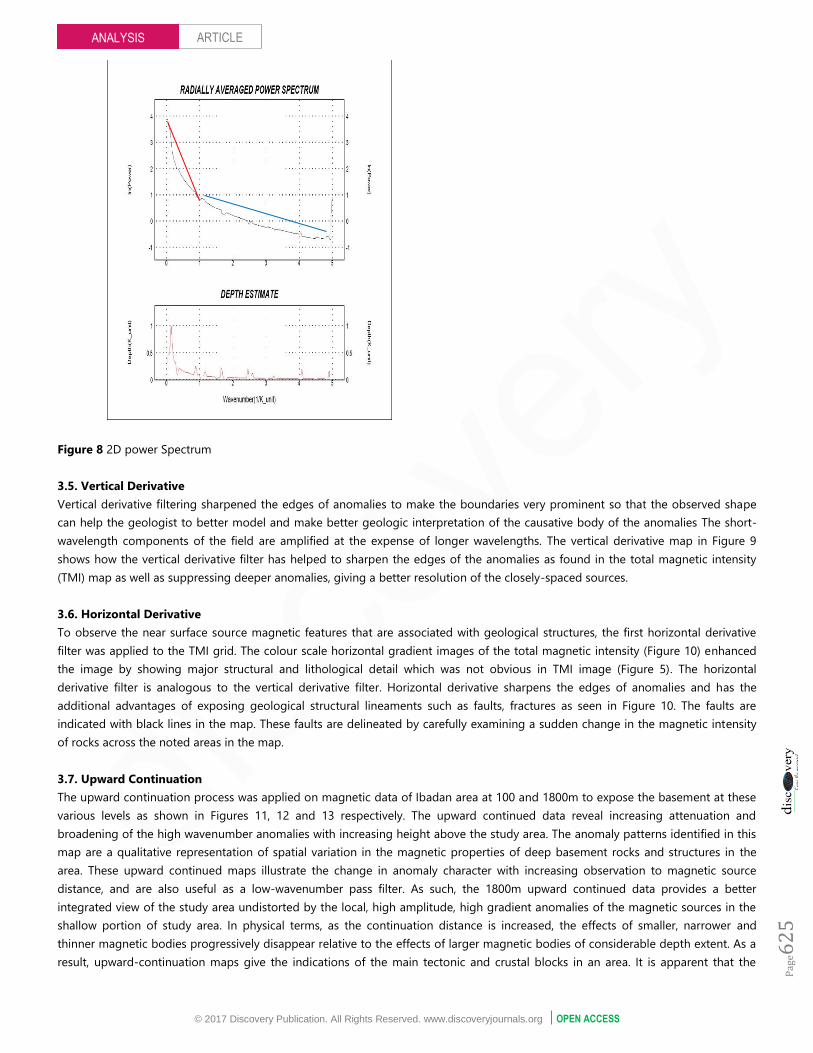
3.4. Radially Averaged Power Spectrum
Power Spectrum is a 2D function of the energy and wave number and can be used to identify average depth of source assemblages
(Spector and Grant, 1970). The depths to the top of geologic sources that produced the observed anomalies in the magnetic map
were determined using spectral analysis. Figure 8 is the result of the computed radial power spectrum and depths to top of the
magnetic sources around Ibadan sheet 261 and its adjoining areas can be calculated from this. Slope method used was the Peter’s
half-slope method as it’s widely used especially for aeromagnetic interpretations. These graphical techniques use the sloping flanks
of profiles to estimate depth to magnetic sources or depth to basements (thickness of sediments) in sedimentary basins (Nettleton,
1971; Telford et al., 1990).
The result shows that the depth to the top of the deeper magnetic source (outlined by slope 1) varies from 0– 1 km with low
magnetic intensity ranging from -27.647 nT to +29.527 nT, characterized by longer wavelength anomaly while most of the shallower
sources (slope 2) varies from 1km - 5 km with anomaly of high magnetic intensity values varying from 116.113 nT – 187.416 nT
characterized by short wavelength anomaly.
The shallower sources probably depicted depths to Precambrian basement or near surface igneous intrusive rocks (such as
migmatite complex and granite) with remnant magnetism. The deeper sources were characterized by high negative anomaly values
having longer wavelength and depicted basic intrusive rock at depth or intruding dike at depth. Average radial power analysis
identified two main anomaly types which correspond to two distinct sources on 2D power spectrum:
High amplitude with lower wave number power spectrum which corresponds to relatively deep structures around Ibadan.
Low amplitude with higher wave number power spectrum that correspond to shallower sources.
© 2017 Discovery Publication. All Rights Reserved. www.discoveryjournals.org OPEN ACCESS
ARTICLE
Pag
e62
2
ANALYSIS
Figure 5 Total magnetic intensity (TMI) Map
High Amplitude. Positive
Magnetic Intensity anomalies
(Basement Complex)
Low Amplitude. Negative
Magnetic Intensity anomalies
(dykes /sphere shaped
intrusions

© 2017 Discovery Publication. All Rights Reserved. www.discoveryjournals.org OPEN ACCESS
ARTICLE
Pag
e62
3
ANALYSIS
Figure 6 Reduction to Pole (RTP) Map
A
A11 A1
B
B1
C
A111
C1
B11
© 2017 Discovery Publication. All Rights Reserved. www.discoveryjournals.org OPEN ACCESS
ARTICLE
Pag
e62
4
ANALYSIS
Figure 7 Analytical Signal Map
IM HM
LM
© 2017 Discovery Publication. All Rights Reserved. www.discoveryjournals.org OPEN ACCESS
ARTICLE
Pag
e62
5
ANALYSIS
Figure 8 2D power Spectrum
3.5. Vertical Derivative
Vertical derivative filtering sharpened the edges of anomalies to make the boundaries very prominent so that the observed shape
can help the geologist to better model and make better geologic interpretation of the causative body of the anomalies The short-
wavelength components of the field are amplified at the expense of longer wavelengths. The vertical derivative map in Figure 9
shows how the vertical derivative filter has helped to sharpen the edges of the anomalies as found in the total magnetic intensity
(TMI) map as well as suppressing deeper anomalies, giving a better resolution of the closely-spaced sources.
3.6. Horizontal Derivative
To observe the near surface source magnetic features that are associated with geological structures, the first horizontal derivative
filter was applied to the TMI grid. The colour scale horizontal gradient images of the total magnetic intensity (Figure 10) enhanced
the image by showing major structural and lithological detail which was not obvious in TMI image (Figure 5). The horizontal
derivative filter is analogous to the vertical derivative filter. Horizontal derivative sharpens the edges of anomalies and has the
additional advantages of exposing geological structural lineaments such as faults, fractures as seen in Figure 10. The faults are
indicated with black lines in the map. These faults are delineated by carefully examining a sudden change in the magnetic intensity
of rocks across the noted areas in the map.
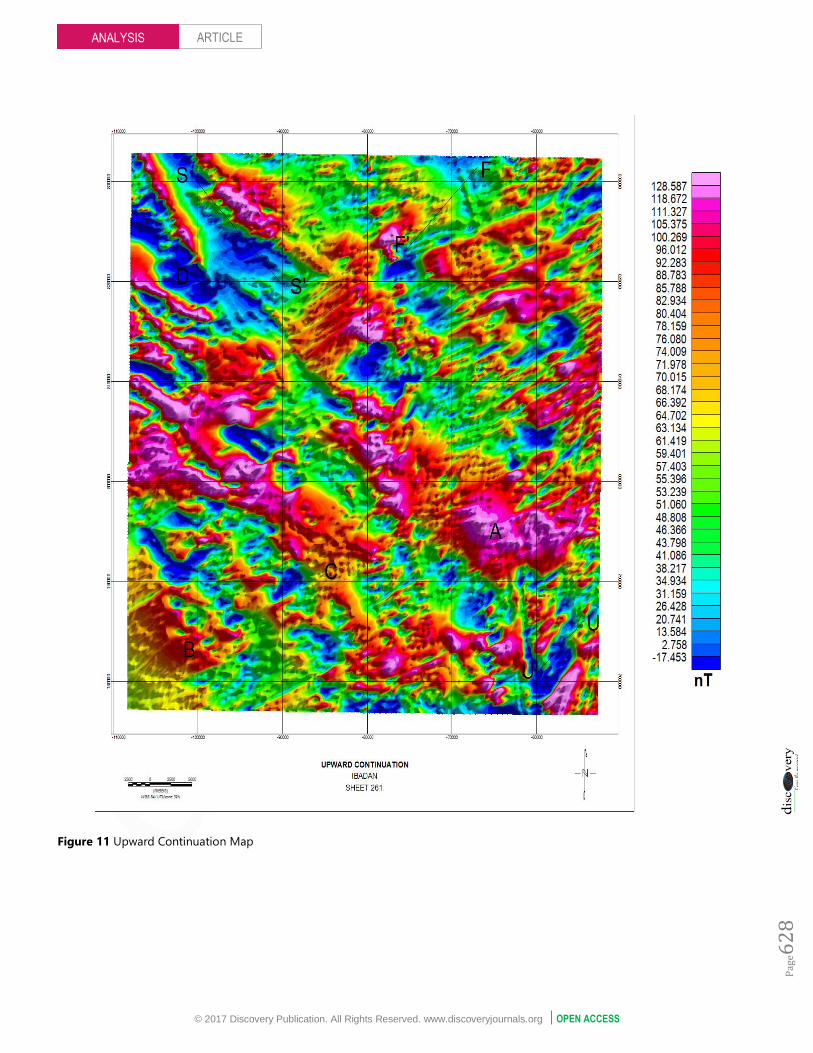
3.7. Upward Continuation
The upward continuation process was applied on magnetic data of Ibadan area at 100 and 1800m to expose the basement at these
various levels as shown in Figures 11, 12 and 13 respectively. The upward continued data reveal increasing attenuation and
broadening of the high wavenumber anomalies with increasing height above the study area. The anomaly patterns identified in this
map are a qualitative representation of spatial variation in the magnetic properties of deep basement rocks and structures in the
area. These upward continued maps illustrate the change in anomaly character with increasing observation to magnetic source
distance, and are also useful as a low-wavenumber pass filter. As such, the 1800m upward continued data provides a better
integrated view of the study area undistorted by the local, high amplitude, high gradient anomalies of the magnetic sources in the
shallow portion of study area. In physical terms, as the continuation distance is increased, the effects of smaller, narrower and
thinner magnetic bodies progressively disappear relative to the effects of larger magnetic bodies of considerable depth extent. As a
result, upward-continuation maps give the indications of the main tectonic and crustal blocks in an area. It is apparent that the

© 2017 Discovery Publication. All Rights Reserved. www.discoveryjournals.org OPEN ACCESS
ARTICLE
Pag
e62
6
ANALYSIS
attenuation of the shallow source anomalies in the upward continuation process permits a plainer or enhanced view of the deeper
anomaly sources (Roberts et al., 1990).
Figure 9 Vertical Derivative Map
3.8. 3D Aeromagnetic Map
The 3-Dimensional data enhancement scheme helps to view the subsurface in three orthogonal directions (x, y, z). it helps to
construct a sharp demarcation between the positive and negative anomalies as well as anomalies arising from near surface bodies
and those from deep surface. Figure 14 shows that the anomalous bodies of high magnetic intensities are concentrated in the
south-west region of the study area.

© 2017 Discovery Publication. All Rights Reserved. www.discoveryjournals.org OPEN ACCESS
ARTICLE
Pag
e62
7
ANALYSIS
3.9. Werner Deconvolution
Depth to Basement extension which determines the position (distance along the profile and depth), dip (orientation)) and intensity
(susceptibility) of magnetic source bodies for a magnetic profile was used. The Werner deconvolution function which uses the
horizontal and vertical derivatives in the calculation in the depth to basement of the magnetic anomaly was employed. It assumes
the source bodies are either dikes or contacts with infinite depth extent and uses a least-squares approach to solve for the source
body (Ku and Sharp, 1983). The werner deconvolution helps to estimate depth to basement by employing the information from the
horizontal and vertical derivative filters. As seen in the werner deconvoluition map in Figure 15, it shows a profile where numerous
solutions were generated with the dyke and contact model. Two depth source models (Dike and contacts model) were assumed and
their depths to basement were estimated using the Werner deconvolution function. The dike model fits the description of depth in
the study area.
The depth to basement of the profile ranges from approximately 20-472m and the magnetic anomaly values varied from -0.08nT
to -0.02nT. The profile covers a distance of -97m to 9797m.
Figure 10 Horizontal Derivative Map
© 2017 Discovery Publication. All Rights Reserved. www.discoveryjournals.org OPEN ACCESS
ARTICLE
Pag
e62
8
ANALYSIS
Figure 11 Upward Continuation Map

© 2017 Discovery Publication. All Rights Reserved. www.discoveryjournals.org OPEN ACCESS
ARTICLE
Pag
e62
9
ANALYSIS
Figure 12 Upward Continuation at 100m

© 2017 Discovery Publication. All Rights Reserved. www.discoveryjournals.org OPEN ACCESS
ARTICLE
Pag
e63
0
ANALYSIS
Figure 13 Upward Continuation at 1800m

© 2017 Discovery Publication. All Rights Reserved. www.discoveryjournals.org OPEN ACCESS
ARTICLE
Pag
e63
1
ANALYSIS
Figure 14 3D Aeromagnetic Map
Figure 15 Werner Deconvolution

© 2017 Discovery Publication. All Rights Reserved. www.discoveryjournals.org OPEN ACCESS
ARTICLE
Pag
e63
2
ANALYSIS
Figure 16 3D Euler Deconvolution
3.10. 3-D Euler Deconvolution
The 3-D Euler deconvolution solution was applied in determining the depth to the magnetic sources in the survey area by setting an
appropriate Structural Index, SI. The gridding interval enables recognition of any anomaly that is up to 75 m in wavelength, hence
many solution points. A total of 34,595 solution points were obtained. Result with tightest cluster around recognized sources is likely
to give the best solution and therefore accepted. However, obtained solution (Figure 16) was windowed to select the most accurate
results. These solutions were obtained for varying SI values of 0, 1, and 2 with an average error in depth estimation less than the
required maximum 11% tolerance and window size, and the result with the least unreal solutions was adopted. It was observed that
for SI = 1 (i.e. dike model) was the best fit (Figure 16). The solution produced realistic results which were consistent with the type of
geologic model of the study area. Solutions above the error tolerance levels were rejected Maximum depth limit was set to 250 m,
horizontal uncertainty greater than 10% was rejected, and offset limit in x and y directions were likewise set to maximum of 5%.
The windowed Euler deconvolution solution points (Figure 16) coincides weakly with regions having high analytic signal
amplitude and therefore likely to represent regions with meaningful anomalies and they are in dikes. Euler depth gave useful

© 2017 Discovery Publication. All Rights Reserved. www.discoveryjournals.org OPEN ACCESS
ARTICLE
Pag
e63
3
ANALYSIS
information about the subsurface topography of the basement complex. The windowed Euler depth solutions have color coded
circles, the circle’s colors indicate depth range and the size defines depth variation within the range.
The Euler depth below the datum are scattered all over the study area and are less conspicuous. Integrating the windowed Euler
solution map with the proposed geologic map indicates that these magnetic sources align with lineaments and folds which play host
to these dike bodies.
4. CONCLUSION
Aeromagnetic datasets over the area were collected, processed, and enhanced in order to map the lithology and geological
structures of the study area. Application of selected filtering methods to the aeromagnetic datasets of Ibadan South-Western
Nigeria reveals the elements of subsurface structure in the study area. The filtering methods used to enhance the dataset are: The
total magnetic intensity (TMI) which was filtered using reduction to the pole (RTP), analytical signal, first order vertical and horizontal
derivatives, and upward continuation (UC). These filters helped define the lithological boundaries, intersection of geological
structures, faults, folds, sheared zones, and contacts. The depth to the magnetic sources within the study area was determined using
average radial power spectrum, Wenner and Euler deconvolution depth estimation methods. The power spectrum produced depth
range of 1262m to 1368m while the Wenner and Euler deconvolution which was associated with dikes on the other hand produced
shallower and deeper depth range of 20m and 472m, 1263m to 5918m respectively. This is because dikes anomaly generally occurs
at great depth.
REFERENCE
1. Adetoyinbo, A. A Popoola,O. I. Hammed, O. S. and A. K.,
Bello, Quarry Blasting vibration impacts in Ibadan and
Abeokuta, Nigeria,” European J. of Scientific Research, 4(2),
228-252, 2010.
2. Asadi, H. and M. Hale, ‘‘Integrated analysis of aeromagnetic,
landsat TM and mineral occurrence data for epithermal gold
exploration in northwest iran’’. 13th International Conference
on Applied Geologic Remote Sensing, Vancouver. British
Columbia, 1999.
3. Ball, E. “An Example of very Consistent Brittle Deformation
over a Wide Intra-continental Area: The Late Pan-African
Fracture System of the Tuareg and Nigerian Shield,”
Tectonophysics, v. 61, p. 363–379,1980.
4. Barbosa, V.C.F. Silva, J.B.C. and W.E. Medeiros, “Making Euler
Deconvolution Applicable to Small Ground Magnetic
Surveys,” Journal of Applied Geophysics, v. 43, p. 55–68, 2000.
5. Blanco-Montenegro, I., Torta, J.M. García, A. and V. Araña,
2003, Analysis and modelling of the aeromagnetic anomalies
of Gran Canaria (Canary Islands): Earth Planet. Sci. Lett., v.
206, p. 601–616.
6. Briggs, I.C. “Machine Contouring Using Minimum Curvature,”
Geophysics, v. 39, p. 39–48, 1974.
7. Clark, D.A. ‘‘Magnetic petrology of igneous intrusions:
implications for exploration and magnetic interpretation,’’
Explor. Geophys., 30, 5–26, 1999.
8. Clark, D.A. ‘‘Magnetic petrophysics and magnetic petrology:
aids to geological interpretation of magnetic surveys,’’ AGSO
J. Austr. Geol. Geophys., 17, 83–103,1997.
9. Cyril Chibueze Okpoli, Abel Idowu Olayinka, Michael
Adeyinka Oladunjoye. Estimation and characterization of
aquifer production using Dar-Zarrouk parameter in
crystalline basement terrain, southwest, Nigeria. Discovery,
2017, 53(262), 505-518
10. El Dawi, M.G. Tianyou, L. Hui, S. and L. Dapeng, “Depth
Estimation of 2-D Magnetic Anomalous Sources by using
Euler Deconvolution Method,” American Journal of Applied
Sciences, v. 1/3, p. 209–214, 2004.
11. Fitzgerald, D. Reid, A. and P. McInerney, “New discrimination
techniques for Euler deconvolution,” 8th SAGA Biennial
Technical Meeting and Exhibition, 7-10 October 2003.
12. Grant, F.S. ‘‘Aeromagnetics, geology and ore environments. I.
Magnetite in igneous, sedimentary and metamorphic rocks:
an overview,’’ Geoexploration, 23, 303–333, 1985.
13. Gunn,P. Maidment, D. and P. Milligan,“Interpreting
aeromagnetic data in areas of limited outcrop”. AGSO
Journal of Australian Geology & Geophysics, 17(2), 175–185,
1979.
14. Hahn, A.G. and H.A. Roeser, ‘‘The magnetization of the lower
continental crust, in Properties and Processes of Earth’s
Lower Crust,’’ Geophysics Monograph eds. Mereu, R.F.,
Mueller, S. & Fountain, D.M., American Geophysical Union,
Washington, DC, 51, pp. 247–253, 1989.
15. Henkel, H ‘‘Petrophysical properties (density and
magnetization) of rocks from the northern part of the Baltic
Shield,’’ Tectonophysics, 192, 1–19, 1991.
16. Henkel,H. ‘‘Standard diagrams of magnetic properties and
density—a tool for understanding magnetic petrology,’’ J.
appl. Geophys., 32, 43–53,1994.
17. Jayeoba, A. and D. Odumade, ‘‘Geological and structural
interpretation of Ado-EKiti southwest and its adjoining Area
using aeromagnetic data”.Adapted from extended abstract
prepared in conjunction with oral presentation given at

© 2017 Discovery Publication. All Rights Reserved. www.discoveryjournals.org OPEN ACCESS
ARTICLE
Pag
e63
4
ANALYSIS
Pacific Section AAPG, SEG and SEPM Joint Technical
Conference, Oxnard, California, pp 1-32,May 3-5, 2015.
18. Kivior, I. and D. Boyd, “Interpretation of the Aeromagnetic
Experimental Survey in the Eromanga/Cooper Basin,” Can. J.
Explor. Geophys, v. 34/1-2, p. 58-66, 1998.
19. Ku,C. and J. Sharp, ‘‘Werner deconvolution for automated
magnetic interpretation and its refinement using Marquart's
inverse modelling,’’ Geophysics, 48(6), 754-774, 1983.
20. Mayhew, M.A. Wasilewski, P.J. and B.D.Johnson, ‘‘Crustal
magnetization and temperature at depth beneath theYilgarn
block,Western Australia inferred from Magsat data,’’ Earth
planet. Sci. Lett., 107, 515–522, 1991.
21. Mayhew, M.A. and J.L. LaBrecque, ‘‘Crustal geologic studies
with MAGSAT and surface magnetic data,’’ Rev. Geophys., 25,
971–981, 1987.
22. McEnroe,S. Fabian, A. K. Robinson, P. Gaina, C. and L.L
Brown, ‘‘Crustal magnetism, lamellar magnetism and rocks
that remember,’’ Elements,5, 241–246, 2009.
23. McMurry, P. “The Geology of the Precambrian to Lower
Paleozoic Rocks of Northern Nigeria - A Review,” in C.A.
Kogbe (ed.), Geology of Nigeria, Elizabethan Press, Lagos, p.
15-39, 1976.
24. Milligan, P.R. Petkovic, P. and B.J. Drummond, “Potential-
field datasets for the Australian region: their significance in
mapping basement architecture,” Geological Society of
Australia Special Publication 22 and Geological Society of
America Special Paper 372, pp. 129-139, 2003.
25. Murphy, B. “Airborne geophysics and the indian scenario”.
Journal of Indian Geophysics, 11(1), 1–28, 2007.
26. Mushayandebvu, M.F. van Driel, P. Reid, A.B. and J.D.
Fairhead, “Magnetic source parameters of two-dimensional
structures using extended Euler deconvolution,” Geophysics,
66, 814-823, 2001.
27. Muszala, S.P., Grindlay, N.R. and R.T. Bird, 1999, Three-
dimensional Euler Deconvolution and Tectonic
Interpretation of Marine Magnetic Anomaly Data in the
Puerto Rico Trench: Journal of Geophysical Research, v.
104/B12, p. 29,175-29,187.
28. Nabighian, M.N. and R.O. Hansen, “Unification of Euler and
Werner deconvolution in three dimensions via the
generalised Hilbert transform,” Geophysics, 66, 1805-1810,
2001.
29. Nettleton, L.L. “Gravity and Magnetics in oil prospecting”.
McGraw-Hill, New York, 394-413, 1976.
30. Okpoli, C.C. and Akingboye A.S. 2016. Reconstruction and
appraisal of Akunu–Akoko area iron ore deposits using
geological and magnetic approaches Materials and
Geoenvironment- Materiali in Geookolje vol.63,pp 35-54.
31. Okpoli, C.C. and Eyitoyo, F.B. 2016. Aeromagnetic study of
Okitipupa region, Southwestern Nigeria. International Basic
and Applied Research Journal, 2(7), pp. 1-20.
32. Okunlola, O. A. Adeigbe, O. C. and O. O. Oluwatoke, “An
Assessment of features of schistose rocks of Ibadan area,
Southwestern Nigeria,” Earth Sci. Resources Journal, 13(2),
119-133, 2009.
33. Olanrewaju, V.O. “Geochemistry of Charnockite and Granite
Rocks of the Basement Complex around Ado-Ekiti – Akure,
Southwest, Nigeria,” (PhD Thesis), University of London,
London, 1981.
34. Osinowo, O.O. and A.I. Olayinka, “Aeromagnetic Mapping of
Basement Topography around the Ijebu-Ode Geological
Transition Zone, Southwestern Nigeria,” Acta Geodaetica et
Geophysica., v. 48/3, p. 451-470, 2013.
35. Oversby, V.M. “Lead Isotope Study of Aplites from the
Precambrian Basement Rocks near Ibadan, Southwestern
Nigeria,” Earth Planets. Sci. Lett., v. 27, p. 177 – 180, 1975.
36. Peterson, N.V Groh, E.A. Taylor, E.M. and D.E. Stensland,
“Geology and Mineral Resources of Deschutes County
Oregon,” Oregon Department of Geology and Mineral
Industries Bulletin, v. 89, p. 1-62, 1976.
37. Phillips, J.D. Saltus, R.W. and R.L. Reynolds, “Sources of
Magnetic Anomalies Over a Sedimentary Basin - Preliminary
Results from the Coastal Plain of the Arctic National Wildlife
Refuge, Alaska,” in R.I. Gibson and P.S. Millegan (eds.),
Geologic Applications of Gravity and Magnetics: Case
Histories: Society of Exploration Geophysicists and American
Association of Petroleum Geologists, p.130-134, 1998.
38. Pilkington, M. and J.A. Percival, ‘‘Relating crustal
magnetization and satellite-altitude magnetic anomalies in
the Ungava Peninsula, northern Qu´ebec, Canada,’’ Earth
planet. Sci. Lett., 194, 127–133, 2001.
39. Ravat, D. Whaler, K. Pilkington, M. Sabaka, T. and M.
Purucker, ‘‘Compatibility of high-altitude aeromagnetic and
satellite altitude magnetic anomalies over Canada,’’
Geophysics, 67, 546–554, 2002.
40. Reid, A.B. Allsop, J.M. Granser, H. Millett, A.J. and I.W.
Somerton, “Magnetic Interpretation in Three Dimensions
Using Euler Deconvolution,” Geophysics, v 55, p 80-91, 1990.
41. Roberts, R.L. W.J. Hinze and D.I. Leap, ‘‘Data enhancement
procedures on magnetic data from landfill investigations,’’ in
Geotechnical and environmental geophysics, Volume 2,
Environmental and groundwater, SEG Investigations in
Geophysics, No. 5, 261-266.1990
42. Roy, L. Agarwal, B.N.P. and R.K. Shaw, “A New Concept in
Euler Deconvolution of Isolated Gravity Anomalies,”
Geophysical Prospecting, v. 48/3, p. 559-575, 2000.
43. Silva, A. Pires, A. Mccafferty, A. De Moraes, R. and H. Xia,
‘‘Application of Airborne Geophysical Data to Mineral
Exploration in the Uneven Exposed Terrains of the Rio Das
Velhas Greenstone Belt,’’ Revista Brasileira de Geociências,
33, 17-28, 2003.

© 2017 Discovery Publication. All Rights Reserved. www.discoveryjournals.org OPEN ACCESS
ARTICLE
Pag
e63
5
ANALYSIS
44. Spector, A. and F. Grant, ‘‘Statistical Models for Interpreting
Aeromagnetic Data,’’Geophysics, v. 35, p. 293-302, 1970.
45. Spector, A. and F. Grant, “Statistical Models for Interpreting
Aeromagnetic Data,” Geophysics, v. 35, p. 293-302, 1970.
46. Talabi, A.O. “Hydrogeochemistry and Stable Isotopes (δ18O
and δ2H) Assessment of Ikogosi Spring Waters,” American
Journal of Water Resources, v. 1/3, p. 25-33, 2013.
47. Telford, W. I. Gelbert, and R. Sheritt, Applied Geophysics
(Second ed.). London: Cambridge University Press, pp 759,
1990.
48. Thompson,D.T. “EULDPH—A New Technique for Making
Computer Assisted Depth Estimates from Magnetic Data,”
Geophysics, v 47, p 31-37, 1982.
49. Wasilewski, P.J. and Mayhew, M.A., ‘‘The Moho as a
magnetic boundary revisited,’’ Geophys. Res. Lett., 19, 2259–
2262, 1992.