Embed Size (px)
Citation preview

Journal of Wind Engineering
and Industrial Aerodynamics 92 (2004) 935–958
Aerodynamics of spinning and non-spinningtennis balls
S.R. Goodwill*, S.B. Chin, S.J. Haake
Department of Mechanical Engineering, University of Sheffield, Mappin Street, Sheffield S1 3JD, UK
Received 11 December 2003; received in revised form 20 May 2004; accepted 20 May 2004
Abstract
The aerodynamic properties of a tennis ball are obtained using wind tunnel measurements.
In the first phase of this study, the drag coefficient of a variety of new and used non-spinning
tennis balls was measured. The measurements were conducted in the Reynolds number range
of 85� 103oReo250� 103; which corresponds to a velocity range of 20oUo60ms�1
(45oUo135mph). The data for the new tennis balls revealed that all balls have similar drag
coefficients, within the repeatability of the experiment. However, it was shown that a heavily
worn ball exhibits a significant decrease in drag coefficient. A simple trajectory plot was used
to illustrate the significance of this drop in CD; on a typical tennis stroke. It was shown that ifthe drag coefficient of the worn ball was reduced even further, then the ball would travel faster
through the air, and give the receiver a significantly shorter time to react to the shot.
In the second phase of this study, the drag and lift coefficients of new and used spinning
tennis balls was measured. This testing was conducted by placing the ball inside the working
section of the wind tunnel, held between two horizontal shafts. The ball was spun at rates up
to 2750 rpm, which is representative of a typical top spin shot hit by a professional player. The
data showed that the lift coefficient for all the new balls was identical. However, the lift
coefficient was generally lower for the heavily worn ball compared with the new ball. A
trajectory plot was calculated to illustrate the effect of the lower drag and lift coefficients of the
worn ball, compared to the new ball. It was shown that the lift coefficient value has little effect
on the reaction time of the receiver. It was also shown that a lower lift coefficient reduces the
window of opportunity for the server because the player is less able to utilise the spin to
control the shot to ensure that the ball both clears the net and also lands in the service box.
This highlights the fact that it may not be in the manufacturers interest to produce a ‘faster’
tennis ball with a lower drag coefficient, because the ball may also have a lower lift coefficient,
thus reducing the players ability to play certain strokes.
r 2004 Elsevier Ltd. All rights reserved.
ARTICLE IN PRESS
*Corresponding author. Tel.: +44-114-2227770; fax: +44-114-2227855.
E-mail address: [email protected] (S.R. Goodwill).
0167-6105/$ - see front matter r 2004 Elsevier Ltd. All rights reserved.
doi:10.1016/j.jweia.2004.05.004

1. Introduction
The origins of tennis lie in the 12th century when it was played in the courtyards ofthe great and the good of Europe and was known as jeu de paume. This evolved intothe game Royal Tennis or Real Tennis. It remained a game for the rich and elite until1874 when Major Clopton Wingfield ‘invented’ the game of lawn tennis, which hecalled ‘sphairistike’. This was helped by the development of the rubber industry inthe mid-late 1800s to make the balls.One of the first recorded observations regarding the aerodynamics of tennis balls
was made by Newton [1]. Two hundred years later, Lord Rayleigh [2] used theclassical potential flow theory for flow around a cylinder with circulation to describethe irregular flight of a tennis ball. However, despite these interesting observations,significant advances in the research into the mechanics of the game is relativelyrecent. Indeed, in the first review on sports ball aerodynamics [3], no scientific studieson tennis balls could be identified and so tennis ball aerodynamics were notdiscussed.The trajectory of a tennis ball is determined by the gravitational and aerodynamic
forces which act on it during its flight. The first published study of the aerodynamicforces which act on the ball was that by Stepanek [4]. In that paper, the lift and dragcoefficients of a tennis ball were obtained for a simulated top-spin lob. Theaerodynamic forces which act on the tennis ball were determined by launchingspinning tennis balls into a wind tunnel air stream. The measured trajectories wereused to determine the drag and lift coefficients (CD and CL; respectively) for airspeeds of up to 28m/s (63mph) and spin rates of 3250 rpm. That study concludedthat these coefficients were dependent on the spin coefficient, but independent ofReynolds number (Re). Stepanek measured values of between 0.54 and 0.75 for CD;
ARTICLE IN PRESS
Nomenclature
A projected ball areaCD drag coefficient (¼ FD=1=2rAU2)CL lift coefficient (¼ FL=1=2rAU2)d ball diameterFD drag force on the ballFL lift force on the ballRe Reynolds number (¼ Ud=n)S spin coefficient (¼ V=U)U wind tunnel velocityV circumferential velocity at edge of balln kinematic viscosity of airm dynamic viscosity of airr density of air
S.R. Goodwill et al. / J. Wind Eng. Ind. Aerodyn. 92 (2004) 935–958936

and between 0.07 and 0.27 for CL; for spin coefficients which ranged between 0.05and 0.7. Furthermore, the extrapolated value of CD for a non-spinning tennis ballwas found to be 0.51. Chadwick and Haake [5] mounted tennis balls on a forcebalance in a wind tunnel, and obtained a CD of about 0.53 for both standard andover sized tennis balls. They found that CD was independent of Re over the narrowrange which was tested (200� 103oReo270� 103). Chadwick and Haake alsoshowed that the CD of the tennis ball could be increased by approximately 6%simply by raising (or fluffing) the nap. Similarly, it was shown that the CD could bereduced by 6% simply by electric shaving the ball. Smoke flow visualisations wereused to illustrate that the increase/decrease in drag was due to the increase/decreasein the size of the wake behind the ball.In a later study, Mehta and Pallis [6] used smoke flow visualisation and drag force
measurements to thoroughly explain the aerodynamic properties of a non-spinningtennis ball. They reported that the CD of new tennis balls was between 0.6 and 0.7 forRe between 80� 103 and 300� 103, and that CD was reduced at high Re; and thiswas assigned to the nap ‘laying down’ at the high wind speeds. They also tested aselection of tennis balls which had been used for a number of games, by recreationallevel players (using two balls at a time). They reported that the drag coefficient was6% higher (than a new ball) after the ball had been used for six games, but then CD
was 6% lower (than a new ball) after the ball had been used for nine games. Mehtaand Pallis explained this by using anecdotal evidence in which players claimed thatthe ball fluffs up initially upon use, and then after nine games the cover will haveworn and thus exhibit a lower value of CD: The magnitude of the change in CD isidentical to that reported by Chadwick [5] for fluffed up and shaved balls. Thiscomparison has an interesting implication for the game of tennis because it impliesthat a ball typically exhibits extreme changes in CD; equal to those of a fluffed orshaved ball, in the first several games of the ball’s life.Mehta and Pallis noted that the drag coefficient of a new tennis ball was higher
than that of the standard result for a smooth sphere (CD ¼ 0:5). They illustrated thatthe flow over a tennis ball must be in the transcritical regime, when CD is essentiallyindependent of Re: The additional drag acting on the tennis ball has been assigned tothe pressure drag on the individual fuzz elements of the nap. Clearly, as the ballwears, the number of fuzz elements will decrease and thus the additional drag willreduce. Mehta and Pallis illustrated that the reduction in CD for worn balls is due tothis reduction in fuzz drag.The preceding paragraphs have shown that CD of a non-spinning new tennis ball
is between 0.53 and 0.70. Some of this difference can be accounted for by thedifferent ranges of Re which were used to obtain the data. Furthermore, the differentmethods used by the authors to measure the ball diameter also lead to disagreementbetween the measured values of CD: Also, the sensitivity of the force balance, and themethod used to account for the presence of the sting which is supporting the tennisball, will influence the accuracy of CD:Since there are many studies which have thoroughly described flow over a non-
spinning new tennis ball, it will not be repeated in the current study. However, thereis little published literature on the aerodynamics of spinning tennis balls. Mehta and
ARTICLE IN PRESSS.R. Goodwill et al. / J. Wind Eng. Ind. Aerodyn. 92 (2004) 935–958 937

Pallis [6] presented a flow visualisation study in which an 280mm diameter tennisball was spun in a wind tunnel for a range of Re (up to 280� 103). The size of the ballwas increased to enable higher Re to be tested, at lower wind speeds. However, thefelt was not scaled to match the increased size of the ball. They showed that theboundary layer separates earlier on the side of the ball which is moving upwind,compared to the side which is moving downwind. The resulting asymmetric wakeproduces a lateral (Magnus) force acting on the ball. They found that this forceoccurred in the expected direction for the full range of speeds and spins which weretested, which suggested that the transition from laminar to turbulent boundary layerhad already occurred on both sides of the ball.As far as the authors are aware, Stepanek [4] published the only paper presenting
quantitative data on the aerodynamic properties of a spinning tennis ball for arelatively low wind speed, for only one type of tennis ball. In this current study, thedrag and lift coefficients of spinning tennis balls are obtained for a full range ofrelevant wind speeds and ball types. This work is sponsored by the InternationalTennis Federation (ITF), who are the governing body of tennis. The main aim of thisstudy was to benchmark the aerodynamic properties of tennis balls which areavailable on shop shelves. Furthermore, the ITF intends to further their knowledgeof the mechanics of the game by understanding the aerodynamic properties of a widerange of ball types. Currently, the rules of tennis do not specify any technicalspecifications regarding the outer covering on a tennis ball, as noted by Mehta andPallis [6]. The ITF rule simply states that, ‘‘The ball shall have a uniform outersurface consisting of a fabric cover and shall be white or yellow in colour’’. Thefindings of this study will aid the ITF in deciding whether a new ruling, regarding theaerodynamics of the ball surface, is required to protect the nature of the game. Thiswould be implemented to prevent manufacturers from exploiting a possible loop holein the ball rules, and prevent them from introducing a tennis ball with radicallydifferent aerodynamic properties compared to a current tennis ball.
2. Experimental methods
There are two main methods which can be used to measure the aerodynamic forcesacting on a spinning tennis ball. The first method involves propelling the ballthrough air and measuring the trajectory of the ball. This may involve the ball beingpropelled through ‘still’ air using a high-precision cannon [7], or being dropped intothe working section of a wind tunnel [8]. The main problem associated with thistechnique is that the sampling of the ball displacement is susceptible to a finite error.The calculated force which acts on the ball is extremely sensitive to the accuracy ofthe sampled ball displacement data. This aspect of this experiment means that largeerrors in the force calculation are observed which increase the uncertainty of the finalresults. Furthermore, in this experiment, it must be assumed that, for example, thespin remains constant throughout the test.An alternative method involves supporting the ball on a rotating force balance
inside the wind tunnel test section. This enables the ball to be spun in a flow of air,
ARTICLE IN PRESSS.R. Goodwill et al. / J. Wind Eng. Ind. Aerodyn. 92 (2004) 935–958938

and the resultant force which acts on it can be sampled directly. The mainconsideration for this type of experiment, is to ensure that the ball supports do notinterfere with the flow of air over the ball.Various authors [9,10] have supported a rotating sphere in a wind tunnel. These
two papers describe two different methods which can be used to spin the sphere.Bearman and Harvey supported an oversize golf ball (100mm diameter) at its centreby a vertical, taut wire (0.5mm diameter) and the model was spun by a motorassembly housed inside the model. The thin wire minimises interference on the flowof air over the ball. Watts and Ferrer supported a baseball (74mm diameter) usingtwo rigid, horizontal stings (6.3mm diameter). Bearman and Harvey measured theCD of a smooth sphere using their apparatus, and found that it was equal toapproximately 0.51 thus proving that the supports did not interfere with the flow ofair over the ball. However, Watts and Ferrer did not perform this experiment, andtherefore it is not possible to conclude whether the data quoted in their paper wasinfluenced by the presence of the stings.The intricate spinning method used by Bearman and Harvey would be unsuitable
for this study as it would be impossible to place the motor inside the tennis ball,without damaging the felt in some way. However, a method similar to that used byWatts and Ferrer would be suitable, and this method is described in the followingsection.
2.1. Wind tunnel details
The wind tunnel was supplied by Aerotech ATE Ltd. A slotted wall test sectionhas been fitted to reduce blockage effects normally associated with closed wall testsections. The test section (305mm� 355mm) is fitted with 30% open area ratio wallswhich is based upon the technology developed for automotive wind tunnels [11,12].A honeycomb section settling chamber with a contraction ratio of 10:1 and twoscreens, results in high-quality flow.The velocity variation along the entire test section was 70.25%, across the entire
test section was 70.3% and the turbulence intensity in the test section was 0.3%.The wind tunnel was operated over a range of wind speeds between 20 and 60ms�1
(45 and 135mph), which correspond to Re of between 80� 103 and 250� 103.Although the highest recorded service speed is 149mph [13,14] showed that theaverage first serve speeds are closer to 110mph for top male professionals. Stepanek[4] asked two Davis Cup players to hit a ‘heavy’ top-spin shot and measuredmaximum spin rates of 3000 rpm. These two studies illustrate typical speeds andspins which should be used in this study.The ball is supported in the centre of the test section using two horizontal stings,
as shown in Fig. 1. The stings have a stepped profile to reduce the interferencearound the ball whilst maximising the strength of the sting and minimising thevibration of the ball. Each sting has a diameter of 3.5mm and extends up to 35mmaway from each side of the ball. Preliminary testing showed that this is the criticalarea in which the interference of the air flow over the ball must be minimised. Afurther 85mm of the sting is shrouded by a elliptical shroud with a height and width
ARTICLE IN PRESSS.R. Goodwill et al. / J. Wind Eng. Ind. Aerodyn. 92 (2004) 935–958 939

of 20 and 35mm, respectively, to reduce further the load which could act on thesting. This resulted in a test section blockage of only about 6% (based on cross-sectional area) which is negligible for a 30% open area slotted working section [12],and therefore blockage corrections were not applied.The support mechanism shown in Fig. 1 allowed the ball to be rotated at a
constant angular velocity whilst simultaneously measuring the drag and lift forces.The motor and bearing housings both had to be supported by the balances to ensurethat the load was correctly transferred to the balance. Each balance was housed in asealed unit and was mounted on vertical struts which were located outside the slottedwall test section. The balances were bespoke units supplied by Aerotech ATE Ltd.Each channel of the two component force balance was sampled and routed intodedicated sensor units which provide digital, high-resolution output from eachchannel. Communication to the NI FlexMotion (PCI-6C) data acquisition systemwas via RS485 serial communication ports and bespoke software was used to readthe signals. The force balance had been previously calibrated by Aerotech and waschecked prior to the commencement of each test. The magnitude of the uncertaintyin the measurement of load was of the order of 10�4N, and therefore insignificant inthe calculation of CD:The poles of a tennis ball were marked using a purpose built rig. A hole was drilled
at one pole and the ball was then filled with a polyurethane foam to ensure structuralstability of the balls during testing. Another hole was then drilled into the other poleof the ball. Small plastic inserts were secured in the holes using integral cross-headedscrews. The ends of the stings were fitted with posi-drive screw driver ends which satin the cross-headed screws and enabled the torque from the motors to be transferredto the ball. One sting was spring loaded which allowed easy installation of the ball.
ARTICLE IN PRESS
Fig. 1. Ball supported in working section of the wind tunnel.
S.R. Goodwill et al. / J. Wind Eng. Ind. Aerodyn. 92 (2004) 935–958940

The diameter of the ball was determined using Vernier callipers, following Mehtaand Pallis [6]. The ball was gripped between the callipers and the callipers wereslowly released. The measurement was recorded when the ball dropped, under itsown weight, through the callipers. An average diameter was determined frommeasurements across several axes through the ball. This averaging technique wasadopted due to the non-homogeneity of the ball, and to minimise the errorsassociated with the use of the Vernier callipers in measuring a non-rigid object. Therepeatability of the measurement was 70.2mm.
2.2. Testing procedure
In all the experiments, the air stream temperature and pressure were measuredusing high-accuracy transducers (Type LM35DZ and SensorTechnics PTE5001D,respectively), which were sampled by the PC control unit. The wind speed wascalculated using the differential pressure measured between two pressure tapings,which were located in the settling chamber and the plenum. This differential pressurewas regularly compared with the total and static pressures measured using a pitot-static tube placed at the centre of the empty test section. The maximum uncertaintyin the wind speed measurement was 70.1m/s at 20m/s. When the wind tunnel hadsettled to a constant speed, the wind speed and force balance signal were sampled at10 counts per second, for 10 s. Mean values of these two parameters were calculatedto minimise the noise in the data.
2.2.1. Non-spinning balls
The loading due to the stings is accounted for in the calculation of CD by the tareloading of the system. The tare ball is placed in the position of the test ball,supported on a separate vertical sting, to ensure that the effect on the flow of air dueto the presence of the ball is accounted for. This ball has holes drilled at the poles,where the inserts would normally be placed. It is important to ensure that the tareball does not touch either of the horizontal stings, so that the load measured by theforce balances is solely due to that of the drag on the stings.
2.2.2. Spinning balls
Chadwick [15] reported that the tare drag which acts on the stings is not a functionof the spin rate of the stings. Therefore, the tare drag data collected for the non-spinning ball was also used for the spinning ball experiments.In the spinning ball tests, the calculation of CL needs to account for the tare lift
force which acts on the spinning stings. This force is not obtained easily due to thesafety features incorporated into the control software of the ITF wind tunnel. Thesesafety features prevented the stings from spinning when the ball was not in place.However, the magnitude of these loads can be estimated using the data published byChadwick [15], in which a very similar experiment was conducted. Chadwickestimated that the maximum lift forces acting on the stings are only 0.016 and0.033N at wind speeds of 25 and 50m/s, respectively, at the maximum spin rate of3000 rpm.
ARTICLE IN PRESSS.R. Goodwill et al. / J. Wind Eng. Ind. Aerodyn. 92 (2004) 935–958 941

Preliminary work by the authors revealed that the tare loads calculated using thedata of Chadwick represent between 4% and 6% of the lift load measured by theforce balances. Therefore, as an approximation, the tare lift load can be assumed tobe equal to 5% of the sampled lift load from the force balance.The lift and drag loads which acted on the balance when the shafts were spun at
zero wind speed were obtained for the full range of spin rates. These loads increasedwith spin rate, but the maximum value was less than 0.05N. These loads wereaccounted for in the analysis of the measurements of CD and CL of spinning tennisballs.
2.3. Flow interference
In order to verify the accuracy of the force balance and wind speed measurementsystem, an additional test was conducted using a smooth epoxy-resin sphere with asimilar diameter (d ¼ 66:0mm) as a standard tennis ball. The results in Fig. 2compare reasonably well with the classic data of Achenbach [17], who reported aconstant CD of 0.5170.01 over the range of Re tested here. In this study, the smoothsphere exhibits a constant CD of approximately 0.5470.01, which is about 5%higher than that reported by Achenbach. This difference may be associated witherrors in the measurement of wind speed or drag load. Alternatively, it may becaused by interference of the flow pattern over the ball, due to the presence of thesupport stings. Achenbach’s data was obtained using a sphere that was mountedfrom the rear to minimise interference. To recreate Achenbach’s experiment in theAerotech ATE wind tunnel, the Aerotech force balance (Fig. 1) was removed andreplaced with a three-component balance manufactured by TEM Engineering Ltd.This three-component balance supported the smooth sphere from the rear. Usingthis arrangement, a constant CD of 0.5170.01 over the range of Re tested here, wasobtained. This result implied that the higher than expected values of CD for a smooth
ARTICLE IN PRESS
Fig. 2. Drag coefficient of eight different brands of new tennis ball.
S.R. Goodwill et al. / J. Wind Eng. Ind. Aerodyn. 92 (2004) 935–958942

sphere, as shown in Fig. 2, were due to flow interference caused by the presence ofthe side supports.It has been shown above that the side supports (in Fig. 1) affect the flow over the
sphere/ball, as indicated by the CD values which were found to be 5% higher thanexpected. This is an inherent problem associated with this method of supporting aspinning object in a wind tunnel. Several other designs of side support were tried bythe authors, and this was the optimum configuration. It is assumed that this will be asystematic error that affects all ball types equally. Therefore, the results obtained willstill provide a valid comparison of the aerodynamic properties of various types oftennis ball.
2.4. Balls tested
A large selection of tennis balls were tested in this study to cover the wide range ofballs used in the game of tennis. Tennis balls are typically covered with a felt whichdefines them either as woven cloth or needle cloth balls. Woven cloths are producedby the long-established processes of weaving, raising and fulling [16]. These clothshave a high wool content (50–65%) and the remainder of the fibre content is madeup of nylon. Woven cloths are used predominantly for top quality balls. Needlecloths are produced with a mat of randomly orientated fibres which are progressivelypushed into a base cloth by a large number of barbed needles which cyclically travelthrough the fibres. This action gradually produces a continuous interlockingstructure held together by inter-fibre friction. Needle cloths are generally cheaper toproduce when compared with woven cloth. However, they tend to lose their napmore quickly and are mainly used at the lower end of the tennis ball market.In this study, five different ball brands which are covered in woven cloth (Melton)
and three ball brands which are covered in a needle cloth were tested. A tube (3 balls)of each of the eight brands was purchased off the shelf for the purpose of this testing.A selection of worn tennis balls were also tested in this study. There is no fixed
amount of impacts to which a ball is subjected to during a point, game or match.However, if it is assumed that on average there are four shots per point and sixpoints per game, and six balls are used at a time, then each ball is only actuallysubjected to four shots per game. In the professional game, the balls are changedevery nine games, hence each ball, on average, is subjected to just 36 shots. Inpreliminary testing by the authors, it was found that CD was unaffected by thenumber of impacts that the ball was subjected to, for impacts up to 60 shots. Thiscontradicts the findings of Mehta and Pallis [6] who showed that the CD of a tennisball changed significantly with the number of impacts that a ball was subjected to.This may be due to the different way in which wear was achieved in both studies.The aim of the wear testing conducted in the current study was to investigate
whether the aerodynamic properties of a tennis ball would change significantly withprolonged use. This would be of most interest to a leisure standard player who islikely to use the same ball for a far longer period than a professional player.However, it would also help fulfil the aim of this study which was to benchmark theaerodynamic properties of a tennis ball.
ARTICLE IN PRESSS.R. Goodwill et al. / J. Wind Eng. Ind. Aerodyn. 92 (2004) 935–958 943
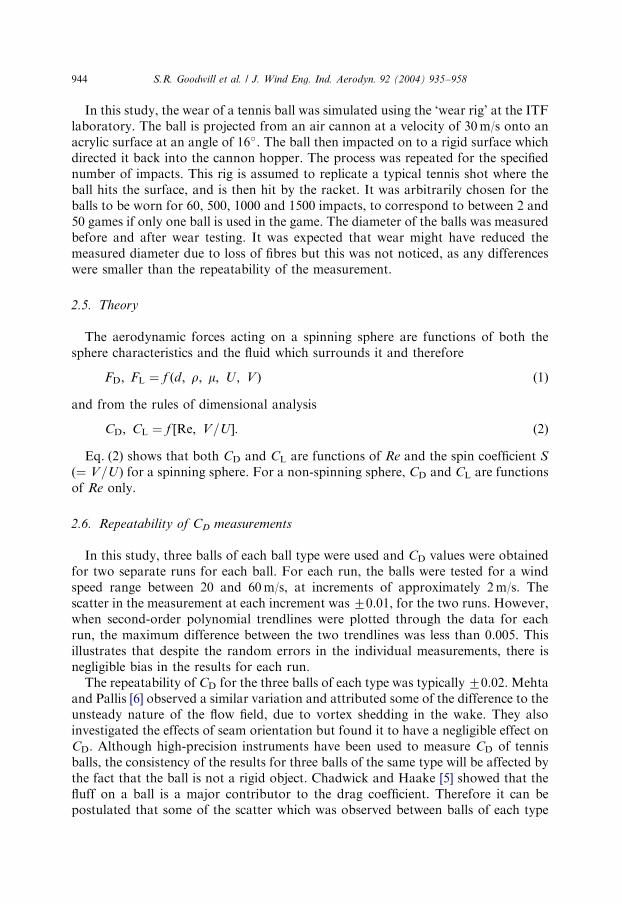
In this study, the wear of a tennis ball was simulated using the ‘wear rig’ at the ITFlaboratory. The ball is projected from an air cannon at a velocity of 30m/s onto anacrylic surface at an angle of 16�. The ball then impacted on to a rigid surface whichdirected it back into the cannon hopper. The process was repeated for the specifiednumber of impacts. This rig is assumed to replicate a typical tennis shot where theball hits the surface, and is then hit by the racket. It was arbitrarily chosen for theballs to be worn for 60, 500, 1000 and 1500 impacts, to correspond to between 2 and50 games if only one ball is used in the game. The diameter of the balls was measuredbefore and after wear testing. It was expected that wear might have reduced themeasured diameter due to loss of fibres but this was not noticed, as any differenceswere smaller than the repeatability of the measurement.
2.5. Theory
The aerodynamic forces acting on a spinning sphere are functions of both thesphere characteristics and the fluid which surrounds it and therefore
FD; FL ¼ f ðd; r; m; U ; V Þ ð1Þ
and from the rules of dimensional analysis
CD; CL ¼ f ½Re; V=U �: ð2Þ
Eq. (2) shows that both CD and CL are functions of Re and the spin coefficient S
(¼ V=U) for a spinning sphere. For a non-spinning sphere, CD and CL are functionsof Re only.
2.6. Repeatability of CD measurements
In this study, three balls of each ball type were used and CD values were obtainedfor two separate runs for each ball. For each run, the balls were tested for a windspeed range between 20 and 60m/s, at increments of approximately 2m/s. Thescatter in the measurement at each increment was70.01, for the two runs. However,when second-order polynomial trendlines were plotted through the data for eachrun, the maximum difference between the two trendlines was less than 0.005. Thisillustrates that despite the random errors in the individual measurements, there isnegligible bias in the results for each run.The repeatability of CD for the three balls of each type was typically70.02. Mehta
and Pallis [6] observed a similar variation and attributed some of the difference to theunsteady nature of the flow field, due to vortex shedding in the wake. They alsoinvestigated the effects of seam orientation but found it to have a negligible effect onCD: Although high-precision instruments have been used to measure CD of tennisballs, the consistency of the results for three balls of the same type will be affected bythe fact that the ball is not a rigid object. Chadwick and Haake [5] showed that thefluff on a ball is a major contributor to the drag coefficient. Therefore it can bepostulated that some of the scatter which was observed between balls of each type
ARTICLE IN PRESSS.R. Goodwill et al. / J. Wind Eng. Ind. Aerodyn. 92 (2004) 935–958944

may simply be due to the random orientation of the fluff caused by differences in thehandling and storage of the balls.To summarise, it was found that the results for a specific ball repeated very well,
despite some random error in individual measurements. However, the repeatabilityof CD between balls of the same type was typically 70.02.
3. Results—non-spinning balls
Fig. 2 shows the drag coefficient values for all the new tennis balls and a smoothsphere. The wind speed quoted on the upper abscissa is that for a standard sizedtennis ball (d ¼ 65:0mm). For clarity, the average CD values for the three balls ofeach type have been used. It can be seen that CD of a tennis ball reduces from a valueof approximately 0.66 at Re of 80� 103, to a value of approximately 0.62 for 125�103oReo250� 103: This is in agreement with those found by Mehta and Pallis [6]over a similar range of Re: The reduction in CD as Re increases is a well establishedresult and can simply be assigned to the nap ‘laying down’ at the higher wind speeds.A reduction in CD of 0.04 would be measured if the diameter of the projected area ofthe ball reduced by 2.0mm. Images of the nap ‘laying down’ at high wind speeds [15]confirmed that this reduction in diameter was of the correct order of magnitude.Fig. 2 shows that there is no discernable difference in CD of all the different ball
brands, except the Woven B and Needle B balls. The CD of these two balls istypically 0.01–0.02 lower than that of the other ball brands, which is within therepeatability of the data. Hence, it can not be concluded that there is any significantdifference between ball brands, a conclusion also reached by Mehta and Pallis [6].Fig. 3 shows the drag coefficient data for the worn tennis balls. Two balls were
tested for each number of impacts and the average CD are plotted in this figure. Itcan be seen that the drag coefficient again reduces with Re: This has previously beenassociated with the fluff ‘lying down’, for the new balls. There was little fluff left onthe heavily worn ball (1500 impacts), but the majority of the base felt remained. This
ARTICLE IN PRESS
Fig. 3. Drag coefficient of five worn tennis balls.
S.R. Goodwill et al. / J. Wind Eng. Ind. Aerodyn. 92 (2004) 935–958 945

fabric surface has a very low stiffness and is easily deformable. The reduction in CD
with Re; for this worn ball, may be due to this surface deforming which would resultin a decrease in the projected area of the ball. Alternatively, the reduction in CD withRe may not be due to a physical change in the diameter of the ball, but may be due toa change in the surface roughness of the ball. Mehta and Pallis [6] explained that theflow over a tennis ball is in the transcritical regime, where CD is essentiallyindependent of Re: Achenbach [18] showed that, in the transcritical regime, CD for arough sphere decreases as the surface roughness reduces. It could be postulated thatthe wind flowing over a tennis ball acts to reduce the surface roughness, by pushingany loose fibres onto the base felt. As the wind speed is increased, the surfaceroughness will decrease, and this would be accompanied by a drop in CD:Fig. 3 shows similar trends for all the number of impacts, suggesting that the
relationship between CD and the number of impacts is independent of Re: A clearerindication of this is given in Fig. 4, in which CD is plotted as a function of thenumber of impacts, for two different wind speeds. It can be seen that CD remainsapproximately constant for balls subjected to 0, 60 and 500 impacts. The dragcoefficient of the ball subjected to 1500 impacts is 0.04 lower than that of the newball.The data presented by Mehta and Pallis [6] for a ball used in the US Open is also
shown in Fig. 3. It can be seen that CD of this ball is significantly lower than that ofall the balls which were tested in this study. The CD of the US Open ball is typicallyp0.1 lower than that of the new ball tested in this study. Even the most heavily wornball (1500 impacts) only exhibited a drop of 0.04 in CD in this study. Withoutobserving the surface of the US Open ball, it is difficult to hypothesis why theyobtained very low values of CD:An interesting observation from Figs. 2 and 3 is that, for the range where Re
increases from 175� 103 to 250� 103, CD actually rises by approximately 0.01. This
ARTICLE IN PRESS
Fig. 4. Effect of wear on CD for two different wind speeds.
S.R. Goodwill et al. / J. Wind Eng. Ind. Aerodyn. 92 (2004) 935–958946

rise in CD is only very small and therefore may not be significant. However, thisfinding was also evident in the work by Mehta and Pallis [6] and Chadwick andHaake [8] but no comment was made in either of these studies.
3.1. Implication to the game of tennis
The wind tunnel has been successfully used here to determine CD for non-spinningtennis balls. This data, although valuable in its own right, does not quantify thedifferences that a player will notice when using the balls. Accurate trajectory plotsare a far more useful method of illustrating the differences in CD; as shown by Haakeet al. [19]. The authors have developed the TennisGUT modelling software to modelthe mechanics of the game of tennis including the impact between the ball andracket, and that between the ball and surface. The trajectory of the ball is governedby simple Newtonian mechanics, with inputs from experimentally obtained values ofCD and CL:To illustrate the effect of CD on the game of a tennis, a typical flat first serve (non-
spinning) was simulated. It was assumed that the ball left the racket at a speed of120mph (50.0m/s), 6.2� below the horizontal and 2.7m above the ground, the ballrebounded from the surface with a coefficient of restitution of 0.7, and a reboundangle ratio of unity. These parameters simulated an impact on an acrylic surface [19].Fig. 3 shows that CD remains approximately independent of Re for wind speeds
above 30ms�1, and therefore it was assumed that CD was constant throughout thetrajectory of the serve being simulated here. Hence the CD of a new (0 impacts) and aheavily worn (1500 impacts) ball tested here are 0.64 and 0.6, respectively, for theserve being simulated. For comparison, the US Open ball used by Mehta and Pallis[20] has a constant CD equal to 0.54 for the simulated serve. The trajectories of thesethree balls are plotted in Fig. 5. Each of these three standard size balls was assumedto have a diameter of 65.0mm, and a mass of 0.057 kg. For comparison, thetrajectory of an oversize ball (6.5% larger diameter and identical mass) is alsoshown. Chadwick and Haake [5] and Mehta and Pallis [6] concluded that an oversizeball has the same CD as a standard ball. Therefore, the oversize ball in Fig. 5 has aCD of 0.64. In the trajectory plots, any differences in flight are due to either CD or theball diameter.The trajectory was terminated after 0.68 s which is approximately the time taken
for the ‘fastest’ ball to reach the baseline. It can be seen that the ball subjected to1500 impacts (CD ¼ 0:60) travels approximately 300mm further than the new ball(CD ¼ 0:64), the US Open (CD ¼ 0:54) travels 750mm further than the new ball, andthe oversize ball travels 600mm shorter than the new ball.In a similar analysis, Haake et al. [19] concluded that the player would perceive a
significant increase in the reaction time for an oversize ball, when compared to astandard ball (with the same CD). This is supported by anecdotal evidence in whichplayers claim that the larger ball is slower, and gives them more time to play theirshot.Using the trajectory plots in Fig. 5, this would imply that a player would have a
significantly shorter reaction time if the US Open ball was used in a game, compared
ARTICLE IN PRESSS.R. Goodwill et al. / J. Wind Eng. Ind. Aerodyn. 92 (2004) 935–958 947

with a new ball. Furthermore, the ball subjected to 1500 impacts would reduce thereceiver’s reaction time but only by approximately 40% of that experienced whenusing the US Open ball.The trajectory plots in Fig. 5 illustrate the effect that CD and ball size have on the
game of tennis, for a typical first serve. The motivation for the development of anoversize tennis ball was the concern that the serving speed in the men’s professionalgame has increased to a point where the serve dominates the game. More specifically,the particular concern was that on fast surfaces, such as the grass courts atWimbledon, the game would become boring with receivers unable to return a highproportion of the first serves. Haake et al. [19] illustrated that an oversize ball wouldgive a receiver a significantly longer time to play their shot. Conversely, the analysisin this study has shown that a heavily worn tennis ball can actually magnify thedominance of the server.It has been found that CD changes with wear but diameter remains unchanged.
This implies that a manufacturer could make a ball which complies with the ITFruling on size, but exhibits lower drag forces. This ball would still ‘look like a tennisball’ and manufacturers could claim that it ‘travels through the air faster’.
4. Results—spinning tennis balls
4.1. Drag coefficient
In this section, the drag and lift coefficients of the balls are presented for twodifferent Re (105� 103 and 210� 103). For each Re; the spin was increased from 0 to2750 rpm, in 250 rpm increment. Two runs were conducted for each ball, and three
ARTICLE IN PRESS
Fig. 5. Predicted trajectory for three standard size tennis balls with different CD values, and a new oversize
tennis ball with the same CD as a new standard ball. The inset shows a close-up view of the end of the
trajectory (t ¼ 0:68 s).
S.R. Goodwill et al. / J. Wind Eng. Ind. Aerodyn. 92 (2004) 935–958948

balls of each type were tested. The repeatability of CD for each run was typically70.015, and between the three balls of each type was typically 70.025. Thisrepeatability was worse than that for the non-spinning ball tests, and this was likelyto be due to the unsteady flow field caused by the vibration of the spinning ball. Thevibration of the ball was minimised by filling the core with a rigid foam and byaligning the poles using an accurate jig. However, a tennis ball is a non-homogenousobject and a finite out-of-balance force will be inherent when the ball is spun.Figs. 6a and b show that the relationship between CD and the spin coefficient for
Re of 105� 103 and 210� 103, respectively. The spin coefficient S (¼ V=U) issmaller in Fig. 6b, compared to Fig. 6a, due to the higher U being used in this test.Both figures show that the maximum difference between the different balls for therange of S tested is within the repeatability of the measurement. Therefore, it canonly be concluded that all the balls behave similarly for the range of S tested.The values of CD at zero spin (S ¼ 0) corresponded to within approximately
70.02 of those obtained in the non-spinning tests, thus verifying that both sets ofdata are consistent. It can also be seen that the drag coefficient for each ball type ishigher in Fig. 6a compared to that in Fig. 6b, for the same spin coefficient S: Thisconfirms that CD is not solely a function of S; but is also dependent on Re:Both Figs. 6a and b show that CD increases with the spin coefficient. Fig. 6a shows
a significant increase from 0.65 to 0.69 for the range of spin coefficients. The increasein CD with spin rate is partly attributed to the induced drag force that is due to thegeneration of a lift (Magnus) force. Also, the surface of a tennis ball is not a rigidobject, and when caused to rotate, the fluff on the surface will attempt to ‘stand up’,thus increasing the projected area of the ball in the wind flow direction. This willinherently increase the drag force, and thus the calculated drag coefficient, when thespin coefficient is increased.The previous section shows that CD for a non-spinning ball decreases by
approximately 0.04, for balls worn by 1500 impacts, compared to new tennis balls.Spinning balls would be expected to show a similar difference in CD with number ofimpacts. This testing was conducted at two different wind speeds and the results arepresented in Figs. 7a and b.In Fig. 7a it can be seen that CD is dependent on the number of impacts that a ball
is subjected to. The balls subjected to 0 and 60 impacts act very similarly to all thenew balls in Fig. 6a, and there is no significant difference between these two balls.The drag coefficient of the balls subjected to 0 and 60 impacts increases with S due tothe increased projected area of the ball when it spins and the fluff begins to ‘standup’. Chadwick [15] confirmed that the cloth on a new ball ‘stands up’ when it is spunin a flow of air. The balls subjected to 500 and 1000 impacts exhibit a slight rise in CD
with S; but to a much smaller extent when compared to the new balls. The largestdifference between the balls can be seen for a spin coefficient S ¼ 0:15: At this valueof S; the CD of the heavily worn ball (1500 impacts) is approximately 0.61 whereasthe CD of the new ball is 0.67. The CD of the worn balls (500, 1000 and 1500 impacts)decreases in the range where S is increased from 0 to 0.2. It can be concluded that theCD of the new balls is at least 0.04 higher than that of the heavily worn balls (1500impacts).
ARTICLE IN PRESSS.R. Goodwill et al. / J. Wind Eng. Ind. Aerodyn. 92 (2004) 935–958 949

Fig. 7b shows the drag coefficient for the wind speed of 50ms�1. The dragcoefficient tends to increase slightly with increasing S; for all the worn balls.However, it should be noted that this effect is small for the range of S presented inFig. 7b. It can be seen that CD for the new ball is 0.03–0.04 higher than that of theheavily worn ball, for all values of S: This difference is of a similar order ofmagnitude as that found for non-spinning balls.
4.2. Lift coefficient
A sphere spinning in a flow of air will exhibit both drag and lift forces. The liftforce can be explained by the conventional Magnus effect because previous researchhas shown that a turbulent boundary layer separation would be expected for all Re
ARTICLE IN PRESS
Fig. 6. Drag coefficient for the eight different new tennis balls. The data was obtained at wind speeds of
(a) 25m/s (Re¼ 105� 103) and (b) 50m/s (Re ¼ 210� 103).
S.R. Goodwill et al. / J. Wind Eng. Ind. Aerodyn. 92 (2004) 935–958950

values tested in this study [6]. When the sphere spins, the separation point movesupstream on the advancing side of the ball, and downstream on the retreating side ofthe ball causing an asymmetric pressure distribution. This asymmetry causes aresultant force acting in the direction of the advancing side of the ball [15]. This forcewould cause a ball hit with top-spin to dip in flight. The faster the ball spins (relativeto its speed), the greater the force and the lift coefficient CL increases.The lift coefficient CL for the eight new tennis balls is given in Fig. 8a and b, and is
presented separately for the two different wind speeds. Fig. 8a illustrates the data forthe lower wind speed. It can be seen that there is no noticeable difference in thevalues, for all the different ball types. Also plotted in Fig. 8a is the lift coefficientdata obtained by Chadwick [15] which is significantly lower than that obtained in
ARTICLE IN PRESS
Fig. 7. Drag coefficient for the five worn tennis balls. The data was obtained at (a) U ¼ 25ms�1
(Re ¼ 105� 103) and (b) U ¼ 50ms�1 (Re ¼ 210� 103).
S.R. Goodwill et al. / J. Wind Eng. Ind. Aerodyn. 92 (2004) 935–958 951

this current study. Chadwick obtained a single relationship between CL and S; forwind speeds up to 26ms�1. However, it should be noted that Chadwick used a‘modified’ ball diameter of 73mm in the calculation of CL; whereas the typicaldiameter used in this study is 65mm. Chadwick used this larger diameter in anattempt to simulate the increase in projected area when a ball is spun and the fluffstands up. A simple calculation can be performed to illustrate that if Chadwick hadused a ball diameter of 65mm instead of 73mm, then Chadwick’s CL values whichare shown in Fig. 8 would be increased by 26%. This would make Chadwick’s dataidentical to that measured here.Fig. 8b illustrates the values of CL which were measured at the higher Re: It can be
seen again that there is no noticeable difference in the data for all ball types.Comparing Figs. 8a and b it can be seen that, for So0:1; the measured values of CL
are lower at the higher wind speed compared to the lower wind speed. The impliesthat CL is dependent on Re; for So0:1:However, for 0:1oSo0:2; it can be seen thatCL is similar in both figures, which implies that CL is independent of Re:The lift coefficient CL for the five worn tennis balls, measured at a wind speed of
25ms�1, is given in Fig. 9a. It can be seen that, for 0:05oSo0:15; the value of CL issignificantly lower for the balls which have been subjected to 500, 1000 and 1500impacts, compared to the new balls. For S > 0:15; the lift coefficient is approximatelyconstant for all the balls.Fig. 9b, which shows the data for the higher wind speed, does not show the same
trends as those which are evident in Fig. 9a. In this figure, for S > 0:1; the CL ishighest for the new ball (0 impacts), and lowest for the heavily worn ball (1500impacts). The maximum difference between these two balls is 0.03, which is similarto the repeatability of the data.To summarise, it has been found that CD and CL for a worn tennis ball are
generally lower than or equal to that of a new ball. This difference must beattributable to the surface of the balls. Both balls have the same diameter, but simpleobservation of the balls reveals that the new balls have more fluff. Mehta and Pallis[6] concluded that this fluff has a significant contribution to the total drag on the ballby effectively increasing the size of the wake. The lift force, on a spinning ball, isgenerated from the deflection of this wake, and so the magnitude of CL will bedependent on the size of this wake. If it is assumed that the separation points movethrough an equivalent angle on both the new and used balls, then clearly the new ballwill be subjected to a larger lift coefficient.It can be seen that the differences between the new and worn balls is smaller
at the higher wind speed, for both CD and CL: This is not surprising because, at thishigher speed, the fluff on the new balls will be forced to lay down by theair flow. Therefore the surfaces of the new and worn balls will be similar and thedifferences between the balls will be minimal. Furthermore, comparing Figs. 9a andb, it can be seen that a worn ball tested at S ¼ 0:1 and U ¼ 25ms�1, acts verysimilarly to a new ball tested at S ¼ 0:1 and U ¼ 50ms�1. This implies that thestructure of the surface will be similar for the two balls, i.e. a new ball tested at a highwind speed, has surface characteristics which are similar to a worn ball tested at lowspeed.
ARTICLE IN PRESSS.R. Goodwill et al. / J. Wind Eng. Ind. Aerodyn. 92 (2004) 935–958952

ARTICLE IN PRESS
Fig. 8. Lift coefficient for the eight different new tennis balls. The data was obtained at (a) U ¼ 25ms�1
(Re ¼ 105� 103) and (b) U ¼ 50ms�1 (Re ¼ 210� 103).
S.R. Goodwill et al. / J. Wind Eng. Ind. Aerodyn. 92 (2004) 935–958 953

It has been found that CD and CL are dependent on Re; as well as the spincoefficient. This would be expected because surface condition will change with windspeed (Re). This finding appears to contradict the conclusions of Stepanek [4] andChadwick [15] who used different apparatus to that used in this study. Theconclusions in [4,5] would have been useful as it meant a considerable reduction in
ARTICLE IN PRESS
Fig. 9. Lift coefficient for five worn tennis balls. The data was obtained at (a) U ¼ 25ms�1
(Re ¼ 105� 103) and (b) U ¼ 50ms�1 (Re ¼ 210� 103).
S.R. Goodwill et al. / J. Wind Eng. Ind. Aerodyn. 92 (2004) 935–958954

experimentation required to quantify CD and CL: Furthermore, it can be concludedthat the testing needs to be conducted over a wide range of Re; to be able tocategorise the aerodynamic properties of a spinning tennis ball.
4.3. Implication to the game of tennis
It has been shown that all new tennis balls exhibit similar values of CD and CL;when spun in a wind tunnel, and that they are different for new (0 impacts) andheavily worn (1500 impacts). To illustrate the effects of the differences in CD and CL
for a new and heavily worn tennis ball, trajectories of the two balls have beencalculated for a typical first serve, hit with top spin. It was assumed that the ball leftthe racket at a speed of 113mph (50.0m/s), 4.25� below the horizontal and 2.7mabove the ground. The initial spin on the ball was 2000 rpm which gives a spincoefficient of 0.11. The values of CD and CL; for these initial conditions, can easily bedetermined from Figs. 7b and 9b. This shot is similar to the flat serve that wassimulated in the previous section. Using that trajectory model it can be shown thatthe ball has slowed down to 21ms�1 when it arrives at the baseline. This illustratesthat the ball speed (Re) varies widely during the trajectory, and it has been shownthat the values of CD and CL vary with Re: Clearly the variation in the ball speedduring the trajectory makes it invalid to use the data collected at 50m/s, for the fulltrajectory. In order for the trajectory of the serve to be calculated in this study, alinear interpolation between the results for a wind speed of 25 and 50ms�1 wasassumed, for So0:2: For S > 0:2; the data collected for a wind speed of 25ms�1 wasused. It was assumed that the spin rate remained constant throughout the trajectory.Fig. 10a plots the trajectories of the two balls for the typical first serve which is
being simulated. These trajectory plots illustrate that the worn ball lands a further0.5m towards the baseline, compared with that for the new ball. This is partly due tothe lower drag coefficient of this ball, but is predominantly due to the ball having alower lift coefficient. Therefore, the worn ball does not ‘dip’ as much during flight.This would be unlikely to deceive the receiver but if both new and heavily worn ballswere used in the same game, the server would find it more difficult to place the ballaccurately in the desired location on the court, due to the variation between balls.In Fig. 10b, the angle of the shot for the worn ball has been adjusted to 4.65�
which ensures that both balls land at the same point on the court surface. This is amore realistic simulation of how a player would adapt his stroke to compensate forthe change in trajectory caused by the lower values of CD and CL of the worn ball.The worn ball passes over the net with a height that is 35mm lower than the heightof the new ball. The trajectories in Figs. 10a and b illustrate how a player uses topspin to control the trajectory of the ball, as commented on by Brody [21]. The topspin helps the player to ensure that the ball clears the net with sufficient height toallow for a finite margin of error, but also causes the ball to dip and land before theservice line. This is particularly important for high-speed serves when the player hasa very small ‘window of opportunity’. This term is used to define the range of anglesthat the ball may rebound from the racket, and land within the boundaries of the
ARTICLE IN PRESSS.R. Goodwill et al. / J. Wind Eng. Ind. Aerodyn. 92 (2004) 935–958 955

tennis court. The lower lift coefficient of the worn balls reduces the player’s ability toutilise top spin to make the ball land in the desired location.
5. Conclusions
In this study, the aerodynamic properties of a range of new and used tennis ballshave been measured by supporting the ball in the working section of a wind tunnel.The drag coefficient of eight different brands of tennis ball was obtained, for non-spinning balls. It was found that there was a very high dependency between CD andRe at low values of Re (80� 103oReo130� 103), with CD reducing as Re wasincreased. This was accounted for by the fact that, as Re is increased, the fluff on atennis ball will begin to lay down. For Re > 130� 103; the drag coefficient is
ARTICLE IN PRESS
Fig. 10. Predicted trajectory for the new and heavily worn balls which have different values for CD=CL: (a)Both balls projected with same velocity and angle and (b) both balls propelled with same velocity, and
impact at same location on court. The inset shows a close-up view of the end of the trajectory (t ¼ 0:68 s).
S.R. Goodwill et al. / J. Wind Eng. Ind. Aerodyn. 92 (2004) 935–958956

approximately independent of Re: Furthermore, the CD values for all the new ballsfall within a range of approximately 5%. This is approximately the range of therepeatability of the experiment, and therefore it can not be concluded whether thereis any real difference between each ball brand.The same testing was conducted for a range of used tennis balls. It was found that
the CD of the heavily worn ball which was subjected to 1500 impacts was 0.04 lowerthan the new ball. Clearly, the worn ball will travel through the air faster than thenew ball and will give the receiver fractionally less time to react to return the ball.In the second section of this testing, the spinner unit was used to spin the ball at
speeds of up to 3000 rpm. It was found that CD increased with the spin coefficient(normalised spin rate), for all balls. This was assigned to the induced drag which isgenerated when a lift force is obtained. Furthermore, the increase in CD can beaccounted for by the associated increase in the fuzz drag which is experienced by theball, when it spins, due to the fluff ‘standing up’. It was also shown that CD (and CL)were not solely functions of the spin coefficient S; but were also dependent on Re:This appears to contradict the conclusions of previous studies on spinning tennisballs.It was concluded that there is no significant difference in the drag and lift
coefficients of all the new ball brands. However, it was found that the drag and liftcoefficients of the spinning worn balls were dependent on the number of impacts thatthe ball was subjected to. It was found that the ball subjected to 1500 impacts had aCD value that was between 0.03 and 0.06 lower than that of the new ball. Of the CL
values collected for the worn balls at a wind speed of 25ms�1, and a spin coefficientof 0.1, those of a heavily worn tennis ball (1500 impacts) are considerably lower thanthose of a new ball. However, at higher spin rates, the CL values of both the new andworn tennis balls were approximately equal. At the higher wind speed of 50ms�1, thedifference between the new and worn balls is much smaller. A trajectory plot wasconducted to illustrate that the difference in CL values of the new and used tennisballs would change the impact location of the tennis ball by approximately 400mm,for an identical serve. A trajectory analysis showed that changes in CL had anegligible effect on the reaction time for the players. Players use the effect of spin onthe trajectory of the ball for control, and therefore they are unlikely to want to playwith a ball which has lower CL values. This would discourage manufacturers fromproducing new tennis balls, which had a surface similar to a worn ball and thereforetravelled faster through the air, because it has been shown that these balls generallyhave lower CL values.This study has illustrated the use of a wind tunnel to obtain the aerodynamic
properties of non-spinning and spinning tennis balls. It has been shown that all newtennis balls exhibit similar values of CD and CL for the range of wind speeds and spinrates tested in this study. The study has highlighted that worn tennis balls can exhibitvery different aerodynamic properties to those of new balls. Although it is acceptedthat manufacturers will not sell worn balls, even the most heavily worn ball in thisstudy (1500 impacts) still ‘looks and feels’ like a tennis ball. Therefore, it may bepossible for the manufacturers to produce a cloth which has the same texture as aworn ball. This would in effect change the nature of the game.
ARTICLE IN PRESSS.R. Goodwill et al. / J. Wind Eng. Ind. Aerodyn. 92 (2004) 935–958 957

Acknowledgements
Grateful thanks go to the International Tennis Federation for the financial andpractical support given to this project. The affiliation of Dr. S.J. Haake as TechnicalConsultant to the ITF is acknowledged.
References
[1] I. Newton, New theory of light and colours, Philos. Trans. Roy. Soc. London 1 (1672) 678–688.
[2] Lord Rayleigh, On the irregular flight of a tennis ball, Messenger Math. 7 (1877) 14–16.
[3] R.D. Mehta, Aerodynamics of sports balls, Ann. Rev. Fluid Mech. 17 (1985) 151–189.
[4] A. Stepanek, The aerodynamics of tennis balls—the top spin lob, Am. J. Phys. 56 (1988) 138–142.
[5] S.G. Chadwick, S.J. Haake, The drag coefficient of tennis balls, in: A. Subic, S.J. Haake (Eds.), The
Engineering of Sport, Sydney, Blackwell Science Ltd, Oxford, 2000, pp. 169–176.
[6] R. Mehta, J. Pallis, The aerodynamics of a tennis ball, Sports Eng. 4 (2001) 1–13.
[7] M.J. Carr!e, et al., The curve kick of a football, in: S. Ujihashi, S.J. Haake (Eds.), The Engineering of
Sport 4, Kyoto, Blackwell Science Ltd, Oxford, 2002, pp. 315–321.
[8] S.G. Chadwick, S.J. Haake, Methods to determine the aerodynamic forces acting on tennis balls in
flight, in: A. Coe, S.J. Haake (Eds.), 1st International Congress on Tennis Science & Technology,
Roehampton, London, Blackwell Science Ltd, Oxford, 2000.
[9] R.G. Watts, R. Ferrer, The lateral force on a spinning sphere: aerodynamics of a curveball, Am. J.
Phys. 55 (1987) 40–44.
[10] P.W. Bearman, J.K. Harvey, Golf ball aerodynamics, Aeronaut. Quart. 27 (1976) 112–122.
[11] P.M. Waudby-Smith, W.J. Rainbird, Some principles of automotive aerodynamic testing in wind
tunnels with examples from slotted wall test section, 1985, SAE paper No. 850284.
[12] M. Macha, R. Buffington, J. Henfling, Slotted-wall blockage corrections for disks and parachutes,
J. Aircraft 28 (9) (1991) 592–597.
[13] Guinness, Guinness World Records, Millennium Edition, Guinness World Records Ltd, Bantam,
London, UK, 2000.
[14] UC. Davis, http://wings.avkids.com/Tennis/Project/motion-02.html, 2003.
[15] S.G. Chadwick, The aerodynamics of tennis balls, Ph.D. Thesis, University of Sheffield, 2003.
[16] R.C. Haines, P.J. Corish, Rubber sports goods manufacturing technology, In: A.K. Bhowmick,
M.M. Hall, H.A. Benarey (Eds.), Rubber Products Manufacturing Technology, Vol. 27, 1994,
pp. 813–819.
[17] E. Achenbach, Experiments on the flow past spheres at very high Reynolds number, J. Fluid Mech. 54
(1972) 565–575.
[18] E. Achenbach, The effects of surface roughness and tunnel blockage on the flow past spheres, J. Fluid
Mech. 65 (1974) 113–125.
[19] S.J. Haake, S.G. Chadwick, R.J. Dignall, S.R. Goodwill, P. Rose, Engineering tennis—slowing the
game down, Sports Eng. 3 (2) (2000) 131–143.
[20] R. Mehta, J. Pallis, Tennis science collaboration between NASA and Cislunar aerospace, In: A. Coe,
S.J. Haake (Eds.), First International Congress on Tennis Science and Technology, Roehampton,
London, 2000, pp. 135–144.
[21] H. Brody, Tennis Science for Tennis Players, University of Pennsylvania Press, Philadelphia, 1987.
ARTICLE IN PRESSS.R. Goodwill et al. / J. Wind Eng. Ind. Aerodyn. 92 (2004) 935–958958