Embed Size (px)
Citation preview

The Eighth Asia-Pacific Conference on Wind Engineering,December 10–14, 2013, Chennai, India
Copyright © 2013 APCWE-VIII. Published by Research Publishing Services.ISBN: 978-981-07-8012-8 :: doi:10.3850/978-981-07-8012-8_Key-02
K-25
AERODYNAMICS OF ATYPICAL FOOTBRIDGES
Flaga Andrzej1 1Professor of Civil Engineering, Wind Engineering Laboratory, Cracow University of Technology,
[email protected] ABSTRACT
The paper aims at wind tunnel tests and aerodynamic calculations and analyses of three atypical footbridges designed and built recently in Poland. It is divided in two parts: 1. Part one which is devoted to an arch footbridge over a motorway in Katowice. The structure consists of curved in plane, circular reinforced concrete span, suspended to an inclined steel parabolic arch; 2. Part two which concerns two footbridges over Vistula River in Cracow. The first footbridge (“Kazimierz-Ludwinów”) has two arch reinforced concrete decks which are suspended to the complex arch pipe (two concentric steel pipes filled with concrete) in the middle. The other footbridge (“Kazimierz-Podgórze”) consists of three reinforced concrete decks: two of them of arch shape for pedestrians and bicycles and in the middle there is a sinusoidal deck for pedestrians only. Basing upon theoretical and experimental results, conclusions concerning ultimate and serviceability limit states with respect to human comfort criteria for the analysed footbridges have been formulated.
Keywords: Footbridges, wind tunnel tests, aerodynamic calculations Introduction
All wind tunnel tests were performed in a boundary layer wind tunnel of the Wind Engineering Laboratory at the Cracow University of Technology (Figure 1).
A footbridge response to wind action has been calculated on the basis of quasi-steady theory (Flaga (1994), Flaga (2008)) with use of own computer software AeroDynBud developed in the Department of Structural Mechanics of the Lublin University of Technology (Flaga (2008), Flaga (2011)). This computer program is based on commercial FEM system ALGOR.
Three different models of the structure have been used: � FEM model used in ALGOR; � Rough model with so-called superelements connecting in supernodes; � Generalized model based on representative mode shapes. The rough model has been introduced due to wind action definition, which is based on
wind tunnel tests or procedures obtained from standards, where this action is related to the section of structure. The third model enabled the degrees of freedom reduction to the number of representative mode shapes in analysed case.
On the basis of different vibration comfort criteria encountered in several papers and standard documents – authorial proposals of vibration comfort criteria for pedestrians on footbridges in case of wind-induced vibrations have been elaborated and presented in Figure 2 (Flaga (2011), Flaga and Pańtak (2004), Flaga et al. (2007), Flaga et al. (2004)).
Key-02.qxd 11/24/2013 10:20 AM Page K-25

K-26 Flaga Andrzej
Air scoop
Throttle
Stator Adjustable cei ling Return channel ThrottleOpenwork screen
Suspended ceiling
Air launcher
Openwork screen Working sectionConfusor
Beehive frame
Beehive frame
Working section wall
Working sectionInlet Confusor
Flow arranging elementsRotated table with aerodynamical balance
Slotted side wall
Diffuser Fan, engine, outlet
Diffuser Fan, engine, outlet
Fig. 1 View from the side (a) and from the top (b) of the wind tunnel
a) vertical vibrations 1,0 – 25,0 Hz b) horizontal vibrations 1,0 – 25,0 Hz
0,1
1,0
10,0
1,0 1,6 2,5 4,0 6,3 10,0 16,0 25,0
2,1
2,0
1,45
Acce
lerati
on a
rms
[m/s2 ]
Frequency f [Hz]
0,1
1,0
10,0
1,0 1,6 2,5 4,0 6,3 10,0 16,0 25,0 2,0
Acce
lerati
on a
rms
[m/s2 ]
Frequency f [Hz]
3,0
0,25
c) vertical vibrations 0,063 – 1,0 Hz d) horizontal vibrations 0,063 – 1,0 Hz
0,1
1,0
10,0
0,063 0,01 0,16 0,25 0,40 0,63 1,0
1,45
Acce
lerati
on
a rms
[m/s2
]
Frequency f [Hz]
1,2
3,7
0,01
0,10
1,0
0,063 0,01 0,16 0,25 0,40 0,63 1,0
0,25
0,063
0,21
Acce
lerati
on a
rms
[m/s2 ]
Frequency f [Hz] Fig. 2 Authorial vibration comfort criteria for pedestrians on footbridges in case of seldom
occurring vibrations induced by wind (i.e. vibrations of stochastic character)
Key-02.qxd 11/24/2013 10:20 AM Page K-26
Aerodynamics of Atypical Footbridges K-27
Proposed criteria take into account the courses of comfort criteria curves occurring in international standards ISO 2631 Part 2 and 3 (1985, 1989) and ISO 6897 (1984) and have been formulated in terms of the effective acceleration (i.e. root-mean-square (rms) value of acceleration). In the frequency range 0,63 – 1,0 Hz, where diagram discontinuity occurs, due to lack of adequate investigation results, the propositions have been marked with a dashed line joining the border points of both ranges (below and above 1,0 Hz).
PART I – FOOTBRIDGE IN KATOWICE Short description of geometrical and structural features of the footbridge
An inclined arch footbridge on Drogowa Trasa Średnicowa in Katowice is of a shape similar to the Gateshead footbridge in Great Britain. A computer visualization of the shape of the footbridge in Katowice is presented in Figure 3.
Fig. 3 General view of the footbridge in Katowice (Flaga et al. (2003)).
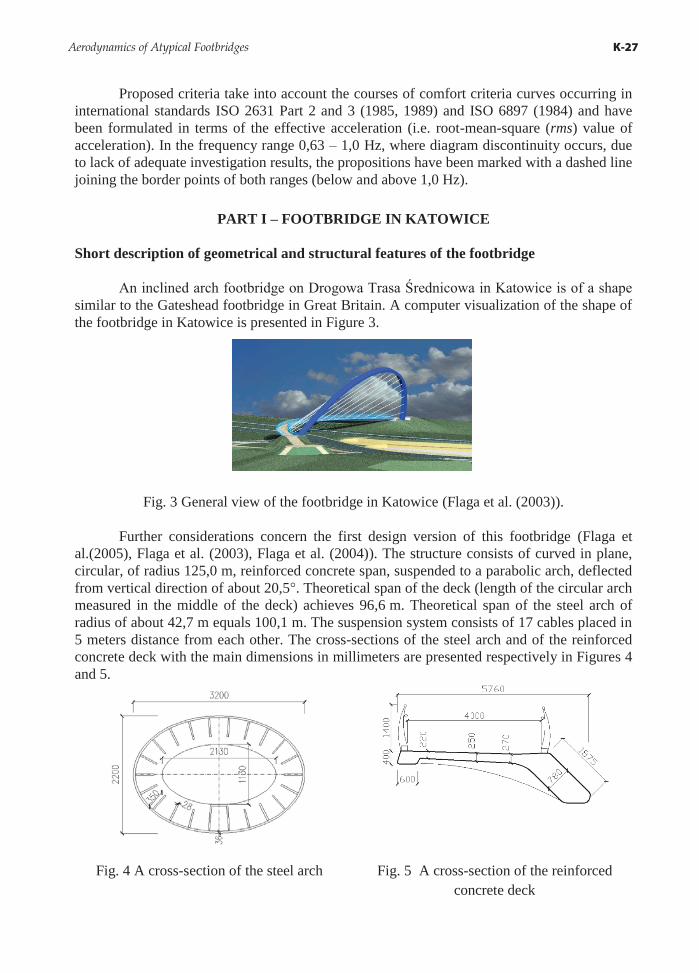
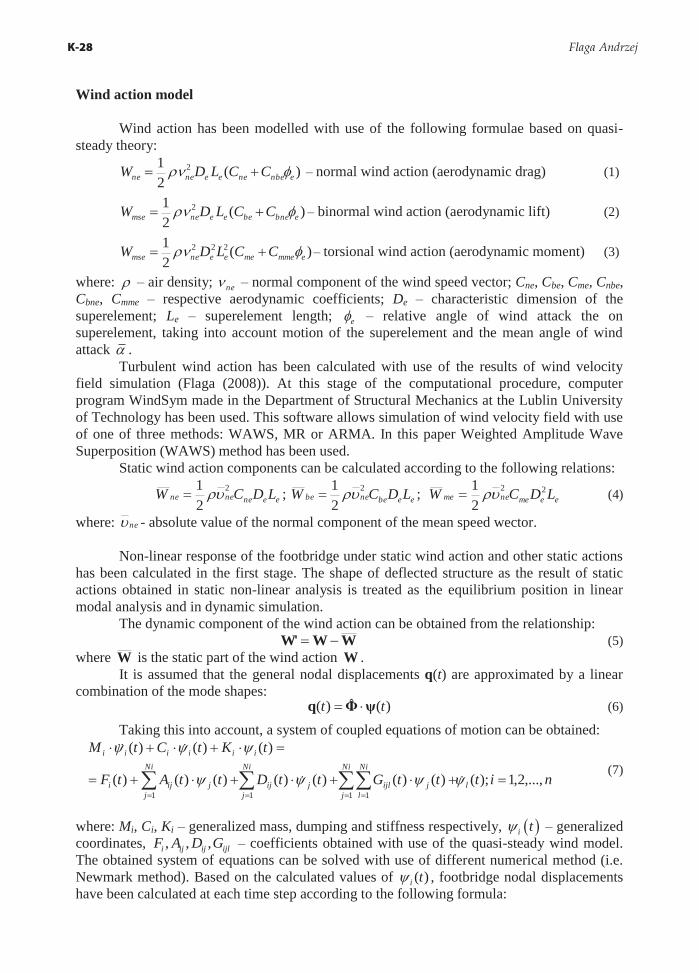
Further considerations concern the first design version of this footbridge (Flaga et al.(2005), Flaga et al. (2003), Flaga et al. (2004)). The structure consists of curved in plane, circular, of radius 125,0 m, reinforced concrete span, suspended to a parabolic arch, deflected from vertical direction of about 20,5�. Theoretical span of the deck (length of the circular arch measured in the middle of the deck) achieves 96,6 m. Theoretical span of the steel arch of radius of about 42,7 m equals 100,1 m. The suspension system consists of 17 cables placed in 5 meters distance from each other. The cross-sections of the steel arch and of the reinforced concrete deck with the main dimensions in millimeters are presented respectively in Figures 4 and 5.
Fig. 4 A cross-section of the steel arch Fig. 5 A cross-section of the reinforced concrete deck
Key-02.qxd 11/24/2013 10:20 AM Page K-27
K-28 Flaga Andrzej
Wind action model Wind action has been modelled with use of the following formulae based on quasi-
steady theory:
)(21 2
enbeneeenene CCLDW ��� �� – normal wind action (aerodynamic drag) (1)
)(21 2
ebnebeeenemse CCLDW ��� �� – binormal wind action (aerodynamic lift) (2)
)(21 222
emmemeeenemse CCLDW ��� �� – torsional wind action (aerodynamic moment) (3)
where: � – air density; ne� – normal component of the wind speed vector; Cne, Cbe, Cme, Cnbe, Cbne, Cmme – respective aerodynamic coefficients; De – characteristic dimension of the superelement; Le – superelement length; e� – relative angle of wind attack the on superelement, taking into account motion of the superelement and the mean angle of wind attack .
Turbulent wind action has been calculated with use of the results of wind velocity field simulation (Flaga (2008)). At this stage of the computational procedure, computer program WindSym made in the Department of Structural Mechanics at the Lublin University of Technology has been used. This software allows simulation of wind velocity field with use of one of three methods: WAWS, MR or ARMA. In this paper Weighted Amplitude Wave Superposition (WAWS) method has been used.
Static wind action components can be calculated according to the following relations:
eenenene LDCW 2
21 �� ; eebenebe LDCW 2
21 �� ; eemeneme LDCW 22
21 �� (4)
where: ne - absolute value of the normal component of the mean speed wector.
Non-linear response of the footbridge under static wind action and other static actions has been calculated in the first stage. The shape of deflected structure as the result of static actions obtained in static non-linear analysis is treated as the equilibrium position in linear modal analysis and in dynamic simulation.
The dynamic component of the wind action can be obtained from the relationship: WWW' �� (5)
where W is the static part of the wind action W . It is assumed that the general nodal displacements q(t) are approximated by a linear
combination of the mode shapes: )(ˆ)( tt ψΦq �� (6)
Taking this into account, a system of coupled equations of motion can be obtained:
nitttGttDttAtF
tKtCtM
l
Ni
j
Ni
ljijl
Ni
jjij
Ni
jjiji
iiiiii
,...,2,1);()()()()()()()(
)()()(
1 111���������
������
� ���
����
���
��
���
(7)
where: Mi, Ci, Ki – generalized mass, dumping and stiffness respectively, � �i t� – generalized coordinates, , , ,i ij ij ijlF A D G – coefficients obtained with use of the quasi-steady wind model. The obtained system of equations can be solved with use of different numerical method (i.e. Newmark method). Based on the calculated values of )(ti� , footbridge nodal displacements have been calculated at each time step according to the following formula:
Key-02.qxd 11/24/2013 10:20 AM Page K-28
Aerodynamics of Atypical Footbridges K-29
� �
�����Ni
i
ni
iiii ttt
1 1)()()( qqΦqq � (8)
where iΦ are the displacements in the i-th representative mode shape and q are the displacements obtained with static non-linear analysis considering mean wind action.
Similar procedure has been used to obtain internal forces in the m-th structure member:
�
���Ni
iimimm tQQtQ
1)()( � (9)
where miQ is the internal force coming from generalized inertial forces associated with the i-th mode shape which act statically and mQ is the internal force from static non-linear analysis.
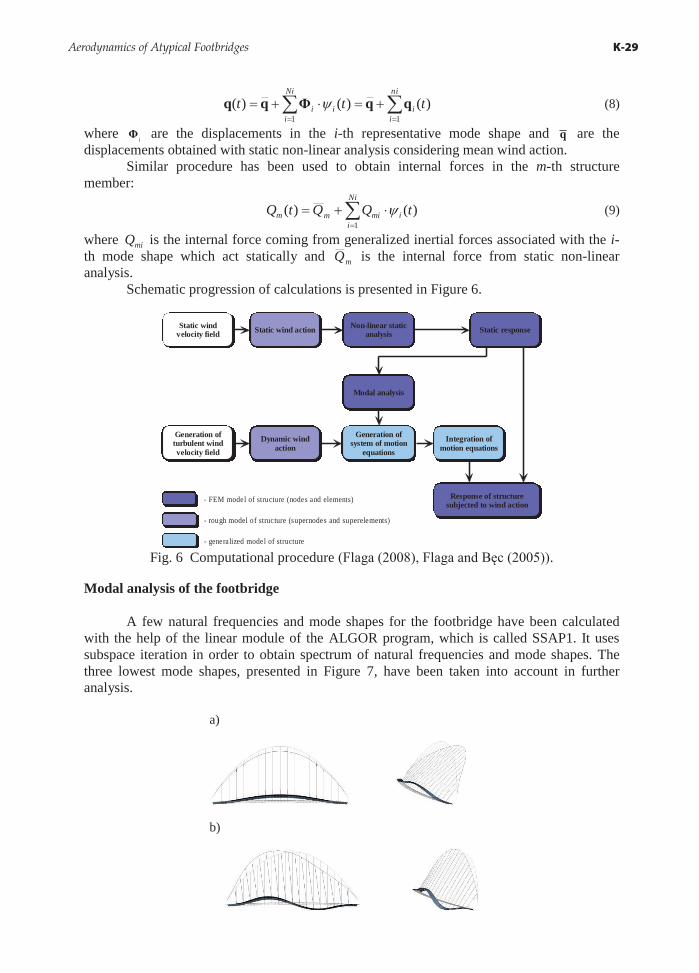
Schematic progression of calculations is presented in Figure 6.
Static windvelocity field Static wind action Non-linear static
analysis Static response
Modal analysis
Generation ofturbulent windvelocity field
Dynamic windaction
Generation ofsystem of motion
equations
Integration ofmotion equations
Response of structuresubjected to wind action
- FEM model of structure (nodes and elements)
- rough model of structure (supernodes and superelements)
- generalized model of structure Fig. 6 Computational procedure (Flaga (2008), Flaga and Bęc (2005)).
Modal analysis of the footbridge
A few natural frequencies and mode shapes for the footbridge have been calculated
with the help of the linear module of the ALGOR program, which is called SSAP1. It uses subspace iteration in order to obtain spectrum of natural frequencies and mode shapes. The three lowest mode shapes, presented in Figure 7, have been taken into account in further analysis.
a)
b)
Key-02.qxd 11/24/2013 10:20 AM Page K-29
K-30 Flaga Andrzej
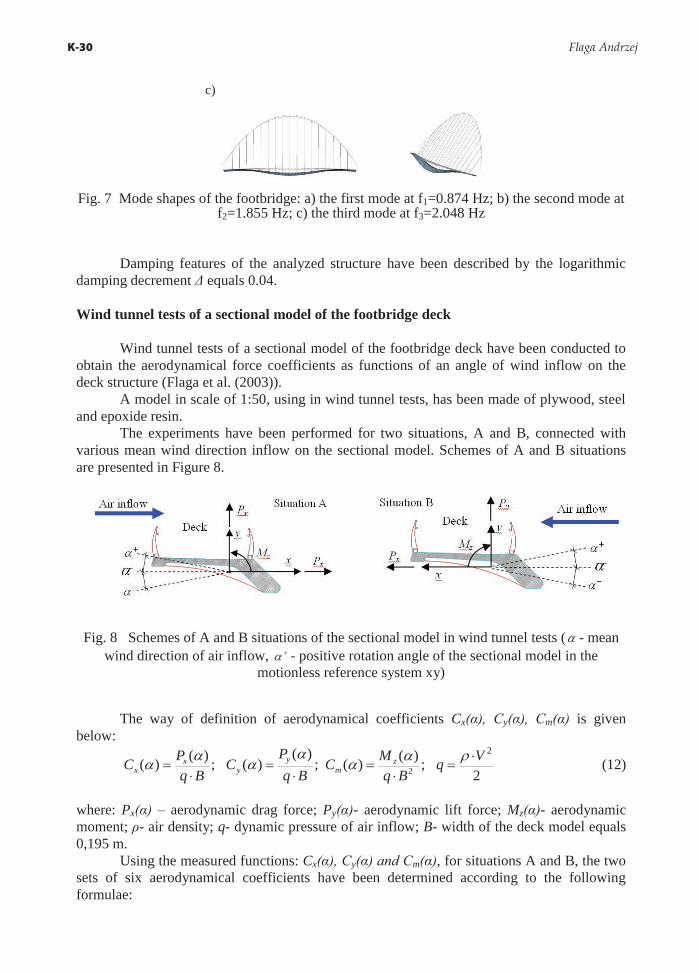
c)
Fig. 7 Mode shapes of the footbridge: a) the first mode at f1=0.874 Hz; b) the second mode at f2=1.855 Hz; c) the third mode at f3=2.048 Hz
Damping features of the analyzed structure have been described by the logarithmic damping decrement Δ equals 0.04. Wind tunnel tests of a sectional model of the footbridge deck
Wind tunnel tests of a sectional model of the footbridge deck have been conducted to obtain the aerodynamical force coefficients as functions of an angle of wind inflow on the deck structure (Flaga et al. (2003)).
A model in scale of 1:50, using in wind tunnel tests, has been made of plywood, steel and epoxide resin.
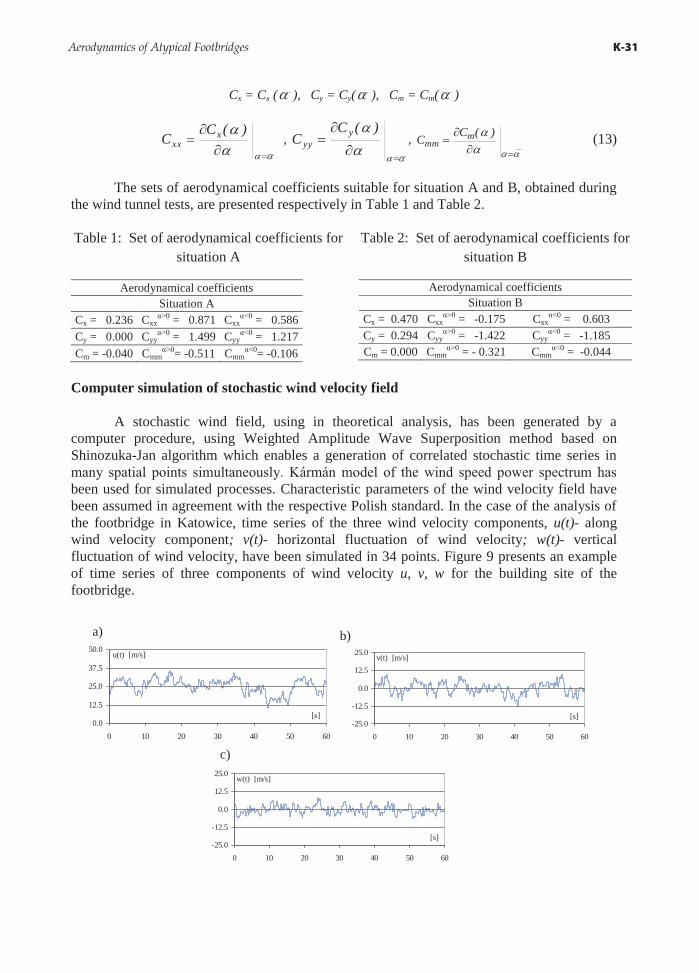
The experiments have been performed for two situations, A and B, connected with various mean wind direction inflow on the sectional model. Schemes of A and B situations are presented in Figure 8.
Fig. 8 Schemes of A and B situations of the sectional model in wind tunnel tests ( - mean wind direction of air inflow, � - positive rotation angle of the sectional model in the
motionless reference system xy)
The way of definition of aerodynamical coefficients Cx(α), Cy(α), Cm(α) is given below:
2;)()(;
)()(;)()(
2
2Vq
BqMC
BqP
CBq
PC zm
yy
xx
���
��
��
� �
(12)
where: Px(α) – aerodynamic drag force; Py(α)- aerodynamic lift force; Mz(α)- aerodynamic moment; ρ- air density; q- dynamic pressure of air inflow; B- width of the deck model equals 0,195 m.
Using the measured functions: Cx(α), Cy(α) and Cm(α), for situations A and B, the two sets of six aerodynamical coefficients have been determined according to the following formulae:
Key-02.qxd 11/24/2013 10:20 AM Page K-30
Aerodynamics of Atypical Footbridges K-31
Cx = Cx ( ), Cy = Cy( ), Cm = Cm( )
���
�)(C
C xxx ,
��
��
)(CC y
yy ,
���� )(CC m
mm (13)
The sets of aerodynamical coefficients suitable for situation A and B, obtained during the wind tunnel tests, are presented respectively in Table 1 and Table 2.
Table 1: Set of aerodynamical coefficients for
situation A Table 2: Set of aerodynamical coefficients for
situation B
Aerodynamical coefficients Situation A
Cx = 0.236 Cxxα>0 = 0.871 Cxx
α<0 = 0.586 Cy = 0.000 Cyy
α>0 = 1.499 Cyyα<0 = 1.217
Cm = -0.040 Cmmα>0= -0.511 Cmm
α<0= -0.106
Aerodynamical coefficients Situation B
Cx = 0.470 Cxxα>0 = -0.175 Cxx
α<0 = 0.603 Cy = 0.294 Cyy
α>0 = -1.422 Cyyα<0 = -1.185
Cm = 0.000 Cmmα>0 = - 0.321 Cmm
α<0 = -0.044
Computer simulation of stochastic wind velocity field
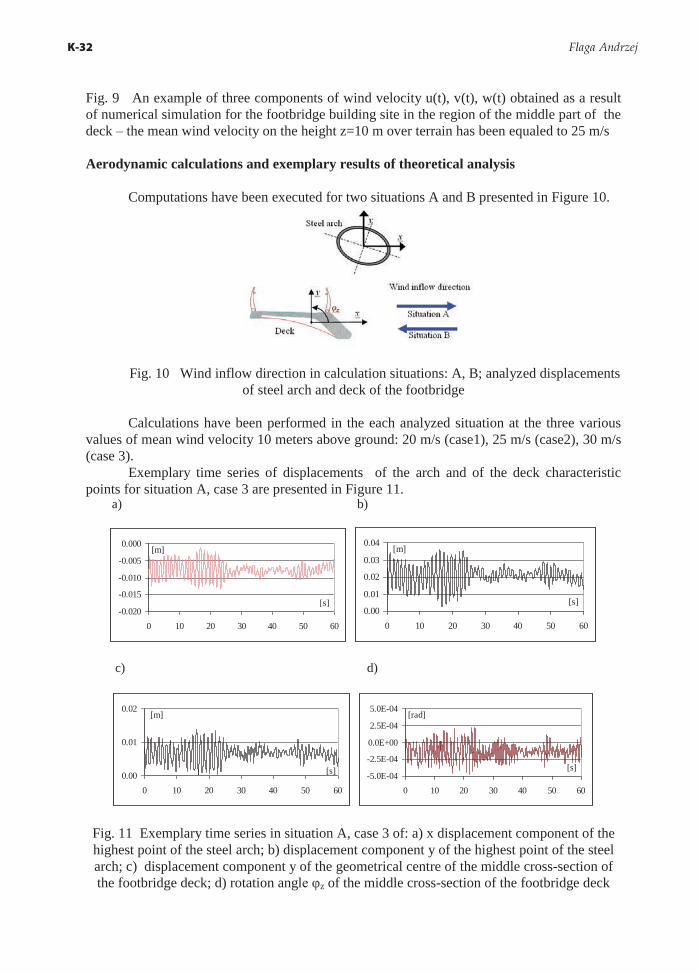
A stochastic wind field, using in theoretical analysis, has been generated by a computer procedure, using Weighted Amplitude Wave Superposition method based on Shinozuka-Jan algorithm which enables a generation of correlated stochastic time series in many spatial points simultaneously. Kármán model of the wind speed power spectrum has been used for simulated processes. Characteristic parameters of the wind velocity field have been assumed in agreement with the respective Polish standard. In the case of the analysis of the footbridge in Katowice, time series of the three wind velocity components, u(t)- along wind velocity component; v(t)- horizontal fluctuation of wind velocity; w(t)- vertical fluctuation of wind velocity, have been simulated in 34 points. Figure 9 presents an example of time series of three components of wind velocity u, v, w for the building site of the footbridge.
0.0
12.5
25.0
37.5
50.0
0 10 20 30 40 50 60
u(t)
[s]
[m/s]
-25.0
-12.5
0.0
12.5
25.0
0 10 20 30 40 50 60
v(t)
[s]
[m/s]
-25.0
-12.5
0.0
12.5
25.0
0 10 20 30 40 50 60
w(t)
[s]
[m/s]
a) b)
c)
Key-02.qxd 11/24/2013 10:20 AM Page K-31
K-32 Flaga Andrzej
Fig. 9 An example of three components of wind velocity u(t), v(t), w(t) obtained as a result of numerical simulation for the footbridge building site in the region of the middle part of the deck – the mean wind velocity on the height z=10 m over terrain has been equaled to 25 m/s Aerodynamic calculations and exemplary results of theoretical analysis
Computations have been executed for two situations A and B presented in Figure 10.
Fig. 10 Wind inflow direction in calculation situations: A, B; analyzed displacements of steel arch and deck of the footbridge
Calculations have been performed in the each analyzed situation at the three various
values of mean wind velocity 10 meters above ground: 20 m/s (case1), 25 m/s (case2), 30 m/s (case 3).
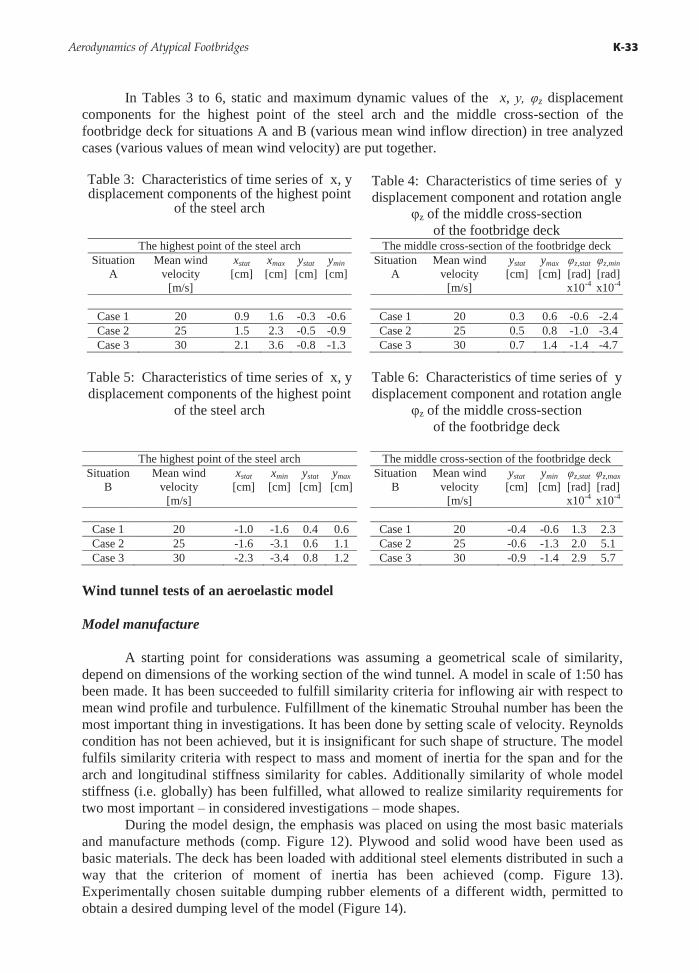
Exemplary time series of displacements of the arch and of the deck characteristic points for situation A, case 3 are presented in Figure 11. a) b)
-0.020
-0.015
-0.010
-0.005
0.000
0 10 20 30 40 50 60
[s]
[m]
0.00
0.01
0.02
0.03
0.04
0 10 20 30 40 50 60
[s]
[m]
c) d)
0.00
0.01
0.02
0 10 20 30 40 50 60
[s]
[m]
-5.0E-04
-2.5E-04
0.0E+00
2.5E-04
5.0E-04
0 10 20 30 40 50 60
[s]
[rad]
Fig. 11 Exemplary time series in situation A, case 3 of: a) x displacement component of the highest point of the steel arch; b) displacement component y of the highest point of the steel arch; c) displacement component y of the geometrical centre of the middle cross-section of the footbridge deck; d) rotation angle φz of the middle cross-section of the footbridge deck
Key-02.qxd 11/24/2013 10:20 AM Page K-32
Aerodynamics of Atypical Footbridges K-33
In Tables 3 to 6, static and maximum dynamic values of the x, y, φz displacement components for the highest point of the steel arch and the middle cross-section of the footbridge deck for situations A and B (various mean wind inflow direction) in tree analyzed cases (various values of mean wind velocity) are put together.
Table 3: Characteristics of time series of x, y displacement components of the highest point
of the steel arch
Table 4: Characteristics of time series of y displacement component and rotation angle
φz of the middle cross-section of the footbridge deck
The highest point of the steel arch Situation
A Mean wind
velocity [m/s]
xstat [cm]
xmax [cm]
ystat [cm]
ymin [cm]
Case 1 20 0.9 1.6 -0.3 -0.6 Case 2 25 1.5 2.3 -0.5 -0.9 Case 3 30 2.1 3.6 -0.8 -1.3
The middle cross-section of the footbridge deck Situation
A Mean wind
velocity [m/s]
ystat [cm]
ymax [cm]
φz,stat [rad] x10-4
φz,min [rad] x10-4
Case 1 20 0.3 0.6 -0.6 -2.4 Case 2 25 0.5 0.8 -1.0 -3.4 Case 3 30 0.7 1.4 -1.4 -4.7
Table 5: Characteristics of time series of x, y displacement components of the highest point
of the steel arch
Table 6: Characteristics of time series of y displacement component and rotation angle
φz of the middle cross-section of the footbridge deck
The highest point of the steel arch
Situation B
Mean wind velocity
[m/s]
xstat [cm]
xmin [cm]
ystat [cm]
ymax [cm]
Case 1 20 -1.0 -1.6 0.4 0.6 Case 2 25 -1.6 -3.1 0.6 1.1 Case 3 30 -2.3 -3.4 0.8 1.2
The middle cross-section of the footbridge deck Situation
B Mean wind
velocity [m/s]
ystat [cm]
ymin [cm]
φz,stat [rad] x10-4
φz,max [rad] x10-4
Case 1 20 -0.4 -0.6 1.3 2.3 Case 2 25 -0.6 -1.3 2.0 5.1 Case 3 30 -0.9 -1.4 2.9 5.7
Wind tunnel tests of an aeroelastic model Model manufacture
A starting point for considerations was assuming a geometrical scale of similarity, depend on dimensions of the working section of the wind tunnel. A model in scale of 1:50 has been made. It has been succeeded to fulfill similarity criteria for inflowing air with respect to mean wind profile and turbulence. Fulfillment of the kinematic Strouhal number has been the most important thing in investigations. It has been done by setting scale of velocity. Reynolds condition has not been achieved, but it is insignificant for such shape of structure. The model fulfils similarity criteria with respect to mass and moment of inertia for the span and for the arch and longitudinal stiffness similarity for cables. Additionally similarity of whole model stiffness (i.e. globally) has been fulfilled, what allowed to realize similarity requirements for two most important – in considered investigations – mode shapes.
During the model design, the emphasis was placed on using the most basic materials and manufacture methods (comp. Figure 12). Plywood and solid wood have been used as basic materials. The deck has been loaded with additional steel elements distributed in such a way that the criterion of moment of inertia has been achieved (comp. Figure 13). Experimentally chosen suitable dumping rubber elements of a different width, permitted to obtain a desired dumping level of the model (Figure 14).
Key-02.qxd 11/24/2013 10:20 AM Page K-33
K-34 Flaga Andrzej
a) b)
I II
III
IV
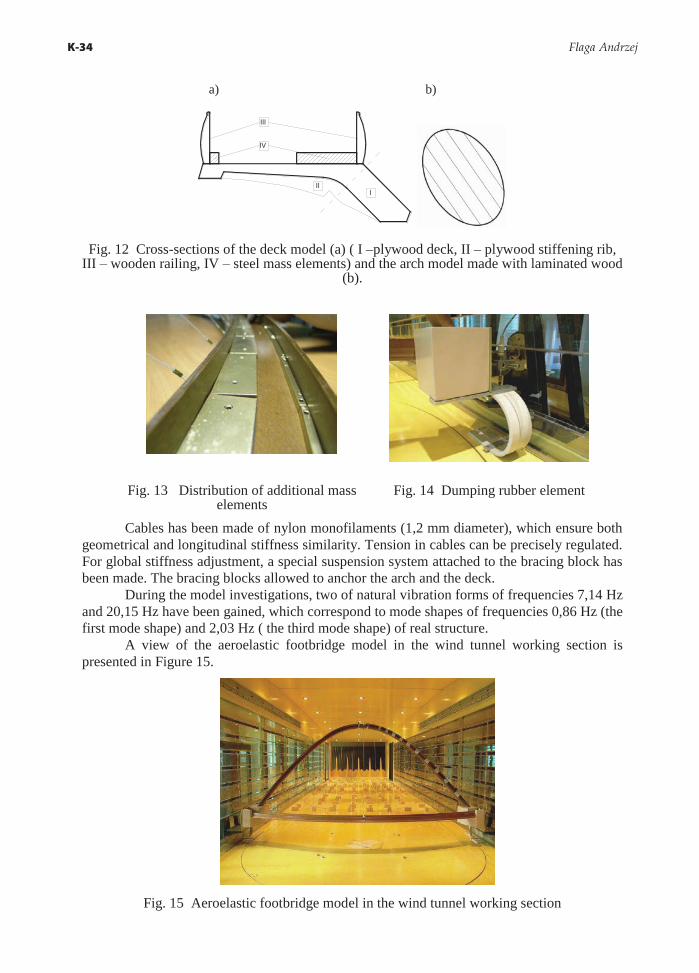
Fig. 12 Cross-sections of the deck model (a) ( I –plywood deck, II – plywood stiffening rib, III – wooden railing, IV – steel mass elements) and the arch model made with laminated wood
(b).
Fig. 13 Distribution of additional mass elements
Fig. 14 Dumping rubber element
Cables has been made of nylon monofilaments (1,2 mm diameter), which ensure both geometrical and longitudinal stiffness similarity. Tension in cables can be precisely regulated. For global stiffness adjustment, a special suspension system attached to the bracing block has been made. The bracing blocks allowed to anchor the arch and the deck.
During the model investigations, two of natural vibration forms of frequencies 7,14 Hz and 20,15 Hz have been gained, which correspond to mode shapes of frequencies 0,86 Hz (the first mode shape) and 2,03 Hz ( the third mode shape) of real structure.
A view of the aeroelastic footbridge model in the wind tunnel working section is presented in Figure 15.
Fig. 15 Aeroelastic footbridge model in the wind tunnel working section
Key-02.qxd 11/24/2013 10:20 AM Page K-34
Aerodynamics of Atypical Footbridges K-35
Description of investigations and examples of test results The model investigations contained: 1) determination of the structure response (i.e.
accelerations and displacements) due to buffeting; 2) determination of the aerodynamical forces and moments transmitted to foundations; 3) analysis of the structure response with respect to undesirable aeroelastical and aerodynamical phenomena occurrence (i.e. flutter, critical vortex shedding or galloping).
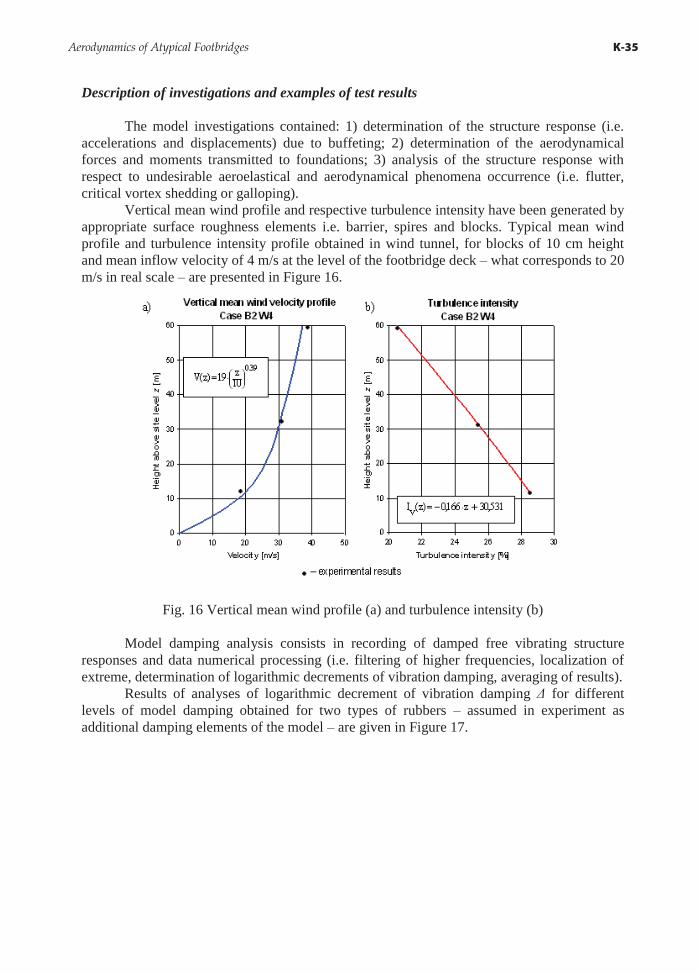
Vertical mean wind profile and respective turbulence intensity have been generated by appropriate surface roughness elements i.e. barrier, spires and blocks. Typical mean wind profile and turbulence intensity profile obtained in wind tunnel, for blocks of 10 cm height and mean inflow velocity of 4 m/s at the level of the footbridge deck – what corresponds to 20 m/s in real scale – are presented in Figure 16.
Fig. 16 Vertical mean wind profile (a) and turbulence intensity (b)
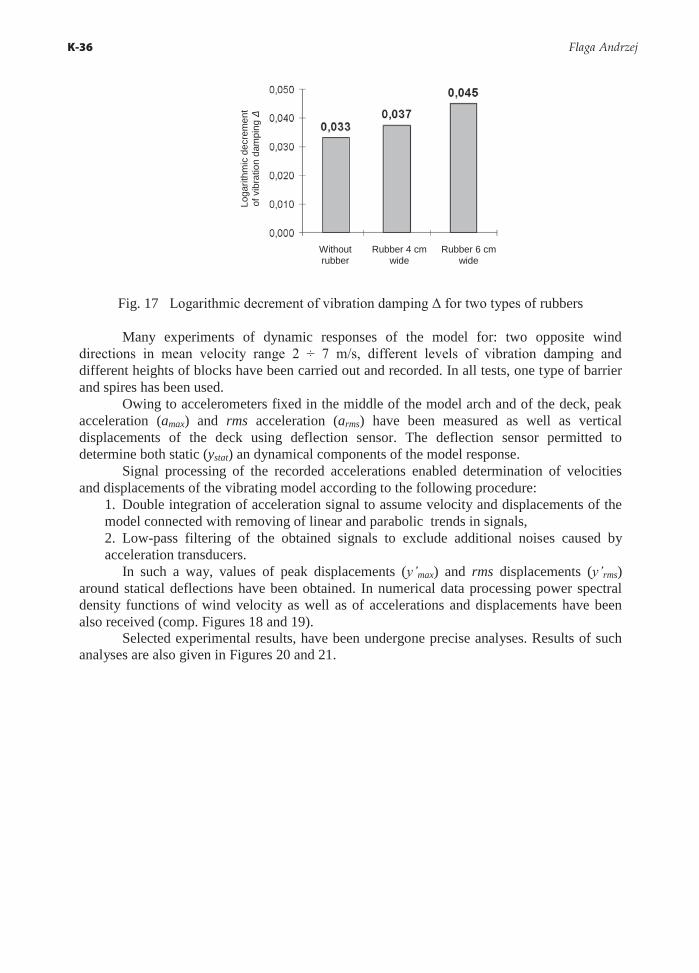
Model damping analysis consists in recording of damped free vibrating structure responses and data numerical processing (i.e. filtering of higher frequencies, localization of extreme, determination of logarithmic decrements of vibration damping, averaging of results).
Results of analyses of logarithmic decrement of vibration damping Δ for different levels of model damping obtained for two types of rubbers – assumed in experiment as additional damping elements of the model – are given in Figure 17.
Key-02.qxd 11/24/2013 10:20 AM Page K-35
K-36 Flaga Andrzej
Fig. 17 Logarithmic decrement of vibration damping Δ for two types of rubbers
Many experiments of dynamic responses of the model for: two opposite wind directions in mean velocity range 2 ÷ 7 m/s, different levels of vibration damping and different heights of blocks have been carried out and recorded. In all tests, one type of barrier and spires has been used.
Owing to accelerometers fixed in the middle of the model arch and of the deck, peak acceleration (amax) and rms acceleration (arms) have been measured as well as vertical displacements of the deck using deflection sensor. The deflection sensor permitted to determine both static (ystat) an dynamical components of the model response.
Signal processing of the recorded accelerations enabled determination of velocities and displacements of the vibrating model according to the following procedure:
1. Double integration of acceleration signal to assume velocity and displacements of the model connected with removing of linear and parabolic trends in signals, 2. Low-pass filtering of the obtained signals to exclude additional noises caused by acceleration transducers.
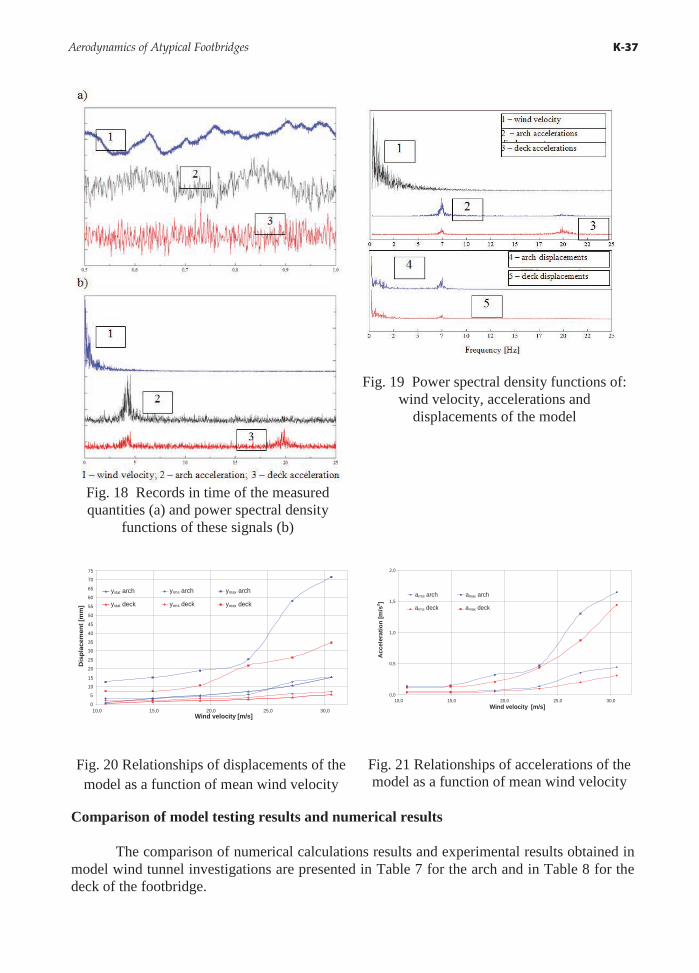
In such a way, values of peak displacements (y’max) and rms displacements (y’rms) around statical deflections have been obtained. In numerical data processing power spectral density functions of wind velocity as well as of accelerations and displacements have been also received (comp. Figures 18 and 19).
Selected experimental results, have been undergone precise analyses. Results of such analyses are also given in Figures 20 and 21.
Without rubber
Rubber 4 cm wide
Rubber 6 cm wide
Loga
rithm
ic d
ecre
men
t of
vib
ratio
n da
mpi
ng Δ
Key-02.qxd 11/24/2013 10:20 AM Page K-36
Aerodynamics of Atypical Footbridges K-37
Fig. 18 Records in time of the measured quantities (a) and power spectral density
functions of these signals (b)
Fig. 19 Power spectral density functions of: wind velocity, accelerations and
displacements of the model
0
5
10
15
20
25
30
35
40
45
50
55
60
65
70
75
10,0 15,0 20,0 25,0 30,0 Wind velocity [m/s]
Dis
plac
emen
t [m
m] ystat deck
ystat arch yrms arch ymax arch
ymax deck yrms deck
0,0
0,5
1,0
1,5
2,0
10,0 15,0 20,0 25,0 30,0 Wind velocity [m/s]
Acc
eler
atio
n [m
/s2 ]
arms arch amax arch
arms deck amax deck
Fig. 20 Relationships of displacements of the model as a function of mean wind velocity
Fig. 21 Relationships of accelerations of the model as a function of mean wind velocity
Comparison of model testing results and numerical results The comparison of numerical calculations results and experimental results obtained in
model wind tunnel investigations are presented in Table 7 for the arch and in Table 8 for the deck of the footbridge.
Key-02.qxd 11/24/2013 10:20 AM Page K-37
K-38 Flaga Andrzej
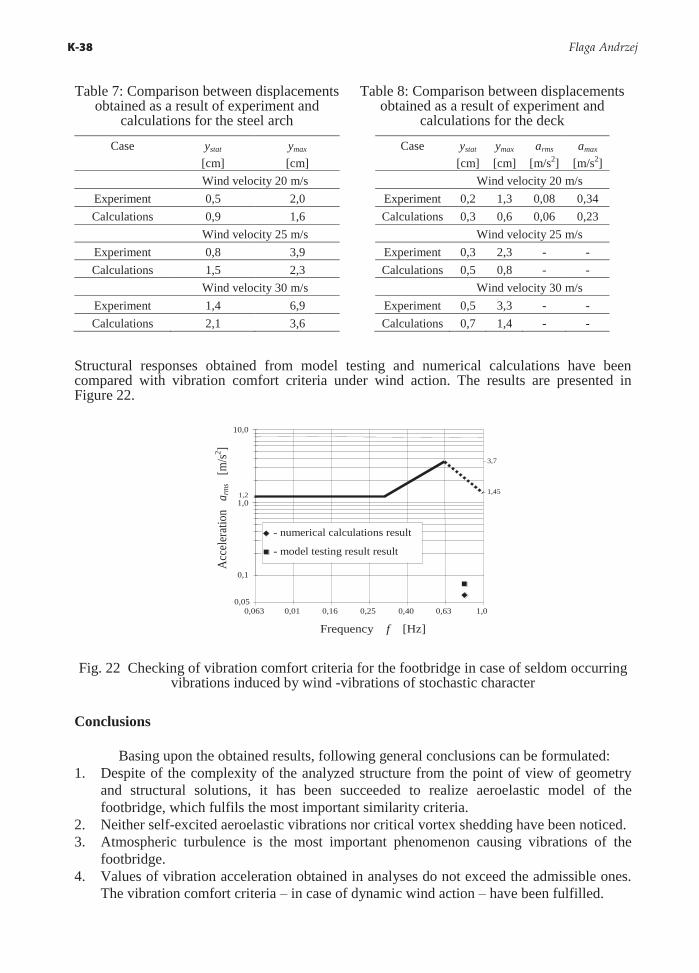
Table 7: Comparison between displacements obtained as a result of experiment and
calculations for the steel arch
Table 8: Comparison between displacements obtained as a result of experiment and
calculations for the deck
Case ystat [cm]
ymax [cm]
Wind velocity 20 m/s Experiment 0,5 2,0 Calculations 0,9 1,6
Wind velocity 25 m/s Experiment 0,8 3,9 Calculations 1,5 2,3
Wind velocity 30 m/s Experiment 1,4 6,9 Calculations 2,1 3,6
Case ystat [cm]
ymax [cm]
arms [m/s2]
amax [m/s2]
Wind velocity 20 m/s Experiment 0,2 1,3 0,08 0,34 Calculations 0,3 0,6 0,06 0,23
Wind velocity 25 m/s Experiment 0,3 2,3 - - Calculations 0,5 0,8 - -
Wind velocity 30 m/s Experiment 0,5 3,3 - - Calculations 0,7 1,4 - -
Structural responses obtained from model testing and numerical calculations have been compared with vibration comfort criteria under wind action. The results are presented in Figure 22.
0,1
1,0
10,0
1,45
Acc
eler
atio
n a
rms
[m/s2 ]
0,063 0,01 0,16 0,25 0,40 0,63 1,0 Frequency f [Hz]
1,2
3,7
- numerical calculations result
- model testing result result
0,05
Fig. 22 Checking of vibration comfort criteria for the footbridge in case of seldom occurring vibrations induced by wind -vibrations of stochastic character
Conclusions
Basing upon the obtained results, following general conclusions can be formulated:
1. Despite of the complexity of the analyzed structure from the point of view of geometry and structural solutions, it has been succeeded to realize aeroelastic model of the footbridge, which fulfils the most important similarity criteria.
2. Neither self-excited aeroelastic vibrations nor critical vortex shedding have been noticed. 3. Atmospheric turbulence is the most important phenomenon causing vibrations of the
footbridge. 4. Values of vibration acceleration obtained in analyses do not exceed the admissible ones.
The vibration comfort criteria – in case of dynamic wind action – have been fulfilled.
Key-02.qxd 11/24/2013 10:20 AM Page K-38
Aerodynamics of Atypical Footbridges K-39
PART II – TWO FOOTBRIDGES IN CRACOW
Short description of geometrical and structural features of the footbridges
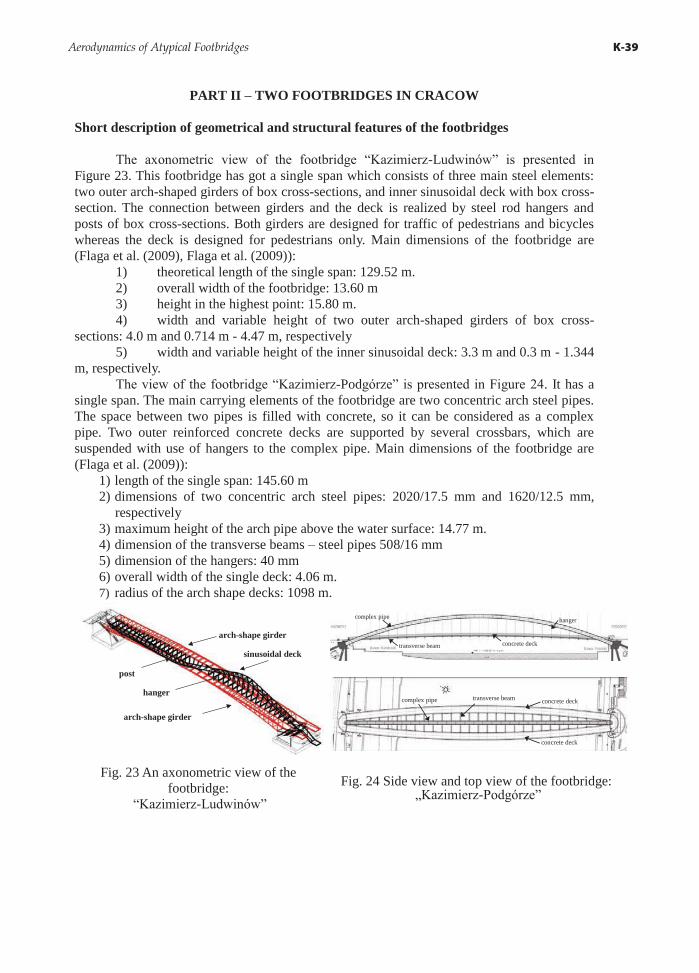
The axonometric view of the footbridge “Kazimierz-Ludwinów” is presented in Figure 23. This footbridge has got a single span which consists of three main steel elements: two outer arch-shaped girders of box cross-sections, and inner sinusoidal deck with box cross-section. The connection between girders and the deck is realized by steel rod hangers and posts of box cross-sections. Both girders are designed for traffic of pedestrians and bicycles whereas the deck is designed for pedestrians only. Main dimensions of the footbridge are (Flaga et al. (2009), Flaga et al. (2009)):
1) theoretical length of the single span: 129.52 m. 2) overall width of the footbridge: 13.60 m 3) height in the highest point: 15.80 m. 4) width and variable height of two outer arch-shaped girders of box cross-
sections: 4.0 m and 0.714 m - 4.47 m, respectively 5) width and variable height of the inner sinusoidal deck: 3.3 m and 0.3 m - 1.344
m, respectively. The view of the footbridge “Kazimierz-Podgórze” is presented in Figure 24. It has a
single span. The main carrying elements of the footbridge are two concentric arch steel pipes. The space between two pipes is filled with concrete, so it can be considered as a complex pipe. Two outer reinforced concrete decks are supported by several crossbars, which are suspended with use of hangers to the complex pipe. Main dimensions of the footbridge are (Flaga et al. (2009)):
1) length of the single span: 145.60 m 2) dimensions of two concentric arch steel pipes: 2020/17.5 mm and 1620/12.5 mm,
respectively 3) maximum height of the arch pipe above the water surface: 14.77 m. 4) dimension of the transverse beams – steel pipes 508/16 mm 5) dimension of the hangers: 40 mm 6) overall width of the single deck: 4.06 m. 7) radius of the arch shape decks: 1098 m.
arch-shape girder
arch-shape girder
sinusoidal deck
post
hanger
transverse beam concrete deck
complex pipe hanger
complex pipe transverse beam
concrete deck
concrete deck
Fig. 23 An axonometric view of the footbridge:
“Kazimierz-Ludwinów”
Fig. 24 Side view and top view of the footbridge: „Kazimierz-Podgórze”
Key-02.qxd 11/24/2013 10:20 AM Page K-39
K-40 Flaga Andrzej
Wind action models General assumptions
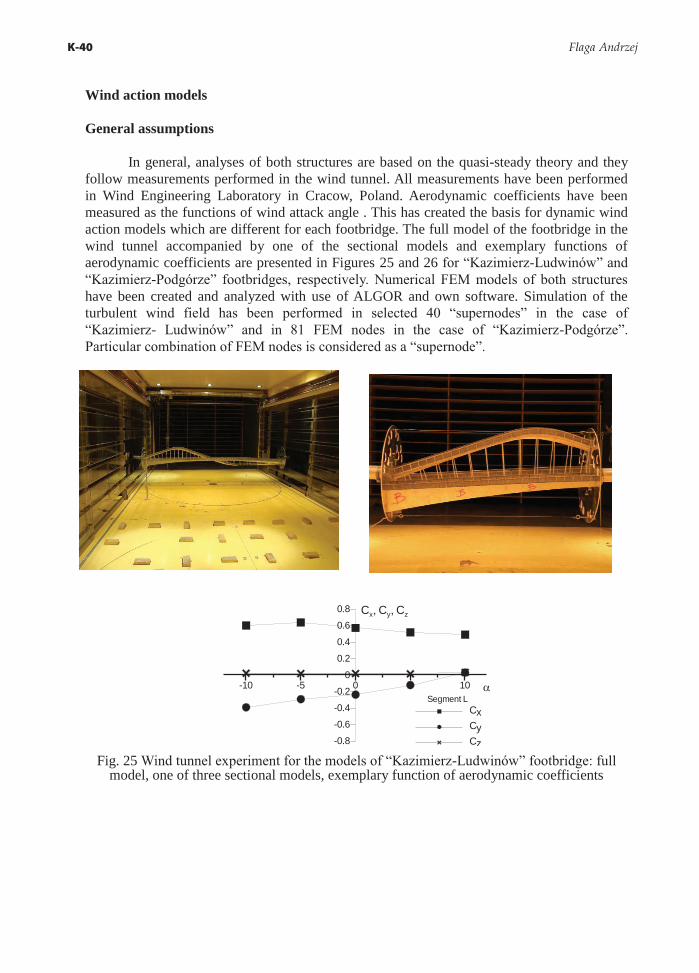
In general, analyses of both structures are based on the quasi-steady theory and they follow measurements performed in the wind tunnel. All measurements have been performed in Wind Engineering Laboratory in Cracow, Poland. Aerodynamic coefficients have been measured as the functions of wind attack angle . This has created the basis for dynamic wind action models which are different for each footbridge. The full model of the footbridge in the wind tunnel accompanied by one of the sectional models and exemplary functions of aerodynamic coefficients are presented in Figures 25 and 26 for “Kazimierz-Ludwinów” and “Kazimierz-Podgórze” footbridges, respectively. Numerical FEM models of both structures have been created and analyzed with use of ALGOR and own software. Simulation of the turbulent wind field has been performed in selected 40 “supernodes” in the case of “Kazimierz- Ludwinów” and in 81 FEM nodes in the case of “Kazimierz-Podgórze”. Particular combination of FEM nodes is considered as a “supernode”.
-10 -5 0 5 10
-0.8
-0.6
-0.4
-0.2
0
0.2
0.4
0.6
0.8 Cx, Cy, Cz
Segment LCxCyCz
Fig. 25 Wind tunnel experiment for the models of “Kazimierz-Ludwinów” footbridge: full model, one of three sectional models, exemplary function of aerodynamic coefficients
Key-02.qxd 11/24/2013 10:20 AM Page K-40
Aerodynamics of Atypical Footbridges K-41
-15 -12 -9 -6 -3 0 3 6 9 12 15 0
0.1
0.2
0.3
0.4
0.5 Cx
Cx
SADADBDCD
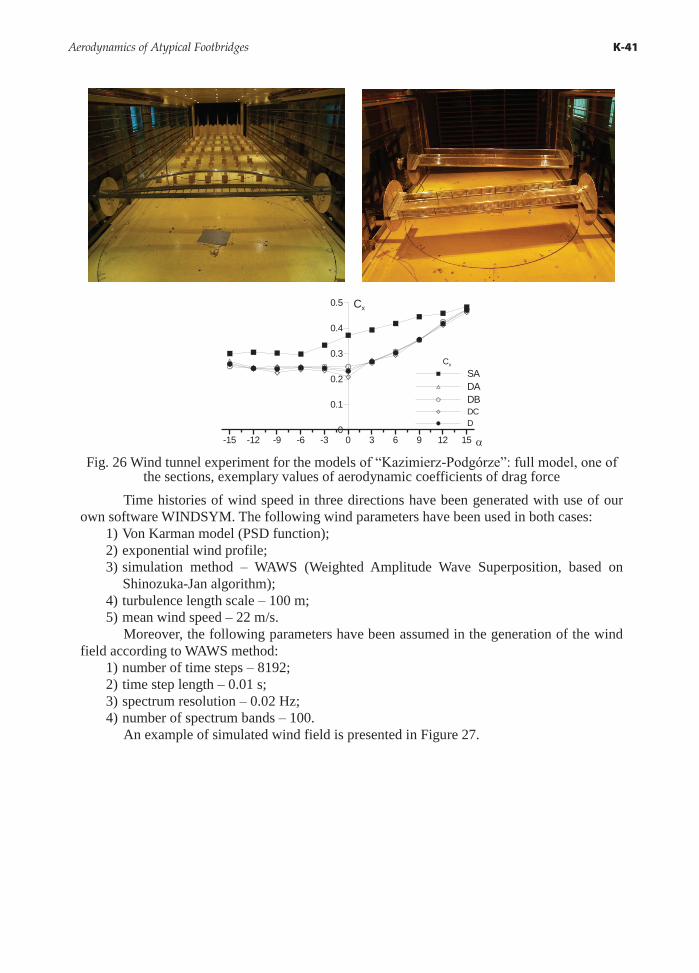
Fig. 26 Wind tunnel experiment for the models of “Kazimierz-Podgórze”: full model, one of
the sections, exemplary values of aerodynamic coefficients of drag force Time histories of wind speed in three directions have been generated with use of our
own software WINDSYM. The following wind parameters have been used in both cases: 1) Von Karman model (PSD function); 2) exponential wind profile; 3) simulation method – WAWS (Weighted Amplitude Wave Superposition, based on
Shinozuka-Jan algorithm); 4) turbulence length scale – 100 m; 5) mean wind speed – 22 m/s.
Moreover, the following parameters have been assumed in the generation of the wind field according to WAWS method:
1) number of time steps – 8192; 2) time step length – 0.01 s; 3) spectrum resolution – 0.02 Hz; 4) number of spectrum bands – 100.
An example of simulated wind field is presented in Figure 27.
Key-02.qxd 11/24/2013 10:20 AM Page K-41

K-42 Flaga Andrzej
0 10 20 30 40 50 60 70 80
Time [s]
8
12
16
20
24
28
32
36
Win
d sp
eed
[m/s
]
along-wind component u
0 10 20 30 40 50 60 70 80
Time [s]
-12
-8
-4
0
4
8
12
Win
d sp
eed
[m/s
]
across-wind component (horizontal) v
0 10 20 30 40 50 60 70 80
Time [s]
-8
-4
0
4
8
12
Win
d sp
eed
[m/s
]
across-wind component (vertical) w
Fig. 27 Three wind speed components simulated in one of “supernodes”
Fluctuating, time varying load acting on “superelement” or element has been determined on the basis of three components of wind speed vector. Three components of wind load: drag Wx(t), lift Wy(t) and moment Wm(t) have been calculated according to the quasi-steady theory (Flaga (1994), Flaga (2008)):
� � � � � �� �212x xW t V t C t D� �
(14)
� � � � � �� �212y yW t V t C t D� �
(15)
� � � � � �� �2 212m mW t V t C t D� �
(16)
where: ρ – air density (ρ = 1,23 kg/m3), V(t) – wind speed component perpendicular to the footbridge axis calculated as:
� � � � � �2 2V t u t w t� �
(17)
u – component of temporary wind speed coincident with mean wind direction (along-wind component), w – vertical component of temporary wind speed, D – characteristic dimension of the footbridge assumed in wind tunnel experiments. The value of aerodynamic coefficient at each time step were determined as the function of temporary angle of wind attack (t) = tan-1(w(t)/u(t)) on the basis of wind tunnel results. Dynamic wind forces based on wind field simulation have been calculated and then decomposed to the respective model nodes. As the result, displacements in chosen nodes of the structures have been obtained. The whole procedure is described in details in Bęc et al. (2010), Flaga et al. (2010), Lipecki et al (2010).
Footbridge “Kazimierz-Ludwinów" FEM model created in ALGOR has been composed of beam 2-D elements. Numerical
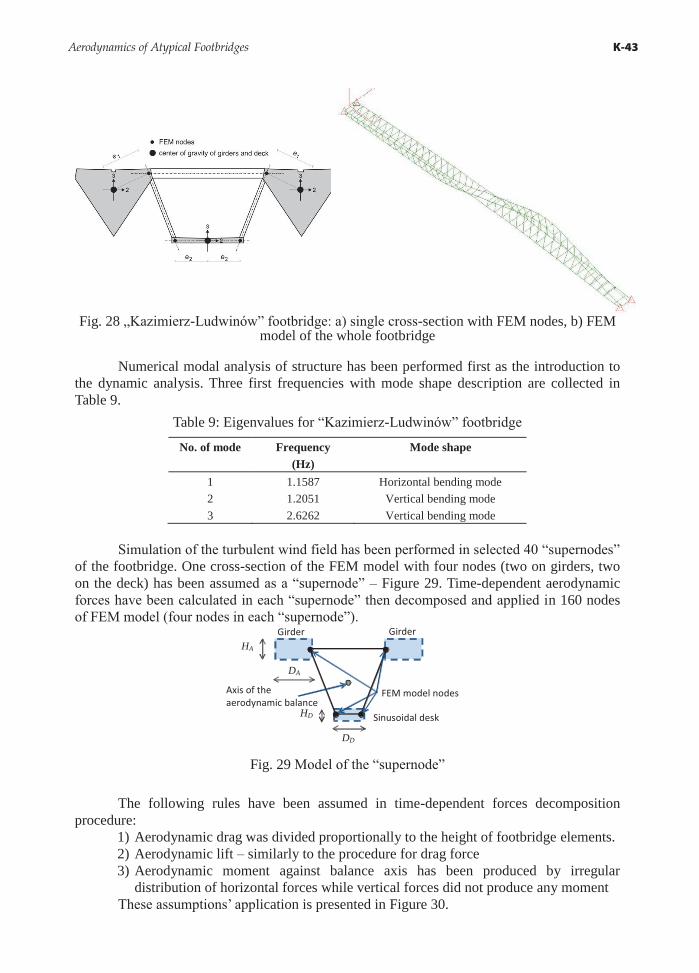
model consisted of 490 elements and 338 nodes. All structural memebers of the footbridge have been modeled: two outer arch-shaped girders, inner sinusoidal deck, hangers and posts, transverse beams connecting girders and elements stiffening inner deck. The nodes localization in single cross-section of the footbridge and FEM model of the whole bridge are presented in Figure 28.
Key-02.qxd 11/24/2013 10:20 AM Page K-42
Aerodynamics of Atypical Footbridges K-43
Fig. 28 „Kazimierz-Ludwinów” footbridge: a) single cross-section with FEM nodes, b) FEM model of the whole footbridge
Numerical modal analysis of structure has been performed first as the introduction to
the dynamic analysis. Three first frequencies with mode shape description are collected in Table 9.
Table 9: Eigenvalues for “Kazimierz-Ludwinów” footbridge
No. of mode Frequency (Hz)
Mode shape
1 1.1587 Horizontal bending mode 2 1.2051 Vertical bending mode 3 2.6262 Vertical bending mode
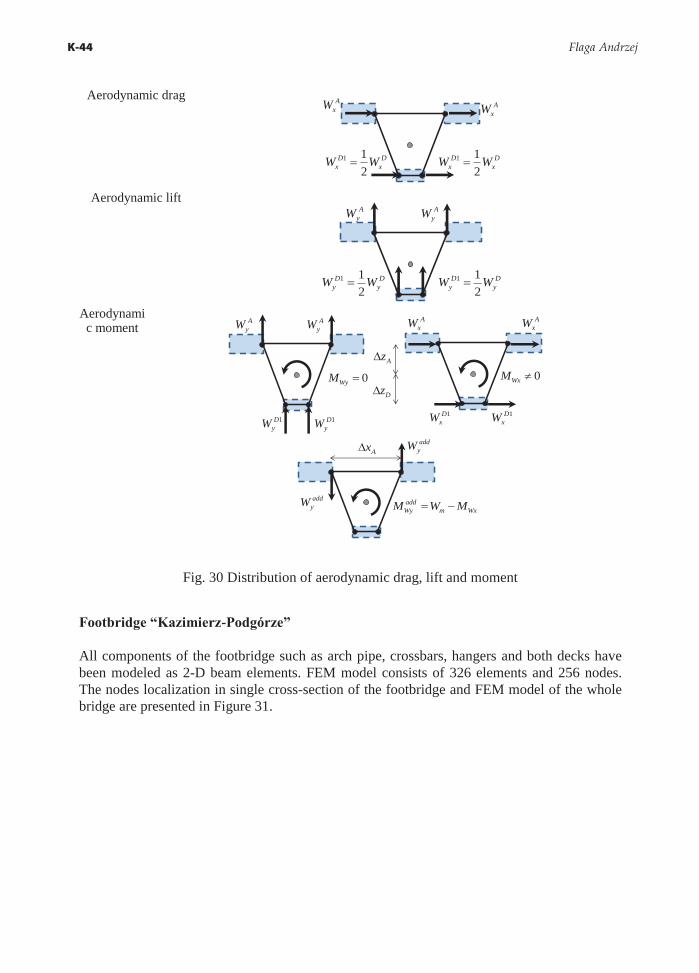
Simulation of the turbulent wind field has been performed in selected 40 “supernodes”
of the footbridge. One cross-section of the FEM model with four nodes (two on girders, two on the deck) has been assumed as a “supernode” – Figure 29. Time-dependent aerodynamic forces have been calculated in each “supernode” then decomposed and applied in 160 nodes of FEM model (four nodes in each “supernode”).
HA
DA
DD
HD
Girder Girder
Sinusoidal desk
FEM model nodes Axis of the aerodynamic balance
Fig. 29 Model of the “supernode”
The following rules have been assumed in time-dependent forces decomposition
procedure: 1) Aerodynamic drag was divided proportionally to the height of footbridge elements. 2) Aerodynamic lift – similarly to the procedure for drag force 3) Aerodynamic moment against balance axis has been produced by irregular
distribution of horizontal forces while vertical forces did not produce any moment These assumptions’ application is presented in Figure 30.
Key-02.qxd 11/24/2013 10:20 AM Page K-43
K-44 Flaga Andrzej
Aerodynamic drag
AxW A
xW
1 12
D Dx xW W�1 1
2D D
x xW W�
Aerodynamic lift A
yW AyW
1 12
D Dy yW W� 1 1
2D D
y yW W�
Aerodynamic moment
AyW A
yW
1DyW 1D
yW
0WyM �Az�
Dz�
AxW A
xW
1DxW1D
xW
0WxM �
Ax�
addyW add
Wy m WxM W M� �
addyW
Fig. 30 Distribution of aerodynamic drag, lift and moment
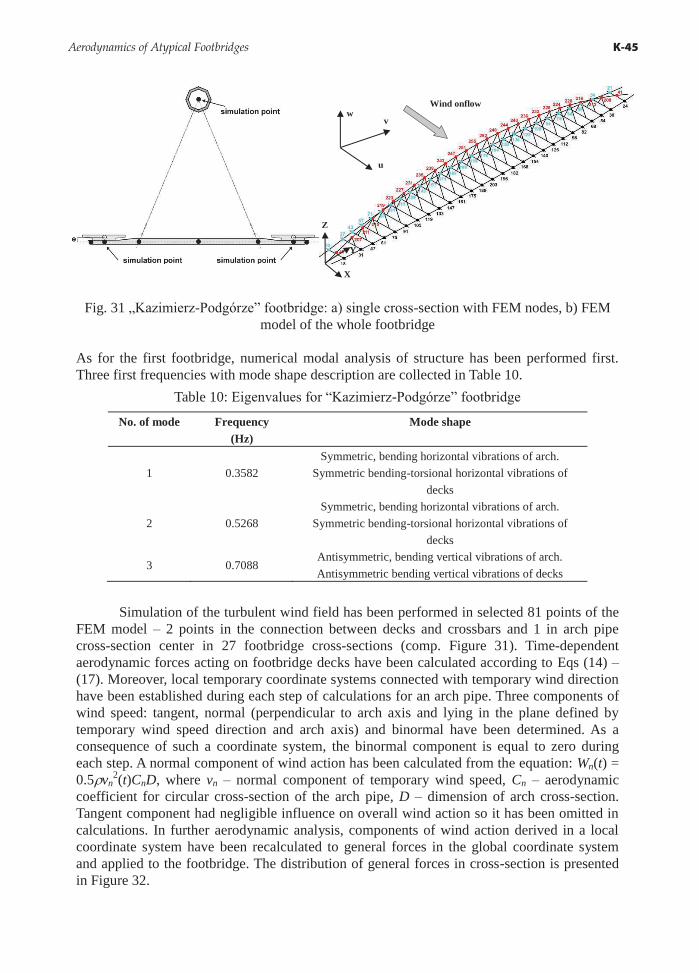
Footbridge “Kazimierz-Podgórze” All components of the footbridge such as arch pipe, crossbars, hangers and both decks have been modeled as 2-D beam elements. FEM model consists of 326 elements and 256 nodes. The nodes localization in single cross-section of the footbridge and FEM model of the whole bridge are presented in Figure 31.
Key-02.qxd 11/24/2013 10:20 AM Page K-44
Aerodynamics of Atypical Footbridges K-45
Fig. 31 „Kazimierz-Podgórze” footbridge: a) single cross-section with FEM nodes, b) FEM model of the whole footbridge
As for the first footbridge, numerical modal analysis of structure has been performed first. Three first frequencies with mode shape description are collected in Table 10.
Table 10: Eigenvalues for “Kazimierz-Podgórze” footbridge
No. of mode Frequency (Hz)
Mode shape
1 0.3582 Symmetric, bending horizontal vibrations of arch.
Symmetric bending-torsional horizontal vibrations of decks
2 0.5268 Symmetric, bending horizontal vibrations of arch.
Symmetric bending-torsional horizontal vibrations of decks
3 0.7088 Antisymmetric, bending vertical vibrations of arch. Antisymmetric bending vertical vibrations of decks
Simulation of the turbulent wind field has been performed in selected 81 points of the FEM model – 2 points in the connection between decks and crossbars and 1 in arch pipe cross-section center in 27 footbridge cross-sections (comp. Figure 31). Time-dependent aerodynamic forces acting on footbridge decks have been calculated according to Eqs (14) – (17). Moreover, local temporary coordinate systems connected with temporary wind direction have been established during each step of calculations for an arch pipe. Three components of wind speed: tangent, normal (perpendicular to arch axis and lying in the plane defined by temporary wind speed direction and arch axis) and binormal have been determined. As a consequence of such a coordinate system, the binormal component is equal to zero during each step. A normal component of wind action has been calculated from the equation: Wn(t) = 0.5�vn
2(t)CnD, where vn – normal component of temporary wind speed, Cn – aerodynamic coefficient for circular cross-section of the arch pipe, D – dimension of arch cross-section. Tangent component had negligible influence on overall wind action so it has been omitted in calculations. In further aerodynamic analysis, components of wind action derived in a local coordinate system have been recalculated to general forces in the global coordinate system and applied to the footbridge. The distribution of general forces in cross-section is presented in Figure 32.
Wind onflow
u
w v
X
Z
Y
Key-02.qxd 11/24/2013 10:20 AM Page K-45
K-46 Flaga Andrzej
Fig. 32 Aerodynamic forces and wind speed components acting in cross-section of the
footbridge Exemplary results and analyses
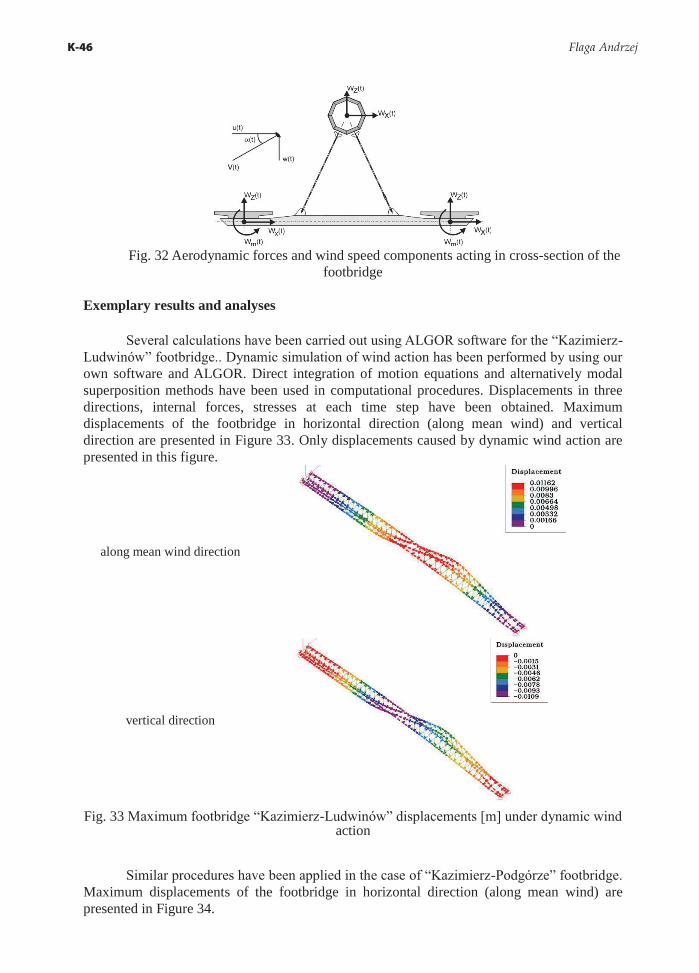
Several calculations have been carried out using ALGOR software for the “Kazimierz-Ludwinów” footbridge.. Dynamic simulation of wind action has been performed by using our own software and ALGOR. Direct integration of motion equations and alternatively modal superposition methods have been used in computational procedures. Displacements in three directions, internal forces, stresses at each time step have been obtained. Maximum displacements of the footbridge in horizontal direction (along mean wind) and vertical direction are presented in Figure 33. Only displacements caused by dynamic wind action are presented in this figure.
along mean wind direction
vertical direction
Fig. 33 Maximum footbridge “Kazimierz-Ludwinów” displacements [m] under dynamic wind action
Similar procedures have been applied in the case of “Kazimierz-Podgórze” footbridge. Maximum displacements of the footbridge in horizontal direction (along mean wind) are presented in Figure 34.
Key-02.qxd 11/24/2013 10:20 AM Page K-46

Aerodynamics of Atypical Footbridges K-47
Vortex excitation of the arch pipe has been also examined in calculations of “Kazimierz-Podgórze”. Two cases of vortex excitation along an arch pipe have been considered: 1) excitation in the antisymmetric bending mode shape of arch vibrations (3rd mode shape f3 = 0 .7088), 2) excitation in symmetric bending mode shape of arch vibrations (5th mode shape f5 = 1.1301 Hz). Nodal dynamic forces induced by dynamic vortex excitation have been applied to the FEM nodes simultaneously with dynamic forces induced by dynamic wind action (with respective wind speed). As before only displacements caused by dynamic wind action and dynamic vortex excitation are presented in Figure 34.
dynamic wind action (along mean wind displacements)
dynamic along-wind action and dynamic vortex excitation in 3rd mode shape
along mean wind direction vertical direction
dynamic along-wind action and dynamic vortex excitation in 5th mode shape. along mean wind direction vertical direction
Fig. 34 Maximum footbridge “Kazimierz-Podgórze” displacements obtained in simulations
Comparison of displacements is compiled in Table 11. As it can be noticed dynamic
wind action in both cases is of secondary importance.
Key-02.qxd 11/24/2013 10:20 AM Page K-47
K-48 Flaga Andrzej
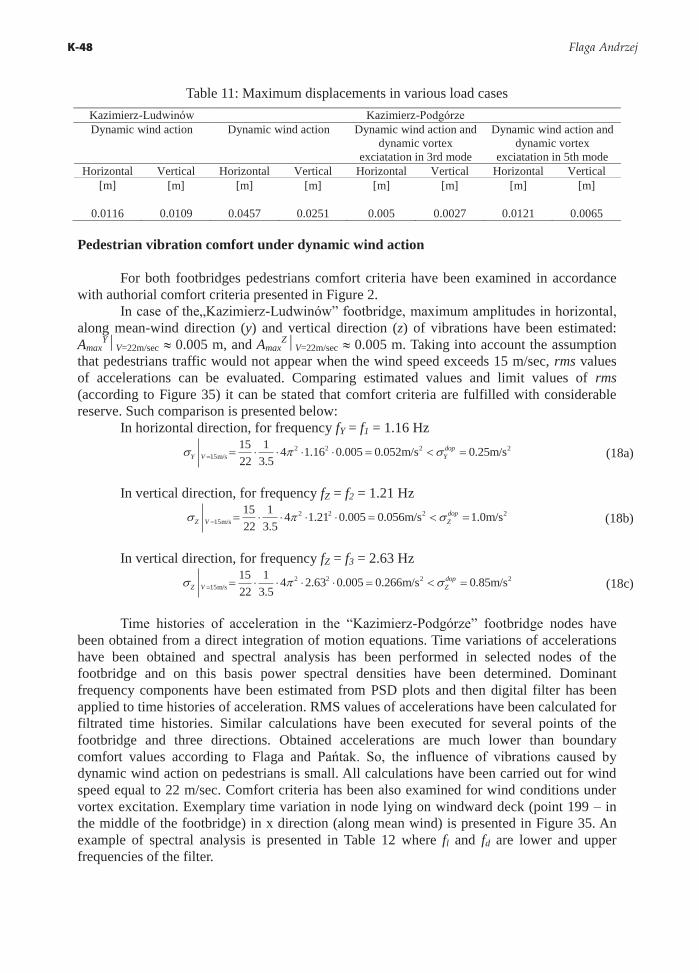
Table 11: Maximum displacements in various load cases Kazimierz-Ludwinów Kazimierz-Podgórze Dynamic wind action Dynamic wind action Dynamic wind action and
dynamic vortex exciatation in 3rd mode
Dynamic wind action and dynamic vortex
exciatation in 5th mode Horizontal Vertical Horizontal Vertical Horizontal Vertical Horizontal Vertical
[m] [m] [m] [m] [m] [m] [m] [m]
0.0116 0.0109 0.0457 0.0251 0.005 0.0027 0.0121 0.0065 Pedestrian vibration comfort under dynamic wind action
For both footbridges pedestrians comfort criteria have been examined in accordance
with authorial comfort criteria presented in Figure 2. In case of the„Kazimierz-Ludwinów” footbridge, maximum amplitudes in horizontal,
along mean-wind direction (y) and vertical direction (z) of vibrations have been estimated: Amax
Y�V=22m/sec � 0.005 m, and AmaxZ�V=22m/sec � 0.005 m. Taking into account the assumption
that pedestrians traffic would not appear when the wind speed exceeds 15 m/sec, rms values of accelerations can be evaluated. Comparing estimated values and limit values of rms (according to Figure 35) it can be stated that comfort criteria are fulfilled with considerable reserve. Such comparison is presented below:
In horizontal direction, for frequency fY = f1 = 1.16 Hz
2 2 2 215m/s
15 1 4 1.16 0.005 0.052m/s 0.25m/s22 3.5
dopY V Y� � �� � � � � � � � � (18a)
In vertical direction, for frequency fZ = f2 = 1.21 Hz 2 2 2 2
15m/s15 1 4 1.21 0.005 0.056m/s 1.0m/s22 3.5
dopZ V Z� � �� � � � � � � � � (18b)
In vertical direction, for frequency fZ = f3 = 2.63 Hz 2 2 2 2
15m/s15 1 4 2.63 0.005 0.266m/s 0.85m/s22 3.5
dopZ V Z� � �� � � � � � � � � (18c)
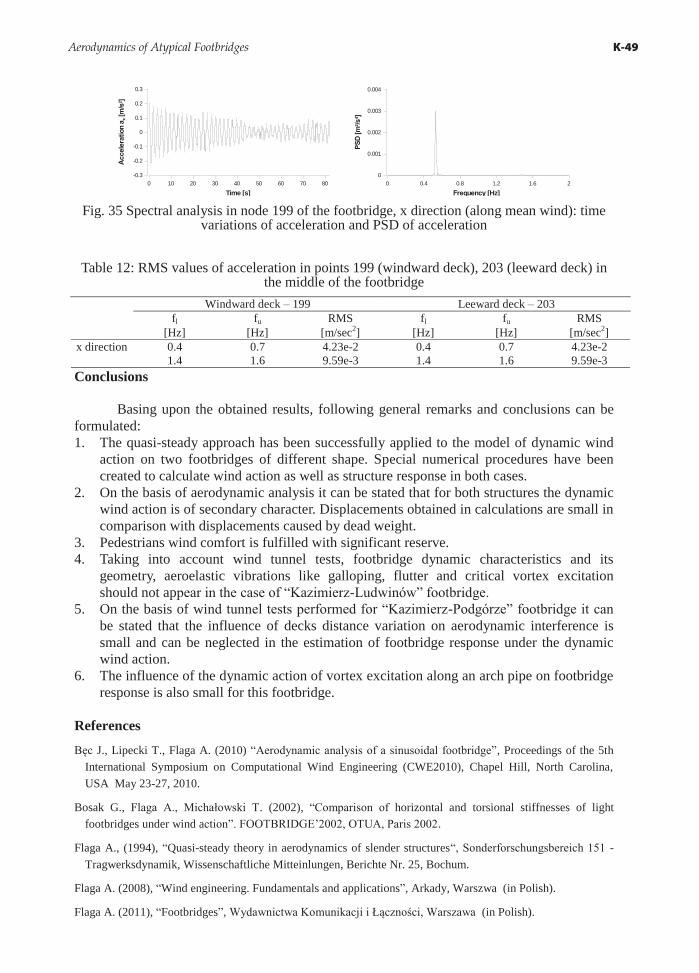
Time histories of acceleration in the “Kazimierz-Podgórze” footbridge nodes have been obtained from a direct integration of motion equations. Time variations of accelerations have been obtained and spectral analysis has been performed in selected nodes of the footbridge and on this basis power spectral densities have been determined. Dominant frequency components have been estimated from PSD plots and then digital filter has been applied to time histories of acceleration. RMS values of accelerations have been calculated for filtrated time histories. Similar calculations have been executed for several points of the footbridge and three directions. Obtained accelerations are much lower than boundary comfort values according to Flaga and Pańtak. So, the influence of vibrations caused by dynamic wind action on pedestrians is small. All calculations have been carried out for wind speed equal to 22 m/sec. Comfort criteria has been also examined for wind conditions under vortex excitation. Exemplary time variation in node lying on windward deck (point 199 – in the middle of the footbridge) in x direction (along mean wind) is presented in Figure 35. An example of spectral analysis is presented in Table 12 where fl and fd are lower and upper frequencies of the filter.
Key-02.qxd 11/24/2013 10:20 AM Page K-48
Aerodynamics of Atypical Footbridges K-49
0 10 20 30 40 50 60 70 80
Time [s]
-0.3
-0.2
-0.1
0
0.1
0.2
0.3
Acce
lera
tion
a x [m
/s2 ]
0 0.4 0.8 1.2 1.6 2
Frequency [Hz]
0
0.001
0.002
0.003
0.004
PSD
[m2 /s
4 ]
Fig. 35 Spectral analysis in node 199 of the footbridge, x direction (along mean wind): time
variations of acceleration and PSD of acceleration
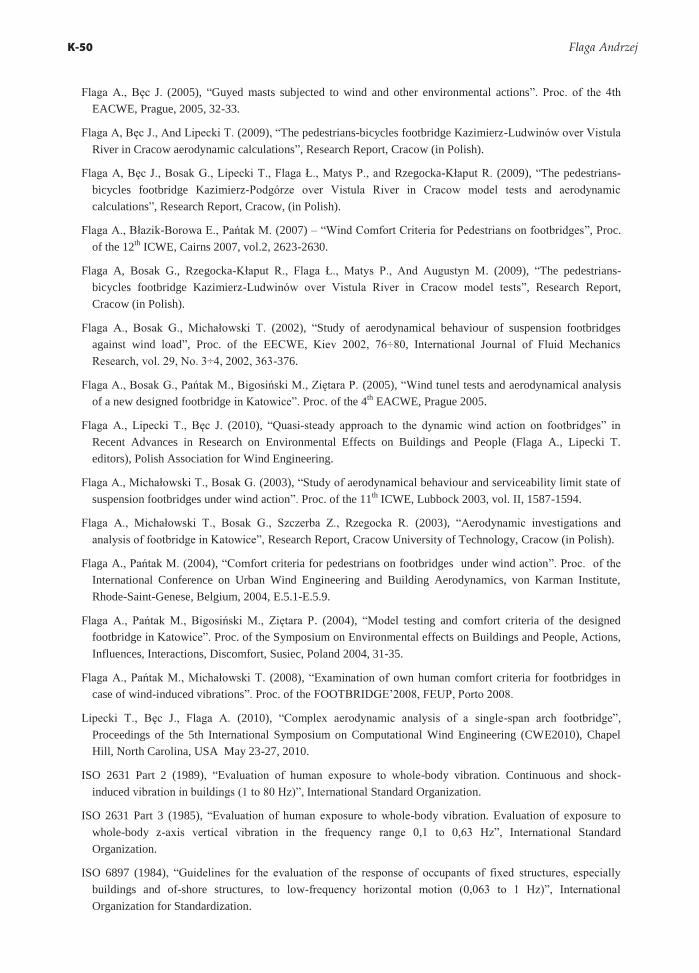
Table 12: RMS values of acceleration in points 199 (windward deck), 203 (leeward deck) in the middle of the footbridge
Windward deck – 199 Leeward deck – 203 fl fu RMS fl fu RMS [Hz] [Hz] [m/sec2] [Hz] [Hz] [m/sec2]
x direction 0.4 0.7 4.23e-2 0.4 0.7 4.23e-2 1.4 1.6 9.59e-3 1.4 1.6 9.59e-3
Conclusions
Basing upon the obtained results, following general remarks and conclusions can be formulated: 1. The quasi-steady approach has been successfully applied to the model of dynamic wind
action on two footbridges of different shape. Special numerical procedures have been created to calculate wind action as well as structure response in both cases.
2. On the basis of aerodynamic analysis it can be stated that for both structures the dynamic wind action is of secondary character. Displacements obtained in calculations are small in comparison with displacements caused by dead weight.
3. Pedestrians wind comfort is fulfilled with significant reserve. 4. Taking into account wind tunnel tests, footbridge dynamic characteristics and its
geometry, aeroelastic vibrations like galloping, flutter and critical vortex excitation should not appear in the case of “Kazimierz-Ludwinów” footbridge.
5. On the basis of wind tunnel tests performed for “Kazimierz-Podgórze” footbridge it can be stated that the influence of decks distance variation on aerodynamic interference is small and can be neglected in the estimation of footbridge response under the dynamic wind action.
6. The influence of the dynamic action of vortex excitation along an arch pipe on footbridge response is also small for this footbridge.
References
Bęc J., Lipecki T., Flaga A. (2010) “Aerodynamic analysis of a sinusoidal footbridge”, Proceedings of the 5th International Symposium on Computational Wind Engineering (CWE2010), Chapel Hill, North Carolina, USA May 23-27, 2010.
Bosak G., Flaga A., Michałowski T. (2002), “Comparison of horizontal and torsional stiffnesses of light footbridges under wind action”. FOOTBRIDGE’2002, OTUA, Paris 2002.
Flaga A., (1994), “Quasi-steady theory in aerodynamics of slender structures“, Sonderforschungsbereich 151 - Tragwerksdynamik, Wissenschaftliche Mitteinlungen, Berichte Nr. 25, Bochum.
Flaga A. (2008), “Wind engineering. Fundamentals and applications”, Arkady, Warszwa (in Polish).
Flaga A. (2011), “Footbridges”, Wydawnictwa Komunikacji i Łączności, Warszawa (in Polish).
Key-02.qxd 11/24/2013 10:20 AM Page K-49
K-50 Flaga Andrzej
Flaga A., Bęc J. (2005), “Guyed masts subjected to wind and other environmental actions”. Proc. of the 4th EACWE, Prague, 2005, 32-33.
Flaga A, Bęc J., And Lipecki T. (2009), “The pedestrians-bicycles footbridge Kazimierz-Ludwinów over Vistula River in Cracow aerodynamic calculations”, Research Report, Cracow (in Polish).
Flaga A, Bęc J., Bosak G., Lipecki T., Flaga Ł., Matys P., and Rzegocka-Kłaput R. (2009), “The pedestrians-bicycles footbridge Kazimierz-Podgórze over Vistula River in Cracow model tests and aerodynamic calculations”, Research Report, Cracow, (in Polish).
Flaga A., Błazik-Borowa E., Pańtak M. (2007) – “Wind Comfort Criteria for Pedestrians on footbridges”, Proc. of the 12th ICWE, Cairns 2007, vol.2, 2623-2630.
Flaga A, Bosak G., Rzegocka-Kłaput R., Flaga Ł., Matys P., And Augustyn M. (2009), “The pedestrians-bicycles footbridge Kazimierz-Ludwinów over Vistula River in Cracow model tests”, Research Report, Cracow (in Polish).
Flaga A., Bosak G., Michałowski T. (2002), “Study of aerodynamical behaviour of suspension footbridges against wind load”, Proc. of the EECWE, Kiev 2002, 76÷80, International Journal of Fluid Mechanics Research, vol. 29, No. 3÷4, 2002, 363-376.
Flaga A., Bosak G., Pańtak M., Bigosiński M., Ziętara P. (2005), “Wind tunel tests and aerodynamical analysis of a new designed footbridge in Katowice”. Proc. of the 4th EACWE, Prague 2005.
Flaga A., Lipecki T., Bęc J. (2010), “Quasi-steady approach to the dynamic wind action on footbridges” in Recent Advances in Research on Environmental Effects on Buildings and People (Flaga A., Lipecki T. editors), Polish Association for Wind Engineering.
Flaga A., Michałowski T., Bosak G. (2003), “Study of aerodynamical behaviour and serviceability limit state of suspension footbridges under wind action”. Proc. of the 11th ICWE, Lubbock 2003, vol. II, 1587-1594.
Flaga A., Michałowski T., Bosak G., Szczerba Z., Rzegocka R. (2003), “Aerodynamic investigations and analysis of footbridge in Katowice”, Research Report, Cracow University of Technology, Cracow (in Polish).
Flaga A., Pańtak M. (2004), “Comfort criteria for pedestrians on footbridges under wind action”. Proc. of the International Conference on Urban Wind Engineering and Building Aerodynamics, von Karman Institute, Rhode-Saint-Genese, Belgium, 2004, E.5.1-E.5.9.
Flaga A., Pańtak M., Bigosiński M., Ziętara P. (2004), “Model testing and comfort criteria of the designed footbridge in Katowice”. Proc. of the Symposium on Environmental effects on Buildings and People, Actions, Influences, Interactions, Discomfort, Susiec, Poland 2004, 31-35.
Flaga A., Pańtak M., Michałowski T. (2008), “Examination of own human comfort criteria for footbridges in case of wind-induced vibrations”. Proc. of the FOOTBRIDGE’2008, FEUP, Porto 2008.
Lipecki T., Bęc J., Flaga A. (2010), “Complex aerodynamic analysis of a single-span arch footbridge”, Proceedings of the 5th International Symposium on Computational Wind Engineering (CWE2010), Chapel Hill, North Carolina, USA May 23-27, 2010.
ISO 2631 Part 2 (1989), “Evaluation of human exposure to whole-body vibration. Continuous and shock-induced vibration in buildings (1 to 80 Hz)”, International Standard Organization.
ISO 2631 Part 3 (1985), “Evaluation of human exposure to whole-body vibration. Evaluation of exposure to whole-body z-axis vertical vibration in the frequency range 0,1 to 0,63 Hz”, International Standard Organization.
ISO 6897 (1984), “Guidelines for the evaluation of the response of occupants of fixed structures, especially buildings and of-shore structures, to low-frequency horizontal motion (0,063 to 1 Hz)”, International Organization for Standardization.
Key-02.qxd 11/24/2013 10:20 AM Page K-50