Embed Size (px)
Citation preview
Aerodynamic Modifications of High-Rise Buildings for Wind Load and Response Reductions
*Virote Boonyapinyo1) and Pongsakorn Wangkansirikun2)
1), 2) Department of Civil Engineering, Thammasat University, Rangsit Campus,
Khlong-luang, Pathumthani 12120, Thailand 1)
ABSTRACT Aerodynamic modifications of high-rise buildings for wind load and response reductions were studied. The high frequency force balance method in the wind tunnel based on base-bending-moment-based procedure was applied to test the sharp corner models and modification corner models by recession and chamfer. All results of mean wind force coefficients, spectra of aerodynamic base moments and torques, and standard deviation of fluctuating base moments and torques were compared for the wind directions of 10, 20, 30, 40, and 45 degrees. The results show that the corner modifications result in significant reductions of along wind and across wind loads and response. For examples, the recession of the corner at 10 % of building face lead to reductions of base moment around x axis (0 degree wind direction) of 18, 25, 14, 3 and 2 percent for model depth to width aspect ratio of 1:1, 1:1.5, 1:2, 1.5:1 and 2:1, respectively. Similarly, the recession of the corner at 10 % result in reductions of base moment around y axis of 13, 16, 14, 18 and 10 percent for the above models, respectively. 1. INTRODUCTION Under the action of wind, typical tall buildings oscillate simultaneously in the alongwind, acrosswind, and torsional directions. It has been recognized that for many high-rise buildings the acrosswind and torsional response may exceed the alongwind response in terms of both serviceability and survivability designs. However, most existing codes and standards provide only procedures for the alongwind response and provide little guidance for the critical acrosswind and torsional responses. This is partially attributed to the fact that the acrosswind and torsional responses, unlike the alongwind, result mainly from the aerodynamic pressure fluctuations in the separated shear layers and wake flow fields. Wind tunnel measurements have thus served as an effective alternative for
1)
Associate Professor 2)
Formerly Graduate Student
determining acrosswind and torsional loads. For example, the high-frequency base balance (HFBB) and aeroelastic model tests are presently used as routine tools in commercial design practice. However, considering the cost and lead time needed for wind tunnel testing, a simplified procedure would be desirable in the preliminary design stages, allowing early assessment of the structural resistance, evaluation of architectural or structural changes, or assessment of the need for detailed wind tunnel tests. Two kinds of wind tunnel-based procedures have been introduced in some of the existing codes and standards to treat the acrosswind and torsional response. The first is an empirical expression for the wind-induced acceleration, such as that found in the National Building Code of Canada (NBCC) (NRCC 2005), while the second is an aerodynamic-load-based procedure such as those in Australian Standard (AS 1989) and the Architectural Institute of Japan (AIJ) Recommendations (AIJ 2004). The latter approach offers more flexibility as the aerodynamic load provided can be used to determine the response of any structure having generally the same architectural features and turbulence environment of the tested model, regardless of its structural characteristics. Such flexibility is made possible through the use of well-established wind-induced response analysis procedures. There are many measures that can be reduced the wind load and response in the structural design such as stiffening, adding mass or introducing supplementary damping systems. However, these do not attack the vortex shedding at its source. The source is the building shape and it is possible to virtually eliminate the vortex shedding forces through selection and refinement of the building shape. However, most of previous researched on wind tunnel test were based on the rectangular shape (Zhou et al. 2003; Kwon et al. 2007; Gu and Quan 2004). Very few researches have studied the rectangular shape with aerodynamic modification. In this study, aerodynamic modifications of high-rise buildings for wind load and response reductions were studied by the wind tunnel test. The high frequency force balance method in the wind tunnel was applied to test the sharp corner models and modification corner models by recession and chamfer. In additions, the aerodynamic modifications by small opening and by decoration fin were investigated. 2. WIND-INDUCED RESPONSE ANAYSIS PROCEDURE Using the aerodynamic base bending moment or base torque as the input, the wind-induced response of a building can be computed using random vibration analysis by assuming idealized structural mode shapes, e.g. linear, and considering the special relationship between the aerodynamic moments and the generalized wind loads. This conventional approach yields only approximate estimates of the mode-generalized torsional moments and potential inaccuracies in the lateral loads if the sway mode shapes of the structure deviate significantly from the linear assumption. As a result, this procedure often requires the additional step of mode shape corrections to adjust the measured spectrum weighted by a linear mode shape to the true mode shape. However, instead of utilizing conventional generalized wind loads, a base-bending moment-based procedure is suggested here for evaluating equivalent static wind loads and response. The influence of nonideal mode shapes is rather negligible for base bending moments, as opposed to other quantities like base shear or generalized wind

loads. As a result, base bending moments can be used directly, presenting a computationally efficient scheme, averting the need for mode shape correction and directly accommodating nonideal mode shapes. Application of this procedure for the alongwind response has proven effective in recasting the traditional gust loading factor approach in a new format. The procedure can be conveniently adapted to the acrosswind and torsional response. It should be noted that the response estimation based on the aerodynamic database and wind tunnel test by the high-frequency base balance (HFBB) is not advocated for acrosswind response calculations in situations where the reduced frequency is equal to or slightly less than the Strouhal number (Simiu and Scanlan 1996). In such cases, the possibility of negative aerodynamic damping, a manifestation of motion-induced effects, may cause the computed results to be inaccurate. In this study, the following procedure for wind load and response analysis was based on the base-bending-moment-based procedure proposed by Zhou et al. (2003) and Kwon et al. (2007). 2.1 Calculation of Based Moments and Torque Assuming a stationary Gaussian process, the expected maximum base bending moment response in the alongwind or acrosswind directions or the base torque response can be expressed in the following form:
MgMM ˆ (1)
where M̂ and M = expected extreme value and mean of the moment or torque
response, respectively, g = peak factor, and M = root mean square (RMS) of the fluctuating base moment or base torque response, which can be computed by
0
df)f(SMM where SM(f) = power spectral density (PSD) of the fluctuating base
moment or torque response. It can be shown that the PSD of the moment response can be computed by the following equation:
2
1 |)(|)()( fHfSfS mM (2)
where 2
12
1
21
21
1
))f/f(()f/f((|)f(H|
= structural transfer function of the first
mode, f1 and = natural frequency and critical damping ratio in the first mode,
respectively, and SM(f) = PSD of the aerodynamic base moment or torque. To facilitate computations, the integration in Eq. (2) is divided into two portions, i.e., background and resonant components. The resonant base moment or base torque
response, RM̂ , can be computed in closed-form by assuming that the excitation can
be represented by white-noise in the vicinity of the structure ’s natural frequency and by subsequently invoking the Residue Theorem for integration

)(4
ˆ11
1
fSfgM mRR
(3)
where )Tfln(
.)Tfln(gR
1
1
2
577202 = resonant peak factor, T = observation time,
and subscript R = resonant component. The background base moment and base
torque, BM̂ , is equal to the aerodynamic quantity since, for the background response,
the structure responds statically with a dynamic magnification factor of unity and
mBB gM̂ (4)
where gB = background peak factor, which is usually at 3~4, m = RMS aerodynamic moment, and subscript B = background component. The mean base moment or base torque can be estimated from the HFBB test or by a mean pressure measurement test that is usually used as a companion test for the design of the cladding system. The measured aerodynamic loads are defined in terms of the RMS base moment coefficient and the non-dimensional Power Spectral Density (PSD) as follows:
cm =
'M___
m (5)
2
)()(
m
m
M
fSffC
(6)
where CM = non-dimensional moment coefficient and '___
M = reference moment or torque,
which is defined by )2/1(' 22
BHUM HD , )2/1(' 22
DHUM HL and )2/1('2
BDHUM HT
for the alongwind, acrosswind and torsional directions, respectively. Here = air density, B =
building width normal to the oncoming wind, D = building depth , HU = mean wind velocity evaluated at the building height, H, and subscripts D, L and T = alongwind, acrosswind and torsional directions, respectively. The non-dimensional aerodynamic loads can be directly used in the above analysis procedure, e.g., the background and the resonant components of the base bending moment or base torque can be computed, respectively, by
'MgM cmBB
(7)
)(4
' 1
1
fCMgM McmRR
(8)
2.2 Calculation of Equivalent Static Wind Loading and Response

With the known base moment and base torque response, the equivalent static wind loading can be obtained by distributing the base moment to each floor. The equivalent static wind loads at height z for sway motions can be computed by
HRR
zdz)z()z(m
)z()z(mM̂)z(P̂
0
1
1
(9)
while for the torsional case,
HRR
dz)z()z(I
)z()z(IM̂)z(P̂
0
1
1
(10)
where RP̂ = resonant component of the equivalent static wind loading, m(z) = mass per
unit height, I(z) = mass moment of inertia per unit height, and 1(z) = fundamental mode shape in the direction of motion.
The mean base moment ( M ) has a relation with the mean component of the equivalent static wind loading as follows:
z
zdzzPM0
)( (11)
where mean component of the equivalent static wind loading ( P ) is
HH
z
HMHBC
H
zUzP DH
2
2
22 22
2
1)( (12)
The background component for alongwind and acrosswind responses can be obtained as follows :
HH
z
HMzP LDBLDB
2
2),(),(
22)( (13)
Similarity, the background component for the torsional response is expressed as
HH
z
HMzP TBTB
2
)()(
21)( (14)
where CD = drag force coefficient ; H = floor-to-floor height of building ; = exponent of mean wind speed profile defined in ASCE 7 (2005).

The wind-induced response, including the overall deflection, acceleration, internal forces, and stresses in each structural member can be computed using the equivalent static wind loads with a simple static analysis. For any response component, the resultant effect can be determined by summing the mean and the SRSS combination of the background and resonant components
22 ˆˆˆRB rrrr (15)
where r̂ = resultant wind-induced response of interest, r , Br̂ , Rr̂ = mean, peak
background and peak resonant response components, which are computed using the corresponding equivalent static wind load component with static analysis. However, for the acceleration response, only the resonant component is of interest. For example, the peak acceleration in the sway mode can be computed by
)(
)()(
)()(ˆ
)( 1
0
2
1
0
1
z
dzzzm
dzzzP
zYH
H
R
(16)
In the case of the torsional response, the mass per unit height, m(z), in Eq. (16) is replaced by I(z), the mass moment of inertia per unit height. The resulting RMS acceleration can then be determined by dividing the peak accelerations by the resonant peak factor, gR. 2.3 Data Processing The output of the sensitive, multi-component force balance was recorded over a 5-minute interval for each wind direction at sampling rate of 400 Hz. The resulting time histories were segmented into 20 blocks and were then analyzed to yield over 20 raw spectra, which were subsequently ensemble averaged. Prior to test, system identification was conducted on the high-frequency base balance mounted with the specially constructed lightweight rigid model. The system should have natural frequencies of oscillation sufficiently high (typically over 60 Hz.) that it response to both the externally applied mean and fluctuating wind loads, without the effects of resonance due to inertial acceleration. 3. NATURAL WIND SIMULATION IN BOUNDARY LAYER TU-AIT WIND TUNNEL In this study, wind tunnel tests were performed at the boundary-layer long-wind tunnel that was jointly built by Thammasat University (TU) and Asian Institute of Technology (AIT) at Thammasat University. The test section is 2.5x2.5 m with 25.5m in length. Wind speed is in the range of 0.5 to 20 m/s. A combination of spires, barrier and roughness elements was conducted in the TU-AIT wind tunnel to generate boundary layer wind at a length scale of 1/400. For

details, three triangular spires were used as vortex generators by being placed at the trialing edge of contraction. The fetch of roughness elements is 12-m long. This simulated wind was inspected by using hot-film anemometer which was suitable for measuring mean and fluctuating velocity at any different heights of turntable center. Measurements of longitudinal mean and fluctuating velocities could be obtained from the fluctuating output voltages which digitized using A/D converter controlled by software in a personal computer. Subsequently, the vertical profile of mean wind speed, the vertical profile of intensity turbulence, and the spectral density function of longitudinal turbulence could be plotted. For turbulence intensity profile, the data are plotted up to a height of 1 m. in wind tunnel. The profile was found to compare well with the empirical formula in ASCE (1999) and ASCE Standard (2005). The spectral density function of longitudinal turbulence was compared with Von Karman spectrum. The results show very good agreement between simulated and Von Karman spectrum. Therefore, the simulated flow in the TU-AIT wind tunnel was suitable for wind load studies. 4. AERODYNAMIC MODIFICATION BY SOFTENED CORNERS Square or rectangular shapes are very common for buildings and experience relatively strong vortex shedding forces. However, many researches recently found that if the corners can be softened through chamfering, rounding, recession, or stepping them inwards, the excitation forces can be substantially reduced. The softening should extend about 10% of the building width in from the corner. The corner on Taipei 101 were stepped in order to reduce acrosswind response and drag, resulting in a 25% reduction in base moment (Irwin 2009). However, most of the previous researches were considered for the square building shape. In this study, the buildings with sharp square and rectangular shapes and shapes with the recession of the corner at 10 % of building face with the aspect ratio of depth : width : height of 10:10:60 cm (1:1:6), 10:15:60 cm (1:1.5:6), 10:20:60 cm (1:2:6), 15:10:60 cm (1.5:1:6) and 20:10:60 cm (2:1:6) as shown in Figs. 1 and 2 were investigated. In addition, the buildings with the chamfered of the corner at 10 % of building face with the aspect ratio of depth : width : height of 10:10:60 cm (1:1:6) were investigated. 4.1 Corner modification for aspect ratio of depth : width = 1 : 1 4.1.1 Mean wind force coefficients Mean wind force coefficients along each axis are shown in Fig. 3 for sharp square shape, recession corner, and chamfered corner. The results show that the mean wind force coefficients in x direction (drag force) of recession corner and chamfered corner significantly reduce especially for 0 degree wind direction.

Fig. 1 Buildings with sharp rectangular shape, recession corner at 10 %, and chamfered corner at 10 % of building face, and building models in wind tunnel
Sharp square and rectangular shapes
Recession and chamfered corners

Fig. 2 Wind direction
a) b)
c)
Fig. 3 Mean wind force coefficients along each axis for sharp square shape, recession corner, and chamfered corner: a) X axis, b) Y axis,
and c) torsional axis

4.1.2 Standard deviation of fluctuating base moments and torques Standard deviation of fluctuating base moments and torques about each axis are shown in Fig. 4 for sharp square shape, recession corner, and chamfered corner. The results show that the standard deviation of fluctuating base moments and torques of recession corner and chamfered corner significantly reduce for all wind direction.
a) b)
c)
Fig. 4 Standard deviation of fluctuating base moments and torque about each axis for sharp square shape, recession corner, and chamfered corner: a) X axis, b) Y axis,
and c) Z axis
4.1.3 Spectra of aerodynamic base moments and torques Spectra of aerodynamic base moments and torques about each axis for 0 degree wind direction are shown in Fig. 5 for sharp square shape, recession corner, and chamfered corner. The results show that the spectra of aerodynamic base moments about X axis (acrosswind) of all shapes exhibits an evident peak around the Strouhal number. However, the peak spectra of the recession corner and chamfered corner significantly reduce at the Strouhal number. No significantly difference of the spectra of aerodynamic base moments about Y axis (alongwind) of all shapes. The spectra of aerodynamic base moments about Z axis (torsion) of the recession corner and

chamfered corner significantly reduce.
a) b)
c)
Fig. 5 Spectra of aerodynamic base moments and torque about each axis for 0 degree wind direction for sharp square shape, recession corner, and chamfered corner:
a) X axis (acrosswind), b) Y axis (alongwind), and c) Z axis 4.1.4 Comparisons of based moments and torque and acceleration responses The building has the dimensions of depth : width : height = 40 : 40 : 240 m. in urban terrain. The natural frequencies in X and Y directions are 0.177 Hz and 0.177 Hz, and torsional frequency is 0.22 Hz. For strength consideration, 1-hour average wind speed in 50 year return period at 10 m in open terrain = 25 m/s corresponding to
33.43 m/s at building height, and damping ratio = 0.02. For serviceability consideration, 1-hour average wind speed in 10 year return period at 10 m in open
terrain = 20.25 m/s corresponding to 27.07 m/s at building height, and damping ratio = 0.01. The results of based moments and torque are shown in Fig. 6 for sharp square shape, recession corner by 5%, 10% and 20 % of the building width, and chamfered

corner. The results shown that the recession corners by 10% of the building width can reduce the based moments in X and Y directions and based torque by 23%, 43% and 62%, respectively for 0 degree wind direction, compared with sharp shape. When the all wind directions are considered, the recession corner can reduce the based moments in X and Y directions and based torque by 18%, 13% and 51%, respectively. The chamfered corners lead to similar results for the recession corners.
Fig. 6 Comparisons of based moments and torque for sharp square shape, recession corner, and chamfered corner.
The three components accelerations and combined accelerations were evaluated for the studied building. Torsional accelerations are converted from radians/sec2 (i.e. rotational acceleration) to an equivalent linear acceleration (m/s2) by applying a lever arm equal to approximately the maximum extent of the floor plan level from the mass center, and they are separated into the resultant x-axis and y-axis components at the corner of the buildings. Then, these lateral accelerations induced by the torsion can be combined with those generated by the sway motion to obtain the total lateral acceleration at the corner by the square root of the sum of the squares (SRSS). The results of peak acceleration response at corner of building top are shown in Fig. 7 and Table 1 for sharp square shape, recession corner by 5%, 10% and 20 % of the building width, and chamfered corner. The results shown that when all the based moment and torque and peak acceleration response are considered, the recession corners by 10% of the building width and the chamfered corners result in the most optimal shape.

Fig. 7 Comparisons of peak acceleration response for sharp square shape, recession corner, and chamfered corner.
Table 1 Comparisons of peak acceleration response for sharp square shape, recession
corner, and chamfered corner for 0 degree wind direction.
Model Peak Acc.
(mg.)
Reduction for 0 deg. wind dir.
(%)
Sharp 13.20 -
Chamfered 10.37 21
Re 05 11.31 14
Re 10 9.27 30
Re 20 8.89 33
4.2 Corner modification for aspect ratio of depth : width = 1:1, 1:1.5, 1:2, 1.5:1 and 2:1 4.2.1 Mean wind force coefficients Mean wind force coefficients along each axis are shown in Figs. 8-10 for sharp shape and recession corner for aspect ratio of depth : width = 1:1, 1:1.5, 1:2, 1.5:1 and 2:1. The recession corner by 10% of the building width. The results show that the mean wind force coefficients in x direction (drag force) for sharp shape for aspect ratio of depth : width = 2 : 1 are the most lowest among the shape shapes. The mean wind force coefficients in x direction (drag force) for recession corner further significantly reduce especially for 0 degree wind direction.

a) b)
Fig. 8 Mean wind force coefficients along X axis for: a) sharp shape and b) recession corner
b) b) Fig. 9 Mean wind force coefficients along Y axis for: a) sharp shape and b) recession
corner
a) b)
Fig. 10 Mean wind force coefficients along torsional axis for: a) sharp shape and b) recession corner

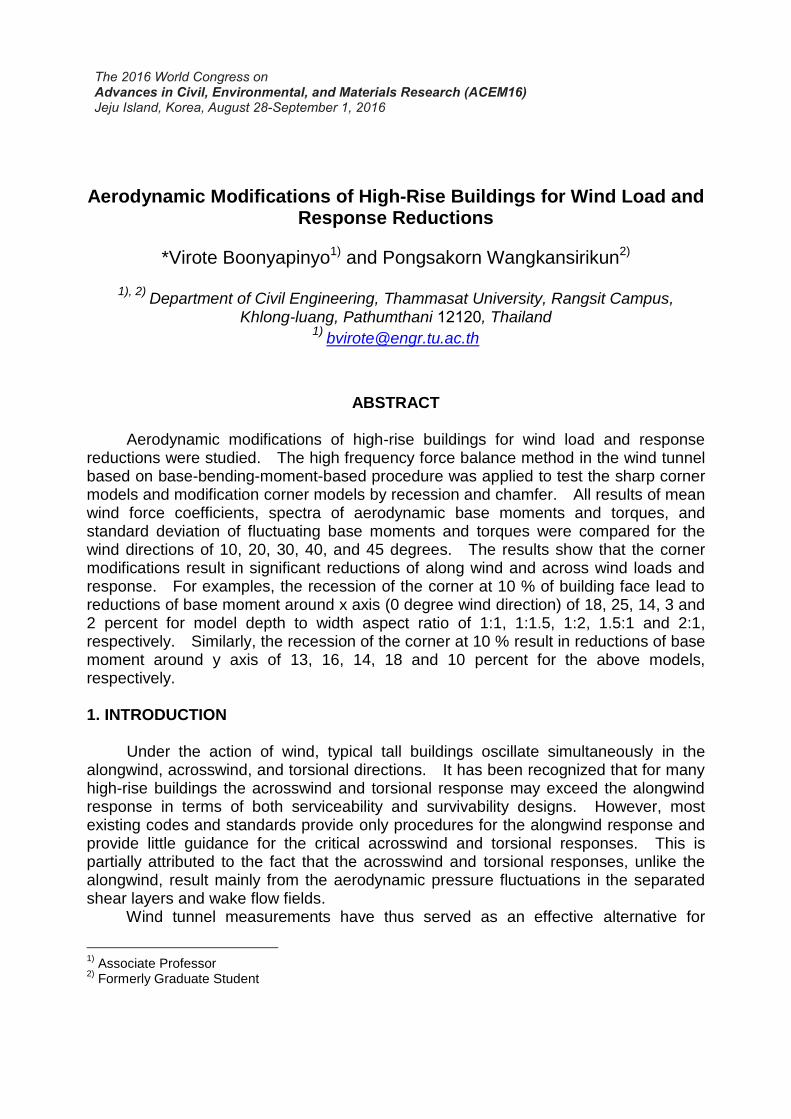
4.2.2 Standard deviation of fluctuating base moments and torques Standard deviation of fluctuating base moments and torques about each axis are shown in Figs. 11-13 for sharp shape and recession corner for aspect ratio of depth : width = 1:1, 1:1.5, 1:2, 1.5:1 and 2:1. The results show that the standard deviation of fluctuating base moments for sharp shape for aspect ratio of depth : width = 2 : 1 are the most lowest among the shape shapes while this aspect ratio leads to the most highest fluctuating base torque. The standard deviation of fluctuating base moments and torque for recession corner further significantly reduce for all wind directions.
a) b)
Fig. 11 Standard deviation of fluctuating base moments about X axis for: a) sharp shape and b) recession corner
a) b)
Fig. 12 Standard deviation of fluctuating base moments about Y axis for: a) sharp shape and b) recession corner
a) b)
Fig. 13 Standard deviation of fluctuating base torque for: a) sharp shape and b) recession corner
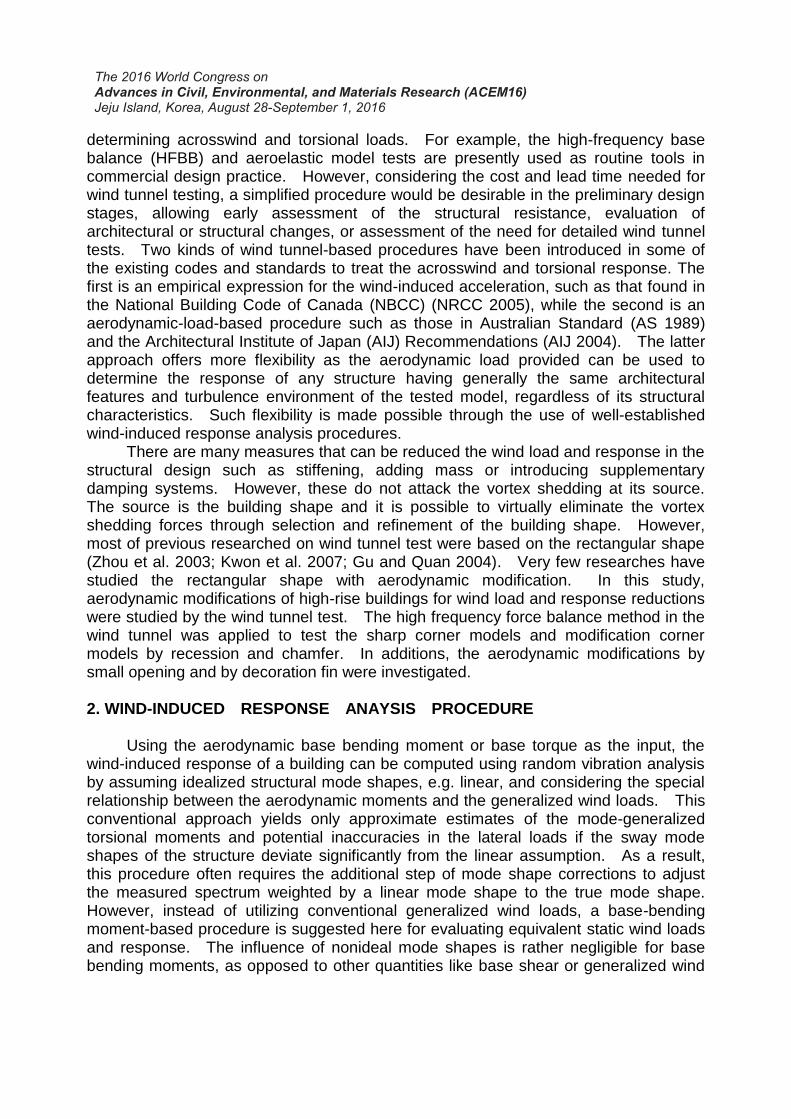
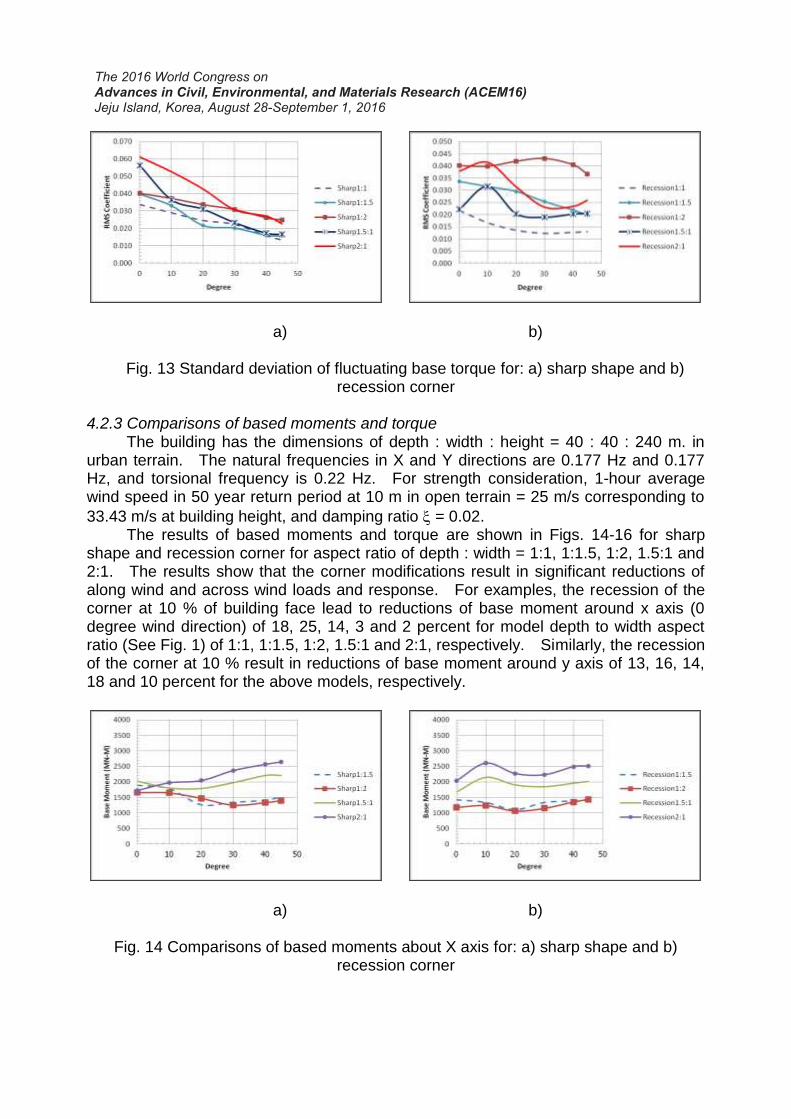
4.2.3 Comparisons of based moments and torque The building has the dimensions of depth : width : height = 40 : 40 : 240 m. in urban terrain. The natural frequencies in X and Y directions are 0.177 Hz and 0.177 Hz, and torsional frequency is 0.22 Hz. For strength consideration, 1-hour average wind speed in 50 year return period at 10 m in open terrain = 25 m/s corresponding to
33.43 m/s at building height, and damping ratio = 0.02. The results of based moments and torque are shown in Figs. 14-16 for sharp shape and recession corner for aspect ratio of depth : width = 1:1, 1:1.5, 1:2, 1.5:1 and 2:1. The results show that the corner modifications result in significant reductions of along wind and across wind loads and response. For examples, the recession of the corner at 10 % of building face lead to reductions of base moment around x axis (0 degree wind direction) of 18, 25, 14, 3 and 2 percent for model depth to width aspect ratio (See Fig. 1) of 1:1, 1:1.5, 1:2, 1.5:1 and 2:1, respectively. Similarly, the recession of the corner at 10 % result in reductions of base moment around y axis of 13, 16, 14, 18 and 10 percent for the above models, respectively.
a) b)
Fig. 14 Comparisons of based moments about X axis for: a) sharp shape and b) recession corner

a) b)
Fig. 15 Comparisons of based moments about Y axis for: a) sharp shape and b) recession corner
a) b)
Fig. 16 Comparisons of based torque for: a) sharp shape and b) recession corner
5. CONCLUSIONS Aerodynamic modifications of high-rise buildings for wind load and response reductions were studied. The high frequency force balance method in the wind tunnel based on base-bending-moment-based procedure was applied to test the sharp corner models and modification corner models by recession and chamfer. All results of mean wind force coefficients, spectra of aerodynamic base moments and torques, and standard deviation of fluctuating base moments and torques were compared for the wind directions of 10, 20, 30, 40, and 45 degrees. The results show that the corner modifications result in significant reductions of along wind and across wind loads and response. For examples, the recession of the corner at 10 % of building face lead to reductions of base moment around x axis (0 degree wind direction) of 18, 25, 14, 3 and 2 percent for model depth to width aspect ratio of 1:1, 1:1.5, 1:2, 1.5:1 and 2:1, respectively. Similarly, the recession of the corner at 10 % result in reductions of base

moment around y axis of 13, 16, 14, 18 and 10 percent for the above models, respectively. 6. ACKNOWLEDGMENTS This research was financially supported by the Higher Education Research Promotion and National Research University Project of Thailand, Office of the Higher Education Commission. 7. REFERENCES ASCE (1999), Wind Tunnel Studies of Buildings and Structures, ASCE Manual and
Reports on Engineering Practice No.67, American Society of Civil Engineering, Virginia.
ASCE Standard (2005), ASCE7-05: Minimum Design Loads for Buildings and Other Structures, American Society of Civil Engineers, New York.
Australian Standard (AS) (1989). SAA Loading code, part 2—Wind forces, AS1170.2-89, Sydney, Australia.
AIJ (2004), Recommendation for Loads on Buildings, Architectural Institute of Japan. DPT Standard (2007), DPT 1311-50: Wind Loading Calculation and Response of
Buildings, Department of Public Works and Town & Country Planning, Thailand (in Thai).
Gu, M., and Quan, Y. (2004) “Across-wind loads of typical tall buildings”. J. Wind Eng.
Ind. Aerodyn. Vol. 92, pp.1147-1165. Irwin, P. A., (2009) “Wind engineering challengers of the new generation of super-tall
buildings”. J. Wind Eng. Ind. Aerodyn. Vol. 97, pp.328-334. Kwon, D.K., Kijewski, T., and Kareem, A. (2008), “e-Analysis of High-Rise Buildings
Subjected to Wind Loads”, Journal of Structural Engineering, ASCE, Vol. 134, No. 7, pp. 1139-1153.
NBCC (2005), National Building Code of Canada issued by the Canadian Commission on Building and Fire Codes, National Research Council of Canada, Ottawa, Canada.
Simiu, E., and Scanlan, R. H. (1996). Wind effects on structures, 3rd Ed., Wiley, New York.
Zhou, Y., Kijewski, T., and Kareem, A. (2003), “Aerodynamic Loads on Tall Buildings: Interactive Database”, Journal of Structural Engineering, ASCE, Vol. 129, No. 3, pp. 394-404.