Embed Size (px)
Citation preview

Aerial Observation of Oil Pollution at Sea
Operational Guide
OPERATIONAL GUIDE
AERIAL OBSERVATION
OF OIL POLLUTION AT SEA
AERIAL OBSERVATION
OF OIL POLLUTION
AT SEA

Cover photo: Aerial reconnaissance during the Exxon Valdez oil spill (Alaska, 1989)Source: Cedre

3
AERIAL OBSERVATION
OF OIL POLLUTION
AT SEA
The information contained in this guide is the result of
Cedre’s research and experience.
Cedre cannot be held responsible for the consequences
resulting from the use of information contained in this
publication.
Published: July 2004 (French version) October 2006 (English translation)
Translated by Sally Ferguson.
This guide was written and produced by Cedre,
the Centre of Documentation, Research and
Experimentation on Accidental Water Pollution, as part
of its technical program, with financial support from
the French Navy, Total and the Ministry of Ecology and
Sustainable Development.
OPERATIONAL GUIDE

Aerial Observation of Oil Pollution at Sea
Operational Guide
4
An important component of Cedre’s work
involves designing operational guides which
present the results of studies, of experimental
work and experience feedback from accidents
which have occurred.
The original operational guide dedicated to
aerial observation, published only in French,
dated back to 1993. It therefore seemed
necessary both to our experts and our
partners (the French Navy, French Customs
and Total) to update this guide, in light of
the advances made in terms of practices and
knowledge in this field.
The French Navy Air Force and French
Customs (Aero-Maritime Surveillance Brigade)
share their knowledge at bi-annual training
courses organised by Cedre. Much of what is
presented in this guide is a result of the work
of these experienced observers. They will
recognise their contributions, for which we
are extremely grateful.
A number of important new points have
been added to this edition, in particular the
modelling of drift prediction (MOTHY model),
the use of satellite-tracked drifting buoys and
the Drift Prediction Committee, set up a few
days after the shipwreck of the Prestige by the
French General Secretariat for the Sea.
The first vocation of this operational guide is
to be present onboard all aircraft likely to be
involved in aerial observation of oil pollution
at sea. However it is also a useful tool in
pollution response centres and as a technical
support for public relations personnel.
Purpose of this Guide

5
Operational Organisation
AA
B
C
D
E
F
G
H
I
Different types of hydrocarbons
Evolution of oil at sea
Appearance of oil slicks
Oil spill observation
Guiding response operations
Pollution observation report
The mission
Drift of oil slicks
Other products and natural phenomena
Beforethe
mission
Pollutionreport
H
A
B
C
E
Duringthe
mission
D
G
ID
F
Aerial Observation of Oil Pollution at Sea
Operational Guide

6
PURPOSE OF THE GUIDE 4
OPERATIONAL ORGANISATION 5
CONTENTS 6
A THE MISSION 7
A.1 - The aims of reconnaissance flights 8
A.2 - Preparing the mission 9
A.3 - Flight profile 10
BI DIFFERENT TYPES OF HYDROCARBONS 12
B.1 - Oil and oil products 13
B.2 - Basic physical characteristics 14
C EVOLUTION OF OIL AT SEA 16
C.1 - The first few days 17
C.2 - Photographic imagery of the evolution of oil at sea 18
D APPEARANCE OF OIL SLICKS 19
D.1 - General overview 20
D.2 - Special cases 21
D.3 - Topography of oils slicks at sea 22
D.4 - Arrival of oil on the coast 24
E DRIFT OF OIL SLICKS 25
E.1 - Calculation of drift 26
E.2 - Information and data transmission 27
E.3 - Slick drift model 28
E.4 - Use of drifting buoys 30
F OIL SPILL OBSERVATION 32
F.1 - Observation criteria 33
F.2 - Bonn Agreement Oil Appearance Code 34
F.3 - Appearance at sea 36
F.4 - Observation on the coast 38
F.5 - Photographic and video imagery 39
F.6 - Remote sensing 41
G GUIDING RESPONSE OPERATIONS 43
G.1 - Guiding a pollution response vessel 44
G.2 - An example of guidance during the Prestige response 45
H RECONNAISSANCE REPORT 46
H.1 - Mapping pollution 47
H.2 - Estimating the quantity of pollutant 50
H.3 - Degree of coverage: reference plates 52
H.4 - POLREP 53
I OTHER PRODUCTS AND NATURAL PHENOMENA 54
GLOSSARY 58
BIBLIOGRAPHY AND USEFUL WEBSITES 60
Aerial Observation of Oil Pollution at Sea
Operational Guide

7
THE MISSION
The aims of reconnaissance flights A1
Preparing the mission A2
Flight profile A3
Aerial Observation of Oil Pollution at Sea
Operational Guide

8
First, it can be carried out routinely, to look for
and suppress operational pollution by ships. In
this case the aims are to:
• detect the pollution
• accurately locate and describe the pollu-
tion
• where possible, identify the polluter
in order to:
• assess the pollution (quantity and quality)
• anticipate the evolution of the situation
• prosecute the polluter via a pollution obser-
vation report
Secondly, aerial observation is used in the
event of an accident, to assist in recovery and
dispersion operations at sea. The aims of the
observation missions are to:
•locate the slicks
•accurately describe the slicks
•map the pollution
in order to:
•monitor the pollution
•adjust drift models
•guide response operations that day
•prepare the response operations for the
following days
A1
In the event of an accident, aerial observation is the only means of obtaining a clear, realis-
tic picture. It is the first link in a chain of important decisions.
Aerial observation can be used for two distinct purposes.
The Aims of Reconnaissance Flights
The Prestige, an example of a GIS prediction map providing the details of a pollution observation
Aerial Observation of Oil Pollution at Sea
Operational Guide

9
In all cases:
Prepare basic maps of the zone, on which the
pollution can be mapped and observations
noted during the flight. Clearly indicate on
these maps the orientation, coastline, geogra-
phical co-ordinates, scale...
In the case of an accident:
Gather as much information on the slick as
possible:
• nature of the pollutant: crude, refined, light
or heavy oil (its density, viscosity, pour point,
etc.). In the case of crude or light refined oil,
beware of the risk of explosion (see A3) and
make sure an explosimeter is available.
• type of accident (sinking, grounding, explo-
sion during operations ...).
• type of spillage (isolated event, continuous
flow, on surface, below surface).
• last slick observation (date, appearance,
location).
Gather all the necessary data on the local con-
ditions (weather since last observation, sea cur-
rents, sea state etc.).
In the absence of specific instructions from a
coordination centre, estimate the most pro-
bable location of the slick, by calculating its
probable drift (see E1), either from the place of
spillage or the last observed position.
Investigate the possibility that other areas, so
far unobserved, may be polluted. This should
be carried out taking the prevailing local cir-
cumstances into consideration, for example the
shipping route before the accident, a new leak
in the wreck, other pollutant contributions due
to slicks, previously having reached the shore,
breaking away and drifting... (see example at
foot of page).
Identify the zone to be covered by the mission
and establish a flight profile for maximum cove-
rage (see A3).
Forecast slick evolution according to the cha-
racteristics of the pollutant (estimate viscosity
at ambient temperatures, assess tendency to
form a reverse emulsion), or according to the
available observation data, and anticipate any
potential identification difficulties (e.g. low floa-
tability of the pollutant, fragmented slicks…)
Prepare and take onboard buoys which can be
detected by satellite.
Preparing the MissionA2
The example of the Erika
Before breaking in two, the Erika had already been leaking for many hours and the lost fuel oil arrived onshore without being observed at sea. This occurred due to a lack of specific research aimed at locating this loss, as it had not been reported by the ship’s master.
All missions must be prepared. The aim here is to try to predict what is
likely to be encountered, including the appearance, extent and location of
the slicks.
Aerial Observation of Oil Pollution at Sea
Operational Guide

Aerial Observation of Oil Pollution at Sea
Operational Guide
10
Flight ProfileA3
As hydrocarbons tend to spread in bands
parallel to the wind (see D3), the zone to be
investigated should be covered flying cross
wind, to increases the chances of detecting
any slicks (“staggered sighting”).
- Mist and dazzle reflected from the sea
surface often hamper visibility. Sometimes
the best way to fly will be governed by the
position of the sun.
- Flying altitude is determined by the size of
the slicks to be located, the visibility and
the sea state. It is important to ensure
maximum sweep while conserving a good
vision of all the details.
First of all, look for the most polluted zones
(thick patches or slicks, accumulation zones).
Out at sea, follow thin patches or stripes
(rainbow, sheen or metallic appearance) with
the wind, in order to detect any possible thick
patches leeward of the contaminated zone
(see D3).
If a new band of pollution or recent stripes
are sighted, follow them in order to deter-
mine the source of pollution. This source will
usually be located upwind, particularly if the
spillage point is fixed, but also upcurrent (see
D3).
A
B
Wind
direction
Estimated slick
drift
0 20 NM10
A: Last known slick position B: Probable current position of slick
NM: nautical miles
- The use of polarised sunglasses facilitates observation.
- As far as possible, observations made using non-specialised planes (e.g. maritime patrol) should be confi rmed by helicopter reconnaissance (which allows more precise observation), or by a plane fi tted with specialised remote sensing equipment (IR, SLAR, FLIR, UV or possibly microwave).

Aerial Observation of Oil Pollution at Sea
Operational Guide
11
In the event of a significant spill of light
crude oil or a light refined product, a (toxic or
explosive) gas cloud may form. In this case,
the approach and overflights of the site must
be carefully planned to avoid any possible risk
for the crew. For helicopter reconnaissance
missions, several recommendations should
be followed. The approach to the spill area
should be made cross wind or with the wind
at the tail, at an altitude of at least 50 metres,
to avoid entering the dangerous zone. The
helicopter crew should be equipped with
breathing masks, an explosimeter and optio-
nally a toximeter, to detect the presence of
toxic vapours in the air. A helicopter hovering
over an inflammable slick should not lower
to an altitude of less than 20 metres, or 30
metres in the case of a major spill of a highly
inflammable product (a light hydrocarbon).
Warning: If the action of the currents is stronger than that of the wind, the slick may move upwind.
Helicopter approaching an oil tanker in difficulties
When no in-depth assessment of the situation can be immediately
carried out, protect all responders, with protective clothing and
masks, within a radius of at least 200 m.
The values quoted are purely to give an indication.
Each case must be assessed individually.

Aerial Observation of Oil Pollution at Sea
Operational Guide
12
B
Different Types of Hydrocarbons
Oil and oil products B1
Basic physical characteristics B2

Aerial Observation of Oil Pollution at Sea
Operational Guide
13
Oil and Oil Products
Hydrocarbons are complex associations of dis-
tinct chemical components. Their appearance,
physical characteristics and behaviour depend
on their composition. Spillage of petroleum pro-
ducts at sea concerns mainly three types of pro-
ducts with very different behaviour.
Light refined products (petrol, white spi-
rit, kerosene, diesel oil, domestic fuel oil...).
These are colourless or only slightly coloured
products with high fluidity and are made up
of the lightest oil fractions.
Heavy refined products (HFO, IFO, ship
propulsion fuel, bilge discharge...). These pro-
ducts are black and often viscous, with no or
few light fractions.
Crude oils vary in colour from brown to
black. They have widely varying characte-
ristics, depending on their composition, in
particular on the proportion of light or heavy
fractions, resulting in their resemblance to
either light or heavy refined products. After
a certain length of time at sea, crude oils lose
their light fractions through weathering (see
C), resulting in similar characteristics and
behaviour to heavy refined products.
The emulsions formed by these products vary in colour from dark brown to orange.
B1
Table summarising the properties of hydrocarbons
Type of oil Persistance/Evaporation
Light refined products
e.g. petrol, diesel, kerosene
Low or no persistence
Rapid evaporation (in a few hours)
Natural dispersion
Products with viscosity < 2 000 cSt.
• Slightly weathered light and medium crude
• Slightly weathered light and intermediate fuel oils
Low persistence
High evaporation rate (around 40%
in 24 hours)
Products with viscosity > 2 000 cSt.
• Weathered light and medium crude oils
• Heavy crude oil
• Heavy fuel oil, operational residue
e.g. Bunker C, HFO, IFO 380.
Average persistence
Low evaporation rate (usually less
than 10%)
Paraffinic crude oils with a pour point higher than the water tempera-
ture.
High persistence
Solid or highly viscous liquid hydro-
carbons
Very low evaporation rate

14
A petroleum pollutant spilt at sea can be cha-
racterized by a certain number of physical para-
meters which inform those working on the site
about its behaviour and weathering at a given
point in its evolution. The principal physical cha-
racteristics are:
• Density
The density of hydrocarbons is usually below
1, which means that they float on water.
However, once spilt, and due to weathering
phenomena (evaporation and particularly
emulsification), the density increases pro-
gressively until values similar to those for sea
water are reached, which makes buoyancy
less probable in coastal and estuary areas.
• Viscosity
The initial viscosity of hydrocarbons varies
widely. Viscosity depends on temperature
(see graph on next page). When spilt the vis-
cosity of hydrocarbons progressively increases
up to very high values (e.g. 105cSt), due to
weathering phenomena (evaporation and
emulsification, see C), which alters the pollu-
tant’s behaviour on the sea surface (see D1).
• Pour point
The pour point of a petroleum product is the
temperature at which it stops flowing in labo-
ratory control conditions. This does not mean
that below this temperature the hydrocarbon
acts as a solid. The pour point is measured in
the laboratory, in a narrow test tube. When
spilled at sea, in an open area, hydrocarbons
remain liquid at temperatures below their
pour point.
Two other characteristics are important: the
flash point and the auto-ignition tempera-
ture. These factors are particularly important
in the case of refined products, for which a
thorough assessment of fire and explosion
risks is necessary.
• The toxicity of Volatile Organic Compounds
(VOC)
At a concentration of 900 ppm (0.09%) VOCs
lead to irritation of respiratory channels and
eyes after about an hour.
• Explosive range
The explosive range involves minimal values
of gaseous hydrocarbons in the atmosphere,
ranging from 2 to 11.5%.
Basic Physical Characteristics
B2
Aerial Observation of Oil Pollution at Sea
Operational Guide

15
DETERMINATION OF THE VISCOSITY OF A HYDROCARBON
ACCORDING TO TEMPERATURE
This diagram cannot be applied to highly emulsified hydrocarbons ("chocolate mousse"), nor to paraffinic hydrocarbons (pour point close to ambient temperatures).
Example of use of this diagram: the blue line shows that the viscosity at 8°C of a fuel which measures 50 cSt at 50°C is 800 cSt
LybiaDiesel (ASTM N°2)
Arabian light
Kuwait
Arabian light topped at 150°C
Fuel ASTM n°4
Kuwait
Fuel ASTM N°6
Boscan
0 7010 20 30 5040 608
Temperature (°C)
Viscosity (cSt)
2
3
4
4,5
30
5
8
10
20
405080
100
200
500
1 000
5 00010 000
20 000
50 000100 000
!
Heavy fuel oil (Erika)
Aerial Observation of Oil Pollution at Sea
Operational Guide

Aerial Observation of Oil Pollution at Sea
Operational Guide
16
Evolution of Oil at Sea
The first few days C1
Photographic imagery of the evolution of oil at sea C2
Over time, oil spilt at sea gradually changes in appearance and behaviour.
C
The natural weathering of hydrocarbons spilt in water
© C
edre
daysweeks
monthsyears
oxidation
water/oil emulsion
sedimentation
evaporation
biodegradation
dispersion
spreading

Aerial Observation of Oil Pollution at Sea
Operational Guide
17
Over the first few days, the oil spilt at sea under-
goes the following processes.
Spreading into a film which may be very thin
(a few microns). Thus a small quantity can
cover a very large surface area (1 km² for
1000 litres). However the spreading is irregu-
lar.
Evaporation of the lighter fractions. Crude
oils, condensates and refined products begin
to evaporate immediately after a spill, and
can continue to do so for a long time if the
meteorological conditions are favourable.
The rate of evaporation depends first on the
volatility of the various components of the
spill mixture but also on factors such as the
quantity spilt, the water and air temperature,
water turbulence, wind and rate of spreading
of the slick.
• When petrol at 20°C is spilled, approxima-
tely 50% evaporates in the 7 to 8 minutes
following the spill. Petrols, kerosene and
light fuel fractions (volatile compounds
with a boiling point of 200°C) disappear
almost completely after 24 hours at 20°C.
• The proportion lost through evaporation is
lower for heavy fuels. For domestic fuel oil
(DFO), 30 to 50% evaporates in a day.
• The heaviest fractions such as Bunker C
scarcely evaporate at all. Loss through
evaporation is estimated at a maximum of
10% of their weight.
Dispersion: The percentage of natural dis-
persion is essentially related to the nature
of the product and to the sea state. The
waves and turbulence of the sea surface
act on the slick and induce the formation
of oil droplets of varying sizes. The smaller
droplets stay in suspension in the water
column, the others either coalesce with
other droplets or spread into a thin layer.
Coalescence of droplets in suspension
is most prevalent when the sea is calm,
however in this case aerial observation is
made easier.
Emulsification occurs mainly with crude
oils or black refined products, after a few
days, or even a few hours if the sea is rou-
gh. The emulsion formed varies in colour
from dark brown to orange. This pheno-
menon increases the apparent volume of
pollutant, reduces spreading (by forming
thick patches) and eventually increases the
apparent density of the pollutant until it is
almost equal to that of seawater. It may
therefore remain below the surface, or
even sink, especially in coastal or estuary
areas, due to the presence of substances
in suspension and the reduced salinity.
The First Few Days
Warning: Chemicals with a high vapour pressure, such as petrol, are dangerous if inha-led and can explode or ignite (even with a low concentration in the air).
C1

18
Aerial Observation of Oil Pollution at Sea
Operational Guide
18
With weathering, brick red patches of reverse emulsion may form in the centre of thinner layers (rainbow, sheen or metallic) and thicker patches (2 to 8 days after the spill).
Over time, the slick fragments and the thickest patches are increasingly noti-ceable compared to the thin layers (rainbow, sheen or metallic), from a few hours to 1 day after the spill.
Subsequently, the films (rainbow, sheen or metallic) gradually disappear and eventually only patches or stripes of emul-sion may remain (a few days after the spill), especially in a rough sea. Iridescences can however reappear later, even several weeks or months after the spillage, if the sea is very calm and the sun is warming up the spill.
Recent spillage (a few hours old): the fresh pollutant spreads widely to form a film with scattered thicker patches
C2
Photographic Imagery of the Evolution of Oil at Sea
© C
edre
© C
edre
© B
SAM
, Dou
anes
fra
nçai
ses
© C
edre
© BSAM, Douanes françaises

Aerial Observation of Oil Pollution at Sea
Operational Guide
19
Appearance of Oil Slicks
D
General overview D1
Special cases D2 D2
Topography of oil slicks at sea D3
Arrival of oil on the coast D4
With a small angle of incidence, usually only sheen or a rainbow or metallic film is visible
© C
edre

Aerial Observation of Oil Pollution at Sea
Operational Guide
20
D1
Light refined products
� Spread rapidly over very large surface areas in
a fairly homogeneous, thin film.
� Substantial evaporation and natural disper-
sion causing disappearance in two or three
days, or even a few hours.
� Colourless or only slightly coloured products,
mainly visible with a small angle of incidence.
The slicks show up as shiny patches.
Heavy refined products or crude oil
� Irregular spreading, rapidly forming thick pat-
ches or stripes, which are black or dark brow-
ny black (or possibly greenish) surrounded by
a dark, unbroken thin film.
� Over time (and after the loss by evaporation
of the light fractions of the pollutant), the
tendency to spread increases. The patches
thicken and pile up (several millimetres thick),
turning brown/orangey brown, while the
unbroken film becomes thinner and even-
tually transforms into a rainbow or metallic
film. Within a few days, the thin layers even-
tually disappear altogether. However in calm,
sunny conditions iridescences may reappear.
� Thin, unbroken films are clearly visible with a
small angle of incidence (shiny patch) whe-
reas thick patches are best seen with a large
angle of incidence.
General Overview
Slick of light refined product rapidly spreading into a thin film
The colour of thick patches and stripes may vary
depending on the luminosity, the colour of the sky
and the observer’s position in relation to the sun.
© A
ssoc
iatio
n In
terv
entio
n
Crude oil slick (Nassia accident, Bosphorus, Turkey, 1994)
© C
edre
Crude oil slick (Gulf War, 1991)
© C
edre

Aerial Observation of Oil Pollution at Sea
Operational Guide
21
Special Cases
Oil treated with dispersant: the dispersed oil appears as an orange to light brown (or sometimes dark brown) cloud, just below
the surface of the water.
Congealed petroleum products at seawater
temperature (mainly concerns products con-
taining heavy paraffins): formation of thick
or lumpy patches possibly surrounded by thin
rainbow or metallic layers.
Product forming little or no reverse emul-sion, case of a light hydrocarbon (crude oil or refined product): only thin films remain, which gradually break up and disappear.
D2
Oily film in the process of becoming completely disper-sed
© C
edre
© C
edre
©
Ced
re
© C
edre
Oil treated with dispersant
Congealed paraffinic oil: close up, the patches can be seen to be made up of lumps.

Aerial Observation of Oil Pollution at Sea
Operational Guide
22
For fairly fresh slicks (several hours to a few
days old), the shape and thickness distribu-
tion (thick, medium, thin) depend mainly on
the wind.
The wind spreads and elongates the slicks,
eventually cutting them up into windrows
and then fragmenting them.
The thickest patches lie furthest downwind.
When the wind is very strong, the iridescent
zones (sheen - rainbow - metallic) tend to
disappear.
Topography of Oil Slicks at Sea
D3
Aerial Observation of Oil Pollution at Sea
Operational Guide

Aerial Observation of Oil Pollution at Sea
Operational Guide
23
For weathered slicks (several days old or
more), sheen and rainbow or metallic films
gradually disappear. Only very thick, highly
emulsified patches remain, barely floating on
the surface.
In the case of violent storms, even extensive
slicks may not be visible, but may reappear
when the conditions become calmer.
Breaking waves may also fragment these pat-
ches so that eventually they become scatte-
red lumps which are increasingly difficult to
observe.
The oldest slicks often become mixed with
floating debris.

24
Arrival of Oil on the Coast
1 Slicks or floating patches accumulate in
coastal areas open to the wind (coves, bays,
inlets...).
2 Pollutant is deposited in accumulation zones,
with the ebb and flow of the tides. The pol-
lutant usually forms stripes, fragmented to
varying degrees, along the high tide line.
3 The pollutant is often mixed with varying
quantities of floating debris and, in particular,
seaweed.
4 The pollutant may be carried away if the wind
or currents change direction.
D4
Small quantities of oil or fragmented slicks which arrive on the coast are difficult to identify from aircraft, especially in rocky areas.
1. Arrival of weathered emulsion on the coast, from the Erika’s cargo of heavy fuel oil (Le Croisic, Loire-Atlantique, France, December 1999)
2. Arrival of an emulsion of heavy fuel oil on the coast from the shipwreck of the oil tanker the Tanio (off the coast of Brittany, March 1980)
3.Arrival of an emulsion of fuel from the wreck of the Prestige on the coast, combined with seaweed (Galicia, November 2002)
4. Remobilisation of fuel from the Erika which was trapped in rocks in the Loire-Atlantique region: lumpy browny-red emulsion, containing debris (Le Pouliguen, France, September 2000)
© C
edre
© C
edre
©
Ced
re
© C
edre
Aerial Observation of Oil Pollution at Sea
Operational Guide

25
Drift of Oil Slicks
Calculation of drift E1
Information and data transmission E2
Slick drift modelling E3
Use of drifting buoys E4
E
Aerial Observation of Oil Pollution at Sea
Operational Guide

26
Aerial Observation of Oil Pollution at Sea
Operational Guide
Oil slicks drift on the water at 3 – 4% of the
wind speed and 100% of the speed of the
current. The actual route covered by a slick (or
"course made good") can be determined graphi-
cally by vectorial addition of the speed of the
current and 3 - 4% that of the wind, established
Slick movement and drift models: computer software exists for calculating the drift of oil slicks and
can be useful in preparing a mission. The MOTHY model, designed and run by Météo France in Tou-
louse, is the program used by Cedre (see E3).
Calculation of Drift
E1
Current Wind Drift
1st hour 1.5 knots at 340° 12 knots at 285°
2nd hour 1.5 knots at 60° 30 knots at 240
3rd hour 1 knot at 110° 25 knots at 190°
4th hour 1 knot at 190 20 knots at 25°
Calculation of drift over 4 hours The black arrows show the successive effects of the current (100%) and the wind (3%) on the slick each hour. The blue arrows show the resultant after 4 hours. The red arrow shows the overall resultant.

27
Aerial Observation of Oil Pollution at Sea
Operational Guide
27
Information and Data Transmission
It is important to:- computerise as much information as possible- use digital photographic equipment- prioritise real-time transmission of information by using the internet
In pollution management, many factors must be
taken into consideration, including aerial obser-
vation data (position of the pollution, remarks
about the observation, flight plans, photos,
remote sensing imagery…), drift prediction and
signals sent by buoys launched at sea (see E4).
This information is exchanged between respon-
ders by various means (fax, telephone, email,
internet). To optimise transmission and exploi-
tation of the data, computer-based methods
should be given priority (e.g. pollution reports in
an Excel document, the use of digital cameras or
a different system coupled with GPS). Transmis-
sion via the internet should eventually become
standard practice.
E2
Thanks to experience from the Erika disaster, as soon as the Prestige spill occurred, a committee of experts was appointed by the French General Secretariat for the Sea, in order to provide information about the drift of oils slicks for the responders. The Météo France – Cedre unit, set up the day after the accident, rapidly expanded to form a Drift Prediction Committee, led by Cedre, which included representatives from the Préfecture Maritime, Météo France, IFREMER and SHOM. The main aims of the committee were to:
- analyse the observation data (aerial, nautical and satellite observation) and transmit it to Météo France’s specialist in charge of MOTHY
- provide advice for future observation fl ights- update the location map daily and send it to the responders- propose study and experimentation programs which could help reinforce predictions
This committee was a valuable innovation in the fi eld of information and communication. It contributed to a marked improvement in the quality of predictions and facilitated the authorities’ decision-making process.
Gathering observation
data
National slick drift prediction committee: expertise unit
(data exploitation, modelling, prediction)
• French Navy• Cedre• Météo France• IFREMER• SHOM• ...
Distribution of maps and other documentation Prime Minister
SG Mer
Outside communication
Préfecture Maritime crisis management res-ponse centre
observation

Aerial Observation of Oil Pollution at Sea
Operational Guide
28
Slick Drift Modelling
E3
Météo France is responsible for surface drift
prediction modelling (for slicks, containers,
barrels...) for the French authorities (MOTHY
model).
The input for the MOTHY model is based on pollution
observation data (usually from aerial observation),
for which the appearance (degree of fragmentation,
floatability), the dimensions, the position and the time
have been recorded. The model must be regularly
updated by observation data. Buoys can be launched
on the slicks to help to locate the slick in relation to
predictions (see E4). The reliability of meteorological
data allows routine forecast for 3 to 4 days ahead and
drift backtracking for up to 3 days.
Example of slick drift calculated using the MOTHY model
51°45N
51°15N
51°30N
51°00N
1°30E 2°00E 2°30E 3°00E 3°30E
1°30E 2°00E 2°30E 3°00E 3°30E
51°15N
51°30N
51°00N
MOTHY/ARPEGE : Prévision pour le 27/01/02003 à 00 utc
Position initiale :le 23/01/2003 à 10h00 utcLatitude : 51°25,00’Longitude : 02°03,75’Polluant : MazoutMasse volumique : 960 kg/m3
Attention : document technique de prévision de dérive d’hydrocarbure, réalisé à partir d’un seul point choisi dans un ensemble complexe de nappes observées ou non.Caution : technical support for oil drift forecast from a single point out of a complex set of slicks observed or not.
51°45N

Aerial Observation of Oil Pollution at Sea
Operational Guide
29
In the event of a major pollution incident which
affects a vast sea area, drift model output, such
as the example on the previous page, is used to
design maps which draw together all the obser-
vation data for that day and the drift predictions
for the coming 3 days. The observations are
accompanied by indications of the overflight
zones of the different aircraft, showing which
areas have been explored and those which have
not. The maps are drawn up in relation to the
points which the Drift Prediction Committee con-
siders to be the most threatening for the coast.
Pollution from the Prestige: observation of pollution and slick drift prediction

Aerial Observation of Oil Pollution at Sea
Operational Guide
30
Use of Drifting Buoys
In the event of pollution, it is important to be
aware of the slicks’ drift patterns and to be able
to anticipate their movements, in order to guide
pollution response vessels at sea and to inform
the onshore response authorities as soon as the
pollutant threatens to arrive onshore. In addition
to aerial observation and satellite images, satel-
lite-tracked drifting buoys can be deployed.
Experience of past pollution incidents (e.g.
major incidents, illicit discharge, wrecks) has
shown that drifting buoys launched by aircraft
or by boat have a number of advantages.
• The drift can be followed from a distance
(useful when poor conditions prevent over-
flights and observation operations).
• If slicks disappear from view they are not
lost.
• The grounding location of small amounts of
pollution from illicit discharges can be identi-
fied.
• Information can be provided about the fate
of potential pollution from wrecks.
E4
The Prestige
Drogued satellite-tracked drifting buoys (submerged 15.50 m or more below the surface) were deployed
by SHOM (the Naval Hydrographic and Oceanographic Service) to measure the seasonal current,
known as the "Navidad" current, which was believed by some to be likely to pull the slicks along like a
river. The drifting buoys showed that the current was not developed and that the drift of the slicks was
mainly dictated by the wind.
Cedre provided surface drifting buoys for use by the French Navy, SASEMAR (the Spanish Maritime Res-
cue and Safety Association in charge of response at sea in Spain) and AZTI (the Basque Oceanographic
Foundation). These drifting buoys were tested by Cedre (a series of tests starting in 1996) and their drift
was almost identical to that of oil slicks. Some of these buoys were used in December 1999 during the
Erika pollution. It was in this way that the drift movements of the slicks in the Bay of Biscay could be
tracked in the medium term. A drifting buoy which was launched at the beginning of February 2003 off
the coast from the Arcachon Basin was found three months later at the tip of Brittany.
The Portuguese Oceanographic Institute and then SASEMAR, in collaboration with Cedre, also placed
surface drifting buoys above the wreck of the Prestige on a monthly basis, as of the 23 February 2003.
None of the buoys entered the Bay of Biscay in the following 12 months, highlighting the fact that the
risk was higher for the Portuguese and Moroccan coasts than the French coasts in the event of a leak
from the wreck of the Prestige.

Aerial Observation of Oil Pollution at Sea
Operational Guide
31
IESM-PTR buoys: independent, floating ARGOS buoys, which can be launched from aircraft
Cartography of tracking buoys drawn up by SHOM

Aerial Observation of Oil Pollution at Sea
Operational Guide
32
Oil Spill Observation
Observation criteria F1
Bonn Agreement Oil Appearance Code F2
Appearance at sea F3
Onshore observation F4
Photographic and video imagery F5
Remote sensing F6
F
Aerial Observation of Oil Pollution at Sea
Operational Guide
33
Observation Criteria
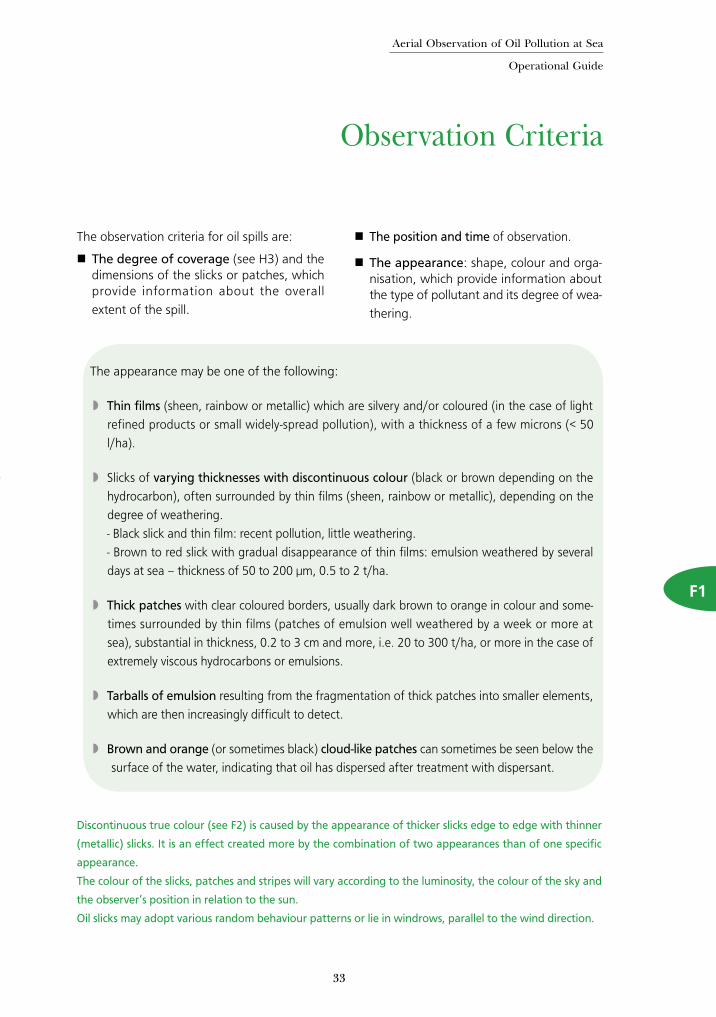
The observation criteria for oil spills are:
The degree of coverage (see H3) and the dimensions of the slicks or patches, which provide information about the overall
extent of the spill.
The position and time of observation.
The appearance: shape, colour and orga-nisation, which provide information about the type of pollutant and its degree of wea-
thering.
F1
Discontinuous true colour (see F2) is caused by the appearance of thicker slicks edge to edge with thinner
(metallic) slicks. It is an effect created more by the combination of two appearances than of one specific
appearance.
The colour of the slicks, patches and stripes will vary according to the luminosity, the colour of the sky and
the observer’s position in relation to the sun.
Oil slicks may adopt various random behaviour patterns or lie in windrows, parallel to the wind direction.
The appearance may be one of the following:
Thin films (sheen, rainbow or metallic) which are silvery and/or coloured (in the case of light
refined products or small widely-spread pollution), with a thickness of a few microns (< 50
l/ha).
Slicks of varying thicknesses with discontinuous colour (black or brown depending on the
hydrocarbon), often surrounded by thin films (sheen, rainbow or metallic), depending on the
degree of weathering.
- Black slick and thin film: recent pollution, little weathering.
- Brown to red slick with gradual disappearance of thin films: emulsion weathered by several
days at sea – thickness of 50 to 200 µm, 0.5 to 2 t/ha.
Thick patches with clear coloured borders, usually dark brown to orange in colour and some-
times surrounded by thin films (patches of emulsion well weathered by a week or more at
sea), substantial in thickness, 0.2 to 3 cm and more, i.e. 20 to 300 t/ha, or more in the case of
extremely viscous hydrocarbons or emulsions.
Tarballs of emulsion resulting from the fragmentation of thick patches into smaller elements,
which are then increasingly difficult to detect.
Brown and orange (or sometimes black) cloud-like patches can sometimes be seen below the
surface of the water, indicating that oil has dispersed after treatment with dispersant.

34
Bonn Agreement Oil Appearance Code
The Oil Appearance Code is the result of a scien-
tific program, aiming to determine the quantities
of hydrocarbon spilt using visual aerial observa-
tion. Recent studies carried out in conjunction
with the Bonn Agreement led to the adoption of
a new Appearance Code, to replace the former
Colour Code. This code should be used for prefe-
rence rather than the other existing codes such
as that of the Paris Memorandum of Understan-
ding.
Appearance
1. Sheen (silvery/grey)2. Rainbow3. Metallic4. Discontinuous True Colour5. Continuous True Colour
Layer Thickness
Interval (µm)
0.04 - 0.300.30 - 55 - 5050 - 200> 200
Litres per km2
40 - 300300 - 5 0005 000 - 50 00050 000 - 200 000> 200 000
This code allows thin layers to be characterised
and the extent of spills to be assessed.
F2
Code 3
Code 2
Code 1
© D
ouan
es f
ranç
aise
s
Aerial Observation of Oil Pollution at Sea
Operational Guide

35
The very thin films of oil reflect the incoming white light slightly more effectively than the surrounding water
and will therefore be observed as a silvery or grey sheen. The oil film is too thin for any actual colour to be
observed. All oils will appear the same if they are present in these extremely thin layers. Oil films below approxi-
mately 0.04-µm thickness are invisible. In poor viewing conditions even thicker films may not be observed.
Above a certain height or angle of view the observed film may disappear.
Rainbow oil appearance represents a range of colours: yellow, pink, purple, green, blue, red, copper and
orange. This is caused by an optical effect which is independent of the type of hydrocarbon involved. The
colours will range from pale to highly luminous according to the angle of view and the thickness of the layer.
Oil films with thicknesses near the wavelength of different coloured light, 0.2 µm – 1.5 µm, (blue 0.4 µm, red
0.7 µm) exhibit the most distinct rainbow effect. This effect will occur up to a layer thickness of 5 µm. Poor
light conditions can lead to reduced appearance of colours. A level layer of oil in the rainbow region will show
different colours through the slick because of the change in angle of view.
Code 2 - Rainbow (0.3 µm - 5 µm)
The appearance of the oil in this region cannot be described as a general colour, as it will depend on the type
of hydrocarbon as well as oil film thickness. Where a range of colours can be observed within a rainbow area,
metallic will appear as a quite homogeneous colour that can be blue, brown, purple or another colour. The
‘metallic’ appearance is the common factor and has been identified as a mirror effect, dependent on light and
sky conditions. For example blue can be observed in blue sky.
Code 3 - Metallic (5 µm - 50 µm)
For oil films thicker than 50 µm the true colour of the oil will gradually dominate the colour that is observed. Brown
oils will appear brown, black oils will appear black. The broken nature of the colour, due to thinner areas within
the slick, is described as discontinuous. This is caused by the spreading behaviour under the effects of wind and
current. ‘Discontinuous’ should not be mistaken for ‘coverage’. Discontinuous implies colour variations and not
non-polluted areas.
Code 4 - Discontinuous true colours (50 µm - 200
The true colour of the specific oil is the dominant effect in this category. A more homogenous colour can be obser-
ved with no discontinuity as described in code 4. This category is strongly oil type dependent and colours may be
more diffuse in overcast conditions.
Code 5 - Continuous true colours (> 200 µm)
Source: Bonn Agreement Aerial Surveillance Handbook (www.bonnagreement.org)
Code 1 - Sheen (< 0.3 µm)
Aerial Observation of Oil Pollution at Sea
Operational Guide

Aerial Observation of Oil Pollution at Sea
Operational Guide
36
Appearance at Sea
Sheen - rainbow Fresh slick spread widely into a thin film
As the slick weathers, thicker zones appear (downwind of the slick)
First thick patches of emulsion begin to appear After a few days, the thin layers have been dispersed and only the patches of emulsion remain
F3
© Douanes françaises © C
edre
© C
edre
© C
edre
©
Ced
re
Wind
Wind
© C
edre

Aerial Observation of Oil Pollution at Sea
Operational Guide
37
The patches of emulsion fragment and form small tarballs which are only visible close up
The wind slices the slicks into windrows. If the wind is strong, iridescences may disappear.
Weathered emulsion arranged in parallel stripes by the wind
Partly dispersed oil slick
© C
edre
© C
edre
© A
ssoc
iatio
n In
terv
entio
n©
AZT
I
© C
edre
©
Ass
ocia
tion
Inte
rven
tion

Aerial Observation of Oil Pollution at Sea
Operational Guide
38
For onshore observation procedures, refer to the
guide entitled "Surveying Sites Polluted by Oil"
(Cedre 2006).
It is important to:
• specify the surface area of accumulations
• indicate whether the pollution is floating or
has settled (observe attenuation of the hei-
ght and breaking of waves to get an idea of
the thickness of the pollutant, which may be
as much as several centimetres)
• describe the morphological characteristics of
the type of coast affected, a factor which will
determine the response techniques.
Onshore Observation
F4
Arrival of an emulsion of weathered fuel oil on the coast, from the oil tanker the Prestige, Galicia, 2002
© C
edre
© C
edre

Aerial Observation of Oil Pollution at Sea
Operational Guide
39
In certain countries, photographic and video
imagery acts as evidence for the repression of
illicit discharge. Ideally, all the necessary infor-
mation can be provided in three complementary
shots:
• a detailed shot of the slick, taken almost verti-
cally, from an altitude of less than 300 metres
with the sun at the photographer’s back
• an overall, long range shot of the ship and
the slick, showing that the oil came from the
ship in question
• a detailed shot of the ship for identification
purposes (colour of the hull and of funnels,
name…).
In practice, a series of photos should be taken,
showing the ship and her polluted wake, the
extent of the wake (without discontinuity), the
name of the ship, and finally the surroundings
(in particular, if possible, other ships with "clean"
wakes for comparison) to clearly show that it is
the ship in question that is responsible for the
pollution. A shot showing where the discharge
seems to have originated can also be added,
even if this could potentially lead to confusion.
Whatever the case may be, do not claim defi-
nitively that it is the discharged pollutant that
is visible in the photograph. It is important to
remember that ships can also discharge non-pol-
lutant liquids (e.g. cooling water).
For preference, a polarising filter should be used,
which allows more selective visualisation of thin
films and thick layers than the naked eye. If the
aircraft is equipped with remote sensing equip-
ment, include SLAR and infrared imagery.
Photographic and Video Imagery
F5
Photo of ship: her characteristics can begin to be dis-tinguished at this distance
Photo of ship and her wake: the surrounding area is clean
Circle: close-up of a wake
Note - The above photos are given as an
example of possible shots. They concern three
different cases and do not allow identification
of the vessels in question.
© A
ssoc
iatio
n In
terv
entio
n
© B
SAM
- D
ouan
es f
ranç
aise
s
© BSAM - Douanes françaises

Aerial Observation of Oil Pollution at Sea
Operational Guide
40
FILM PHOTOGRAPHY
Camera: Single lens reflex, manual or shutter
speed priority
Lens: 28 mm, 35 mm, 50 mm, 55 mm. Focus
set to infinity.
Accessories: motor (if the reflex camera is not
fitted with a motor drive system), lens hood,
filters (skylight, polarising, anti-UV).
Film: from 200 to 400 ISO, or even 800 ISO
(ideal for foggy or overcast conditions, the qua-
lity remains good and retains a fine grain).
Shutter speed: from 1/500° to 1/2000° (highest
possible shutter speed to avoid blurring).
Aperture: from f/8 to f/16 for a maximum
depth of field.
DIGITAL PHOTOGRAPHY
In order to obtain images of a similar quality to
silver film, cameras able to capture at least 5
million pixels are required (professional quality).
However 3 million pixels can provide acceptable
photography if taken in 17.34 cm × 13 cm for-
mat (2,048 x 1,536 pixels), with a resolution of
300 DPI.
The real limitations concern the delay between
the pressing the shutter-release and when the
photo is actually taken, as well as the recovery
time between two shots. In the first case, if the
delay is one second, the aircraft will already have
travelled some 50 metres. Professional cameras
have short, if not negligible, delays.
HELPFUL HINTS
•Do not lean against the inner wall of the air-
craft, or lean the camera against the cabin
window (to avoid vibrations).
•Place the camera very close to the window
(about 1 cm away) and parallel to its surface
to avoid any reflections.
•Pay attention to the position in relation to
the sun, as well as the colours of the sea and
sky which may be difficult to distinguish.
•If possible, take photographs around
midday (solar time), avoid dawn and dusk
(when the light may affect the colours).
•Take the tides into account for photographs
of the coast.
•For best results fly at low altitude.
AERIAL PHOTOGRAPHY: TECHNICAL SPECIFICATIONS

41
Aerial Observation of Oil Pollution at Sea
Operational Guide
41
F6
Remote Sensing
Remote sensing is a possible complementary
method of observation, in addition to observa-
tion by the human eye. A number of different
sensing systems are able to detect and map the
presence of hydrocarbons on the sea surface in
certain conditions.
This observation method has the following
advantages over visual observation:
• detection can be carried out from a distance
(SLAR: 15 to 20 nautical miles on each side)
• slicks can be accurately plotted on charts/
maps
• imagery from sensors can be recorded
• visualisation is possible outside of the visible
spectrum.
In the case of aerial surveillance missions at sea
for illicit discharge, this technique also allows
nocturnal surveillance. If a very low light level
camera is available, it is possible to read the
name of the vessel at night, in good weather
conditions. If no colour photos are available,
the report must include an SLAR image, infrared
thermography of the wake and a photo showing
the name of the vessel. This type of evidence
implies that lawyers and judges must be spe-
cially trained.
Active sensors transmit a signal and receive
another signal in return. Passive sensors do not
transmit a signal but simply use the signal trans-
mitted by the sea surface.
Infrared image of a vessel illicitly discharging oil
© B
SAM
- D
ouan
es f
ranç
aise
s

42
Aerial Observation of Oil Pollution at Sea
Operational Guide
Remote sensing system
Active/Passive
Sensing means Range Layer thickness interval detected
Limitations
Side-Looking Airborne Ra-dar (SLAR)
Active Detects dampen-ing by wind and oil of capillary waves generated by the wind.
During reconnaissance flights (from 1,500 to 4,000 feet), SLAR can detect oil 15 to 20 NM away, on either side of the plane, except ina "blind spot" directly under the plane, which is equal in width to the altitude of the plane. This gap can be covered by an infrared scanner.
Over 3 to 5 µm (to produce a dampening ef-fect on capillary waves)
Penetrates the cloud layer. If the sea is too calm (0 to 1 on the Beaufort scale), the waves created by the wind are not high enough. On the other hand, if the sea is too rough (over 7 or 8 on the Beaufort scale), the oil layer will not dampen the capillary waves. The results must always be confirmed by visual observation and/or IR-UV scanning.
Infrared Line Scanner(IR)
Passive Detects thermal radiation with a wavelength in the band of 8 to 12 µm.
Zone scanned is equal to twice the altitude of the plane. Compensates for the "blind spot" of the SLAR. In practice, scanning should be carried out at 1,500 feet and 160 knots, allowing a width of approximately1,000 m.
Over 10 µm. Slicks appear black or white on the screen de-pending on their thickness and temperature.
Thickness of slicks
Ultra Violet Line Scanner (UV)
Passive Detects the ultraviolet com-ponent of light from the sun reflected by oily liquids.
Zone scanned is equal to twice the altitude of the plane. Com-pensates for the SLAR "blind spot". In practice, scanning should be carried out at 1,500 feet and 160 knots, allowing a width of approximately1,000 m.
From 1 µm Cannot distinguish between different thicknes-ses.
Microwave Radiometer
Passive Similar to IR Line Scanner. Has the advantage of being able to measure the thic-kness, and there-fore volume, of slicks detected.
From 100 µm Calibration necessary to determine volumes. For thick slicks and emulsions, the surface area of the slick can be calculated, but the thickness must be determi-ned using other methods, such as by ships involved in response operations.
Forward-Loo-king Infrared Scanner (FLIR)
Passive Detects thermal radiation with a wavelength in the band of 8 to 12 µm.
Depends on the altitude of the plane and the field of view selected by the operator, as well as the hygrometry.
From code 2 or 3 FLIR detects zones of different temperatures, but cannot be used as a principal pollution research sensor. FLIR recordings can be used as a complementary method in addition to visual observation.

43
Aerial Observation of Oil Pollution at Sea
Operational Guide
Guiding Response Operations
G
Guiding a pollution response vessel G1
An example of guidance during the Prestige response G2

Aerial Observation of Oil Pollution at Sea
Operational Guide
As the vessels cannot easily detect pollution on
the water surface, they have to be guided in
order to be effective in treating and recovering
the pollutant.
The best method involves providing detailed
(map-based) descriptions of the pollution in the
zone where the vessel or fleet are to operate.
This means that it is not necessary to have a gui-
dance aircraft permanently in operation.
Basic guidance involves directing the vessel to
the thickest parts of the slicks by indicating the
azimuth angle/distance.
E.g. A slick 20 m wide by 200 m long is situated
30° right at 200 m.
The plane or preferably helicopter, in the
area, must inform the vessels of the location
and shapes of the slicks, indicating the thick
zones (or patches) on which pollution respon-
se operations should focus.
Guidance can be carried out directly via indi-
cations transmitted by radio.
When flying time in the area is limited, it is
preferable to transmit to the vessel an exact
description of the slick(s) and their position.
Guidance can be improved by indicating the
position of marker buoys or smoke floats in
relation to the slick.
Guiding a Pollution Response Vessel
G1
French Customs performing aerial guidance to direct the French response vessel the Ailette (pollution from the Prestige, Galicia, 2002)
44
© B
SAM
- D
ouan
es f
ranç
aise
s

Aerial Observation of Oil Pollution at Sea
Operational Guide
The Spanish Basque fishermen were very
involved in the operations at sea to recover the
fuel oil from the oil tanker the Prestige. Their
efforts came in addition to the pollution respon-
se vessels, when the pollution had become too
geographically
dispersed for
these opera -
tions to be effi-
cient enough.
T h e f i s h i n g
b o a t s th e re -
fore had to be
guided to the
accumulations
of fuel as soon
as they were
spotted.
A plane belon-
g i n g to t h e
regional autho-
rities conducted flights over the zone, flying
perpendicular to the coast. As soon as the plane
was close enough to land, the positions of the
slicks (taken using GPS) and estimations of their
surface area or their volume were transmitted to
AZTI, the Basque Oceanographic Foundation, by
mobile phone. A database, developed by AZTI,
was used to reference all the vessels involved in
response operations, the coordinates of their
positions, and the number of people onboard
(real-time transmission of information by satellite
radio).
The AZTI operator was then able to determine
which vessels
were closest
to the identi-
fied slick and
whether or
not the vessel
had enough
space to store
the pollution.
H e t h e n
i n f o r m e d
them of the
positions of
the slicks by
VHF (almost
r e a l - t i m e
transmission).
These boats then recovered the pollution and
once the recovery was completed the skipper of
each boat contacted the AZTI response centre by
VHF to inform them of the tonnage recovered.
The vessel then continued on to another slick or
headed into the harbour. This system was set up
very rapidly, thanks to the routine cooperation
of the Basque fishermen and of AZTI during the
fishing season.
GUIDING SPANISH BASQUE FISHING BOATS
An Example of Guidance during the Prestige Response
G2
Basque fishing boat involved in response operations for the Prestige pollution.
45
© A
ZTI

Aerial Observation of Oil Pollution at Sea
Operational Guide
Reconnaissance Report
Mapping pollution H1
Estimating the quantity of pollutant H2
Degree of coverage: reference plates H3
POLREP H2 H4
H
46

Aerial Observation of Oil Pollution at Sea
Operational Guide
All the observations made during a reconnais-
sance mission must be recorded on one or
several map(s). This operation should be carried
out carefully, either during the flight or afte-
rwards, depending on what is possible for each
case. Mapping should be standardised so that
the various observations made during a series
of flights can be easily interpreted. Particular
attention should be paid to marking the most
polluted zones (thick patches or slicks, pollutant
accumulation zones), so that the extent of pol-
lution can be estimated (see H2) and response
operations directed.
The method proposed in this chapter is directly
derived from the internationally adopted method
for observing icebergs in the polar areas.
Mapping Pollution
Map Identification
In a corner of the map, the following should be
recorded:
1 The date and times of the flight
2 The zone overflown
3 The map number (where several maps are
produced during the flight)
4 The name of the observer and of the organi-
sation to which he belongs
5 The type of aircraft used
6 The meteorological conditions: cloud cover,
colour of the sky and the sea, the sea state.
H1
47
Observation Log
On a basic map prepared prior to the mission (see
A2), the contours of each polluted zone observed
should be marked with a continuous line, giving
indications on the nature of the slick for each
zone according to the criteria explained on the
following page (use the given abbreviations). The
plane’s route should be marked with a dotted
line.
This log will contribute to the report to be comple-
ted at the end of the mission. Notes taken during
the flight can be adapted to the circumstances
and the practices of the observer.

Aerial Observation of Oil Pollution at Sea
Operational Guide
Slick Dimensions
The average dimensions for patches of emulsion
(or potentially for slicks of fresh oil) are expressed
in metres.
The information about the slick is reported as a
list in the following order:
• Type and arrangement
• Coverage
• Dimensions
Example of notation: pollution in the form of
rainbow stripes, covering 40% of the sea surface,
combined with patches covering 3% of the sea
surface, average size of the patches: 10 m.
• ptc + code 2 //
• 40% code 3 – 3% ptc
• 10 metres
For clarity, these indications can be recorded on
the edge of the map, taking care to show, using
arrows, to which point on the map they refer.
If the same description applies to several dif-
ferent zones, the descriptive criteria should be
recorded in a corner of the map with an identi-
fication by letter, and this letter noted in each of
the zones concerned (for an example, see map,
next page).
When a slick spreads beyond the horizon, the
limit of visibility should be shown using a dotted
line.
48
Degree of coverage
The degree of coverage is indicated as a percenta-
ge, in connection with the reference plates (H3). If
coverage is by thick patches and thin layers (sheen,
rainbow, metallic), if possible, specify their respec-
tive coverage (e.g. 5% pat – 30% code 3).
Description of the pollution
Colour/appearance (see F2)1 Sheen 2 Rainbow 3 Metallic 4 Discontinuous true colour5 Continuous true colour
For 4 and 5, indicate colour:Black Brown Orange
Type• Slick (Ø or L > 30 m) • Patch (5 cm < Ø ou L < 30 m)• Patty (10 cm < Ø 50 cm) • Tarball (Ø indiscernable)
State of pollutant• Fresh oil • Dispersed oil • Emulsion
Arrangement•Random•Parallel stripes
Debris
Abreviation
code 1 code 2code 3code 4code 5
blbror
slptcptttb
fodispemul
• //
deb

Aerial Observation of Oil Pollution at Sea
Operational Guide
Other indications
Show the route followed using dashes and crosses
e.g.
Show the parts of the coast affected
e.g.
Also give the points at which the oil surfaces (in the case
of a pipeline leak or a sunken wreck)
e.g.
Various remarks and observations may be noted on the
edge of the map or on an attached sheet, making sure
that the place they refer to is clearly identified on the
map by a letter at the appropriate point
e.g.
J = polluted pebbles at the top of beach
- + - + - + - J
49
Example of a summarising map using the above mentioned abreviations

Aerial Observation of Oil Pollution at Sea
Operational Guide
Estimation at Sea
Surface
Only thick patches should be considered and
accumulations which represent the main part
of the volume of the slick, excluding irides-
cent zones (thin layers).
The surface area is obtained by multiplying
the overall surface area of each zone by its
degree of coverage (thick patches).
Thickness
For a major oil spill, as a first estimation and
in the absence of indications to the contrary,
take the lower value of the appearance code
bracket for the pollution observed.
� Calculation of the quantity of pollutant
The surface area of a slick or an accumulation
of oil droplets can be calculated directly using
an onboard GPS system.
Estimating the Quantity of Pollutant
H2
N° 1 (sheen) 0.04 / 0.3 µmN° 2 (rainbow) 0.3 / 5.0 µm
N° 3 (metallic) 5.0 / 50 µmN° 5 (continuous true colour) over 200 µm
L
l
Minimum estimation Maximum estimation
N° 1 19 x 70% x 0.04 = 0.532 m3 x 0.3 = 3.99 m3
N° 2 19 x 24% x 0.3 = 1.368 m3 x 5.0 = 22.8 m3
N° 3 19 x 5% x 5.0 = 4.750 m3 x 50 = 47.5 m3
N° 5 19 x 1% x 200 = 38 m3 38 m3
TOTAL 44.65 m3 TOTAL 112.29 m3
50
Although estimating the quantity of pollutant is no easy task, it is nevertheless a necessary one. Estimations are made using maps, taking into consideration the pollu-ted surface and the thickness of the slicks.
Example of estimation using the Bonn Agreement Oil Appearance Code
As the thickness may be considerable and cannot be determined by plane, the minimum thickness should be taken.
L = 12 km / l = 2 km
Total surface area = 24 km2
Coverage = 80%
Surface area covered: 24 x 80% = 19.20 km2

Aerial Observation of Oil Pollution at Sea
Operational Guide
Evaluation based on aerial observations can only provide an order of magnitude. Uncertainties
about the true thickness of slicks can lead to estimations of volume that vary up to a factor of
ten. Nevertheless, minimal estimations should be considered a reliable source of information in
determining the minimum quantity that was spilt in reality.
Onshore estimation
Although the surface area of pollution can be
estimated fairly quickly (stretch of the coastline
affected multiplied by width of the zone cove-
red), the thickness varies widely (from a few
millimetres to several decimetres).
Moreover, on the coast, the risk of error and
confusion is increased by the presence of other
factors such as debris, seaweed, etc. (see D4).
For greater accuracy, the assessment of coastal
pollution requires on-land reconnaissance.
51
Arrival of an emulsion of heavy fuel on the coast from the oil tanker the Erika (Le Pouliguen, Loire-Atlantique, France, December 1999)
Other examples of estimations on different shapes of slicks (Designed by J-P Castanier, French Customs. Calculation method by Alun Lewis, Consultant)

Aerial Observation of Oil Pollution at Sea
Operational Guide
H3
Degree of Coverage: Reference Plates
See Appearance Code (F2).
1%
5%
20%
52

53
Aerial Observation of Oil Pollution at Sea
Operational Guide
POLREP
INITIAL POLREP-SIGNAL MESSAGE FORMAT
Addressee for action: relevant MRCC.
Addressee for information: relevant authori-
ties
Title/subject: POLREP
A – Classification of report:
Doubtful – probable – confirmed
B – Date and time pollution observed/
reported
C – Position and extent of pollution
If possible, state range and bearing of some
prominent land mark or Decca position, and
estimated amount of pollution (i.e. size of pol-
luted area, number of tons spilled, or number
of containers, drums lost). Where appropriate,
give position of observer relative to pollution.
D – Tide, wind speed and direction
E – Meteorological conditions and sea state
F – Characteristics of pollution
Give type of pollution, e.g. oil (crude or othe-
rwise), packaged or bulk chemicals, sewage. For
chemicals give proper name or United Nations
number if known. For all, give also appearance,
e.g. liquid, floating solid, liquid oil, semi-liquid
sludge, tarry lumps, weathered oil, discolou-
ration of sea, visible vapour. Any markings on
drums, containers etc. should be given.
G – Source and cause of pollution
E.g. from vessel or other undertaking. If from
vessel, say whether as a result of a deliberate
discharge or a casualty. If the latter, give brief
description. Where possible, give name, type,
size, nationality and port of registry of polluting
vessel. If vessel is proceeding on its way, give
course, speed and destination.
H – Details of vessels in the area
To be given if the polluter cannot be identified,
and the spill is considered to be of recent ori-
gin.
I – Whether photographs have been taken,
and/or samples for analysis.
J – Remedial action taken or intended, to deal
with the spillage.
K – Forecast of likely effect of pollution
(eg arrival on beach) with estimated timing.
L – Names of other States and organisations
informed.
M – Any other relevant information (eg names
of other witnesses, reference to other instan-
ces of pollution pointing to source).
H4
Source: UK Ministry of Defence Acquisition Management System.

54
Aerial Observation of Oil Pollution at Sea
Operational Guide
I
Images of various chemicals and food products spilled at sea can be confused with images of oils slicks.
It is therefore useful to have a number of reference images to avoid interpretation errors. Vegetable oil
and certain chemicals also show up on remote sensing equipment.
Styrene slick observed by a French Customs plane (Ievoli Sun accident, Les Casquets, France, October 2000)
Emulsion of palm oil in the form of whi-te patches (Allegra accident, Western Channel, October 1997)
© D
ouan
es f
ranç
aise
s
© Cedre
Other Products
Palmor I experimentation: soya bean oil slick
Palmor I experimentation: castor oil slick
Palmor I experimentation: from left to right, soya bean oil, fuel oil, palm oil
© D
ouan
es f
ranç
aise
s
© D
ouan
es f
ranç
aise
s
© D
ouan
es f
ranç
aise
s

Aerial Observation of Oil Pollution at Sea
Operational Guide
Various floating objects and other phenomena
can be mistaken for oil slicks. For instance, the
following have already given rise to confusion:
Shadows of clouds making darker zones on
the surface of the water.
� When the sea is relatively calm, surface cur-rents or convergence of cold and warm water can, with a small angle of incidence, give the appearance of a film (sheen, rainbow, metal-lic).
�Muddy water at river mouths, in bays or simply near to the coast, can catch the eye because of their beige appearance in com-parison to the surrounding water (coloured water without any sign of a film – sheen/rainbow/metallic – on the surface cannot be an oil slick).
�Floating algae or phytoplankton blooms or pollen stripes may look like coloured slicks.
Shoals which look like dark slicks.
Calm areas.
IF IN ANY DOUBT, OBSERVE THE AREA FROM
A CLOSER DISTANCE TO CONFIRM OR DIS-
MISS THE PRESENCE OF OIL.
For observation by helicopter, check for the pre-
sence of an oil slick when in doubt by hovering
low. If the sighting is in fact an oil slick, the
turbulence made by the rotor will make it drift
away.
Wherever possible, observations carried out by
plane should be ultimately confirmed by helicop-
ter reconnaissance (allowing closer observation),
or by a plane fitted with special remote sensing
equipment (IR, SLAR, FLIR...). If still in doubt,
samples can be taken to remove all uncertainty,
if the weather conditions and techniques availa-
ble allow it. In this case, samples should be
taken as quickly as possible and exclusively from
the slick observed. The aim is to prove that the
substance spilt at sea is indeed a hydrocarbon. It
is, however, difficult to take samples at sea from
an aircraft. Studies are currently being carried
out on the subject, in particular in Sweden (see
below).
Natural Phenomena
55
Sampling Buoys
The Swedish Coast Guard recently designed sampling buoys which can be launched directly from an
aircraft onto a slick. They contain a piece of teflon material, which can absorb hydrocarbons for sub-
sequent analysis. The buoys can be identified by a light and a radio signal. So far, only one case has
been taken to court in which samples taken by sampling buoys played a decisive role in obtaining a
guilty verdict. The crew denied having discharged hydrocarbons.
For example photos see following page.

Aerial Observation of Oil Pollution at Sea
Operational Guide
Slick-like effect made by the shadows of clouds Surface effect due to the presence of two water masses having different temperatures
Muddy water near the coast. Silt from the seabed becomes suspended in the water due to the move-ment of the propellers.
Peat on the water surface
Seaweed near the coastClumps of seaweed drifting at sea (long shot and close-up)
56
© D
BSA
M -
Dou
anes
fra
nçai
ses
© C
edre
© C
edre
© C
edre
© C
edre
© D
ouan
es f
ranç
aise
s
©
Douanes françaises

Aerial Observation of Oil Pollution at Sea
Operational Guide
Slick-like effects due to the presence of sand banks, seaweed, coral reefs etc.
Coloured stripes due to the development of phytoplankton (observation made from a hovering helicopter, note the effect of the wind made by the rotor which shows that in this case it is not an oil slick)
Calm patches can be confused with a thin film of oil
57
© M
arin
e na
tiona
le©
Dou
anes
fra
nçai
ses
© D
ouan
es f
ranç
aise
s
© M
arin
e na
tiona
le©
ITO
PF
© C
edre
© C
edre
© C
edre

58
Aerial Observation of Oil Pollution at Sea
Operational Guide
Auto-ignition temperature
Minimum temperature at which vapours spontaneously igniteSpanish Basque
AZTI Oceanographic Foundation, involved in the social and economic development of several aspects of the fishing and food industry, as well as the protection of the marine environment and fishing resources.
Cedre Centre of Documentation, Research and Experimentation on Accidental Water Pollution
Density Quotient of the volumic mass of a substance and the volumic mass of water for a liquid or of air for a gas.
Dispersant Product containing a solvent, used to condition active matter and to diffuse it in the water. A mixture of surfactants ensures the dispersal of oil into small droplets in the marine environment.
Dispersion Formation of oil droplets of varying sizes, due to wave action and turbulence on the sea surface. These droplets either stay in suspension in the water column, or resurface to form another slick. This natural process can be encouraged by the use of dispersants, depending on the viscosity of the product and on whether the geographical and bathymetric situation makes their use possible.
Emulsification Emulsification refers to the formation of a "water-in-oil" reverse emulsion. This emulsion may be made up of a large proportion of water (often 60%, can be up to 80%). It varies in colour from brown to orange and is often referred to as "chocolate mousse", which gives an indication of its consistency.
Evaporation Transformation of a liquid into a vapour via its free surface, at a particular temperature. The rate of evaporation of oil depends mainly on the proportion of volatile products and the combination of hydrocarbons, as well as other factors such as the wind speed, the water and air temperature, the roughness of the sea surface and extent of spreading. The lightest fractions evaporate first, and the least volatile fractions form a residue, with a higher density and viscosity than the original product.
Explosimeter Appliance used to measure the concentration of inflammable gas in the atmosphere.
Flash point Lowest temperature at which the concentration of vapours emitted is high enough to produce a flash when in contact with a flame, a spark or a hot spot, but too low to produce combustion in the absence of a pilot flame. A substance with a flash point of less than 0°C is described as extremely inflammable, between 0 and 21°C easily inflammable, and between 21 and 55°C inflammable.
FLIR Forward-Looking Infrared. Infrared sensor used for remote sensing of oil slicks. In optimal atmospheric conditions, it can detect a slick approximately 20 nautical miles from the aircraft when flying at 3,500 feet. It can detect Bonn Agreement code 2 (rainbow) slicks, and has no upper thickness limit. It can also be used to read the name of a vessel at night.
GIS Geographical Information System
GPS Global Positioning System
Ifremer French Research Institute for Exploitation of the Sea
GLOSSARY

59
Aerial Observation of Oil Pollution at Sea
Operational Guide
Auto-ignition temperature
Minimum temperature at which vapours spontaneously igniteSpanish Basque
AZTI Oceanographic Foundation, involved in the social and economic development of several aspects of the fishing and food industry, as well as the protection of the marine environment and fishing resources.
Cedre Centre of Documentation, Research and Experimentation on Accidental Water Pollution
Density Quotient of the volumic mass of a substance and the volumic mass of water for a liquid or of air for a gas.
Dispersant Product containing a solvent, used to condition active matter and to diffuse it in the water. A mixture of surfactants ensures the dispersal of oil into small droplets in the marine environment.
Dispersion Formation of oil droplets of varying sizes, due to wave action and turbulence on the sea surface. These droplets either stay in suspension in the water column, or resurface to form another slick. This natural process can be encouraged by the use of dispersants, depending on the viscosity of the product and on whether the geographical and bathymetric situation makes their use possible.
Emulsification Emulsification refers to the formation of a "water-in-oil" reverse emulsion. This emulsion may be made up of a large proportion of water (often 60%, can be up to 80%). It varies in colour from brown to orange and is often referred to as "chocolate mousse", which gives an indication of its consistency.
Evaporation Transformation of a liquid into a vapour via its free surface, at a particular temperature. The rate of evaporation of oil depends mainly on the proportion of volatile products and the combination of hydrocarbons, as well as other factors such as the wind speed, the water and air temperature, the roughness of the sea surface and extent of spreading. The lightest fractions evaporate first, and the least volatile fractions form a residue, with a higher density and viscosity than the original product.
Explosimeter Appliance used to measure the concentration of inflammable gas in the atmosphere.
Flash point Lowest temperature at which the concentration of vapours emitted is high enough to produce a flash when in contact with a flame, a spark or a hot spot, but too low to produce combustion in the absence of a pilot flame. A substance with a flash point of less than 0°C is described as extremely inflammable, between 0 and 21°C easily inflammable, and between 21 and 55°C inflammable.
FLIR Forward-Looking Infrared. Infrared sensor used for remote sensing of oil slicks. In optimal atmospheric conditions, it can detect a slick approximately 20 nautical miles from the aircraft when flying at 3,500 feet. It can detect Bonn Agreement code 2 (rainbow) slicks, and has no upper thickness limit. It can also be used to read the name of a vessel at night.
GIS Geographical Information System
GPS Global Positioning System
Ifremer French Research Institute for Exploitation of the Sea
Microwave radiometer
Sensor used for remote sensing of oil slicks. The detection method makes it an all-weather sensor. It can also determine the thickness of slicks.
MOTHY Météo France’s Oceanic Oil Transport Model, a drift prediction model for oils slicks and objects at sea.
MRCC Marine Rescue Coordination Centre
Phytoplankton bloom
Vigorous proliferation of plankton
POLREP POLlution REPort
Pour point Temperature below which a hydrocarbon stops flowing. If a substance’s pour point is above room temperature, it is less fluid. Pour points are measured in laboratory conditions and are not an accurate representation of the behaviour of a particular hydrocarbon in an open environment.
Remobilisation Remobilisation is the process in which the sea reclaims grounded or beached pollutant, or pollutant buried or trapped in sediment near the coast.
Remote sensing Collection of techniques used to detect and identify phenomena from a certain distance, either through human capacities or special sensors. In the case of aerial observation of oil pollution, remote sensing relies on the use of detection systems, including SLAR, FLIR, infrared and ultraviolet scanners and microwave radiometers.
SASEMAR "Sociedad de Salvamento y Seguridad Marítima" (Spanish Maritime Rescue and Safety Association). Spanish organisation in charge of research and rescue services at sea, as well as pollution response for the Spanish state, within its responsibility zone which covers approximately 1,500,000 km2.
SG Mer French General Secretariat for the Sea
SHOM French Naval Hydrographic and Oceanographic Service
SLARSide-Looking Airborne Radar, used to detect oil slicks
Surfactant A wetting agent which can increase spreading of a liquid (which is dependent on surface tension).
UV Ultraviolet
Viscosity Property of resistance to uniform pouring without shaking a substance, inherent in the mass of a substance.

60
Aerial Observation of Oil Pollution at Sea
Operational Guide
BIBLIOGRAPHY AND USEFUL WEBSITES
Bibliography
Bonn Agreement. Aerial Surveillance Handbook, 2004Internet address: http://www.bonnagreement.org – "Aerial surveillance" section.
International Maritime Organisation. MARPOL 73/78. IMO, London: Edition number: IB521F. (Summary edition from 2002).
National Oceanic and Atmospheric Administration (United States). Open-Water Oil Identification Job Aid for Aerial Observation, 1997. Internet address: http://response.restoration.noaa.gov/order/jobaid.html.
International Tanker Owners Pollution Federation. Aerial observation of oil at sea. Internet address: http://www.itopf.com/publicat.html (orders: [email protected]).
Websites
Bonn Agreement: http://www.bonnagreement.org, "Aerial surveillance" and "Meetings and documents" sections.
Centre of Documentation, Research and Experimentation on Accidental Water Pollution (Cedre): http//www.cedre.fr, "Discharge at sea" section.
Community Information System: http://europa.eu.int/comm/environment/civil/marpol-cis/index.htm, European Union’s website explaining the national organisation for response to accidental marine pollution and means available for each member state.
Helsinki Commission, aerial surveillance: http://www.helcom.fi/shipping/waste/en_GB/surveilance.
International Tanker Owners Pollution Federation (ITOPF): http://www.itopf.com/aerial.html.
National Oceanic and Atmospheric Administration (United States) : http://www.noaa.gov,- section "Ocean"- subsection "Oil and chemical spills"- subsection "Emergency response", "Responding to oil spills"- documents "Open-Water Oil Identification Job Aid for Aerial Observation" and "Dispersant Application Observer Job Aid".
International Maritime Organisation: www.imo.org, "Marine environment" section.


Op
erat
ion
al G
uid
e: A
eria
l O
bse
rvat
ion
of
Oil
Po
llu
tio
n a
t S
ea
Centre of Documentation, Research and Experimentation
on Accidental Water Pollution
715, rue Alain Colas, CS 41836, F 29218 BREST CEDEX 2
International: Tel. +33 (0)2 98 33 10 10 - Fax: +33 (0)2 98 44 91 38
E-mail: [email protected] - Internet: http://www.cedre.fr
© Cedre - 2006