Embed Size (px)
Citation preview

AERATION TESTING DIFFUSER CLEANING
Kevan Brian and Emmanuel Rochais, AWT Water Ltd; Andy Bainbridge and Alison Lowe, Rotorua District
Council; Tom Lawson, Aqua-Audit Pty Ltd
ABSTRACT
Aeration in Wastewater Treatment Plants (WWTP) is typically undertaken via diffused aeration systems
(membrane or ceramic diffusers and aeration blowers). Operational costs for aeration are typically 30-40% of
total plant OPEX and 50-70% of the electricity consumption in an activated sludge process.
Over time diffusers accumulate biological growths and inorganic material. This fouling can increase the
pressure required to deliver air to the process. It can also reduce oxygen transfer into the mixed liquor.
Measuring the diffuser backpressure allows an assessment of their condition relative to new diffusers and can be
used to quantify additional power costs caused by fouling. Carrying out diffuser cleaning using formic acid in
parallel helps to maintain their performance and minimise energy wastage. Offgas tests can also be performed to
determine oxygen transfer efficiency.
These tests have been undertaken at the Rotorua WWTP. Results show the very positive impact of diffuser
cleaning on the backpressure, and an oxygen transfer improvement. An analysis of the aeration system
performance in a MBR (membrane diffusers) and in conventional activated sludge (ceramic diffusers) is
presented.
All of the above is undertaken with portable equipment, without interrupting the treatment process and
represents very limited costs compared to the savings it can generate.
KEYWORDS
Aeration testing, diffuser cleaning, backpressure, aeration efficiency
1 INTRODUCTION
1.1 AERATION SYSTEMS
Aeration systems are a critical part of high-rate wastewater treatment plants (WWTP) where oxygen is essential
to oxidise the organics and reach the removal levels required by discharge consents. Oxygen is also critical for
Nitrogen removal (Nitrification: conversion of Ammonia into Nitrate) and for Enhanced Biological Phosphorus
removal.
Any issues relating to the system providing air to the treatment process can be detrimental to the final effluent
quality. For this reason aeration systems are – when properly designed – reliable and robust. Apart from the
preventive maintenance of the blowers and the replacement of diffusers (every 5 to 10 years), these systems
usually do not require much attention and care.
Submerged fine-pore air diffusion is the most common way to provide oxygen to the biomass treating
wastewater. The bubbles are generated with porous ceramic, plastic or flexible membranes of various shapes
(dome, disk, tube, panel). Fine-pore aeration achieve better Oxygen Transfer Efficiency (OTE - %) and better
Aeration Efficiency (SAE – kgO2/kWh) due to the small bubbles (larger surface area per unit volume) and lower
air flow.
1.2 DIFFUSER FOULING
Fine-bubble diffusers are impacted by the mixed liquor even though this impact is not directly visible. The
components of the mixed liquor will tend to block the fine-bubble orifices of the diffusers. The speed of the
diffuser fouling will be specific to each plant and process (depending on process conditions, water quality,
diffuser type, time in service) but this inevitable deterioration of the diffusers – and therefore of the aeration
efficiency – will generally be slow and may be hard to detect.
This fouling and scaling might come for the air side of the diffusers where the blower inlet air is unfiltered, or if
oil or construction debris are present in the pipes. But most of the time the clogging will form outside of the
diffusers, where a mix of biofilm and inorganic precipitates appear and develop.
Most of the time the treatment plant’ staff will only be required to slightly increase the blower’ speed or
pressure setpoint to maintain the right Dissolved Oxygen (DO) concentration in the tanks without realizing what
happens underwater at the bottom of the tanks. The power consumption of the blowers is usually not being
monitored separately from the other plant process items and it is therefore difficult to notice that the blower
power draw is increasing. In some cases the operators may only become aware of the diffusers fouling once
major problems have occurred at the treatment plant such as blower surge or deteriorated effluent quality.
1.3 IMPACT OF FOULING ON PROCESS
Diffusers fouling will have the following consequences:
- By increasing the differential pressure through the diffusers, the blowers will need to to push harder to
deliver the same air flow leading to increased power costs and potentially causing operation issues
(blower surge, blower overload).
- The oxygen transfer from the air to the process water (mixed liquor) will also be impacted. If some
pores are getting fully clogged more air flow will have to pass through the remaining open pores. This is
likely to increase the bubble size, and bubble velocity and reduce the oxygen transfer. Coalescence (air
bubbles colliding, merging, and getting larger – reducing therefore their exchange surface) may also be
increased.

- Different levels of diffuser clogging may create preferential flow paths (spiral roll) which will increase
the air vertical velocity and reduce contact time between air and process water. This will reduce the
transfer of oxygen from the air into the mixed liquor.
- When diffusers are highly fouled they may, especially if they are membrane diffusers, rip or tear away
from their binding.
Literature mentions that the greatest diffuser fouling rate (and therefore loss of aeration efficiency) occurs
within the first 2 years of operation. It is then critical to start cleaning the diffusers from the plant
commissioning stage in order to keep the aeration system as efficient as possible and keep the diffuser
backpressure as close from their as-new values as possible to avoid energy wastage.
It must also be mentioned that diffuser material properties change over time (especially for membrane diffuser
through hardening or shrinkage of elastomer compounds) and this will also have impacts on the backpressures
and aeration efficiencies. These changes cannot be remedied and therefore periodic replacement of the diffusers
will eventually be required.
1.4 CLEANING OPTIONS
In order to reduce the detrimental impact of diffuser fouling various methods can be used to clean them:
- They can be water-blasted to remove the biological layer which has formed at their surface. This can be
done from the top of the tanks if they have been drained or outside the tanks if the grids are removable.
This is an effective method but is time-consuming and labour intensive.
- For removal of precipitate scaling, acids are usually used. Some methods require the injection of
Hydrogen Chloride gas in the air system. Liquid hydrochloric acid can also be used to soak the
diffusers. These methods can be done on line but HCl is corrosive to steel pipework, and is therefore
rarely used.
- Another way to clean the diffusers is to vaporise small quantities of Formic Acid (also called Methanoic
Acid) in the aeration droppers while the plant is operating. The process air stream will carry the
vaporised formic acid from the injection point into the diffusers (a dose of 50 to 100g per diffuser is
usually used). This method will be investigated in this paper.
Whilst the efficiency of diffuser cleaning has been proved and discussed in numerous papers it is important to
also assess the specific situation of each plant with pre- and post-acid dosing measurements in order to estimate
the efficiency of the cleaning and to gain an understanding of the diffuser fouling rate to determine the most
appropriate cleaning frequency. This will help to optimize cleaning and replacement costs.
2 MATERIALS AND METHODS
As mentioned in Section 1 it is highly recommended to conduct the diffusers cleaning in association with a set
of pressure measurements.
These measurements include the determination of the diffusers backpressure at various air flows (pre- and post-
cleaning), and direct assessment of the oxygen transfer efficiency using the off-gas technique.
Aeration testing work is usually conducted in 3 different stages:
- Pre-cleaning backpressure measurements and off-gas tests on selected grids;
- Formic acid vapour dosing in all diffusers grids;
- Post-cleaning backpressure measurements and off-gas tests on the selected grids.

The number of diffusers grids selected and tested depends on the total number of grids. A reasonable amount is
usually chosen to give a good picture of the level of fouling throughout the aeration tank.
2.1 TESTING EQUIPMENT
All the work is carried out with portable equipment and does not require the draining of tanks or stoppage of the
treatment process.
The backpressure test equipment includes:
- A sinker weight which will be lowered at the bottom of the tank and which is equipped with a bubbler
tube whose opening is level with the height of the diffusers being measured.
- A digital manometer used to measure the difference between the grid air supply pressure and the
bubbler tube backpressure – this will be a direct measure of the prevailing diffuser backpressure
(assuming other losses are negligible).
- A portable Pitot tube with connecting lines which is inserted in the grid air supply pipe.
- A second manometer used to measure the differential pressure across the Pitot tube – which will give
the air flow in the grid supply pipe, using the Pitot tube formula.
Backpressure readings are taken over a wide range of air flows, and are then plotted and compared with the as-
new values provided by the diffuser supplier to estimate the level and speed of fouling (depending on when they
were installed / last cleaned). The comparison between pre- and post-cleaning values allows the efficiency of the
Formic Acid dosing to be assessed.
Photograph 1: Manometers Panel

Photograph 2: Pitot tube inserted in air pipe
(Note: the Pitot tube is too close from the bend on this photo)
The off-gas testing requires:
- A portable gas hood (800mm x 800mm), with a stainless steel rods structure and float tubes, used to
collect the air bubbling on top of the aeration tank.
- A light hose (means of conveying the sampled gas to the analytical instrument) and a portable gas phase
oxygen analyser used to measure the oxygen content of the collected process off-gases.
- A DO / Temperature probe to measure the local conditions in the tank in the vicinity of the gas hood.
Oxygen content of the offgas, temperature and DO readings are taken over a wide range of air flows. Air has a
20.9% content of oxygen, and the oxygen content of the offgas collected above aeration tanks will have dropped
around 16 to 19%. This number reflects the efficiency of the oxygen transfer from the process air into the mixed
liquor.
The comparison between pre- and post-cleaning values allows to assess the current state of the aeration system
and to determine if the cleaning has had an impact on this aeration efficiency.

Photograph 3: Gas hood used to collect aeration offgas
Finally the Formic Acid cleaning (using 85% Formic Acid) is carried out using:
- An acid dosing pump installed on a hand trolley;
- Formic Acid (delivered in 25kg drums);
- A dosing nozzle installed on the grid air supply pipe to inject and vaporise formic acid into the air
stream.
Photograph 4: Dosing equipment (pump on hand trolley and formic acid drum)

2.2 INSTALLATION AND TEST PROCEDURE
Aeration testing is carried out following the procedure detailed below:
- All equipment is portable and is brought to site, the only requirement for the plant operation staff is to
have 1 to 2 fittings installed on each of the plant’s aeration grids. These fittings are usually ¾ inch.
- The tests are usually carried out by 2 people and it takes only a couple of hours to set up all the
equipment.
- The first part of the operation will be the backpressure and offgas pre-cleaning measurements on the
selected grids.
- Formic Acid dosing can be started in parallel to these pre-cleaning measurements.
Photograph 5: Dosing nozzles inserted in air dropper
- The selected grids will be retested 24 hours after the Formic Acid injection to determine the effect of
the cleaning.

Photograph 6: Gas hood on aeration tank surface
3 RESULTS: CASE STUDY
3.1 ROTORUA WASTEWATER TREATMENT PLANT
The Rotorua Wastewater Treatment Plant is located on Te Ngae Road in Rotorua. It treats an Average Daily
Flow of 18,000m3/d coming from Rotorua and from lakeside communities within the District (mostly domestic
– small percentage of industrial flows). It uses a multiple-compartment 5-stage activated sludge Bardenpho
process (2/3 of the flows) and a Membrane Bioreactor (1/3 of the flows) to remove the wastewater
contaminants. The recent Council’s upgrades of the Wastewater Treatment Plant have substantially reduced the
nutrient load to Lake Rotorua. To protect further the quality of the water of Lake Rotorua, the treated effluent is
irrigated to pass through the land in Whakarewarewa Forest before the groundwater discharges to Lake Rotorua.
The Bardenpho aeration zones are equipped with 1,500 porous ceramic diffusers (Permox R-1000 – 70mm
diameter – 1000mm long) on 32 grids (divided in 4 aerated zones). The diffusers were replaced in 2005. The
aeration is supplied by 5 HV-Turbo centrifugal blowers (4 x 75kW + 1 x 90kW). The blowers normally operate
under automatic control to try to maintain a pressure setpoint in the air delivery main, while four air flow
control valves modulate independently to maintain a dissolved oxygen concentration setpoint in each aerated
cell.
The MBR was commissioned in March 2012. Its aeration zone is equipped with 240 tubular membrane diffusers
(EDI Minipanel - 125mm diameter – 1400mm long) shared over ten grids. The aeration system is served by 2
positive displacement blowers (2 x 132kW – Duty/Stand-By). The output of the duty blower is regulated
automatically to maintain the DO setpoint in the aeration tank.
The Bardenpho diffusers have not been cleaned since their installation in 2005. They were thought to be fouled
to an unknown degree by biofilms, inorganic precipitates and mixed liquor ingress into their pores during
blower outages. Because of this the Bardenpho blowers were operating at an air delivery pressure setpoint close
(49.5kPa) from the blowers’ surge pressure (approx. 54kPa).
Similar tests were planned out on the MBR aeration system to determine its condition after 1 year of service and
to assess the effectiveness of Formic Acid cleaning on the tubular membranes diffusers.

For the Bardenpho ceramic diffusers a dose of 120g of Formic Acid per diffuser was used. For the MBR tubular
membrane diffusers 80g of Formic Acid per diffuser was dosed. This is equivalent to 200kg of Formic Acid for
the whole plant.
The aim of the aeration tests was to determine the current condition of the Bardenpho and MBR diffusers and to
perform Formic Acid cleaning on all of them to reduce the backpressure. The work was carried out over 4 days.
3.2 BACKPRESSURE
3.2.1 BARDENPHO
The following figures present the results of the backpressure measurements carried out on the Bardenpho.
Figure 1: Rotorua Bardenpho – Pre-Dosing curves
It will be immediately clear from the pre-dose chart that measured backpressures for all six grids are far in
excess of as-new values, with an average value of ~6kPa at an air flow rate of only 2Nm3/h.m – a fifth of the
diffuser’s nominal design flow rate. As-new figures have been plotted for comparison.

Figure 2: Rotorua Bardenpho – Post-Dosing curves
The post-dose curves are considerably improved, showing that a 6kPa backpressure will yield an average air
flow rate of about 6Nm3/h.m – three times the pre-dose figure. This is a considerable improvement. However,
the diffuser’s design air flow rate was still not reached, and at the maximum average rate reached (8Nm3/h/m),
the average backpressure of 8-9kPa was well above the as-new figure of 3kPa.
There is no clear difference between diffusers from different grids, except to note that Grid 4 (the first tested
grid in the flow direction) had the highest backpressures before and after dosing.
Rotorua WWTP operation staff did not seem to have much margin between current system operating pressures
and blower surge point. The reduction of diffuser fouling thanks to the formic acid cleaning will allow them to
reduce the blower pressure setpoint and have more flexibility for their blower operation.
3.2.2 MBR
The following figures present the results of the backpressure measurements carried out on the MBR.
At a nominal design air flow rate of 15Nm3h/m average diffuser backpressure before dosing was about 6.5kPa,
and after dosing this dropped to about 4.5-5.5kPa.
These figures are not much higher than the manufacturer’s as-new value of 3.7kPa at the same air flow rate after
just over 12 months of service.

Figure 3: Rotorua MBR – Pre-Dosing curves
Figure 4: Rotorua MBR – Post-Dosing curves

The curves also show that the Formic Acid dosing has had a stronger positive impact on the grids No 2 and No 9
than on grid No 7. For this grid, the backpressures only seem to have slightly dropped following the cleaning.
For the 2 other grids, the backpressure reduction is always higher than 1kPa.
3.3 AERATION EFFICIENCY
The impact of Formic Acid cleaning on the aeration efficiency is also investigated on both processes using the
data collected with the offgas tests.
3.3.1 BARDENPHO
The Alpha factor accounts for contaminants in the mixed liquor, and indicates the level of reduction in oxygen
transfer (ratio of process water to clean water oxygen transfer).
New diffusers can yield effective Alpha values of 0.80 for extended aeration plants at Mixed Liquor Suspended
Solids (MLSS) concentrations of less than 4,000mg/L. Values of 0.5-0.6 are usually used to design aeration
systems. However these values tend to drop
- as diffusers age and foul;
- at elevated MLSS concentrations;
- for short air/process water contact times (function of the bubble diameter and air flow rate);
- for short sludge ages (Mean Cell Retention Time - MCRT).
Alpha factor values can also be lower at the inlet end of plug flow tanks. In plug flow aeration tanks like the
Bardenpho process, the alpha factor at the influent zone of the aeration tank may be only 0.3 but at the effluent
zone it may be as high as 0.8.
The computed Alpha factor values are here the ratio between the Specific Oxygen Transfer Rate into process
water (mixed liquor) compared with the equivalent rate into clean water.
The Clean Water Specific Oxygen Transfer Rate is usually provided by the diffuser supplier. The Process Water
Specific Oxygen Transfer Rate is calculated using the offgas testing results:
- The amount of oxygen transferred into the water is obtained by the difference between the mass of
oxygen within one Nm3 of atmospheric air (20.9% O2 in volume equivalent to 279gO2/Nm3 of air at 20
degrees Celsius, 1 atmosphere) and the mass of oxygen in the aeration tank offgas (the measured O2
percentage in offgas gives the equivalent mass of O2 remaining in the offgas).
- This difference is divided by the water depth above the diffusers to calculate the Specific Oxygen
Transfer rate in process conditions.
- This Specific Oxygen Transfer rate is then converted into Normal conditions (20 degrees Celsius, 1
atmosphere) and compensated for local DO concentration in the aeration tank.
- The Specific Oxygen Transfer Rate in Normal Conditions is therefore obtained and the ratio between
the Clean Water and the Process Water values gives access to the Alpha factor.
The Alpha factor results of the off-gas tests are presented in the table below. Only values at similar air flows
were considered in order to have comparable figures for both sets of tests (pre- and post-cleaning).
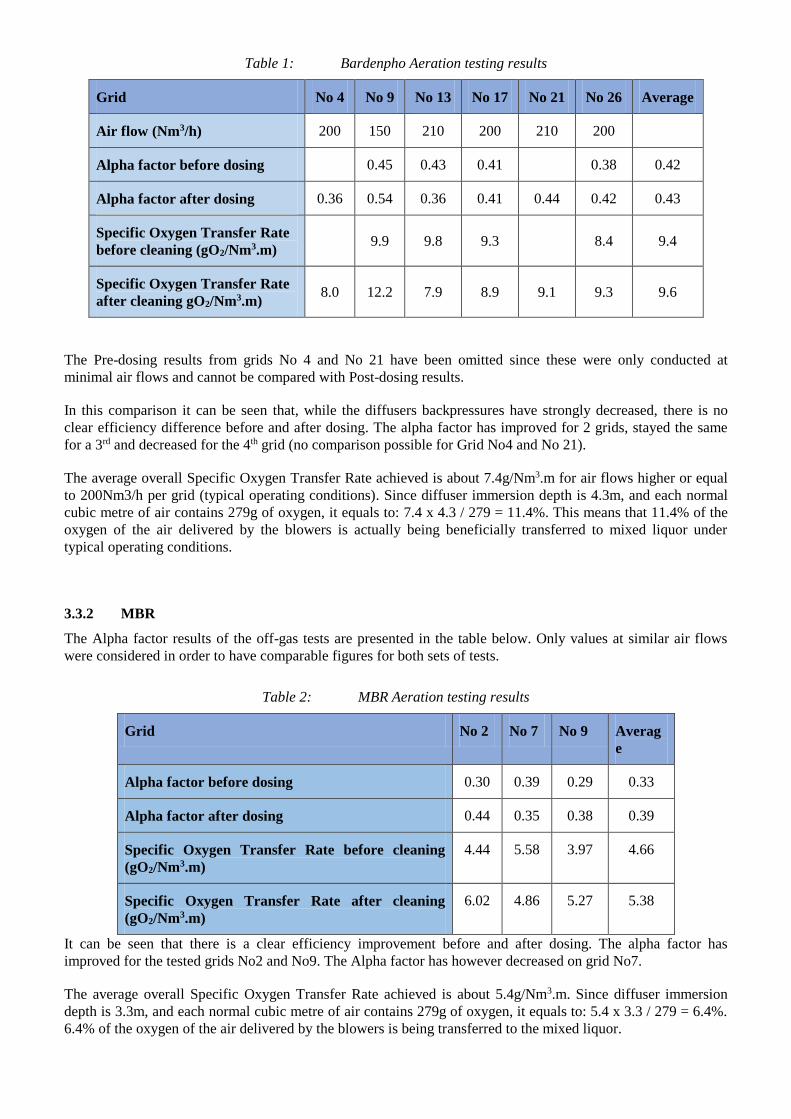
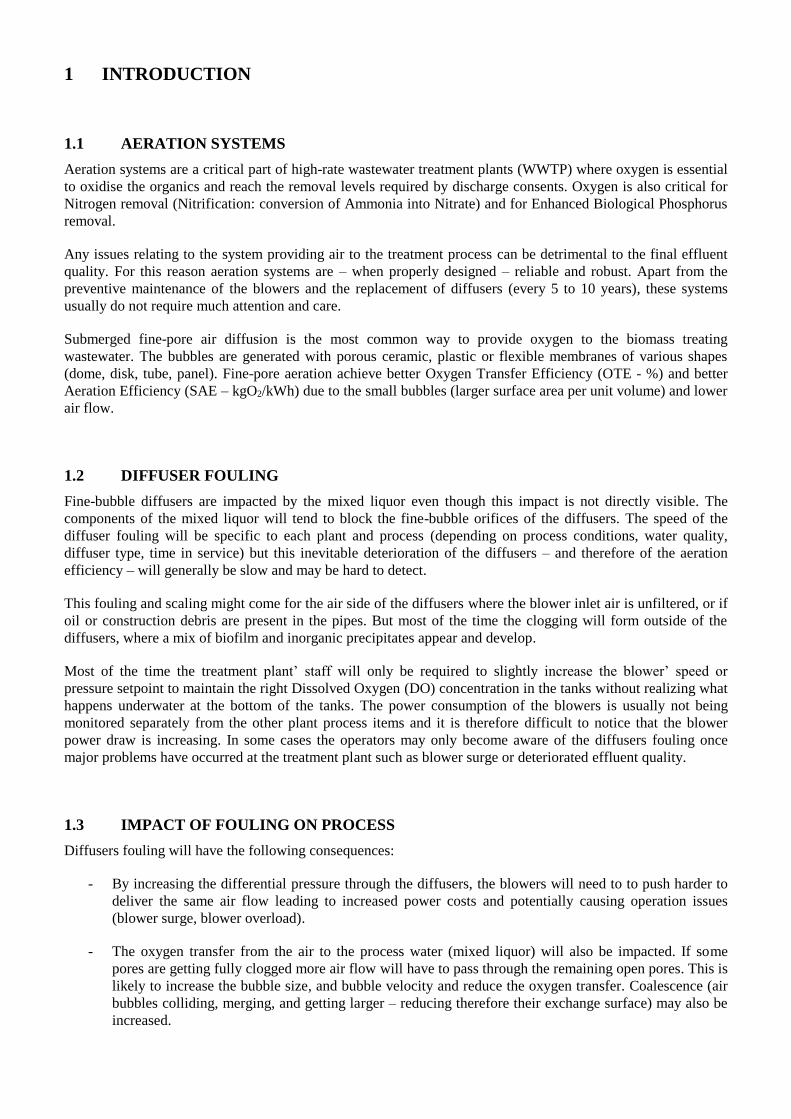
Table 1: Bardenpho Aeration testing results
Grid No 4 No 9 No 13 No 17 No 21 No 26 Average
Air flow (Nm3/h) 200 150 210 200 210 200
Alpha factor before dosing 0.45 0.43 0.41 0.38 0.42
Alpha factor after dosing 0.36 0.54 0.36 0.41 0.44 0.42 0.43
Specific Oxygen Transfer Rate
before cleaning (gO2/Nm3.m) 9.9 9.8 9.3 8.4 9.4
Specific Oxygen Transfer Rate
after cleaning gO2/Nm3.m) 8.0 12.2 7.9 8.9 9.1 9.3 9.6
The Pre-dosing results from grids No 4 and No 21 have been omitted since these were only conducted at
minimal air flows and cannot be compared with Post-dosing results.
In this comparison it can be seen that, while the diffusers backpressures have strongly decreased, there is no
clear efficiency difference before and after dosing. The alpha factor has improved for 2 grids, stayed the same
for a 3rd and decreased for the 4th grid (no comparison possible for Grid No4 and No 21).
The average overall Specific Oxygen Transfer Rate achieved is about 7.4g/Nm3.m for air flows higher or equal
to 200Nm3/h per grid (typical operating conditions). Since diffuser immersion depth is 4.3m, and each normal
cubic metre of air contains 279g of oxygen, it equals to: 7.4 x 4.3 / 279 = 11.4%. This means that 11.4% of the
oxygen of the air delivered by the blowers is actually being beneficially transferred to mixed liquor under
typical operating conditions.
3.3.2 MBR
The Alpha factor results of the off-gas tests are presented in the table below. Only values at similar air flows
were considered in order to have comparable figures for both sets of tests.
Table 2: MBR Aeration testing results
Grid No 2 No 7 No 9 Averag
e
Alpha factor before dosing 0.30 0.39 0.29 0.33
Alpha factor after dosing 0.44 0.35 0.38 0.39
Specific Oxygen Transfer Rate before cleaning
(gO2/Nm3.m)
4.44 5.58 3.97 4.66
Specific Oxygen Transfer Rate after cleaning
(gO2/Nm3.m)
6.02 4.86 5.27 5.38
It can be seen that there is a clear efficiency improvement before and after dosing. The alpha factor has
improved for the tested grids No2 and No9. The Alpha factor has however decreased on grid No7.
The average overall Specific Oxygen Transfer Rate achieved is about 5.4g/Nm3.m. Since diffuser immersion
depth is 3.3m, and each normal cubic metre of air contains 279g of oxygen, it equals to: 5.4 x 3.3 / 279 = 6.4%.
6.4% of the oxygen of the air delivered by the blowers is being transferred to the mixed liquor.

Though this value is low both sets of data suggest there has been a significant specific oxygen transfer rate gain
for Grids 2 and 9 and a loss for Grid 7. Overall the acid cleaning seems to have yielded an efficiency gain of
15%.
Acid vapour dosing seems to have been effective in both reducing diffuser backpressures and increasing Alpha
values on the MBR diffusers, so its continued use is recommended.
4 DISCUSSION
4.1 BARDENPHO
Test conditions
It must be noted that following the insertion of the instruments (Pitot tube or dosing nozzle) in the air pipe it
took a long time for the air flows to be restored to each tested grid. It also appeared that the maximum pre-dose
air flows which could pass through the diffusers was only about a third of the air flow rates they pass under
normal operation.
This phenomenon may be caused by a leak of mixed liquor into the diffuser internal while the air was stopped in
order to insert the instruments and by the time the air needed to push out this mixed liquor.
What this means is that the backpressure curves presented in Section 3.2.1 cannot be taken as depicting the true
operating conditions. They do, however, serve well to show the effectiveness of acid vapour dosing in reducing
diffuser backpressures as both sets of measurements were taken in similar conditions.
Results
While there is no doubt that acid vapour dosing is very effective in reducing diffuser backpressures in the
Bardenpho reactor, the comparative results for the off-gas tests are less clear.
There are two chief factors at work here:
- Bubble size, and
- Bubble velocity
The first factor is a function of both the diffuser design and the air flow rates forced through them. Smaller
pores produce smaller bubble sizes, and smaller bubbles have a bigger specific surface area, making oxygen
transfer more efficient. Some of this benefit is lost, however, if too much air is forced through the diffusers –
making bubble size bigger and reducing the retention time of the bubbles within the liquid. The cleaning can
therefore have 2 different impacts on the bubbles: on the one hand, by unblocking pores it allows a more even
flow and air bubble size pattern throughout each diffuser, which will have a positive impact on the oxygen
transfer; on the other hand, unblocked pores may produce bigger bubbles (if unevenly fouled), and this will have
a rather negative influence on the oxygen transfer.
The second factor becomes important when air bubbles are not evenly released over the whole aeration cell
floor area. If the diffusers are placed too far apart, or if air flow is not distributed evenly amongst adjacent grids,
cells of liquid circulation are created, and the vertical component of these will convey the bubbles too quickly to
the tank surface.
While carrying out these tests the different air flows are obtained by throttling the manual valve of each grid.
However great care must be taken while changing the valve positions and varying the air flows in order to keep
the bubble pattern on and around the measured grid smooth and even. The throttling of the valves may cause the
adjacent grids to pass much less air than the grid which was tested (increasing the air flow and the vertical

velocity of the bubbles on the tested grid). It is important to stay consistent in keeping air flow rates in adjacent
grids similar as they were reduced in steps for each set of tests.
However it is possible that unfavourable velocity factors may account for the relatively poor Alpha factors and
oxygen transfer efficiencies calculated for this process.
It must also be noted that the Bardenpho MLSS concentration was high (4,200mg/L- target around 3,000mg/L)
while the tests were conducted. This had certainly a negative impact on the oxygen transfer during these tests.
4.2 MBR
Overall, the MBR backpressure results are higher than expected for membrane diffusers with this length of
service. The Alpha factors and Specific Oxygen Transfer Rates calculated are all low as well. It is surprising to
find them not better than in the Bardenpho reactor, the diffusers of which have been in service now for about 8
years
This is likely to be due to the MBR mixed liquor viscosity (more filaments and less well-formed flocs in an
MBR sludge due to the absence of settling stage). The high MLSS concentration at which MBR processes
usually operate (about 5g/L for the Rotorua MBR) also has a detrimental impact on the oxygen transfer.
It is also possible that unfavourable velocity factors may have impacted the Alpha factors and oxygen transfer
efficiencies calculated of the MBR.
5 CONCLUSION
5.1 CASE STUDY RECOMMENDATIONS
Based on the results of the Formic Acid cleaning and Aeration testing carried out at the Rotorua WWTP, the
following main recommendations have been made:
- Rotorua District Council implement Formic Acid vapour dosing and diffuser backpressure testing as a
regular (annual) monitoring and maintenance procedure.
- On the Bardenpho, as diffusers become fouled again, the operators may have to increase the blower
pressure setpoint to maintain the right DO concentration. This will be a good indicator that a new
cleaning operation is required and it will give an estimate of the Formic Acid dosing frequency required.
- On the MBR, a yearly diffuser cleaning is considered as good practice to keep the diffuser backpressure
as close as possible from their as-new values. This should also extend the lifespan of the diffusers.
- As diffuser age, the cleaning may have to become more frequent. By comparison between the cleaning
costs and the diffusers renewal costs, RDC will be able to assess precisely when will be the most
adequate time to replace the diffusers.
Following the cleaning of the diffusers, the Rotorua WWTP staff has been able to lower the blower pressure
setpoint by 2.5kPa (from 49.5 to 47kPa – a 5% reduction of the blowers operating pressure) without any
consequences on the quality of the treatment. This is likely to lead to power savings (centrifugal blowers
operating closer from their optimal range) and it also provides more flexibility and margin to the operators for
the control of their aeration system.
Unfortunately it has not been possible at this stage to extract from the Rotorua WWTP power consumptions
measurements any data showing that the cleaning has reduced the plant power consumption. This is due to
several factors:

- No specific power consumption follow-up of the blowers – just a general plant power consumption is
available.
- The MBR process has been commissioned in March 2012. It is therefore difficult to compare the 2013
data with the 2012 data (only Bardenpho operating until end of March 2012 – then MBR commissioning
and start-up phase) as the plant has been operating in 2 different configurations. If a similar cleaning
and measurement work is carried out in 2014 it may be easier to determine the effect of the
backpressure reduction on the plant power consumption.
5.2 GENERAL CONCLUSION
Aeration testing and Formic Acid vapour dosing allows to assess the condition and to clean WWTP fine-pore
diffusers without any disturbance of the treatment process. It helps WWTP operators to maintain a part of their
aeration system which is often neglected.
The cost of the Aeration testing and Formic Acid cleaning services is quite small, and is usually quickly repaid
by power savings (via oxygen transfer efficiency gains and backpressure reductions) and extension of the
diffusers service life. It requires only portable equipment and is carried out without any interruption of the
treatment process.
ACKNOWLEDGEMENTS
The authors would like to acknowledge Aqua-Audit and Rotorua District Council for their participation and
assistance on this project.
REFERENCES
ABS NOPON Clean – installation, operating and maintenance instructions.
ASCE. “Standard Guidelines for In-Process Oxygen Transfer Testing.” ASCE Standard 18-96 (1997).
Germain, E., et al. “Biomass effects on oxygen transfer in membrane bioreactors.” Water Research. 41:1038-
1044 (2007).
Gillot, S., Heduit, A. “Prediction of alpha factor values for fine pore aeration systems.” Water Science &
Technology. 57-8:1265-1269 (2008).
Krampe, J. et al. “Diffuser Selection For Foul Air Treatment In An Activated Sludge Plant.” AWA Water J. pp.
108-112 (August 2013).
Mahendraker, V., Mavinic, D. S., Rabinowitz, B. “Comparison of oxygen transfer parameters from four testing
methods in three activated sludge processes.” Water Qual. Res.J. Canada. 40-2:164-176 (2005).
Metcalf & Eddy, Tchobanoglous, G., Burton, F. L., Stensel, H. D. Wastewater Engineering, Treatment and
Reuse, Fourth Edition, McGraw Hill Education (2003).
Redmon, D., Boyle, W. C., Ewing, L. “Oxygen Transfer Efficiency Measurements in Mixed Liquor Using Off-
Gas Techniques.” J. Water Pollution Control Federation. 55:1338-1347 (1983).
Rosso, D., Iranpour, R., Stenstrom M. K. “Fifteen Years of Offgas Transfer Efficiency Measurements on Fine-
Pore Aerators: Key Role of Sludge Age and Normalized Air Flux.” Water Environment Research. 77-3:266-273
(2005).
Rosso, D., Stenstrom M. K. “Economic Implications of fine-pore diffuser aging.” Water Environment Research.
78-8:810-815 (2006).