Embed Size (px)
Citation preview

Anadolu EfesInvestor Presentation

This report may contain certain forward-looking statement s concerning our
future performance and should be considered as good faith es timates made
by the Company. These forward - looking statements reflect m anagement
expectations and are based upon currently available data. A ctual results are
subject to future events and uncertainties, which could mat erially impact the
Company’s actual performance.
Forward-Looking Statements

Regional Beverage Powerhouse
Beer BusinessFOCUS IN TURKEY & CIS
14* breweries in 5* Countries
35.2 mhl* Beer Capacity
7 malteries with 290,000 tons Malt Capacity
* Does not include Serbian operations, where EBI cu rrently has 28% shareholding
Coca-Cola BusinessFOCUS IN TURKEY, CENTRAL ASIA &
MIDDLE EAST
20 bottling plants in 10 countries
978 million unit case capacity3
Anadolu Efes Production Plants

Anadolu Efes’ Structure
ANADOLU EFES
TURKEY BEER OPERATIONS
EFES BREWERIES
INTERNATIONAL (EBI)
INTERNATIONAL BEER
OPERATIONS
COCA-COLA İÇECEK1
(CCI)
COCA-COLA OPERATIONS
Public
Public43.8%
24.6%
50.3%100.0%
Yazıcı Holding 30.9% Özilhan Sınai Yatırım 17.5% Anadolu Endüstri Holding 7.8%
(1) 20% held by TCCEC (The Coca-Cola Export Corporation) and 5% by Özgörkey Holding.* Only the major subsidiaries of the Group are presented4

Rapidly Growing Beverage Company
5

Operating Markets
6

Consolidated Sales Volume Development
7
CAGR (06-10)
8.6%
Breakdown of Consolidated* Sales Volume-1Q2011
*Full consolidation of Turkey and International Beer, proportionate consolidation of Soft Drinks (CCI)

Consolidated Net Sales Revenue*
Consolidated Financial Performance
Consolidated EBITDA*
mill
ion
TR
L
mill
ion
TR
L
*Full year EBITDA is as previously reported, not restated as per CMB’s new reporting format.
8
Breakdown of Consolidated* Net Sales Revenue-1Q2011
Breakdown of Consolidated* EBITDA-1Q2011
* Full consolidation of Turkey and International Beer, proportionate consolidation of Soft Drinks (CCI)
’06-’10 CAGR 13%
’06-’10CAGR 15%

Net Financial Indebtedness
mill
ion
US
D2.3 x 1.8 x 0.9 xNet Debt/EBITDA
9 *50.3% of CCI’s financial debt is consolidated as per Anadolu Efes’ shareholding
Gross Debt
Cash Position
239.3
374.8
510.9
39.6
870.1
364.7
1,196.5
605.9

Debt Maturity & Currency Breakdown
EBI CCI
10 Numbers may not add up to 100 due to rounding.Numbers may not add up to 100 due to rounding.

Beer Operations

Uzbekistan
Turkey Moldova
Georgia
Kazakhstan
China
Greece
Serbia
RomaniaRussia
BulgariaPoland
USA
Czech Rep.Germany
West Europe
-3,5%
1,5%
6,5%
11,5%
16,5%
21,5%
0 20 40 60 80 100 120 140 160
High Growth Beer Markets- Low Per Capita Consumption
Source: Canadean Global Beer Trends-201012
CA
GR
Gro
wth
200
5 -
2010
(%)
Per Capita Consumption (lt)

Breakdown of Pure Alcohol Consumption
13
Sou
rce:
Eur
omon
itor,
Bus
ines
s A
naly
tica,
Can
adea
n
Per Capita Consumption (lt) Austria Czech R. Denmark Fi nland Germany Ireland Netherlands Poland Spain UK Russia Tu rkey
Total pure alcohol 10 12 10 8 10 9 8 8 10 9 18 1
Beer 108 142 68 89 107 99 73 87 78 78 73 12

Strong Positions and Brands
TURKEY RUSSIA
KAZAKHSTAN MOLDOVA
GEORGIA
#1 #4
#1 #1
#1
14

Turkey Beer Operations

A Leading Position in the Turkish Beer MarketSteadily Growing and Increasing Market Share
Sustainable Volume Growth*
’06-’10 CAGR 5%
*Sales volume including exports
Market Share Development
Total sales volumes declined by
5.1% in 1Q2011, due to;
�higher beer prices in Turkey
�lower export volumes
impacted by the political
unrest in some export markets
16Source: Nielsen
* Company estimate
Total -0.3%
Domestic -1.2%

Before After
Off-Premise Development Initiatives
Before After
17

Before After
Off-Premise Development Initiatives
Inside Inside
18

On-Premise Development Initiatives
19
Turkish Beer Market – Fundamentals & Dynamics
Consolidated market - top 2 players representmore than 99% of the market
� lack of sizeable acquisition targets
� consolidated distribution structure
Returnable market - Bottles & kegs amount toca.65%
� additional initial investment requirement forcontainers
� requirement to set-up two waydistribution system
TV& Radio advertisement fully restricted since1984
High level of excise taxes
Limited presence of organized retail-supermarkets account for ca.14% share ofEfes sales volumes
Maltey
Hops Processing
Sales Volume by Package Type (2010)
Sales Volume by Consumption Channel (2010) DYNAMICS OF THE TURKISH BEER MARKET
20

Strong Brand Portfoliosignificant share of “Efes” brand
100% brand awareness for Efes
Exports to more than 60 countries
# 1 in consumer spending in Food &
Beverage category – 7.3 % as of March
2010 (AC Nielsen)
98.7% penetration in Turkey (March 2011
AC Nielsen)
21
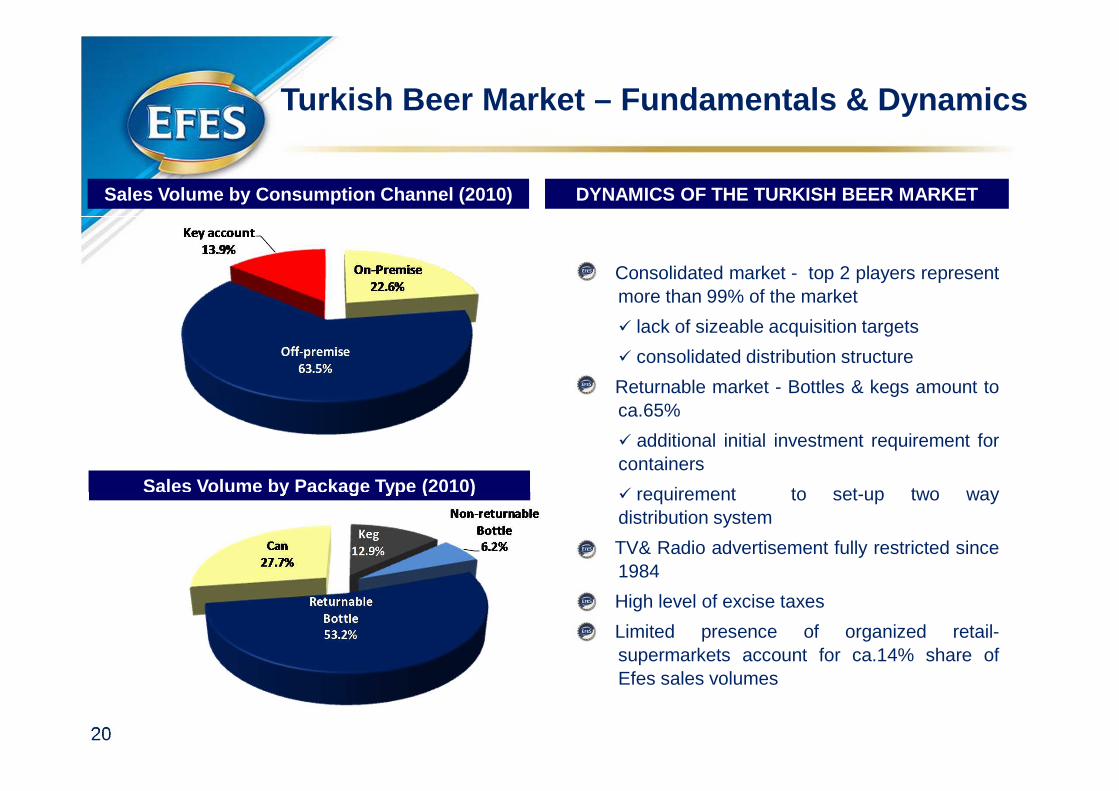
Unmatched Brand Equity
Sou
rce:
The
Nie
lsen
Com
pany
YT
D M
arch
201
1
Food & Beverage %Total Trade %
TURKEYTop Brands – % of spending
22
1. Winston (tobacco) 6.12. Marlboro (tobacco) 4.93. Parliament (tobacco) 4.24. Lark (tobacco) 4.05. EFES PILSEN 3.56. L&M (tobacco) 3.07. Muratti (tobacco) 2.48. Viceroy (tobacco) 2.49. Tekel 2001 2.410. Eti 2.1
16. Coca-Cola 1.68. Coca-Cola 2.1
1. EFES PILSEN 7.32. Eti 4.33. Ülker 3.84. Yeni Rakı 3.75. Coca-Cola 3.46. Pınar 2.77. Çaykur 2.58. Sütaş 2.09. İçim 1.210. Nescafe 1.0 11. Fanta 1.0

Turkish Beer Market – Vertical Integration
Maltey
Hops Processing
Brewery & Capacity
COGS Breakdown (2010)
•Long standing relations with packaging suppliers• ca. 66% returnable
Malt + Hops
Packaging
Vertical integration is a key factor in efficient production cost management
23 Numbers may not add up to 100 due to rounding.
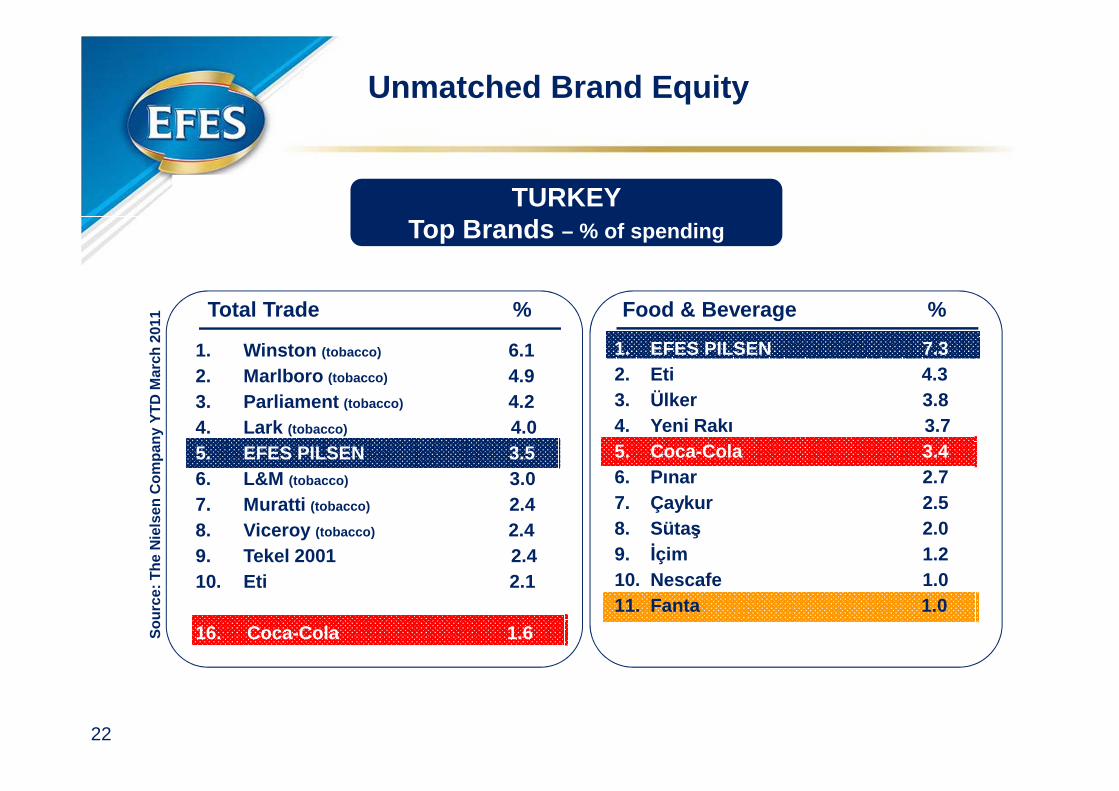
Net Sales Revenue
Net Profit
EBITDA*
Turkey Beer Operations’ Financial Performance
’06-’10CAGR 12%
Mill
ion
TR
L
Mill
ion
TR
L
Mill
ion
TR
L
*Previously reported EBITDA figures for 2005, 2006 and 2007 are adjusted by excluding other income/expense arising from Anadolu Efes’ holding nature for comparison purposes.
24
’06-’10CAGR 14%
1.5%
’06-’10 CAGR 15%

FY2011 OUTLOOK
TURKEY BEER OPERATIONS
25
•
• 1Q2011 was in line with our expectations
• We maintain our previously provided full yearguidance for Turkey Beer Operations;
� low-single digit decline in domestic salesvolume
� gross margin to remain flat with a slightcontraction in EBITDA margin

International Beer Operations

Strong sales performancesachieved in other operating marketsmore than eliminated flattish salesvolumes in Russia and growth trendmaintained in 1Q2011...
Volume Development In International Markets
Volume Development
Breakdown of Sales Volume – 1Q2011
Consolidated sales volume grew by 4.2%
despite;
�high base of last year
� softer demand in Russia due to the
negative impact of higher beer prices
mhl
Numbers may not add up to 100 due to rounding.27
’06-’10CAGR 8%
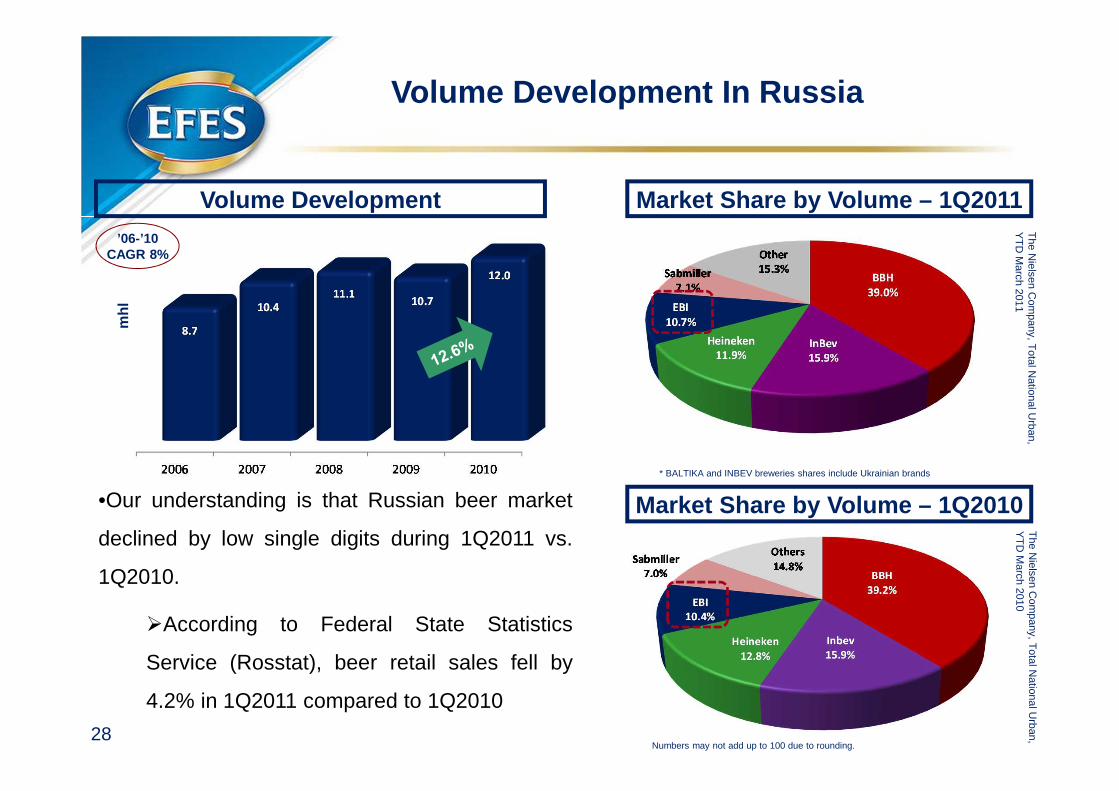
•Our understanding is that Russian beer market
declined by low single digits during 1Q2011 vs.
1Q2010.
�According to Federal State Statistics
Service (Rosstat), beer retail sales fell by
4.2% in 1Q2011 compared to 1Q2010
Volume Development In Russia
Volume Development
mhl
Market Share by Volume – 1Q2011
The N
ielsen Com
pany, Total N
ational Urban,
YT
D M
arch 2011
28
’06-’10CAGR 8%
Numbers may not add up to 100 due to rounding.
Market Share by Volume – 1Q2010
* BALTIKA and INBEV breweries shares include Ukrainian brands
The N
ielsen Com
pany, Total N
ational Urban,
YT
D M
arch 2010

Russia
PREMIUM UPPER MAINSTR. LOWER MAINSTR. DISCOUNT
Kazakhstan
PREMIUM UPPER MAINSTR. LOWER MAINSTR.
Moldova
PREMIUM MAINSTREAM ECONOMY
Georgia
ECONOMY
Strongly Positioned in All Markets
29

Outlet Split (2010)
Russian Beer Market – Fundamentals & Dynamics
Hops Processing
Packaging Split (2010)
Market Segment Development
Sou
rce:
The
Nie
lsen
Com
pany
• Shift between brands is not very
high, but within each brand shift
towards cheaper packaging is visible
Numbers may not add up to 100 due to rounding.Numbers may not add up to 100 due to rounding.
30

Other Operating CountriesM
oldo
vaK
azak
hsta
n
The Nielsen Company, YTD March 2011
#1 brewer
Capacity: 1.2 mhl
EBI entered the Georgian beer market bythe acquisition of the leading brewer in themarket, JSC Lomisi (“Lomisi”), in February2008
#1 brewer
Capacity: 2.4 mhl
#1 brewer
Capacity: 1.4 mhl
Market Share by Volume
31
Geo
rgia

17.6%18.7%
14.8%
19.8% 21.9%
15.4%
10.9%
Net Sales Revenue
Net Profit
EBITDA
International Beer OperationsFinancial Performance
mill
ion
US
D
mill
ion
US
D
mill
ion
US
D
32
’06-’10 CAGR 11%
’06-’10 CAGR 17%
’06-’10 CAGR 27%

33
� As 1Q is not an indicator for the full year performance, we will provide a specific guidance after seeing 2Q in International Beer Operations as we previously stated in our FY2010 results announcement.
� We are still confident to overperform the market and keep the impact of existing challenges in operating markets on margins limited.
FY2011 OUTLOOK
INTERNATIONAL BEER OPERATIONS

Soft Drink Operations

Black SeaBlack Sea
Kazakhstan16m
Kazakhstan16m
Iraq31mIraq31m
Iran75mIran75m
Uzbekistan29m
Uzbekistan29m
Turkmenistan5m
Turkmenistan5m
Afghanistan27m
Afghanistan27m
Pakistan186m
Pakistan186m
Saudi Arabia25m
Saudi Arabia25m
Tajikistan8m
Tajikistan8m
Kyrgyzstan6m
Kyrgyzstan6m
Syria23mSyria23m
Lebanon4m
Lebanon4m
Georgia 5m
Georgia 5m
Azerbaijan9m
Azerbaijan9m
KuwaitKuwait
Egypt79m
Egypt79m
Libya6m
Libya6m
Jordan6m
Jordan6m
Yemen24m
Yemen24m
Oman3m
Oman3m
U.A.E.5m
U.A.E.5m
QatarQatar
Source: EIU & TUIK & UNNote: 2010E PopulationSource: EIU & TUIK & UNNote: 2010E Population
OtherOther
CCICCI
Turkey74m
Turkey74m
Black Sea
Kazakhstan16m
Iraq31m
Iran75m
Uzbekistan29m
Turkmenistan5m
Afghanistan27m
Pakistan186m
Saudi Arabia25m
Tajikistan8m
Kyrgyzstan6m
Syria23m
Lebanon4m
Georgia 5m
Azerbaijan9m
Kuwait
Egypt79m
Libya6m
Jordan6m
Yemen24m
Oman3m
U.A.E.5m
Qatar
Source: EIU & TUIK & UNNote: 2010E Population
Other
CCI
Turkey74m
Operating Geography Soft Drinks Business
CCI PlantsCCI Plants
35
Turkey: 8 plantsInternational: 12 plants
15
20
25
30
35
40
45
0 20 40 60 80 100 120 140 160 180
Tajikistan
Afghanistan
Oman
Iraq
Pakistan
Yemen
Kyrgyzstan
Syria
Turkmenistan
Egypt
Azerbaijan
Jordan Saudi Arabia
South Africa
Kazakhstan
Turkey
Kuwait
UAEQatar
Russia
Italy
Poland
Greece
Hungary UK
SpainBulgaria
Germany
USA
Argentina
Mexico
Libya
36
Med
ian
Age
PerCap Consumption (L)
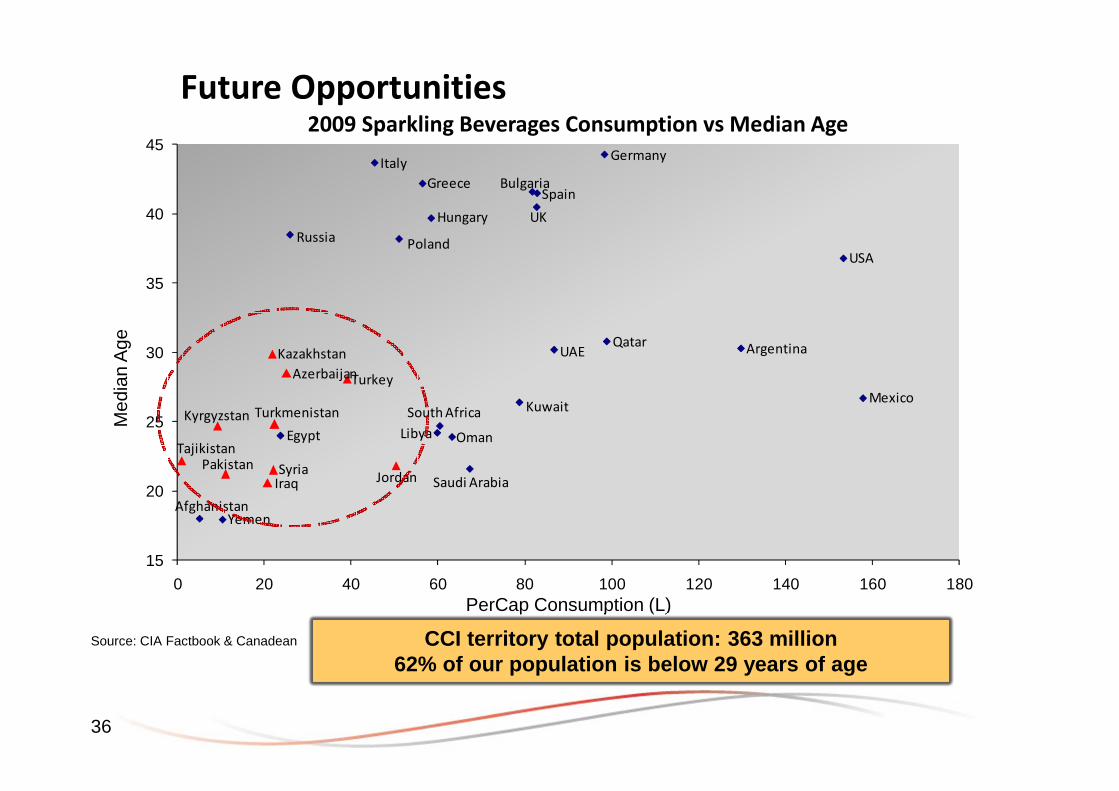
Source: CIA Factbook & Canadean
36
Future Opportunities2009 Sparkling Beverages Consumption vs Median Age
CCI territory total population: 363 million62% of our population is below 29 years of age
CCI territory total population: 363 million62% of our population is below 29 years of age

3737
Country Data
Population (mn) in
2010
% of population below 29
years
GDP per capita in 2010
($) **
Per capita consumption of sparkling bev. (L) in
2009
CCI’s market share in
sparkling bev. in 2010
2010 Volume (mn uc)
Volume Growth in
2010
Turkey 73.7 51% 10,079 40.3 69% 494 13%
Pakistan 185.5 65% 1,049 11.0 29% 118 8%
Kazakhstan 16.2 51% 8,326 21.9 34% 43 23%
Azerbaijan 9.0 51% 5,765 24.1 56% 32 19%
Iraq 31.4 68% 2,626 20.0 - 20 34%
Jordan 6.4 68% 4,435 53.0 12% 12 -10%
Turkmenistan 4.9 59% 3,663 21.3 - 11 85%
Kyrgyzstan 5.5 58% 816 9.3 - 8 21%
Syria 22.5 65% 2,892 23.0 9%* 5 -15%
Tajikistan 7.7 68% 732 1.0 - - -
Sources: IMF, EIU, UN Estimate, TCCC, Nielsen *MEMRB ** IMF

Geographic and Category Split of Business
38
Volume split (uc) - Geography(2010)
Volume split (uc) – International Operations(2010)
Volume split (uc) – Consolidated (2010)
Turkey
International
38
Turkey 74%
International 26%
Sparkling 72%
Still 20%
Tea 8%
Kazakhstan 24.06%
Kyrgyzstan 4.75%
Azerbaijan 18.69%
Turkmenistan 6.68%
Jordan 7.27%
Iraq 3.47%
Syria 1.40%
Pakistan 33.69%

Dynamic Growth in All Markets
INTERNATIONAL SOFT DRINKS VOLUME DEVELOPMENT
’06-’10 CAGR 21%
mu/
c
TURKEY SOFT DRINKS VOLUME DEVELOPMENT
’06-’10 CAGR 10%
mu/
c
4039

40
Turkey Pakistan
28.7%#2
Kazakhstan Azerbaijan Kyrgyzstan Jordan Iraq Syria
68.9%*#1
34.2%#1
56.2%#1
n.a.#1
12.2%#2
n.a. 8.9%#2
24.5%#1
1.1%#9
8.1%#3
6.1%#5
9.2%#2
9.6%#3
6.6%#3
54.5%#1
Leading Brands and Market Positions

Net Sales Revenue
Net Profit
EBITDA*
Soft Drink Operations’ Financial Performance*
* International Coca-Cola business fully consolidated starting from 2006m
illio
n T
RL
mill
ion
TR
L
mill
ion
TR
L
4341
’06-’10 CAGR 13%
’06-’10 CAGR 23%
*Full year EBITDA is as previously reported, not restated as per CMB’s newreporting format.
’06-’10CAGR 13%
16.1% 17.1% 16.6%15.3% 15.8%
12.0%10.5%

42
Thank You !Thank You !Thank You !Thank You !
Questions Please...Questions Please...Questions Please...Questions Please...

43
Appendix

44
2010/3 2011/3
SALES VOLUME (million hectoliters) 7.7 8.4
SALES 753.7 857.9
Cost of Sales (-) (380.1) (444.8)
GROSS PROFIT FROM OPERATIONS 373.6 413.1
Marketting, Selling and Distribution Expenses (-) (210.1) (246.1)General and Administrative Expenses (-) (84.4) (99.5)Other Operating Income 6.7 10.7Other Operating Expense (-) (8.2) (7.1)
PROFIT FROM OPERATIONS 77.6 71.1
Loss from Associates (2.8) (2.1)
Financial Income 49.2 65.5Financial Expense (-) (29.7) (51.3)
PROFIT BEFORE TAX FROM CONTINUING OPERATIONS 94.3 83. 1
Continuing Operations Tax Expense (-) (20.9) (27.6)
PROFIT FOR THE PERIOD 73.4 55.5
Attributable to:Minority Interest 1.9 1.8Net Income Attributable to Equity Holders of the Parent 71.5 53.7
EBITDA 159.1 157.8
Note 1: CCI's consoliated results are proportionately consolidated in Anadolu Efes' financial results as per its 50.3% shareholding.
ANADOLU EFES Consolidated Income Statements For the Three-Month Period Ended 31.03.2010 and 31.03.2011
Note 2: EBITDA comprises of Profit from Operations, depreciation and other relevant non-cash items up to Profit From Operations.
Prepared In Accordance with IFRS as per CMB Regulations(million TRL)

45
2010/12 2011/3 2010/12 2011/3Cash & Cash Equivalents 939.3 850.2 Short-term Borrowings 996.1 1,126.0Financial Investments 55.1 88.0 Trade Payables 253.3 332.7Trade Receivables 518.3 573.9 Due to Related Parties 8.6 6.2Due from Related Parties 0.3 0.1 Other Payables 290.8 314.3Other Receivables 7.9 21.1 Provision for Corporate Tax 15.3 26.1Inventories 467.9 602.6 Provisions 23.7 32.1Other Current Assets 152.0 199.2 Other Liabilities 169.3 190.2
Total Current Assets 2,140.8 2,335.0 Total Current Liabilities 1,757.2 2,027.6
Other Receivables 1.3 1.4 Long-term Borrowings 768.4 726.5Investments in Securities 37.5 31.7 Other Payables 144.4 146.3Investments in Associates 21.4 20.7 Provision for Employee Benefits 51.3 49.2Biological Assets 1.5 2.4 Deferred Tax Liability 42.8 43.7Property, Plant and Equipment 2,043.8 2,168.4 Other Liabilities 9.7 11.1Intangible Assets 361.9 372.9Goodwill 871.1 922.2
Deferred Tax Assets 40.0 45.4 Total Non-Current Liabilities 1,016.6 976.9Other Non-Current Assets 69.5 64.3
Total Non-Current Assets 3,448.0 3,629.2 Total Equity 2,815.0 2,959.7
Total Assets 5,588.8 5,964.2 Total Liabilities and Shareholders' Equity 5,588.8 5,964.2
Note 3: "Investment in Securities" in Current Assets includes the time deposits with a maturity more than three months.
Note 1: CCI's consolidated financial results are consolidated in Anadolu Efes' financial results by proportionate consolidation method as per Anadolu Efes' 50.3% shareholding in CCI.
Note 2: 7.5% of Alternatifbank shares held by Anadolu Efes is accounted at fair value and classified as ''Investment in Securities'' in Non-Current Assets part of the balance sheet.
(million TRL)
ANADOLU EFES Consolidated Balance Sheets as of 31.03.2011 and 31.12.2010Prepared In Accordance with IFRS as per CMB Regulations

46
2010/32011/3
Sale
s Volum
e (m
illion hectolitre
s)1.8
1.7
SA
LES
272.5
282.4G
RO
SS
PR
OFIT
FRO
M O
PE
RA
TION
S187.1
198.8P
RO
FIT FRO
M O
PE
RA
TION
S82.4
84.3F
inancial Income / E
xpense 6.5
6.8C
ON
TINU
ING
OP
ER
ATIO
NS
PR
OFIT B
EFO
RE
TAX
88.991.1
Provision for T
axes(15.8
)(21.5)
PR
OFIT FO
R T
HE
PE
RIO
D73.2
69.6
EB
ITDA
104.0107.6
2010/122011/3
Cash, C
ash equivalents and Investment in S
ecurities5
80.6580.3
Trade R
eceivables2
77.1297.8
Inventories9
6.0104.4
Other A
ssets2
2.929.9
Total C
urrent A
ssets
992.41,028.2
Investments
1,587.7
1,587.2P
roperty, Plant and E
quipment
375.3
374.5O
ther Assets
35.9
41.3T
otal Non-C
urrent A
ssets
2,010.22,017.7
Total A
ssets
3,002.63,045.9
Trade P
ayables5
3.053.1
Other Liabilities
206.5
219.9S
hort-term B
orrowings
325.1
370.5T
otal Curre
nt Liabilities
587.8649.2
Long-term B
orrowings
77.3
0.0O
ther Liabilities1
86.6191.5
Total N
on-Curre
nt Liabilities
263.9191.5
Share
holders' E
quity2,150.9
2,205.2
Total Liabilitie
s and Share
holders' E
quity3,002.6
3,045.9
TU
RK
EY
BE
ER
OP
ER
AT
ION
SH
ighlighted Incom
e S
tatem
ent Ite
ms For the
Three
-Month P
eriod E
nded 31.03.2010 and 31.03.2011
Note: A
nadolu Efes subsidiaries, excluding brew
ing and malt production subsidiaries in T
urkey, are stated on cost basis in order to provide m
ore comprehensive presentation.
Note
:E
BIT
DA
comprises
ofP
rofitfro
mO
perations(excludin
gother
operatingincom
e/expensearising
fromA
nadoluE
fes'
holdingnature), depreciation and other relevant non-cash i
tems up to P
rofit F
rom O
perations.
TU
RK
EY
BE
ER
OP
ER
AT
ION
SH
ighlighted B
alance S
hee
t Item
s as of 31.03.2011 and 31.12.2010
Pre
pared In A
ccordance w
ith IFRS
as per C
MB
Re
gulations
(million TR
L)
Pre
pared In A
ccordance w
ith IFRS
as per C
MB
Re
gulations (m
illion TR
L)
47
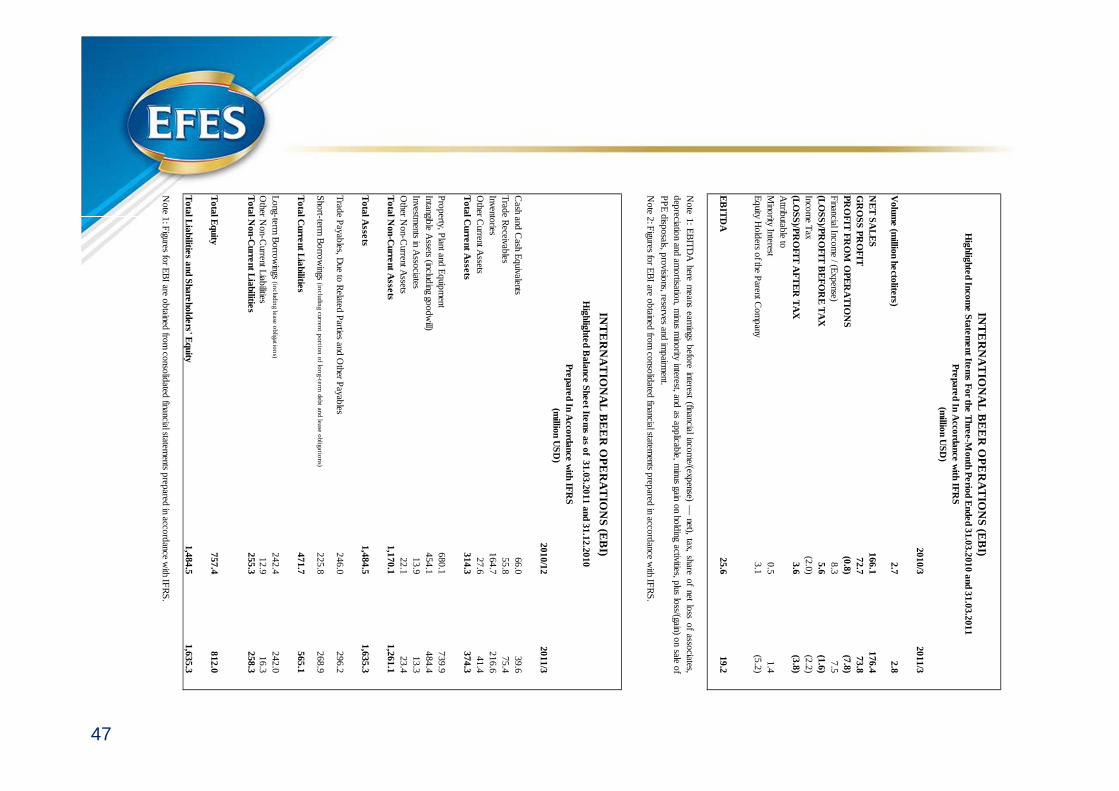
2010/32011/3
Volum
e (m
illion hectolite
rs)2.7
2.8
NE
T SA
LES
166.1
176.4G
RO
SS
PR
OFIT
72.773.8
PR
OFIT FR
OM
OP
ER
ATIO
NS
(0.8)(7.8)
Financial Incom
e / (Expense)
8.3
7.5
(LOS
S)/P
RO
FIT BE
FOR
E TA
X5.6
(1.6) Inco
me T
ax(2
.0)(2
.2) (LO
SS
)/PR
OFIT A
FTER
TAX
3.6 (3.8)
Attributable to
Mino
rity Interest0
.51
.4E
quity H
olders o
f the Parent C
ompany
3.1
(5.2)
EB
ITDA
25.6 19.2
2010/122011/3
Cash and
Cash E
quivalents66
.039
.6T
rade Receivables
55.8
75.4
Inventories1
64.7
216
.6O
ther Current A
ssets27
.641
.4Total C
urrent A
ssets
314.3374.3
Pro
perty, Plant and
Equip
ment
680
.17
39.9
Intangible A
ssets (including go
odwill)
454
.14
84.4
Investments in A
ssociates13
.913
.3O
ther Non-C
urrent Assets
22.1
23.4
Total Non-C
urrent A
ssets
1,170.11,261.1
Total Asse
ts1,484.5
1,635.3
Trade P
ayables, D
ue to Related P
arties and Other P
ayab
les2
46.0
296
.2
Short-term
Bo
rrow
ings (including curre
nt p
ortio
n o
f lon
g-term
debt a
nd lea
se o
bligatio
ns)
225
.82
68.9
Total Curre
nt Liabilities
471.7565.1
Long-term
Borrow
ings (includin
g lea
se o
bligatio
ns)
242
.42
42.0
Other N
on-Current Liabilities
12.9
16.3
Total Non-C
urrent Liabilitie
s255.3
258.3
Total Equity
757.4812.0
Total Liabilities and S
hareholde
rs' Equity
1,484.51,635.3
Note 2
: Figures for E
BI are ob
tained from consolida
ted financial statem
ents prepared in accordance w
ith IF
RS
.
INT
ER
NA
TIO
NA
L BE
ER
OP
ER
AT
ION
S (E
BI)
Highlighte
d Income
State
me
nt Item
s For the Thre
e-M
onth Pe
riod Ende
d 31.03.2010 and 31.03.2011
Note
1:E
BIT
DA
herem
eansearnings
beforeinterest
(financialinco
me/(exp
ense)—
net),tax,
shareof
netlo
ssof
associates,
dep
reciation
andam
ortisation,m
inusm
inorityinterest,a
ndas
applicable,
minus
gainon
holding
activities,pluslos
s/(gain)o
nsale of
PP
E disposals, p
rovisions, reserves and im
pairm
ent.
Pre
pared In A
ccordance w
ith IFRS
(m
illion US
D)
Note 1
: Figures for E
BI are ob
tained from consolida
ted financial statem
ents prepared in accordance w
ith IF
RS
.
INT
ER
NA
TIO
NA
L BE
ER
OP
ER
AT
ION
S (E
BI)
Highlighte
d Balance
She
et Ite
ms as of 31.03.2011 a
nd 31.12.2010
Pre
pared In A
ccordance w
ith IFRS
(m
illion US
D)
48
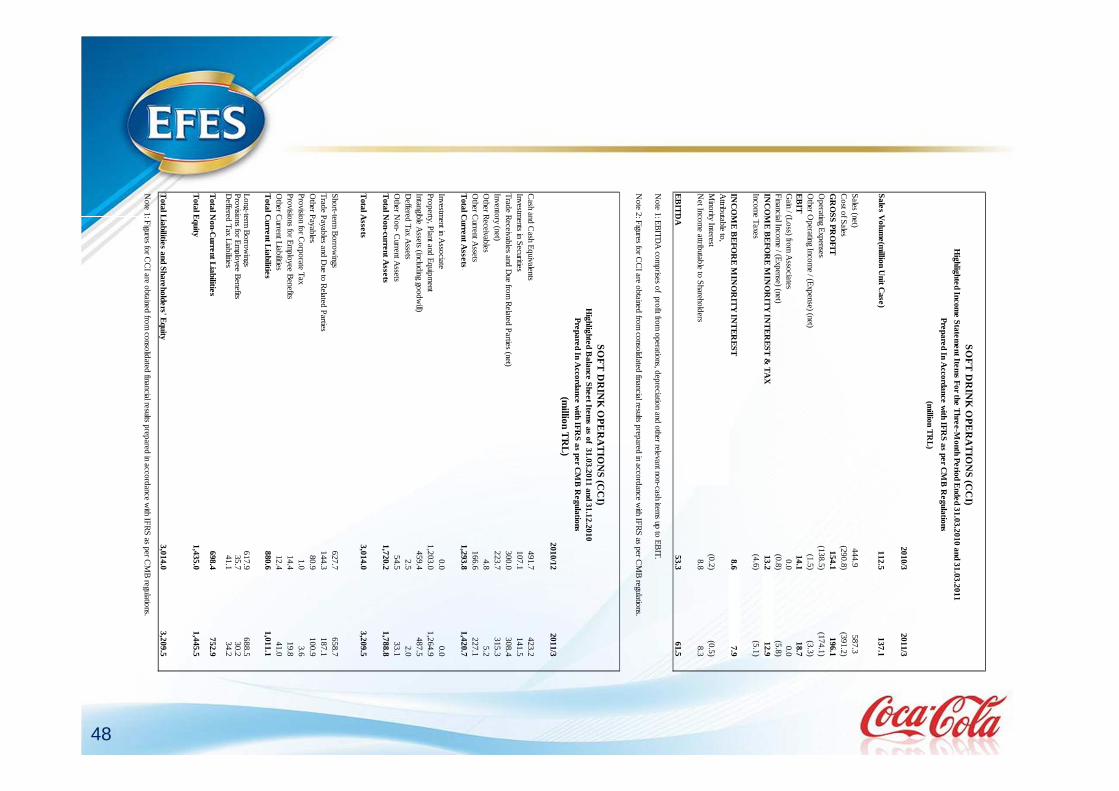
2010/32011/3
Sale
s Volum
e(m
illion Unit C
ase)
112.5137.1
Sa
les (net)44
4.9
587
.3
Co
st of S
ales
(290.8)
(39
1.2)
G
RO
SS
PR
OFIT
154.1196.1
Op
erating Expenses
(138.5)
(174
.1)O
ther Op
erating Incom
e / (Expense) (net)
(1.5)(3
.3)
EB
IT14.1
18.7G
ain / (Loss) from
Associa
tes0
.00.0
Financial Inco
me
/ (Expense) (net)
(0.8)(5
.8)
INC
OM
E B
EFO
RE
MIN
OR
ITY INT
ER
ES
T & TA
X13.2
12.9 Incom
e Ta
xes(4.6)
(5.1
)
INC
OM
E B
EFO
RE
MIN
OR
ITY INT
ER
ES
T8.6
7.9 A
ttributa
ble to
,M
inority Interest
(0.2)(0
.5)
Ne
t Incom
e attributab
le to Shareho
lders
8.8
8.3
EB
ITD
A53.3
61.5
2010/122011/3
Cash and
Cash E
quivalents 4
91.7
42
3.2Investm
ents in Se
curities
107
.11
41.5
Trad
e Rece
ivables a
nd D
ue from
Rela
ted P
arties (net)
300
.03
08.4
Inventory (net)
223
.73
15.3
Other R
eceivable
s4
.85.2
Other C
urrent A
ssets1
66.6
22
7.1T
otal Curre
nt Asse
ts1,293.8
1,420.7
Investment in A
ssociate
0.0
0.0P
rope
rty, Pla
nt and
Eq
uipment
1,2
03.0
1,2
64.9
Intangible Asse
ts (including good
will)
459
.44
87.5
Deffered
Tax A
ssets
2.5
2.0O
ther No
n- Curre
nt Assets
54.5
33.1
Total N
on-current A
ssets
1,720.21,788.8
Total A
ssets
3,014.03,209.5
Short-term
Borro
wings
627
.76
58.7
Trad
e Pa
yables a
nd D
ue to Related
Parties
144
.31
87.1
Other P
ayables
80.9
10
0.9P
rovision fo
r Corpo
rate Tax
1.0
3.6P
rovisions fo
r Em
plo
yee Benefits
14.4
19.8
Other C
urrent Lia
bilities12
.44
1.0T
otal Curre
nt Liabilities
880.61,011.1
Long-term
Bo
rrowings
617
.96
88.5
Pro
visions for E
mp
loyee B
enefits35
.73
0.2D
effered T
ax Liabilities
41.1
34.2
Total N
on-Curre
nt Liabilities
698.4752.9
Total E
quity1,435.0
1,445.5
Total Liabilitie
s and Share
holders' E
quity3,014.0
3,209.5
SO
FT
DR
INK
OP
ER
AT
ION
S (C
CI)
Highlighte
d Income
State
me
nt Item
s For the T
hree
-Month P
eriod E
nded 31.03.2010 and 31.03.2011
No
te 1
: EB
ITD
A co
mprises o
f profit fro
m o
perations
, dep
reciatio
n and o
ther rele
vant non-cash item
s up to
EB
IT.
SO
FT
DR
INK
OP
ER
AT
ION
S (C
CI)
Pre
pared In A
ccordance w
ith IFRS
as per C
MB
Re
gulations
(million T
RL)
No
te 2
: Figures for C
CI a
re o
btained
from
consolid
ated fina
ncial results p
repared in a
ccord
ance with I
FR
S as per C
MB
regulations.
Pre
pared In A
ccordance w
ith IFRS
as per C
MB
Re
gulations
(millio
n TR
L)
No
te 1
: Figures for C
CI a
re o
btained
from
consolid
ated fina
ncial results p
repared in a
ccord
ance with I
FR
S as per C
MB
regulations.
Highlighte
d Balance
She
et Ite
ms as of 31.03.2011 a
nd 31.12.2010

Hot tea category constitutes 49% of alcohol-free beverages
49
Turkey AFB Market
Source: Canadean, 2009
AFB Market (exc. milk) 4.9 billion uc
RTD AFB Market (exc. milk)1.1 billion uc
HOD25%
RTD AFB23%
Hot Coffee2%
Tea49%
Powder & Concentrate
1% Sparkling Beverages
46%
Bottled Water32%
Ayran3%
Fruit Juice&Still
Drinks12%
Sparkling Water
6%Other1%
![[NESCAFE ALEGRIA A630 VERSION 1.0] - rheavendors.surheavendors.su/wp-content/uploads/...NESCAFE-ALEGRIA-A630-VERS… · nescafe alegria a630 version 1.0 nescafe alegria a630 version](https://img.dokumen.tips/doc/110x75/5aa0385a7f8b9a67178decf4/nescafe-alegria-a630-version-10-nescafe-alegria-a630-version-10-nescafe.jpg)