Embed Size (px)
Citation preview

ADVERTIMENT. Lʼaccés als continguts dʼaquesta tesi queda condicionat a lʼacceptació de les condicions dʼúsestablertes per la següent llicència Creative Commons: http://cat.creativecommons.org/?page_id=184
ADVERTENCIA. El acceso a los contenidos de esta tesis queda condicionado a la aceptación de las condiciones de usoestablecidas por la siguiente licencia Creative Commons: http://es.creativecommons.org/blog/licencias/
WARNING. The access to the contents of this doctoral thesis it is limited to the acceptance of the use conditions setby the following Creative Commons license: https://creativecommons.org/licenses/?lang=en

1
TESIS DOCTORAL
EFECTOS FISIOLÓGICOS DE DIFERENTES ESTRATEGIAS
VENTILATORIAS EMPLEADAS EN PACIENTES CON INSUFICIENCIA
RESPIRATORIA AGUDA SEVERA
DOCTORANDO
HERNÁN MARCELO AGUIRRE BERMEO
DIRECTOR DE TESIS
JORDI MANCEBO CORTÉS
TUTOR DE TESIS
JORDI VALLÈS DAUNIS
PROGRAMA DE DOCTORADO EN MEDICINA
DEPARTAMENTO DE MEDICINA
LINEA DE INVESTIGACIÓN
PATOLOGÍA RESPIRATORIA
UNIVERSIDAD AUTONOMA DE BARCELONA
2018

2
PRESENTACION
En conformidad a la Normativa académica de la Universidad Autónoma de
Barcelona aplicable a los estudio universitarios regulados por el RD 1393/2007
y habiendo sido aprobada la admisión del doctorando en el nuevo programa de
doctorado (RD99), la presente tesis se articula por compendio de
publicaciones.
Las publicaciones que conforman esta tesis están alineadas en determinar los
efectos fisiológicos de dos estrategias habitualmente utilizadas en pacientes en
ventilación mecánica con insuficiencia respiratoria aguda severa: el
alargamiento de la pausa inspiratoria y la posición en decúbito prono. En estas
investigaciones se realiza un razonamiento fisiopatológico de sus efectos en la
mecánica respiratoria e intercambio de gases y un análisis de su importancia
clínica, justificando su uso y probable influencia en los resultados clínicos.
La relativa sencillez e inocuidad de las maniobras facilita su aplicación en el
manejo clínico diario de estos pacientes y la información encontrada puede
servir de base para futuros estudios y ampliar su uso en otro tipo de pacientes
y patologías.
3
AGRADECIMIENTOS
Debo agradecer a cada persona que ha estado a mi lado durante todo el
tiempo que ha tomado la ejecución de estos trabajos, seria imposible nombrar
a todos pero en las siguientes líneas espero reflejar mis sentimientos y
agradecimiento a cada uno de Ustedes, sinceramente, muchas gracias a todos.
Los estudios serian imposibles de realizar sin la colaboración, comprensión y
ayuda de los pacientes y sus familias, gracias por comprender que la intención
de estos trabajos siempre fue buscar soluciones y nuevas opciones
terapéuticas para sus enfermedades y que estoy seguro servirán para que en
el futuro mejore el tratamiento de las mismas, gracias familias, gracias
pacientes.
Dios ha sido y seguirá siendo mi soporte, gracias Dios por mostrarme ese
camino, por darme las fuerzas, el entendimiento y el valor en cada momento
que lo necesité, gracias Dios.
Cada paso que he dado en mi vida y cada meta cumplida no ha sido mi mérito,
humildemente soy lo que he llegado a ser y estar donde estoy, gracias al gran
ejemplo y guía de mis Padres, sin ellos, sin sus consejos, enseñanzas y ayuda
hubiese sido imposible lograrlo, gracias Papis.
Ya es mucho tiempo que caminamos juntos y siempre he sentido su apoyo
incondicional y la comprensión que se requiere para poder ejercer esta
profesión que hemos elegido, gracias compañera y amiga, gracias Gabriela.
Espero algún día leas estas líneas, que sepas que todo esto lo hice por vos.
Las últimas líneas de estos trabajos se escribieron cargándote en mis brazos,
gracias por ser mi motor y por ser mi razón de ser, gracias hijo mío, gracias
Pablo.

4
Eres y siempre serás mi gran Jefe, gente como vos hay pocas en el mundo,
gracias por tu paciencia, tu tiempo y todas tu enseñanzas que me sirven cada
día, en cada paciente que valoro y en cada decisión y situación que enfrento.
Pero sobre todo gracias por tu amistad, gracias Jefe, gracias Jordi.
Un agradecimiento especial por toda la ayuda y apoyo incondicional en cada
paso de la elaboración de esta tesis, muchas gracias Jordi Vallès.
Cada uno de los coautores de los trabajos me supieron enseñar que la vida, la
medicina, la investigación y las madrugadas son mucho mas fáciles si tienes a
tu lado a grandes amigos. Esta tesis lo mejor que me deja son grandes
amistades, y este tipo de amistades son muy difíciles de encontrar, gracias
Squadra Fortissimi, gracias amigos.
El Servicio de Medicina Intensiva del Hospital de la Santa Creu i Sant Pau está
lleno de personas con una calidad humana y profesional invaluable, debo
agradecer a cada uno de ellos, a mis maestros y adjuntos, a mis compañeros
de residencia, a todos los enfermeros y enfermeras, a los auxiliares y al
personal de servicios generales, de cada uno aprendí todo lo que se, gracias
por su ayuda, gracias por su comprensión y gracias por su amistad.

5
A mi ejemplo y soporte; mis Padres,
A mi apoyo incondicional y compañera eterna; mi Esposa,
A mis fuerzas y mi todo; mi Hijo.

6
LISTADO DE ABREVIACIONES
CRF: capacidad funcional residual
Crs: compliancia estática del sistema respiratorio
EELV: volumen pulmonar al final de la espiración, del ingles, end-expiratory
Lung Volume
EtCO2: dióxido de carbono exhalado al final de la espiración
FiO2: fracción inspirada de oxigeno
FC: frecuencia cardiaca
PaO2: Presión parcial de oxigeno en sangre arterial
PaCO2: Presión parcial de dióxido de carbono en sangre arterial
PAM: presión arterial media
PBW: Peso Predicho
PEEP: Presión positiva al final de la espiración
PEEPi: Presión positiva intrínseca al final de la espiración
Pmedia: presión media
PP: Posición prono
Ppeak: presión pico
Pplat: presión plateau
P(a-et)CO2: gradiente de CO2 entre valor arterial y valor exhalado
Raw: resistencia de vías aéreas
SDRA: Síndrome de distres respiratorio agudo
UCIs: Unidades de Cuidados Intensivos
Vdfis: espacio muerto fisiológico
Vd/Vt: fracción de espacio muerto

7
VM: Ventilación mecánica
Vrec: volumen pulmonar reclutado inducido por la PEEP, del ingles, PEEP-
induced lung volumen recruitment
Vt: Volumen corriente
∆Paw: presión de distensión estática del sistema respiratorio.

8
INDICE DE CONTENIDOS
1. RESUMEN …………………………………………………………………… 9
2. RESUMEN EN INGLÉS …………………………………………………… 10
3. INTRODUCCIÓN …………………………………………………..………. 11
4. HIPÓTESIS …………………………………………………………………. 16
5. OBJETIVOS
a. Objetivo principal …………………………………………………… 17
b. Objetivos secundarios ……………………………………...……… 17
6. MÉTODOS ………………………………………………………………….. 18
7. ARTÍCULOS ORIGINALES ACEPTADOS POR LA COMISIÓN
ACADÉMICA DEL PROGRAMA DE DOCTORADO EN
MEDICINA E INCLUIDOS EN LA TESIS
a. Primer artículo: “End‑inspiratory pause prolongation in acute
respiratory distress syndrome patients: effects on gas exchange
and mechanics.” ………………………………………………….… 22
b. Segundo artículo: “Lung volumes and lung volume recruitment in
ARDS: a comparison between supine and prone position.” …... 31
8. RESULTADOS …………………………………………………………..…. 45
9. DISCUSIÓN ……………………………………………………………...…. 49
10. CONCLUSIONES ……………………………………………………….…. 55
11. IMPLICACIONES FUTURAS …………………………………………..…. 56
12. BIBLIOGRAFIA …………………………………………………………..… 57

9
1. RESUMEN
Los estudios realizados en la presente tesis están alineadas en determinar los
efectos fisiológicos de dos estrategias utilizadas en pacientes en ventilación
mecánica con insuficiencia respiratoria aguda severa. Las estrategias
analizadas son habitualmente utilizadas en estos pacientes. El primer estudio
presentado es sobre el alargamiento de la pausa inspiratoria. En este estudio
se ha confirmado que el alargamiento de la pausa inspiratoria disminuye
significativamente el espacio muerto y la PaCO2. Con este estudio, se
proporciona una aplicación clínica de esta estrategia, ya que, la disminución de
la PaCO2 permite disminuir el volumen corriente administrado y ayudar a la
ventilación protectiva. El segundo estudio presentado es sobre la variación de
los volúmenes pulmonares y el strain (deformación del tejido pulmonar causado
por el cambio de volumen) con el cambio de posición de supino a prono. Este
estudio ha permitido demostrar que los volúmenes pulmonares aumentan
significativamente en la posición prono y disminuye significativamente el strain
dinámico sobre el tejido pulmonar. Estos hallazgos pueden explicar la mejoría
de los resultados clínicos con el uso de la posición prono en pacientes con
síndrome de distres respiratorio agudo grave. La relativa sencillez e inocuidad
de las estrategias estudiadas facilita su aplicación en el manejo clínico diario de
estos pacientes y la información encontrada puede servir de base para futuros
estudios y ampliar su uso en otro tipo de pacientes y patologías.

10
2. RESUMEN EN INGLES
The studies described in this thesis are about the physiological effects of two
common strategies that are used in mechanically ventilated patients with acute
severe respiratory failure. The first study was about the prolongation of
inspiratory pause. This study confirmed that the prolongation of inspiratory
pause significantly decreased dead space and PaCO2. Indeed, this study
provides a clinical application of this strategy, because the decrease of the
PaCO2 allows a significant decrease of tidal volume and helps to set the
protective ventilation. The second study analysed the variation of lung volumes
and strain with the change from supine position to prone position. This study
showed a significant increase in lung volumes and a significant decrease of
strain in prone position. These findings could explain the improvement of
outcomes with prone position in severe acute respiratory distress syndrome
patients. The relative simplicity and safety of these strategies facilitates its
application at the bedside. These data could form the basis for future studies in
other types of patients and pathologies.

11
3. INTRODUCCIÓN
La insuficiencia respiratoria aguda es consecuencia de una alteración en el
intercambio gaseoso que produce una incapacidad de mantener niveles
correctos de presión parcial de oxigeno (PaO2) y de presión parcial de dióxido
de carbono (PaCO2) en sangre arterial.
En los pacientes en los que, a pesar del aporte externo de oxigeno y el
tratamiento de la enfermedad desencadenante, persiste la insuficiencia
respiratoria y se acompaña con deterioro clínico (apnea, fatiga muscular,
alteración de consciencia, disnea extrema, trastornos hemodinámicos, etc) que
no permite mantener un equilibrio gasométrico y acido-base adecuado, se debe
considerar el inicio de ventilación mecánica (VM).
La VM es uno de los procedimientos más comunes en las unidades de
cuidados intensivos. En pacientes con insuficiencia respiratoria aguda la VM se
convierte en la base fundamental de su tratamiento. El objetivo inicial de la VM
es ayudar en el intercambio gaseoso y reducir el trabajo respiratorio, mientras
se resuelva la patología de base que causó la necesidad de su inicio. Sin
embargo, su uso por tiempo prolongado se relaciona con complicaciones y
peores desenlaces clínicos.
Esteban et al. (1-3) diseñaron 3 estudios de cohortes sobre el uso de la VM y
los resultados clínicos de pacientes ingresados en las unidades de cuidados
intensivos (UCIs) en los años 1998, 2004 y 2010. Estos estudios evidenciaron
un aumento progresivo del uso de la ventilación mecánica no invasiva y el uso
de volúmenes corrientes mas pequeños con el paso de los años. El último
estudio realizado en el 2010 (3) evidenció que el 35% de pacientes ingresados
en las unidades de cuidados necesitaron VM y el 54% de pacientes en VM

12
desarrollaron al menos una complicación relacionada con VM. En este mismo
estudio, se demostró que la modalidad ventilación asistida controlada por
volumen es el modo mas utilizado seguido por la ventilación con presión de
soporte. Los tres estudios del mismo grupo de investigación (1-3) demostraron
una disminución progresiva de la mortalidad de los pacientes en VM siendo del
31% en 1998 al 28% en el año 2010.
La expresión más catastrófica de la insuficiencia respiratoria aguda es el
Síndrome de distres respiratorio agudo (SDRA). El SDRA se caracteriza por un
edema alveolar a causa de un aumento de la permeabilidad de la membrana
alveolo capilar que produce hipoxemia, junto con una disminución del volumen
pulmonar y de la compliancia del sistema respiratorio (Crs) (4, 5). Desde su
definición inicial realizada por Ashbaugh et al. (6) in 1967, múltiples definiciones
han sido publicadas por diferentes consensos de expertos. La definición actual
se basa en el último consenso de expertos realizado en el año 2012 (7). Esta
definición llamada la “clasificación del SDRA de Berlín” disminuye las
limitaciones de anteriores definiciones, que no tenían en cuenta los distintos
niveles de gravedad, y añadir como requisito la presencia de parámetros
ventilatorios mínimos (PEEP de al menos 5 cmH2O) para su identificación. La
clasificación de Berlín se basa en 4 pilares fundamentales; 1) la presencia de
una causa que explique la enfermedad en un periodo de 1 semana, 2)
opacidades bilaterales en la radiografía de tórax no explicada por derrames,
colapso pulmonar o nódulos, 3) edema alveolar no explicado por falla cardiaca
o sobrecarga hídrica y 4) intercambio gasométrico que la subdivide en 3
categorías: SDRA leve con PaO2/FIO2 >200 mmHg y ≤ 300 mmHg con presión
positiva al final de la espiración (PEEP) ≥ 5 cmH2O, SDRA moderado con

13
PaO2/FIO2 >100 mmHg y ≤ 200 mmHg con PEEP >5 cmH2O y SDRA Severo
con PaO2/FIO2 ≤ 100 mmHg con PEEP >5 cmH2O.
Recientemente Bellani et al. (8), realizaron un estudio multicéntrico que incluyó
a todos los pacientes con ventilación mecánica durante 4 semanas
consecutivas en UCIs de todo el mundo. Este estudio evidenció que el 10.4%
de los pacientes incluidos cumplieron los criterios de SDRA según la definición
de Berlín. La prevalencia fue del 30%, 47% y 23% para SDRA leve, moderado
y severo respectivamente. En este estudio la gravedad del SDRA se asoció con
un mayor numero de días de VM y de días en las UCIs. De igual manera la
mortalidad se asoció con la severidad del SDRA siendo: del 30%, 35% y 43%
para el SDRA leve, moderado y severo respectivamente.
El uso de adecuados parámetros ventilatorios y estrategias ventilatorias es
fundamental para disminuir el daño pulmonar inducido por la ventilación y
mejorar los desenlaces clínicos. En este contexto, la denominada ventilación
mecánica protectiva que consiste en el uso de volúmenes corrientes (Vt) bajos
y niveles de PEEP moderados-altos se ha relacionado con una disminución de
la mortalidad (9, 10). Sin embargo, el uso de Vt bajos puede producir
hipercapnia y secundariamente hipertensión pulmonar con disfunción
ventricular derecha (11) y eventualmente cor pulmonar agudo (12). El aumento
de la frecuencia respiratoria y el uso de humidificadores activos han sido
descritos como opciones para disminuir la hipercapnia (13, 14). Otra maniobra
que ha demostrado aumentar significativamente la eliminación de la PaCO2
disminuyendo la hipercapnia y el espacio muerto fisiológico es el alargamiento
de la pausa inspiratoria (15-20). Estos trabajos sobre el alargamiento de la
pausa inspiratoria han estudiado los efectos fisiológicos de ésta maniobra en el

14
intercambio gaseoso pero no han explorado su potencial uso clínico. De esta
manera, la primera estrategia estudiada en la presente tesis es el uso clínico
que puede tener el alargamiento de la pausa inspiratoria. Considerando que el
alargamiento de la pausa inspiratoria disminuye de la PaCO2, esta estrategia
permitiría una disminución del Vt administrado, constituyendo otra herramienta
para ayudar en la ventilación mecánica protectiva y con los consecuentes
beneficios en la mecánica respiratoria de los pacientes con SDRA.
Otra estrategia que ha demostrado mejorar los desenlaces clínicos en
pacientes con SDRA grave es la posición prono (PP) (21). La mejoría en los
desenlaces clínicos no parece estar relacionado con la mejoría de la
oxigenación (22), sino también a un efecto protector en la lesión inducida por la
ventilación (22-24). La PP produce una distribución homogénea del gas
inspirado mejorando el índice ventilación perfusión (25) y actúa de manera
sinérgica con la PEEP disminuyendo el porcentaje de tejido pulmonar no
aireado y pobremente aireado (26-28). La PEEP ayuda también a mantener
reclutamiento alveolar (29). El volumen pulmonar reclutado inducido por la
PEEP, “del ingles, PEEP-induced lung volume recruitment (Vrec)” puede ser
medido mediante tomografía axial computarizada (30), curvas de presión
volumen (31) o el método de lavado de nitrógeno (32). En la actualidad la
información sobre la variación del Vrec con el cambio de posición de supino a
prono es escasa.
El uso de la PP ha aumentado con el paso de los años. Bellani et al. (8) en un
estudio multicéntrico observacional sobre VM en pacientes con SDRA
encontraron un uso de niveles de PEEP de alrededor de 12 cmH2O y que se
utilizó la PP en el 16% de pacientes con SDRA grave. En un estudio mas

15
reciente realizado por Guerin et al. (33) sobre el uso de PP en pacientes con
SDRA evidenció un uso de PP en el 6%, 10% y 33% de pacientes con SDRA
leve, moderado y severo respectivamente, una duración de la primera sesión
de prono de 18 horas y con un 12% de complicaciones (ulceras, hipoxemia,
aumento de presión intracraneal, lesiones oculares y retiro o movilización
accidental del tubo endotraqueal).
La PP puede aumentar los volúmenes pulmonares y de esta manera disminuir
la tensión excesiva y deformación del tejido pulmonar determinados por el
stress (presión transpulmonar) y strain (por el cambio de volumen pulmonar)
(34, 35). Los dos volúmenes pulmonares que han sido estudiados con el
cambio de posición en trabajos previos son el volumen pulmonar al final de la
espiración (volumen pulmonar medido con PEEP) “del ingles, end-expiratory
Lung Volume (EELV)” y la capacidad residual funcional (CRF) (36-40). Sin
embargo, la información sobre la variación de los volúmenes en pacientes con
SDRA con el cambio de posición es contradictoria. De igual manera, un solo
estudio (27) ha analizado la variación del Vrec con el cambio de posición, sin
encontrar diferencias del Vrec en ambas posiciones. En este contexto, y
considerando que esta información es fundamental para comprender los
efectos fisiológicos de la posición prono, la segunda estrategia estudiada en la
presente tesis es la variación de los volúmenes pulmonares, del Vrec y del
strain con el cambio de posición. Estos hallazgos ayudarían a explicar uno de
los mecanismos protectores de la PP y su influencia en los desenlaces clínicos.

16
4. HIPÓTESIS
El análisis de los efectos fisiológicos y la aplicación clínica de las dos
estrategias estudiadas pueden facilitar la ventilación mecánica protectiva y
explicar la influencia en los desenlaces clínicos de los pacientes con
insuficiencia respiratoria aguda severa. El alargamiento de la pausa inspiratoria
puede permitir disminuir significativamente el volumen corriente administrado
manteniendo los mismos niveles de PaCO2. La posición prono, puede
aumentar los volúmenes pulmonares y disminuir el strain en el tejido pulmonar
constituyendo un mecanismo que podría explicar la mejoría de los desenlaces
clínicos.

17
5. OBJETIVOS
OBJETIVO PRINCIPAL
Analizar los efectos fisiológicos de dos estrategias ventilatorias empleadas en
pacientes con insuficiencia respiratoria aguda severa
OBJETIVOS SECUNDARIOS
1. Confirmar que el alargamiento de la pausa inspiratoria disminuye
significativamente la PaCO2 y proporcionar una aplicación clínica de esta
maniobra al disminuir significativamente el volumen corriente
administrado.
2. Estudiar la variación de los volúmenes pulmonares y del strain en el
tejido pulmonar inducido por el cambio de posición de decúbito supino a
decúbito prono.

18
6. MÉTODOS
Todos los pacientes incluidos en los dos estudios cumplieron los criterios para
ADRS según la clasificación de Berlín (7). Fueron excluidos pacientes con <18
años, embarazadas, pacientes con inestabilidad hemodinámica o térmica
(variación de temperatura mayor de 0.5ºC en la última hora). Todos los
pacientes estuvieron con sedación, analgesia continua y bloqueantes
neuromusculares. Los estudios fueron realizados en la UCI del Hospital de la
Santa Creu i Sant Pau, Barcelona (España). El comité de ética institucional
aprobó los estudios y los pacientes o sus familiares firmaron el consentimiento
informado.
En el estudio de alargamiento de la pausa inspiratoria se incluyeron 14
pacientes. Un paciente fue excluido por presentar fiebre, taquipnea e
inestabilidad del dióxido de carbono exhalado al final de la espiración (EtCO2).
El protocolo del estudio constó de 3 fases consecutivas:
1. Primera fase (Fase basal): Medidas realizadas con parámetros basales
pautados por el médico responsable.
2. Segunda fase (Alargamiento de pausa inspiratoria): La pausa inspiratoria
fue alargada hasta obtener uno de los siguientes parámetros: a)pausa
inspiratoria de 0.7sg, b)PEEP intrínseca ≥ 1cmH2O o c) Relación
inspiración-espiración de 1:1.
3. Tercera Fase (disminución de Vt): Disminución progresiva de Vt (de
30ml en 30ml) hasta obtener una PaCO2 similar a la basal.
Se mantuvo a los pacientes durante 60 minutos en cada fase. Las medidas de
mecánica respiratoria, intercambio de gases y hemodinámia fueron recogidas

19
al final de cada fase. La medición del espacio muerto se realizó mediante la
recolección del aire espirado durante 3 minutos en la bolsa de Douglas y fue
calculado usando la modificación de Enghoff de la ecuación de Bohr (41):
Vd/Vt= (PaCO2 – PeCO2)/PaCO2.
En el estudio de volúmenes pulmonares se incluyeron a 23 pacientes, 1
paciente fue excluido por presentar hipoxemia durante el estudio y 2 pacientes
fueron excluidos por problemas técnicos en la medición de los volúmenes
pulmonares.
Debido a que en una fase del estudio consiste medidas de volúmenes sin
PEEP, para evitar la hipoxemia durante esta fase, los pacientes fueron
incluidos cuando tenían una mejoría de su intercambio gaseoso (FiO2 ≤ 0.6 and
PEEP ≤ 12 cmH2O) y se incrementó la FiO2 a 0.8 una hora antes del inicio del
estudio.
Los parámetros ventilatorios pautados y la indicación de pronación en estos
pacientes fue realizada por el medico responsable y de acuerdo al protocolo del
Servicio. Los parámetros ventilatorios, de intercambio gaseoso y
hemodinámicos fueron registrados justo antes de empezar el protocolo. El
protocolo del estudio constó de 4 pasos consecutivos:
1. Medida del EELV, corresponde al volumen pulmonar con PEEP.
2. Retiro de PEEP.
3. Medida de CRF, corresponde al volumen pulmonar sin PEEP.
4. Medida del Vt necesario para generar una Presión Plateau igual a la
PEEP basal (ver Figura 1) (31, 32, 42-44).

20
Al finalizar el paso 4, se volvió a pautar la PEEP basal. Estos pasos fueron
realizados primero en posición supino, luego el paciente fue colocado en
posición prono y una hora después se realizaron los mismo pasos en posición
prono.
El resto de volúmenes pulmonares y el strain se calcularon con las siguientes
ecuaciones (32, 45, 46):
a) Incremento del volumen pulmonar inducido por la PEEP (o delta de
EELV) = EELV – CRF.
b) Vrec = Incremento del volumen pulmonar inducido por la PEEP – Vt
necesario para generar una Presión Plateau igual a la PEEP (también se
puede expresar como delta de EELV – [PEEP x Crs en ZEEP]).
c) Strain Dinámico sin PEEP = Vt / CRF.
d) Strain Dinámico con PEEP = Vt / (CRF + Vrec).
e) Strain Estático con PEEP = (EELV – CRF) / (CRF + Vrec)
f) Strain Global con PEEP = (strain estático con PEEP + strain dinámico) =
(EELV – CRF + Vt) / (CRF + Vrec).
Los volúmenes pulmonares fueron medidos con la técnica de lavado de
nitrógeno “washout/washin” como ha sido descrito previamente (32, 47).

21
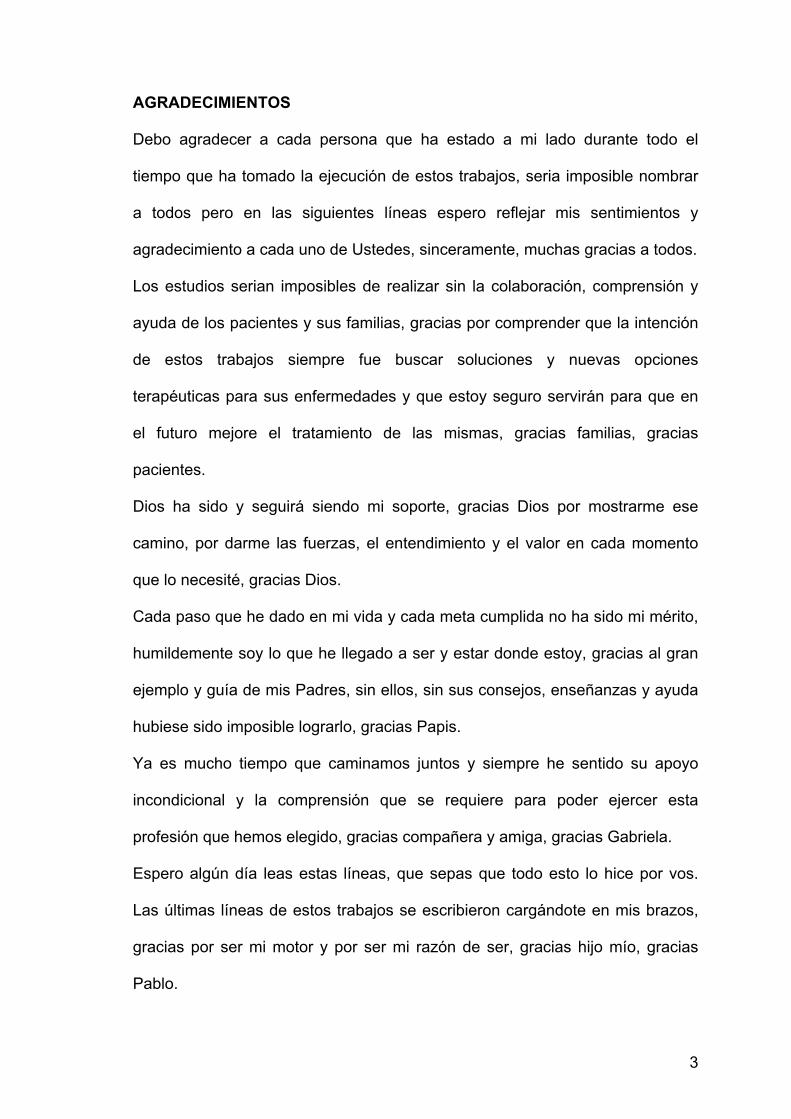
Figura 1. Volúmenes pulmonares, medidas y cálculos realizados en el estudio.
Los números de 1 a 4 corresponden a los pasos y medidas realizadas. Las
letras a y b corresponden a los cálculos derivados de las medidas realizadas.
0
500
1000
1500
2000
2500
10±1 PEEP
23±4 P. Plateau
VO
LU
ME
N (m
L)
PRESIÓN (cmH2O)
3) Medida de CRF 1) Medida de EELV
a) Cálculo del incremento del volumen pulmonar inducido por la PEEP (delta de EELV)
4) Medida del Vt necesario para generar una presión plateau igual a la PEEP basal (PEEP x Crs en ZEEP)
b) Vrec (delta de EELV - [PEEP x Crs en ZEEP])
2) Retiro de PEEP
0

22
7. ARTÍCULOS ORIGINALES ACEPTADOS POR LA COMISIÓN
ACADÉMICA DEL PROGRAMA DE DOCTORADO EN MEDICINA E
INCLUIDOS EN LA TESIS
PRIMER ARTÍCULO
AUTORES: Aguirre‑Bermeo, Hernan; Morán, Indalecio; Bottiroli, Maurizio;
Italiano, Stefano; Parrilla, Francisco Jose; Plazolles, Eugenia; Roche-Campo,
Ferran; Mancebo, Jordi.
TITULO: End‑inspiratory pause prolongation in acute respiratory distress
syndrome patients: effects on gas exchange and mechanics.
REVISTA: Annals of Intensive Care, Diciembre 2016.
D.O.I: 10.1186/s13613-016-0183-z.
FACTOR DE IMPACTO: 3.656 según la ISI Web of KnowledgeSM de 2016

Aguirre‑Bermeo et al. Ann. Intensive Care (2016) 6:81 DOI 10.1186/s13613‑016‑0183‑z
RESEARCH
End‑inspiratory pause prolongation in acute respiratory distress syndrome patients: effects on gas exchange and mechanicsHernan Aguirre‑Bermeo1, Indalecio Morán1, Maurizio Bottiroli2, Stefano Italiano1, Francisco José Parrilla1, Eugenia Plazolles1, Ferran Roche‑Campo3 and Jordi Mancebo1*
Abstract
Background: End‑inspiratory pause (EIP) prolongation decreases dead space‑to‑tidal volume ratio (Vd/Vt) and PaCO2. We do not know the physiological benefits of this approach to improve respiratory system mechanics in acute respiratory distress syndrome (ARDS) patients when mild hypercapnia is of no concern.
Methods: The investigation was conducted in an intensive care unit of a university hospital, and 13 ARDS patients were included. The study was designed in three phases. First phase, baseline measurements were taken. Second phase, the EIP was prolonged until one of the following was achieved: (1) EIP of 0.7 s; (2) intrinsic positive end‑expiratory pressure ≥1 cmH2O; or (3) inspiratory–expiratory ratio 1:1. Third phase, the Vt was decreased (30 mL every 30 min) until PaCO2 equal to baseline was reached. FiO2, PEEP, airflow and respiratory rate were kept constant.
Results: EIP was prolonged from 0.12 ± 0.04 to 0.7 s in all patients. This decreased the Vd/Vt and PaCO2 (0.70 ± 0.07 to 0.64 ± 0.08, p < 0.001 and 54 ± 9 to 50 ± 8 mmHg, p = 0.001, respectively). In the third phase, the decrease in Vt (from 6.3 ± 0.8 to 5.6 ± 0.8 mL/Kg PBW, p < 0.001) allowed to decrease plateau pressure and driving pressure (24 ± 3 to 22 ± 3 cmH2O, p < 0.001 and 13.4 ± 3.6 to 10.9 ± 3.1 cmH2O, p < 0.001, respectively) and increased respiratory system compliance from 29 ± 9 to 32 ± 11 mL/cmH2O (p = 0.001). PaO2 did not significantly change.
Conclusions: Prolonging EIP allowed a significant decrease in Vt without changes in PaCO2 in passively venti‑lated ARDS patients. This produced a significant decrease in plateau pressure and driving pressure and significantly increased respiratory system compliance, which suggests less overdistension and less dynamic strain.
Keywords: End‑inspiratory pause, Dead space, Tidal volume, Acute respiratory distress syndrome, Mechanical ventilation
© 2016 The Author(s). This article is distributed under the terms of the Creative Commons Attribution 4.0 International License (http://creativecommons.org/licenses/by/4.0/), which permits unrestricted use, distribution, and reproduction in any medium, provided you give appropriate credit to the original author(s) and the source, provide a link to the Creative Commons license, and indicate if changes were made.
BackgroundMechanical ventilation in patients with acute respira-tory distress syndrome (ARDS) must combine both low tidal volumes (Vt) and adequate positive end-expiratory pressure (PEEP) [1, 2]. However, in patients with ARDS, respiratory acidosis and high airway plateau pressures (Pplat) may limit management of ventilatory adjustments. In particular, the functional consequences of hypercapnia
and respiratory acidosis may differ considerably depend-ing on a patient’s condition, and they may involve almost any physiological function [3–6].
Optimization of mechanical ventilation parameters is associated with a reduction in dead space and is a use-ful strategy to reduce hypercapnia in ARDS patients [7]. Many other strategies have also been developed to decrease hypercapnia at the bedside, such as increases in respiratory rate [8], use of active humidifiers [9] and the tracheal gas insufflation [10] or aspiration of dead space [11]. At bedside, the dead space could be calculated using the Enghoff modification of the Bohr equation. The use of this equation implies the use of PaCO2 as surrogate for
Open Access
*Correspondence: [email protected] 1 Servei de Medicina Intensiva, Hospital de la Santa Creu i Sant Pau, Universidad Autònoma de Barcelona (UAB), Sant Quintí, 89, 08041 Barcelona, SpainFull list of author information is available at the end of the article

Page 2 of 8Aguirre‑Bermeo et al. Ann. Intensive Care (2016) 6:81
alveolar carbon dioxide. Therefore, this equation meas-ures a global index of efficiency of gas exchange because it takes also shunt effect into account [12].
Some authors have also shown that prolonging the end-inspiratory pause (EIP) is a feasible maneuver to achieve similar targets [13, 14]. In experimental models [15] and in ARDS patients [14, 16–18], EIP prolongation has proven effective at enhancing CO2 elimination and decreasing partial pressure of carbon dioxide in arte-rial blood (PaCO2) and also physiological dead space (Vdphys). Prolonging EIP extends the time available for an enhanced diffusion between inhaled Vt and resident alve-olar gas, thus facilitating the transfer of CO2 from alveoli toward the airways [17, 18].
Although several of the physiological studies described above have reported that EIP prolongation improves gas exchange, none have investigated the potential physi-ological benefits of this approach in terms of Vt reduc-tion or improved respiratory system mechanics when hypercapnia is of no concern. To address this gap, the objective of our study was to ascertain whether EIP pro-longation decreases PaCO2 and whether this effect can be used to decrease Vt while keeping PaCO2 constant. We hypothesized that this approach may have benefi-cial effects on respiratory system mechanics in ARDS patients.
MethodsThe study was performed in the Intensive Care Unit at Hospital de la Santa Creu i Sant Pau, Barcelona (Spain). The institutional ethics committee approved the study (Reference: 10/089), and the patients’ relatives gave signed informed consent.
PatientsFourteen patients who met the criteria for ARDS [19] were included in the study. Exclusion criteria were: age <18 years, pregnancy, hemodynamic or respiratory insta-bility, and variation of more than 0.5 °C in body tempera-ture in the last 12 h before the study was planned [20]. One patient was excluded during the study period (see Results).
All patients were under sedation and analgesia with intravenous perfusion of midazolam and opiates. Neu-romuscular blockade was used in all patients to prevent triggering of the ventilator. Careful endotracheal suc-tioning was performed before the protocol was started. Heated humidifiers (Fisher & Paykel; MR 290 chamber and MR 850 ALU electric heater; Panmure, New Zea-land) were used for airway humidification in all patients. These humidifiers were placed in the inspiratory limb of the circuit in accordance with the manufacturer’s recom-mendations. The respiratory rate, FiO2, inspiratory flow
(square pattern) and PEEP were kept constant through-out the study.
ProtocolAll patients were in steady state in the 60-min preceding data recording, and all of them were in a semirecumbent position. The study was performed in three consecutive 30-min phases. Measurements in the first phase (base-line phase) were taken under the mechanical ventilation parameters set by the patient’s attending physician. In the second phase (EIP prolongation phase), the EIP was pro-longed until one of the following parameters was reached: (1) EIP of 0.7 s; (2) intrinsic positive end-expiratory pres-sure (PEEPi) ≥1 cmH2O; or (3) inspiratory–expiratory ratio (I/E) of 1:1. We chose the EIP prolongation time (0.7 s) based on findings from a previous study by Deva-quet et al. [18] in which a 20 % prolongation of the inspir-atory time induced a significant decrease in PaCO2 and dead space. In the third phase (Vt reduction phase), the Vt was diminished in steps of 30 mL every 30 min until PaCO2 reached baseline levels.
The following data were collected at inclusion: demo-graphic variables (age, sex, height), simplified acute phys-iology score II, ARDS etiology and days of mechanical ventilation.
During the last minute of each phase, we collected the following respiratory variables: peak airway pressure, Pplat, mean airway pressure, PEEPi, PEEP, driving air-way pressure (∆Paw), Vt, dead space-to-Vt ratio (Vd/Vt), static compliance of the respiratory system (Crs) and air-way resistance. At the same time, we recorded the follow-ing gas exchange variables: pH, partial pressure of arterial oxygen (PaO2), PaCO2 and end-tidal carbon dioxide con-centration in the mixed expired gas (EtCO2). PEEPi was measured with a prolonged end-expiratory pause of 4 s, performed using the ventilator expiratory hold button. EtCO2 was measured continuously with a CO2 main-stream sensor (General Electric Capnostat, Milwaukee, WI, USA). The mean value of the last 10 recorded EtCO2 values in each phase of the study was used for analysis.
Ventilatory settings and airway pressures were recorded directly from the ventilator monitoring sys-tem. Plateau pressure was measured during an end-inspiratory pause. Dead space was calculated using the Enghoff modification of the Bohr equation [21]: Vd/Vt = (PaCO2 − PeCO2)/PaCO2, being PeCO2 the par-tial pressure of carbon dioxide in mixed expired gas. Expired gas was measured by collecting gas for 3 min with a Douglas bag (P-341–60; Warren E. Collins Inc., Boston, MA, USA) attached directly to the expiratory port of the ventilator. An automated analyzer (ABL 520; Radiometer A/S, Copenhagen, Denmark) was used to measure expired and arterial gases. Dead space data
Page 3 of 8Aguirre‑Bermeo et al. Ann. Intensive Care (2016) 6:81
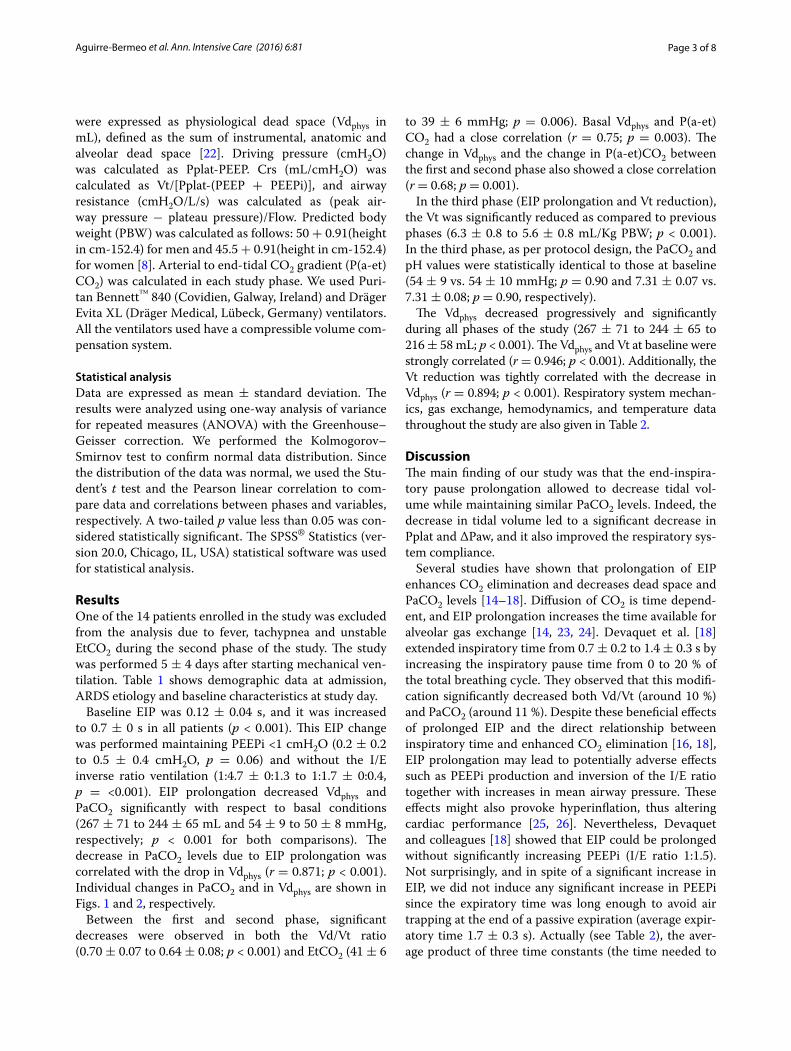
were expressed as physiological dead space (Vdphys in mL), defined as the sum of instrumental, anatomic and alveolar dead space [22]. Driving pressure (cmH2O) was calculated as Pplat-PEEP. Crs (mL/cmH2O) was calculated as Vt/[Pplat-(PEEP + PEEPi)], and airway resistance (cmH2O/L/s) was calculated as (peak air-way pressure − plateau pressure)/Flow. Predicted body weight (PBW) was calculated as follows: 50 + 0.91(height in cm-152.4) for men and 45.5 + 0.91(height in cm-152.4) for women [8]. Arterial to end-tidal CO2 gradient (P(a-et)CO2) was calculated in each study phase. We used Puri-tan Bennett™ 840 (Covidien, Galway, Ireland) and Dräger Evita XL (Dräger Medical, Lübeck, Germany) ventilators. All the ventilators used have a compressible volume com-pensation system.
Statistical analysisData are expressed as mean ± standard deviation. The results were analyzed using one-way analysis of variance for repeated measures (ANOVA) with the Greenhouse–Geisser correction. We performed the Kolmogorov–Smirnov test to confirm normal data distribution. Since the distribution of the data was normal, we used the Stu-dent’s t test and the Pearson linear correlation to com-pare data and correlations between phases and variables, respectively. A two-tailed p value less than 0.05 was con-sidered statistically significant. The SPSS® Statistics (ver-sion 20.0, Chicago, IL, USA) statistical software was used for statistical analysis.
ResultsOne of the 14 patients enrolled in the study was excluded from the analysis due to fever, tachypnea and unstable EtCO2 during the second phase of the study. The study was performed 5 ± 4 days after starting mechanical ven-tilation. Table 1 shows demographic data at admission, ARDS etiology and baseline characteristics at study day.
Baseline EIP was 0.12 ± 0.04 s, and it was increased to 0.7 ± 0 s in all patients (p < 0.001). This EIP change was performed maintaining PEEPi <1 cmH2O (0.2 ± 0.2 to 0.5 ± 0.4 cmH2O, p = 0.06) and without the I/E inverse ratio ventilation (1:4.7 ± 0:1.3 to 1:1.7 ± 0:0.4, p = <0.001). EIP prolongation decreased Vdphys and PaCO2 significantly with respect to basal conditions (267 ± 71 to 244 ± 65 mL and 54 ± 9 to 50 ± 8 mmHg, respectively; p < 0.001 for both comparisons). The decrease in PaCO2 levels due to EIP prolongation was correlated with the drop in Vdphys (r = 0.871; p < 0.001). Individual changes in PaCO2 and in Vdphys are shown in Figs. 1 and 2, respectively.
Between the first and second phase, significant decreases were observed in both the Vd/Vt ratio (0.70 ± 0.07 to 0.64 ± 0.08; p < 0.001) and EtCO2 (41 ± 6
to 39 ± 6 mmHg; p = 0.006). Basal Vdphys and P(a-et)CO2 had a close correlation (r = 0.75; p = 0.003). The change in Vdphys and the change in P(a-et)CO2 between the first and second phase also showed a close correlation (r = 0.68; p = 0.001).
In the third phase (EIP prolongation and Vt reduction), the Vt was significantly reduced as compared to previous phases (6.3 ± 0.8 to 5.6 ± 0.8 mL/Kg PBW; p < 0.001). In the third phase, as per protocol design, the PaCO2 and pH values were statistically identical to those at baseline (54 ± 9 vs. 54 ± 10 mmHg; p = 0.90 and 7.31 ± 0.07 vs. 7.31 ± 0.08; p = 0.90, respectively).
The Vdphys decreased progressively and significantly during all phases of the study (267 ± 71 to 244 ± 65 to 216 ± 58 mL; p < 0.001). The Vdphys and Vt at baseline were strongly correlated (r = 0.946; p < 0.001). Additionally, the Vt reduction was tightly correlated with the decrease in Vdphys (r = 0.894; p < 0.001). Respiratory system mechan-ics, gas exchange, hemodynamics, and temperature data throughout the study are also given in Table 2.
DiscussionThe main finding of our study was that the end-inspira-tory pause prolongation allowed to decrease tidal vol-ume while maintaining similar PaCO2 levels. Indeed, the decrease in tidal volume led to a significant decrease in Pplat and ∆Paw, and it also improved the respiratory sys-tem compliance.
Several studies have shown that prolongation of EIP enhances CO2 elimination and decreases dead space and PaCO2 levels [14–18]. Diffusion of CO2 is time depend-ent, and EIP prolongation increases the time available for alveolar gas exchange [14, 23, 24]. Devaquet et al. [18] extended inspiratory time from 0.7 ± 0.2 to 1.4 ± 0.3 s by increasing the inspiratory pause time from 0 to 20 % of the total breathing cycle. They observed that this modifi-cation significantly decreased both Vd/Vt (around 10 %) and PaCO2 (around 11 %). Despite these beneficial effects of prolonged EIP and the direct relationship between inspiratory time and enhanced CO2 elimination [16, 18], EIP prolongation may lead to potentially adverse effects such as PEEPi production and inversion of the I/E ratio together with increases in mean airway pressure. These effects might also provoke hyperinflation, thus altering cardiac performance [25, 26]. Nevertheless, Devaquet and colleagues [18] showed that EIP could be prolonged without significantly increasing PEEPi (I/E ratio 1:1.5). Not surprisingly, and in spite of a significant increase in EIP, we did not induce any significant increase in PEEPi since the expiratory time was long enough to avoid air trapping at the end of a passive expiration (average expir-atory time 1.7 ± 0.3 s). Actually (see Table 2), the aver-age product of three time constants (the time needed to

Page 4 of 8Aguirre‑Bermeo et al. Ann. Intensive Care (2016) 6:81
Tabl
e 1
Dem
ogra
phic
dat
a at
adm
issi
on a
nd b
asel
ine
char
acte
rist
ics
of p
atie
nts
on th
e st
udy
day
ARD
S ac
ute
resp
irato
ry d
istr
ess
synd
rom
e, F
iO2 f
ract
ion
of in
spire
d ox
ygen
, MV
mec
hani
cal v
entil
atio
n, P
aO2/
FiO
2 par
tial p
ress
ure
of a
rter
ial o
xyge
n ov
er fr
actio
n of
insp
ired
oxyg
en, P
BW p
redi
cted
bod
y w
eigh
t, PE
EP
posi
tive
end‑
expi
rato
ry p
ress
ure,
RR
resp
irato
ry ra
te, S
APS
II si
mpl
ified
acu
te p
hysi
olog
y sc
ore
IIa T
hese
set
tings
wer
e ke
pt c
onst
ant t
hrou
ghou
t the
stu
dy
Adm
issi
onSt
udy
day
Patie
ntA
ge
(yea
rs)
Gen
der
SAPS
IIPB
W
(kg)
Mea
sure
d
wei
ght (
kg)
ARD
S et
iolo
gyD
ays
of M
V be
fore
stu
dyPa
O2/
FiO
2 (m
mH
g)Fi
O2a
PEEP
(c
mH
2O)a
Flow
(L
/min
)aRR
(b
pm)a
175
M59
67.7
58.5
Pneu
mon
ia8
112
0.7
1070
22
252
M42
68.7
78A
spira
tion
1318
50.
6512
5720
346
F30
52.4
61M
ultip
le T
raum
a7
118
0.7
1260
25
462
F69
47.9
55Pn
eum
onia
513
10.
610
6025
556
F23
52.4
61.5
Pneu
mon
ia3
100
0.8
1260
22
666
M40
63.2
72.5
Pneu
mon
ia1
184
0.5
1060
20
757
M62
69.6
83Pn
eum
onia
114
70.
58
6017
836
M24
61.4
90Pn
eum
onia
424
20.
514
7523
955
M49
66.8
72Pn
eum
onia
221
90.
614
7021
1051
F60
43.3
64Se
psis
1226
90.
48
5021
1174
F61
47.9
62.5
Seps
is1
266
0.5
1060
21
1243
M61
59.6
80.5
Seps
is3
194
0.7
1060
22
1363
M30
83.1
106
Pneu
mon
ia6
283
0.35
860
30
Mea
n ±
SD
57 ±
11
47 ±
16
60.3
± 1
1.2
72.6
± 1
4.6
5 ±
418
8 ±
64
0.58
± 0
.13
11 ±
261
± 7
22 ±
3

Page 5 of 8Aguirre‑Bermeo et al. Ann. Intensive Care (2016) 6:81
passively exhale 96 % of inhaled tidal volume) was in our patients about 1.1 s. (0.373 × 3 = 1.1 s), well below to the average expiratory time.
Prolongation of EIP in our patients caused a signifi-cant decrease in dead space and PaCO2 levels that was similar to previously reported [14–18]. When comparing
phase 1 (baseline) and phase 2 (isolated EIP prolonga-tion), we found that the decrease in the Vd/Vt correlated well with the drop in PaCO2 (r = 0.810; p < 0.001). These changes observed in our patients may be explained by the increase on the time available for distribution and dif-fusion of inspired tidal gas within resident alveolar gas during EIP prolongation [14]. Indeed, total PEEP levels, airflow, respiratory rate, tidal volume and respiratory mechanics were totally unchanged in this phase of our study [14, 27, 28].
Comparing the second (isolated EIP prolongation) and third (EIP prolongation and Vt reduction) phases, our data showed that the Vd/Vt ratio remained unchanged. However, the Vdphys, expressed in mL, decreased signifi-cantly between phases 2 and 3. This is explained by the significant reduction in Vt (that also provoked a decrease in Vdphys) during the third phase as compared to the previous phases, and thus Vd/Vt ratio did not change. The fact that the reduction in Vt in the third phase was accompanied by a significant decrease in Vdphys and ΔPaw (with a significant increase in compliance) suggests that some degree of overdistension might be present at baseline.
As previously described, low tidal volume ventilation in ARDS may induce hypercapnia and, secondarily, induce pulmonary artery hypertension that may impair right ventricular function [29] and eventually cause acute cor pulmonale [30]. To reduce hypercapnia in ARDS venti-lated patients, active heated humidifiers are often used. These devices significantly decrease dead space, PaCO2 and ventilator mechanical load [9] without increasing airflow resistance [31]. Although active humidification is recommended over heat and moisture exchangers in ARDS patients [32], two studies focussing on the effects of EIP prolongation on gas exchange [16, 17] did not describe the type of humidification used in their patients. A third study used passive or active humidification (10 and 5 patients, respectively) [18]. However, the effects on PaCO2 in all these studies [16–18] were consistently the same, thus suggesting that humidification type per se does not influence the effects of EIP on PaCO2.
Another technique used to decrease hypercapnia is to increase the respiratory rate. However, in ARDS patients, several studies have shown that a high respiratory rate led to gas trapping and induced PEEPi [33, 34]. In addition, experimental models suggested that higher respiratory rates may contribute to the development of ventilator-induced lung injury [35, 36]. Vieillard-Baron et al. [25] compared two respiratory rate strategies, 30 versus 15 breaths/min. They found that the high respiratory rate did not reduce PaCO2 levels but produced dynamic hyperinflation and reduced the cardiac index. In our patients, EIP prolongation was achieved with a relatively
Fig. 1 Individual values for PaCO2 during the study. The asterisk denotes statistically significant differences (p < 0.001) during pro‑longation of end‑inspiratory pause. EIP end‑inspiratory pause, PaCO2 partial pressure of carbon dioxide in arterial blood, Vt tidal volume
Fig. 2 Individual values for Vdphys during the study. The asterisks denote a significant, progressive decrease in Vd phys (p < 0.001) during prolongation of end‑inspiratory pause (EIP) and during Vt reduction. EIP end‑inspiratory pause, Vdphys physiological dead space, Vt tidal volume

Page 6 of 8Aguirre‑Bermeo et al. Ann. Intensive Care (2016) 6:81
high inspiratory flow rate (1 L/s), thus avoiding inverse I/E ratio. This was a safe strategy to decrease PaCO2 lev-els, while keeping respiratory rate constant (22 breaths/min) and not generating PEEPi.
In our study, the reduction in Vt to maintain isocap-nia was modest. Should major reductions in Vt were required, then the use of invasive extracorporeal carbon dioxide removal devices had to be considered in order to avoid acute hypercapnia [37].
Studies analyzing the EIP prolongation did not describe changes in PaO2 [14, 18], except one study by Mercat et al. [16]. This latter study found a slight, but not statisti-cally significant, increase in PaO2 levels during EIP pro-longation. This finding was not confirmed in our study. We speculate that the length of time that patients are maintained with EIP prolongation and the mean airway pressure achieved during extended EIP may have con-tributed to this finding. Indeed, in Mercat’s study [16], EIP prolongation was continued for 1 h with a mean air-way pressure of 21 cmH2O and an I/E ratio 1.1. In con-trast, in Devaquet’s study [18] and in our own study, EIP
prolongation was shorter (30 min in both), mean airway pressure was lower (15 and 17 cmH2O, respectively), and the I/E ratios achieved were 1:1.5 in Devaquet’s study and 1:1.7 in ours.
The main novelty of our study is that prolonging EIP allowed to reduce Vt by 11 % (from 6.3 ± 0.8 to 5.6 ± 0.8 mL/kg of PBW; p < 0.001), maintaining PaCO2 levels equal to baseline. These sequential ventilatory changes were accompanied by a reduction in Vdphys. Also, when PaCO2 returned to baseline due to a reduc-tion in Vt, we found a significant decrease in Pplat and an increase in Crs. In addition, these changes in ventilatory mechanics were accompanied by a significant decrease in ∆Paw. All those findings could be explained by a degree of baseline overinflation even though our initial Vt was low [38]. We further support our contention by the tight correlation between Vt and Vdphys at the onset of the study and the tight correlation between the decrease in Vt and Vdphys at the end of the study. Our patients were basally ventilated with parameters similar to those used in previous studies [16–18] in terms of Vt and PEEP, and
Table 2 Respiratory system mechanics, gas exchange and hemodynamic data during the study
Data are presented as number (%) or mean ± SD
Intergroup differences (p < 0.05): a, phase 1 versus phase 2; b, phase 1 versus phase 3; c, phase 2 versus phase 3
Crs static compliance of the respiratory system, EIP end‑inspiratory pause, EtCO2 end‑tidal carbon dioxide concentration in the expired air, FiO2 fraction of inspired oxygen, HR heart rate, MAP mean arterial pressure, PaO2 partial pressure of oxygen in arterial blood, PaCO2 partial pressure of carbon dioxide in arterial blood, PBW predicted body weight, PEEPi intrinsic positive end‑expiratory pressure, Pmean mean airway pressure, Ppeak peak airway pressure, Pplat plateau airway pressure, P(a‑et)CO2 arterial to end‑tidal CO2 gradient, Raw airway resistance, Vdphys physiological dead space, Vd/Vt dead space‑to‑Vt ratio, Vt tidal volume, ∆Paw driving airway pressure
Phase 1 (baseline)
Phase 2 (EIP prolongation)
Phase 3 (Vt reduction)
Overall p value
Intergroup differences
EIP (s) 0.12 ± 0.04 0.7 ± 0 0.7 ± 0 <0.001 a, b
Ppeak (cmH2O) 38 ± 6 38 ± 6 35 ± 5 <0.001 b, c
Pmean (cmH2O) 15 ± 3 18 ± 2 17 ± 2 <0.001 a, b, c
Pplat (cmH2O) 24 ± 3 24 ± 3 22 ± 3 <0.001 b, c
PEEPi (cmH2O) 0.2 ± 0.2 0.5 ± 0.4 0.5 ± 0.4 0.06
Vt (mL) 378 ± 73 378 ± 73 336 ± 61 <0.001 b, c
Vt (PBW; mL/Kg) 6.3 ± 0.8 6.3 ± 0.8 5.6 ± 0.8 <0.001 b, c
Vdphys (mL) 267 ± 71 244 ± 65 216 ± 58 <0.001 a, b, c
Vd/Vt 0.70 ± 0.07 0.64 ± 0.08 0.64 ± 0.08 <0.001 a, b
Crs (mL/cmH2O) 29 ± 9 29 ± 9 32 ± 11 0.001 b, c
∆ Paw (cmH2O) 13.6 ± 3.6 13.4 ± 3.6 10.9 ± 3.1 <0.001 a, b, c
Raw (cmH2O/L/s) 14 ± 5 13 ± 5 13 ± 4 0.28
pH 7.31 ± 0.07 7.34 ± 0.09 7.31 ± 0.08 <0.001 a, c
PaO2 (mmHg) 102 ± 23 98 ± 23 105 ± 29 0.35
PaCO2 (mmHg) 54 ± 9 50 ± 8 54 ± 10 <0.001 a, c
EtCO2 (mmHg) 41 ± 6 39 ± 6 43 ± 7 0.002 a, c
P(a‑et)CO2 (mmHg) 13 ± 6 12 ± 8 12 ± 9 0.27
MAP (mmHg) 80 ± 12 76 ± 9 77 ± 12 0.08
HR (beats/min) 87 ± 19 83 ± 20 86 ± 21 0.14
Temperature (°C) 36.7 ± 0.9 36.7 ± 0.9 36.6 ± 0.8 0.61

Page 7 of 8Aguirre‑Bermeo et al. Ann. Intensive Care (2016) 6:81
Vd/Vt was also similar. Moreover, in our patients, Crs was lower (29 mL/cmH2O) than in Mercat and Devaquet studies (37 and 50 mL/cmH2O, respectively). Our find-ings thus suggest that if PaCO2 is clinically tolerable, EIP prolongation in ARDS provides physiological benefits including a small and consistent decrease in Vt which may help decrease dynamic strain [39].
In our study, a slight but not statistically significant decrease in mean arterial pressure was observed. Such trend could have been the result of complex interactions of PaCO2 and mean airway pressure in cardiovascular system.
We think that EIP prolongation is a feasible maneuver to optimize the consequences of mechanical ventilation in ARDS patients. Physicians may consider using an EIP prolongation in the early phase of ARDS when patients often require sedation and neuromuscular blocking agents. In our study, we have effectively implemented this strategy by using active humidification, relatively high inspiratory flow rates and close monitoring of PEEPi. This bundle decreases PaCO2, which in turn will allow to further decrease Vt and the consequent lung strain when isocapnic conditions are met.
One of the limitations of our study is the relatively small number of patients, the majority with pneumonia, and the fact that the study is short term. Studies with patients with different ARDS etiologies and larger num-bers are warranted to confirm our data. Also, we did not measure other parameters such as inflammatory media-tors or lung volumes. The calculation of dead space using the Enghoff modification of Bohr equation in patients with large shunt fractions (>20–30 %) could underesti-mate dead space fraction [12]. In our study, we did not measure intrapulmonary shunt. However, according to the gas exchange values that we obtained, shunt frac-tions above 30 % are unlikely. Additionally, the EIP pro-longation increases the mechanical inflation time and it could extend into neural expiration. Asynchronies may thus develop and cause an inadequate patient–ventilator interaction when the patients are not paralyzed [39–41]. Our results could be dependent on our routine manage-ment of mechanical ventilation in ARDS patients, but our findings have been consistent in all patients and we con-sider they could be extrapolated to other ARDS patients. Finally, the absolute decrease in tidal volume, although statistically significant, is moderate.
ConclusionsIn conclusion, our data indicate that EIP prolongation is a simple and feasible strategy to decrease dead space and PaCO2 levels. In addition, when PaCO2 levels are of no clinical concern, EIP prolongation allows us to further decrease tidal volume. This, in turn, decreases plateau
airway pressure, driving airway pressure and improves respiratory system compliance, suggesting less overdis-tension and less risk of dynamic strain and lung injury. Therefore, the use of this simple ventilator maneuver during mechanical ventilation in sedated and paralyzed ARDS patients merits consideration.
AbbreviationsARDS: acute respiratory distress syndrome; Crs: static compliance of the respiratory system; EIP: end‑inspiratory pause; EtCO2: end‑tidal carbon dioxide concentration in the mixed expired gas; IE: inspiratory–expiratory ratio; PaCO2: partial pressure of carbon dioxide in arterial blood; PaO2: partial pressure of arterial oxygen; PBW: predicted body weight; PeCO2: partial pressure of carbon dioxide in mixed expired gas; PEEP: positive end‑expiratory pressure; PEEPi: intrinsic positive end‑expiratory pressure; Pplat: plateau airway pressure; P(a‑et)CO2: arterial to end‑tidal CO2 gradient; Vd/Vt: dead space‑to‑Vt ratio; Vdphys: physiological dead space; Vt: tidal volume; ∆Paw: driving airway pressure.
Authors’ contributionsAll authors participated in the study design, data collection and analysis, manuscript writing and final approval. All authors read and approved the final manuscript.
Author details1 Servei de Medicina Intensiva, Hospital de la Santa Creu i Sant Pau, Universi‑dad Autònoma de Barcelona (UAB), Sant Quintí, 89, 08041 Barcelona, Spain. 2 Anestesia e Rianimazione 3, Ospedale Niguarda Ca’ Granda, Milan, Italy. 3 Servei de Medicina Intensiva, Hospital Verge de la Cinta, Tortosa, Spain.
Competing interestsThe authors declare that they have no competing interests.
Received: 23 May 2016 Accepted: 11 August 2016
References 1. Eichacker PQ, Gerstenberger EP, Banks SM, Cui X, Natanson C. Meta‑
analysis of acute lung injury and acute respiratory distress syndrome trials testing low tidal volumes. Am J Respir Crit Care Med. 2002;166:1510–4.
2. Briel M, Meade M, Mercat A, Brower RG, Talmor D, Walter SD, Slutsky AS, Pullenayegum E, Zhou Q, Cook D, Brochard L, Richard JC, Lamontagne F, Bhatnagar N, Stewart TE, Guyatt G. Higher vs lower positive end‑expiratory pressure in patients with acute lung injury and acute respiratory distress syndrome: systematic review and meta‑analysis. JAMA. 2010;303:865–73.
3. Feihl F, Perret C. Permissive hypercapnia. How permissive should we be? Am J Respir Crit Care Med. 1994;150:1722–37.
4. Laffey JG, Engelberts D, Kavanagh BP. Buffering hypercapnic acidosis worsens acute lung injury. Am J Respir Crit Care Med. 2000;161:141–6.
5. Feihl F, Eckert P, Brimioulle S, Jacobs O, Schaller MD, Melot C, Naeije R. Permissive hypercapnia impairs pulmonary gas exchange in the acute respiratory distress syndrome. Am J Respir Crit Care Med. 2000;162:209–15.
6. O’Croinin DF, Nichol AD, Hopkins N, Boylan J, O’Brien S, O’Connor C, Laf‑fey JG, McLoughlin P. Sustained hypercapnic acidosis during pulmonary infection increases bacterial load and worsens lung injury. Crit Care Med. 2008;36:2128–35.
7. Richecoeur J, Lu Q, Vieira SR, Puybasset L, Kalfon P, Coriat P, Rouby JJ. Expiratory washout versus optimization of mechanical ventilation during permissive hypercapnia in patients with severe acute respiratory distress syndrome. Am J Respir Crit Care Med. 1999;160:77–85.
8. Network The Acute Respiratory Distress Syndrome. Ventilation with lower tidal volumes as compared with traditional tidal volumes for acute lung injury and the acute respiratory distress syndrome. N Engl J Med. 2000;342:1301–8.

Page 8 of 8Aguirre‑Bermeo et al. Ann. Intensive Care (2016) 6:81
9. Moran I, Bellapart J, Vari A, Mancebo J. Heat and moisture exchangers and heated humidifiers in acute lung injury/acute respiratory distress syndrome patients. Effects on respiratory mechanics and gas exchange. Intensive Care Med. 2006;32:524–31.
10. Ravenscraft SA, Burke WC, Nahum A, Adams AB, Nakos G, Marcy TW, Marini JJ. Tracheal gas insufflation augments CO2 clearance during mechanical ventilation. Am Rev Respir Dis. 1993;148:345–51.
11. De Robertis E, Servillo G, Tufano R, Jonson B. Aspiration of dead space allows isocapnic low tidal volume ventilation in acute lung injury. Relationships to gas exchange and mechanics. Intensive Care Med. 2001;27:1496–503.
12. Suarez‑Sipmann F, Bohm SH, Tusman G. Volumetric capnography: the time has come. Curr Opin Crit Care. 2014;20:333–9.
13. Astrom E, Uttman L, Niklason L, Aboab J, Brochard L, Jonson B. Pattern of inspiratory gas delivery affects CO2 elimination in health and after acute lung injury. Intensive Care Med. 2008;34:377–84.
14. Aboab J, Niklason L, Uttman L, Brochard L, Jonson B. Dead space and CO2 elimination related to pattern of inspiratory gas delivery in ARDS patients. Crit Care. 2012;16:R39.
15. Uttman L, Jonson B. A prolonged postinspiratory pause enhances CO2 elimination by reducing airway dead space. Clin Physiol Funct Imaging. 2003;23:252–6.
16. Mercat A, Diehl JL, Michard F, Anguel N, Teboul JL, Labrousse J, Richard C. Extending inspiratory time in acute respiratory distress syndrome. Crit Care Med. 2001;29:40–4.
17. Aboab J, Niklason L, Uttman L, Kouatchet A, Brochard L, Jonson B. CO2 elimination at varying inspiratory pause in acute lung injury. Clin Physiol Funct Imaging. 2007;27:2–6.
18. Devaquet J, Jonson B, Niklason L, Si Larbi AG, Uttman L, Aboab J, Bro‑chard L. Effects of inspiratory pause on CO2 elimination and arterial PCO2 in acute lung injury. J Appl Physiol. 2008;105:1944–9.
19. Ranieri VM, Rubenfeld GD, Thompson BT, Ferguson ND, Caldwell E, Fan E, Camporota L, Slutsky AS. Acute respiratory distress syndrome: the Berlin definition. JAMA. 2012;307:2526–33.
20. Bacher A. Effects of body temperature on blood gases. Intensive Care Med. 2005;31:24–7.
21. Fletcher R, Jonson B, Cumming G, Brew J. The concept of deadspace with special reference to the single breath test for carbon dioxide. Br J Anaesth. 1981;53:77–88.
22. Lucangelo U, Blanch L. Dead space. Intensive Care Med. 2004;30:576–9. 23. Knelson JH, Howatt WF, DeMuth GR. Effect of respiratory pattern on
alveolar gas exchange. J Appl Physiol. 1970;29:328–31. 24. Shanholtz C, Brower R. Should inverse ratio ventilation be used in
adult respiratory distress syndrome? Am J Respir Crit Care Med. 1994;149:1354–8.
25. Vieillard‑Baron A, Prin S, Augarde R, Desfonds P, Page B, Beauchet A, Jardin F. Increasing respiratory rate to improve CO2 clearance during mechani‑cal ventilation is not a panacea in acute respiratory failure. Crit Care Med. 2002;30:1407–12.
26. Armstrong BW Jr, MacIntyre NR. Pressure‑controlled, inverse ratio ventila‑tion that avoids air trapping in the adult respiratory distress syndrome. Crit Care Med. 1995;23:279–85.
27. Blanch L, Fernandez R, Benito S, Mancebo J, Net A. Effect of PEEP on the arterial minus end‑tidal carbon dioxide gradient. Chest. 1987;92:451–4.
28. Beydon L, Uttman L, Rawal R, Jonson B. Effects of positive end‑expiratory pressure on dead space and its partitions in acute lung injury. Intensive Care Med. 2002;28:1239–45.
29. Carvalho CR, Barbas CS, Medeiros DM, Magaldi RB, Lorenzi Filho G, Kairalla RA, Deheinzelin D, Munhoz C, Kaufmann M, Ferreira M, Takagaki TY, Amato MB. Temporal hemodynamic effects of permissive hyper‑capnia associated with ideal PEEP in ARDS. Am J Respir Crit Care Med. 1997;156:1458–66.
30. Vieillard‑Baron A, Schmitt JM, Augarde R, Fellahi JL, Prin S, Page B, Beauchet A, Jardin F. Acute cor pulmonale in acute respiratory distress syndrome submitted to protective ventilation: incidence, clinical implica‑tions, and prognosis. Crit Care Med. 2001;29:1551–5.
31. Moran I, Cabello B, Manero E, Mancebo J. Comparison of the effects of two humidifier systems on endotracheal tube resistance. Intensive Care Med. 2011;37:1773–9.
32. Restrepo RD, Walsh BK. Humidification during invasive and noninvasive mechanical ventilation: 2012. Respir Care. 2012;57:782–8.
33. Richard JC, Brochard L, Breton L, Aboab J, Vandelet P, Tamion F, Maggiore SM, Mercat A, Bonmarchand G. Influence of respiratory rate on gas trap‑ping during low volume ventilation of patients with acute lung injury. Intensive Care Med. 2002;28:1078–83.
34. de Durante G, del Turco M, Rustichini L, Cosimini P, Giunta F, Hudson LD, Slutsky AS, Ranieri VM. ARDSNet lower tidal volume ventilatory strategy may generate intrinsic positive end‑expiratory pressure in patients with acute respiratory distress syndrome. Am J Respir Crit Care Med. 2002;165:1271–4.
35. Hotchkiss JR Jr, Blanch L, Murias G, Adams AB, Olson DA, Wangensteen OD, Leo PH, Marini JJ. Effects of decreased respiratory frequency on venti‑lator‑induced lung injury. Am J Respir Crit Care Med. 2000;161:463–8.
36. Conrad SA, Zhang S, Arnold TC, Scott LK, Carden DL. Protective effects of low respiratory frequency in experimental ventilator‑associated lung injury. Crit Care Med. 2005;33:835–40.
37. Fanelli V, Ranieri MV, Mancebo J, Moerer O, Quintel M, Morley S, Moran I, Parrilla F, Costamagna A, Gaudiosi M, Combes A. Feasibility and safety of low‑flow extracorporeal carbon dioxide removal to facilitate ultra‑protective ventilation in patients with moderate acute respiratory distress sindrome. Crit Care. 2016;20:36.
38. Terragni PP, Rosboch G, Tealdi A, Corno E, Menaldo E, Davini O, Gandini G, Herrmann P, Mascia L, Quintel M, Slutsky AS, Gattinoni L, Ranieri VM. Tidal hyperinflation during low tidal volume ventilation in acute respiratory distress syndrome. Am J Respir Crit Care Med. 2007;175:160–6.
39. Mauri T, Yoshida T, Bellani G, Goligher EC, Carteaux G, Rittayamai N, Mojoli F, Chiumello D, Piquilloud L, Grasso S, Jubran A, Laghi F, Magder S, Pesenti A, Loring S, Gattinoni L, Talmor D, Blanch L, Amato M, Chen L, Brochard L, Mancebo J. Esophageal and transpulmonary pressure in the clinical setting: meaning, usefulness and perspectives. Intensive Care Med 2016. doi:10.1007/s00134‑016‑4400‑x.
40. Georgopoulos D. Effects of mechanical ventilation on control of breath‑ing. In: Tobin M, editor. Principles and practice of mechanical ventilation. New York: McGraw‑Hill; 2013. p. 805–20.
41. Murias G, Lucangelo U, Blanch L. Patient‑ventilator asynchrony. Curr Opin Crit Care. 2016;22:53–9.

31
SEGUNDO ARTÍCULO
AUTORES: Aguirre‑Bermeo, Hernan; Turella, Marta; Bitondo, Maddalena;
Grandjean, Juan; Italiano, Stefano; Festa, Olimpia; Morán, Indalecio; Mancebo,
Jordi.
TITULO: Lung volumes and lung volume recruitment in ARDS: a comparison
between supine and prone position.
REVISTA: Annals of Intensive Care, Febrero 2018.
D.O.I: 10.1186/s13613-018-0371-0.
FACTOR DE IMPACTO: 3.656 según la ISI Web of KnowledgeSM de 2016

Aguirre‑Bermeo et al. Ann. Intensive Care (2018) 8:25 https://doi.org/10.1186/s13613‑018‑0371‑0
RESEARCH
Lung volumes and lung volume recruitment in ARDS: a comparison between supine and prone positionHernan Aguirre‑Bermeo, Marta Turella, Maddalena Bitondo, Juan Grandjean, Stefano Italiano, Olimpia Festa, Indalecio Morán and Jordi Mancebo*
Abstract
Background: The use of positive end‑expiratory pressure (PEEP) and prone position (PP) is common in the manage‑ment of severe acute respiratory distress syndrome patients (ARDS). We conducted this study to analyze the variation in lung volumes and PEEP‑induced lung volume recruitment with the change from supine position (SP) to PP in ARDS patients.
Methods: The investigation was conducted in a multidisciplinary intensive care unit. Patients who met the clinical criteria of the Berlin definition for ARDS were included. The responsible physician set basal PEEP. To avoid hypoxemia, FiO2 was increased to 0.8 1 h before starting the protocol. End‑expiratory lung volume (EELV) and functional residual capacity (FRC) were measured using the nitrogen washout/washin technique. After the procedures in SP, the patients were turned to PP and 1 h later the same procedures were made in PP.
Results: Twenty‑three patients were included in the study, and twenty were analyzed. The change from SP to PP significantly increased FRC (from 965 ± 397 to 1140 ± 490 ml, p = 0.008) and EELV (from 1566 ± 476 to 1832 ± 719 ml, p = 0.008), but PEEP‑induced lung volume recruitment did not significantly change (269 ± 186 ml in SP to 324 ± 188 ml in PP, p = 0.263). Dynamic strain at PEEP decreased with the change from SP to PP (0.38 ± 0.14 to 0.33 ± 0.13, p = 0.040).
Conclusions: As compared to supine, prone position increases resting lung volumes and decreases dynamic lung strain.
Keywords: ARDS, Lung volumes, Lung strain, Prone, PEEP recruitment, Mechanical ventilation
© The Author(s) 2018. This article is distributed under the terms of the Creative Commons Attribution 4.0 International License (http://creativecommons.org/licenses/by/4.0/), which permits unrestricted use, distribution, and reproduction in any medium, provided you give appropriate credit to the original author(s) and the source, provide a link to the Creative Commons license, and indicate if changes were made.
BackgroundAcute respiratory distress syndrome (ARDS) is a perme-ability pulmonary edema, characterized by hypoxemia and a decrease in lung volumes and respiratory system compliance [1, 2]. In patients with ARDS, prone posi-tion (PP) produces a more homogeneous distribution of the inspired gas [3] and a better matching between ven-tilation and perfusion, thereby improving arterial oxy-genation [3–5]. Positive end-expiratory pressure (PEEP)
and PP have also shown to decrease the percentage of non-aerated and poorly aerated lung tissue and attenu-ate the regional recruitment–derecruitment phenomena [5–7]. In selected ARDS patients, PP has been proposed to further improve the outcomes [8]. The benefit on sur-vival of PP is not related only to the improvement in gas exchange [9, 10], and the protective effect on ventilator-induced lung injury [3, 9, 11, 12] could also play a role. As compared to supine position (SP), the PP reduces the steep transpulmonary pressure gradient across the verti-cal axis of the lung, leading to a more homogeneous dis-tribution of pulmonary stress and strain [2, 3, 13].
However, data analyzing the variation in lung vol-umes with the change from SP to PP in ARDS patients
Open Access
*Correspondence: [email protected] Servei de Medicina Intensiva, Hospital de la Santa Creu i Sant Pau, Universitat Autònoma de Barcelona (UAB), Sant Quintí, 89, 08041 Barcelona, Spain

Page 2 of 9Aguirre‑Bermeo et al. Ann. Intensive Care (2018) 8:25
are scarce and conflicting [4, 14–17]. We hypothesized that in ARDS patients, PP increases lung volumes (i.e., functional residual capacity and end-expiratory lung vol-ume) and might decrease lung strain [16, 18]. Because the measurement of functional residual capacity (FRC) requires to be made at zero end-expiratory pressure (ZEEP), our study included a lung derecruitment maneu-ver from baseline PEEP to zero PEEP [19–21] subse-quently followed by the reinstitution of the basal PEEP level. These allowed to analyze the variation in lung vol-umes and to estimate lung volume recruitment and lung strain in both supine and prone positions in patients with ARDS.
MethodsThe study was performed in the Intensive Care Depart-ment at Hospital de la Santa Creu i Sant Pau, Barcelona (Spain). This study was conducted in accordance with the amended Declaration of Helsinki.
PatientsPatients were considered eligible for the study if they met the Berlin definition criteria for ARDS [22] and had an indication for PP in accordance with our department’s protocol (PaO2/FiO2 ratio of < 150 mm Hg and FiO2 of ≥ 0.6 with PEEP of at least 5 cm H2O). We recommend to use protective ventilation with individualized low tidal volume (Vt) and moderate PEEP levels. Essentially, PEEP is titrated according to the gas exchange (Sat O2, measured by pulse oxymeter, around 95%) with end-inspiratory plateau airway pressure (Pplat) not higher than 28 cm H2O and without hemodynamic instability (mean arterial pressure above 65 mm Hg and no need for fluid replacement). Our detailed ventilatory strategy is included in Additional file 1. Hence, all our patients had been turned in PP before inclusion in the study. To be included, patients had to present an improvement in gas exchange (FiO2 ≤ 0.6 and PEEP ≤ 12 cm H2O) in SP in order to avoid severe hypoxemia because of the dere-cruitment (induced by PEEP withdrawal and ventilation at ZEEP) during the measurement of FRC. Exclusion criteria were: age < 18 years, tracheostomy, pregnancy, major trauma, barotrauma (presence of extra-alveolar air during mechanical ventilation as assessed by daily chest X ray) and hemodynamic instability (systolic blood pressure < 80 or > 160 mm Hg, heart rate < 50 bpm or > 130 bpm or changes in ± 20% from baseline).
All patients were under continuous sedation and anal-gesia with intravenous perfusion of midazolam and/or propofol and opioids. During the study period, all patients received neuromuscular blocking agents.
ProtocolThe following data were collected: age, height, simplified acute physiology score III at admission, ARDS etiology, days of mechanical ventilation, intensive care unit out-comes, respiratory rate, Vt, PEEP, peak airway pressure, Pplat and arterial blood gases. Respiratory variables were recorded directly from the ventilator.
All patients were ventilated in volume control venti-lation using the same ventilator model (Engström Car-estation ICU ventilator, General Electric, Madison, WI, USA).
To avoid hypoxemia, defined as oxygen saturation ≤ 88% measured through pulse oximetry, we increased the FiO2 to 0.8 1 h before starting the protocol.
MeasurementsBaseline ventilatory and hemodynamic parameters were collected before the protocol to measure lung volumes. The same procedures were carried out in SP and PP and are outlined below (see also Fig. 1):
1. Measurement of end-expiratory lung volume (EELV): EELV is the resting end-expiratory lung volume measured at baseline PEEP.
2. Removal of PEEP and continuation of mechanical ventilation at ZEEP. This derecruitment maneuver
Fig. 1 Lung volumes, measurements and calculations made in the study. The same procedures were carried out in supine and prone positions as follows: (1) measurement of end‑expiratory lung volume (EELV): EELV is defined as the resting end‑expiratory lung volume at PEEP. (2) Removal of PEEP and continuation of mechanical ventilation at zero end‑expiratory pressure (ZEEP). (3) Measurement of functional residual capacity (FRC): FRC is defined as the resting lung volume at ZEEP. (4) Measurement of the tidal volume, delivered from ZEEP, that generated a Pplat equal to the basal PEEP. The same calculations were carried out in supine and prone positions as follows: (a) calculation of PEEP‑induced increase in lung volume = EELV minus FRC. (b) Calculation of PEEP‑induced lung volume recruitment (Vrec) = PEEP‑induced increase in lung volume minus the Vt, delivered from ZEEP, that generated a Pplat equal to the basal PEEP. Blue line represents the compliance at ZEEP

Page 3 of 9Aguirre‑Bermeo et al. Ann. Intensive Care (2018) 8:25
is mandatory to conduct the following step 3, and it is the reason to increase the FiO2 to 0.8 immediately before starting the protocol (i.e., to avoid hypoxemia).
3. Measurement of functional residual capacity (FRC): FRC is the resting lung volume measured at ZEEP.
4. Measurement of the Vt, delivered from ZEEP, that generated a Pplat equal to the basal PEEP. This step (see Fig. 1) is mandatory to allow a proper estimation of the PEEP-induced lung volume recruitment [19, 20, 23–25].
Once step 4 was completed, the same PEEP that was used at baseline was resumed.
Measurements at ZEEP (FRC and Vt delivered from ZEEP, that generated a Pplat equal to the basal PEEP) included a lung derecruitment maneuver (PEEP removal) that can produce hypoxemia. For the purpose of our investigation, we defined hypoxemia as oxygen saturation ≤ 88% measured through pulse oximetry.
The safety limits and contraindications to remove PEEP were:
1. PEEP removal was contraindicated if FiO2 > 0.6 and PEEP > 12 cm H2O.
2. We increased the FiO2 to 0.8 1 h before starting the protocol in order to avoid hypoxemia during PEEP removal.
3. If a patient presented with hypoxemia at any time during the protocol (saturation ≤ 88% measured through pulse oximetry), the measurements were aborted and the patient was excluded.
Lung volumes (EELV and FRC) were measured twice using the nitrogen washout/washin technique avail-able in Engström Carestation ICU ventilator as previ-ously described [24, 26]. Washout/washin technique is a multiple breath maneuver that with a modification of 0.1 in FiO2 calculates the residual nitrogen in the lung (assuming there is not exchange of nitrogen) by continu-ous measurements of oxygen and carbon dioxide. The ventilator was carefully calibrated before the measure-ments according to the manufacturer’s specifications. We obtained four values for each lung volume. The mean of the four values was used. As previously suggested [27], patients were excluded if the differences between the four values were more than 20% (cutoff determined by the manufacturer).
After the procedures in SP, the patients were turned to PP and 1 h later the same procedures (from 1 to 4 above) were made in PP. This time span was based in previous data showing that after 1 h in PP gas exchange is stable in the majority of patients [28, 29]. If a patient presented with hypoxemia (oxygen saturation ≤ 88%) at any time
during the protocol, the measurements were aborted and the patient was excluded.
The normal reference values for FRC (liters) in the SP were calculated according to the equation described by Ibáñez and Raurich [30], as follows: 5.48 × height—7.05 for men and 1.39 × height—0.424 for women; height units are in meters. Compliance (ml/cm H2O) was calcu-lated as Vt/(Pplat minus total PEEP), being total PEEP the sum of PEEP plus intrinsic PEEP. Predicted body weight was calculated as follows: 50 + 0.91(height—152.4) for men and 45.5 + 0.91(height—152.4) for women; height units are in centimeters. Driving airway pressure was cal-culated as the difference between Pplat and total PEEP [31].
Calculation of lung volumes and strain(a) The PEEP-induced increase in lung volume was cal-
culated as EELV minus FRC (see Fig. 1).(b) PEEP-induced lung volume recruitment (Vrec) was
calculated as PEEP-induced increase in lung vol-ume minus the Vt, delivered from ZEEP, that gener-ated a Pplat equal to the basal PEEP (see Fig. 1).
(c) Strain was calculated as previously described [24, 32, 33]:
1. Dynamic strain at ZEEP = Vt/FRC.2. Dynamic strain at PEEP = Vt/(FRC + Vrec).3. Static strain at PEEP = (EELV − FRC)/
(FRC + Vrec).4. Global strain at PEEP = (static
strain at PEEP + dynamic strain at PEEP) = (EELV − FRC + Vt)/(FRC + Vrec).
Statistical analysisData are expressed as mean ± SD. We used Wilcoxon test to compare variables between supine and prone posi-tions and U the Mann–Whiney test to compare early and non-early ARDS patients. A p value < 0.05 was consid-ered statistically significant. The SPSS® Statistics (version 20.0, Chicago, IL, USA) statistical software was used for statistical analysis.
ResultsThe study was conducted from July 2010 to December 2013. Twenty-three patients were included in the study, and twenty were analyzed. One patient was excluded because of hypoxemia during the FRC measurement, and two were excluded because of a technical problem. (The differences between FRC measurements were > 20%.)
Table 1 summarizes the patients’ main characteristics at baseline. The mean age of patients was 58 ± 18 years. The main causes of ARDS were pneumonia (n = 11) and septic shock (n = 4). The study was performed 4 ± 3 days

Page 4 of 9Aguirre‑Bermeo et al. Ann. Intensive Care (2018) 8:25
Tabl
e 1
Pati
ents
’ cha
ract
eris
tics
at s
tudy
ent
ry (w
ith
FiO
2 0.8
)
ARD
S ac
ute
resp
irato
ry d
istr
ess
synd
rom
e, D
die
d, P
BW p
redi
cted
bod
y w
eigh
t, M
V m
echa
nica
l ven
tilat
ion,
PEE
P po
sitiv
e en
d‑ex
pira
tory
pre
ssur
e, P
plat
end
‑insp
irato
ry p
late
au a
irway
pre
ssur
e, R
R re
spira
tory
rate
, S
surv
ived
, SAP
S III
sim
plifi
ed a
cue
phys
iolo
gy s
core
III,
Vt ti
dal v
olum
e, ∆
Paw
driv
ing
airw
ay p
ress
ure
Patie
ntA
ge (y
ears
)D
ays
on M
V be
fore
stu
dySA
PS II
IVt
(ml/k
g PB
W)
RR (r
pm)
PEEP
(cm
H
2O)
Ppla
t (cm
H
2O)
Δ P
aw (c
m
H2O
)Pa
O2/
FiO
2 (m
m H
g)Pa
CO2
(mm
Hg)
Caus
e of
ARD
SO
utco
me
143
665
7.4
248
2820
255
40Pn
eum
onia
S
266
152
6.1
2210
2010
254
60Pn
eum
onia
S
377
591
6.7
2010
2212
165
44Pn
eum
onia
S
468
469
8.4
2412
219
255
44Pn
eum
onia
S
575
465
7.8
2210
188
115
38Pn
eum
onia
S
665
794
9.2
3010
2111
240
53Pn
eum
onia
S
755
267
6.8
2010
2212
229
35Pe
riton
itis
S
843
277
8.1
208
2618
151
48Pe
riton
itis
D
978
310
06.
327
1029
1918
841
Perit
oniti
sD
1074
282
11.0
2510
2818
198
43Pn
eum
onia
D
1181
489
6.7
2410
2010
230
34Se
ptic
sho
ckS
1230
483
6.8
2110
2313
265
41Se
ptic
sho
ckD
1358
571
5.0
3010
2010
173
43Pn
eum
onia
S
1469
110
15.
928
1028
1830
044
Sept
ic s
hock
D
1550
1495
6.0
3010
2515
206
42Se
ptic
sho
ckD
1655
368
7.0
208
1911
129
37Th
orac
ic
Trau
ma
S
1730
464
6.2
2412
2210
104
41Pn
eum
onia
S
1837
376
5.0
3012
2210
299
29Pn
eum
onia
D
1980
282
6.1
1712
197
230
35Pn
eum
onia
S
2031
565
6.7
2612
2715
218
24Pa
ncre
atiti
sD
Mea
n ±
SD
58 ±
18
4 ±
378
± 1
46.
9 ±
1.4
24 ±
410
± 1
23 ±
413
± 4
41 ±
841
± 8

Page 5 of 9Aguirre‑Bermeo et al. Ann. Intensive Care (2018) 8:25
after starting mechanical ventilation. At baseline, mean Vt was 6.9 ± 1.4 ml/kg of predicted body weight and mean PEEP was 10 ± 1 cm H2O.
After assuming the PP, the PaO2/FiO2 ratio increased significantly, from 210 ± 57 mm Hg in supine to 281 ± 109 mm Hg in prone (p = 0.008) (Table 2).
The mean FRC in SP was significantly lower than its reference value in healthy normal subjects (965 ± 397 vs. 2424 ± 459 ml, p ≤ 0.001). The change from SP to PP significantly increased both FRC (from 965 ± 397 to 1140 ± 490 ml, p = 0.008) and EELV (from 1566 ± 476 to 1832 ± 719 ml, p = 0.008) (Figs. 2, 3).
We did not calculate Vrec and derived parameters in four patients because the tidal volume delivered from ZEEP, that generated a Pplat equal to the basal PEEP, was not measured in accordance to the protocol. Vrec (n = 16) did not significantly vary with the change of position (269 ± 186 ml in SP to 324 ± 188 ml in PP, p = 0.263) (Fig. 2).
We found a significant decrease in the dynamic strain at PEEP with the change from SP to PP from 0.38 ± 0.14 to 0.33 ± 0.13 (p = 0.040) (Fig. 4). The dynamic strain at ZEEP also decreased, from 0.52 ± 0.23 in SP to 0.44 ± 0.18 in PP (p = 0.047). The remaining variables did not change significantly between supine and prone positions (Table 2) (Additional file 2: Table S1).
In the whole population, the driving pressure in the non-survivor group (n = 8) was significantly higher than in the survivor group (n = 12) in both SP (16 ± 3 cm H2O vs. 11 ± 3 cm H2O, respectively, p = 0.003) and
in PP (15 ± 3 cm H2O vs. 11 ± 3 cm H2O, respectively, p = 0.005). Additional data are also shown (Additional file 2: Table S2).
DiscussionThe main findings in this study were that: (1) Prone posi-tion significantly increased lung volumes; (2) dynamic strain decreased significantly in prone position compared to supine position; and (3) the change of position from supine to prone did not modify the calculated PEEP-induced lung volume recruitment.
Prone position, oxygenation and lung volumesIn ARDS patients, lung volumes at ZEEP (FRC) and at PEEP (EELV) are typically decreased [18]. Two previous studies have shown that PP significantly increases FRC in ARDS patients [15, 16]. Nevertheless, data about the changes in EELV with the change from SP to PP in ARDS patients are not consistent. Four previous studies have shown that PP increases EELV in ARDS patients as com-pared to SP [14–17], but another study [4] found that the change of EELV from SP to PP was not significant. These contradictory findings might be explained by differences in lung recruitability, distribution and extension of lung volume alterations, differences in chest wall compliance, the influence of abdominal weight and heart compres-sion, the inclination from the horizontal plane and the use or not of ventral supports [3, 9, 34, 35].
In the present study, we found a 40% decrease in FRC as compared to its reference value in SP, confirming
Table 2 Main characteristics of all patients in each position
Data are presented as mean ± SD. Dynamic strain at ZEEP = Vt/FRC; dynamic strain at PEEP = Vt/(FRC + Vrec); static strain at PEEP = (EELV − FRC)/(FRC + Vrec); global strain at PEEP = (EELV − FRC + Vt)/(FRC + Vrec)
EELV end‑expiratory lung volume, FRC functional residual capacity, PEEP positive end‑expiratory pressure, Pplat end‑inspiratory plateau airway pressure, Vrec PEEP‑induced lung volume recruitment, Vt tidal volume, ∆ Paw driving airway pressure
Variable Supinen = 20
Pronen = 20
p
PaO2/FiO2 (mm Hg) 210 ± 57 281 ± 109 0.021
PaCO2 (mm Hg) 41 ± 8 42 ± 9 0.400
Peak airway pressure (cm H2O) 41 ± 7 41 ± 6 0.284
Pplat (cm H2O) 23 ± 4 23 ± 4 0.446
Compliance (ml/cm H2O) 36 ± 11 37 ± 10 0.594
Δ Paw (cm H2O) 13 ± 4 12 ± 4 0.446
FRC (ml) 965 ± 397 1140 ± 490 0.021
EELV (ml) 1566 ± 476 1832 ± 719 0.009
Vt delivered from ZEEP, that generated a Pplat equal to basal PEEP [ml (n = 16)] 333 ± 105 360 ± 127 0.073
Vrec [ml (n = 16)] 269 ± 186 324 ± 188 0.501
Dynamic strain at ZEEP 0.52 ± 0.23 0.44 ± 0.18 0.040
Dynamic strain at PEEP (n = 16) 0.38 ± 0.14 0.33 ± 0.13 0.020
Static strain at PEEP (n = 16) 0.51 ± 0.16 0.48 ± 0.13 0.438
Global strain at PEEP (n = 16) 0.89 ± 0.24 0.81 ± 0.18 0.121

Page 6 of 9Aguirre‑Bermeo et al. Ann. Intensive Care (2018) 8:25
previous results [18]. We also observed that the FRC and EELV increased significantly with the change of position (18% in FRC and 17% in EELV). Santini et al. [7] per-formed a study in animals with normal lungs, and they found a significant increase in FRC with the change from SP to PP. The increase in resting lung volume was mainly related to a redistribution of aeration: a minor decrease in non-aerated lung tissue (3%), a major decrease in poorly aerated tissue (17%) and a major increase (20%) in well-aerated tissue. Since recruitment, as precisely measured by thoracic CT scan, refers to tissue recruitment (i.e., amount of non-inflated tissue that reinflates at a higher pressure), the decrease in poorly aerated tissue and the increase in well-aerated tissue (which contribute to the end-expiratory lung volume increase induced by PEEP) are thus considered as better gas distribution within the lung and not recruitment per se [36].
Prone position and strainDuring passive mechanical ventilation, the force applied by the ventilator generates an internal tension in the fib-ers of the lung skeleton, called “stress,” and the elongation of these fibers from their resting position is called “strain” [2]. High values of dynamic lung strain (lung deformation caused by Vt) and static lung strain (lung deformation caused by PEEP) are associated with ventilator-induced lung injury [32, 37].
In an animal model, Protti et al. [33] showed that for the same global strain, a large static strain is less harmful than a large dynamic strain. On the same vein, González-López et al. [38] found that increased strain was associ-ated with a proinflammatory lung response in patients with acute lung injury. Moreover, Bellani et al. [39] found in patients with acute lung injury that the intensity of metabolic activity (a surrogate of inflammation) detected by positron emission tomography was correlated with regional strain. Consequently, the significant decrease in dynamic strain in PP as compared to SP could be another mechanism of protection of PP against ventilator-induced lung injury. Therefore, the measurement of lung volumes at bedside may be an important tool to deliver a more physiologically based ventilation and encour-age physicians to increase the use of PP in moderately to severe ARDS patients [40].
Prone position and PEEP‑induced lung volume recruitmentIt is still unclear whether the PEEP-induced alveolar recruitment varies with the change from SP to PP. In an experimental study in animals with lung injury, Richard et al. [5] analyzed the variation of alveolar recruitment at PEEP 10 cm H2O in SP and PP by means of the positron emission tomography technique. They found that in PP, PEEP-induced alveolar recruitment was not higher than in SP. Interestingly, in this study, the authors observed a redistribution of densities in PP (recruitment in dorsal regions with derecruitment in ventral regions). Cornejo et al. [6] performed another study in ARDS patients to determine the effects of PEEP and PP on alveolar recruit-ment. Using the CT scan technique, they found that increasing PEEP from 5 cm H2O to 15 cm H2O signifi-cantly increased alveolar recruitment. However, the per-centage of recruitment was similar in both positions (36% in SP and 33% in PP). Using a different methodology, the data from our study are consistent with these find-ings, indicating that the effects of PEEP on lung volume recruitment are similar in both positions (around 17% of EELV).
A previous study by Grasso et al. [41] found that alveolar recruitment was higher in the early phase (1 ± 0.3 days of mechanical ventilation) than in the late phase of ARDS, but a subsequent study by Gattinoni
Fig. 2 Variation of lung volumes with the change of position. a Comparison of different values of functional residual capacity. b Comparison of EELV and Vrec in supine position and prone position. EELV, end‑expiratory lung volume; Vrec, PEEP‑induced lung volume recruitment; Vt, tidal volume. Data are presented in mean (ml) and SD. *According to the equation described by Ibañez and Raurich [30]

Page 7 of 9Aguirre‑Bermeo et al. Ann. Intensive Care (2018) 8:25
et al. [42] did not find the same results. In the study of Gattinoni et al. [42], they found that the number of days of mechanical ventilation before the study was similar in patients with a lower percentage of potentially recruita-ble lung and those with a higher percentage (5 ± 6 vs. 6 ± 6 days, respectively, p = 0.50). In our study when we classified ARDS patients in the early phase (< 72 h) and in late phase (> 72 h) (Additional file 2: Table S2), we observed results similar to those of Gattinoni et al. [42]: no statistical differences in lung volume recruit-ment between the early and late phase group were detected. In our study, however, in the early phase of
ARDS, lung volumes increased and strain decreased with the change from SP to PP, whereas in late phase ARDS we did not observe these findings (Additional file 2: Table S2). These differences could be related to the pres-ence of some degree of hydrostatic pulmonary edema in the early phase of ARDS, and to the presence of fibro-sis in the non-early phase of ARDS that predisposes to non-responsiveness to PP in terms of increasing in lung volumes and decreasing strain [43]. Our findings thus suggest that the survival benefit may, in part, be related to the early application of PP as it increases resting lung volumes and decreases lung strain compared to SP. It is also tempting to speculate that the lack of differences in Vrec between supine and prone, and the increase in over-all lung volume in prone as compared to supine, can be explained by a decrease of poorly ventilated areas and an increase of well ventilated areas, which in turn might help to decrease lung inhomogeneity. It has been shown that the extent of lung inhomogeneities (as quantified by the amount of poorly ventilated tissue) is associated with worse outcomes in ARDS patients, possibly due to a mechanism of “stress raisers” [44].
LimitationsLike many physiological studies [4, 6, 14–17, 34], our study has a relatively low number of patients. Another limitation is that the measurement of FRC could be sub-ject to the tolerance to PEEP removal and the FiO2 used. However, when the study was performed, all the patients met the criteria for mild–moderate ARDS according to the Berlin definition [22]. We did not perform a multi-slice spiral lung computed tomography to measure the quantitative changes in alveolar aeration induced by PEEP and PP. Other measurements of lung mechanics (i.e., esophageal pressure and derived variables) and lung biomarkers could help to further explain the effects of PEEP and positioning in ARDS patients, but we did not do these because of lack of adequate equipment at the time of the study. Finally, to confirm the changes, it might have been useful to return the patients from PP to SP and to repeat the same procedures and measurements; this was not done, however, because most patients remained in the PP as per clinical decision after the study had been completed.
ConclusionsAs compared to supine, prone position increases rest-ing lung volumes without significantly changing the recruited volume kept by PEEP. Moreover, the change of position from supine to prone decreases dynamic lung strain. These findings help to better understand the ben-eficial effects of prone position in ARDS patients.
Fig. 3 Variation in lung volumes in supine and prone positions. Clear triangles and clear rhombus are the resting lung volumes at ZEEP and at PEEP. Dark triangles and dark rhombus represent end‑inspiratory lung volumes and end‑inspiratory lung pressure (Pplat) at ZEEP and at PEEP. PEEP, positive end‑expiratory pressure; ZEEP, zero end‑expira‑tory pressure. Data are shown as mean and SD
Fig. 4 Variation of individual values of global and dynamic strain at PEEP with the change of position. Dark lines represent mean and SD. PEEP, positive end‑expiratory pressure

Page 8 of 9Aguirre‑Bermeo et al. Ann. Intensive Care (2018) 8:25
AbbreviationsARDS: acute respiratory distress syndrome; EELV: end‑expiratory lung volume; FRC: functional residual capacity; PEEP: positive end‑expiratory pressure; PP: prone position; Pplat: end‑inspiratory plateau airway pressure; SP: supine posi‑tion; Vrec: PEEP‑induced lung volume recruitment; Vt: tidal volume; ZEEP: zero end‑expiratory pressure.
Authors’ contributionsAll authors participated in the study design, data collection and analysis, manuscript writing and final approval. All authors read and approved the final manuscript.
Competing interestsGeneral Electric provided the equipment (Engström Carestation ICU ventila‑tor) to conduct this research.
AcknowledgementsNot applicable.
Availability of data and materialsNot applicable.
Consent for publicationThe patients’ relatives gave written informed consent to participate and publish.
Ethics approval and consent to participateThe ethics committee of Hospital de la Santa Creu i Sant Pau approved the study (Reference 68/2010).
Publisher’s NoteSpringer Nature remains neutral with regard to jurisdictional claims in pub‑lished maps and institutional affiliations.
Received: 2 November 2017 Accepted: 8 February 2018
References 1. Ware LB, Matthay MA. The acute respiratory distress syndrome. N Engl J
Med. 2000;342:1334–49. 2. Gattinoni L, Pesenti A. The concept of “baby lung”. Intensive Care Med.
2005;31:776–84. 3. Gattinoni L, Taccone P, Carlesso E, Marini JJ. Prone position in acute res‑
piratory distress syndrome. Rationale, indications, and limits. Am J Respir Crit Care Med. 2013;188:1286–93.
4. Pelosi P, Tubiolo D, Mascheroni D, Vicardi P, Crotti S, Valenza F, Gattinoni L. Effects of the prone position on respiratory mechanics and gas exchange during acute lung injury. Am J Respir Crit Care Med. 1998;157:387–93.
5. Richard JC, Bregeon F, Costes N, Bars DL, Tourvieille C, Lavenne F, Janier M, Bourdin G, Gimenez G, Guerin C. Effects of prone position and positive end‑expiratory pressure on lung perfusion and ventilation. Crit Care Med. 2008;36:2373–80.
6. Cornejo RA, Diaz JC, Tobar EA, Bruhn AR, Ramos CA, Gonzalez RA, Repetto CA, Romero CM, Galvez LR, Llanos O, Arellano DH, Neira WR, Diaz GA, Zamorano AJ, Pereira GL. Effects of prone positioning on lung protection in patients with acute respiratory distress syndrome. Am J Respir Crit Care Med. 2013;188:440–8.
Additional file
Additional file 1. The institutional protocol.
Additional file 2. Additional patient per patient physiological data in supine and prone position (Table S1 and Table S2).
7. Santini A, Protti A, Langer T, Comini B, Monti M, Sparacino CC, Dondossola D, Gattinoni L. Prone position ameliorates lung elastance and increases functional residual capacity independently from lung recruitment. Inten‑sive Care Med Exp. 2015;3:55.
8. Guerin C, Reignier J, Richard JC, Beuret P, Gacouin A, Boulain T, Mercier E, Badet M, Mercat A, Baudin O, Clavel M, Chatellier D, Jaber S, Rosselli S, Mancebo J, Sirodot M, Hilbert G, Bengler C, Richecoeur J, Gainnier M, Bayle F, Bourdin G, Leray V, Girard R, Baboi L, Ayzac L. Prone posi‑tioning in severe acute respiratory distress syndrome. N Engl J Med. 2013;368:2159–68.
9. Albert RK, Keniston A, Baboi L, Ayzac L, Guerin C. Prone position‑induced improvement in gas exchange does not predict improved survival in the acute respiratory distress syndrome. Am J Respir Crit Care Med. 2014;189:494–6.
10. Guerin C, Baboi L, Richard JC. Mechanisms of the effects of prone positioning in acute respiratory distress syndrome. Intensive Care Med. 2014;40:1634–42.
11. Broccard A, Shapiro RS, Schmitz LL, Adams AB, Nahum A, Marini JJ. Prone positioning attenuates and redistributes ventilator‑induced lung injury in dogs. Crit Care Med. 2000;28:295–303.
12. Valenza F, Guglielmi M, Maffioletti M, Tedesco C, Maccagni P, Fossali T, Aletti G, Porro GA, Irace M, Carlesso E, Carboni N, Lazzerini M, Gattinoni L. Prone position delays the progression of ventilator‑induced lung injury in rats: does lung strain distribution play a role? Crit Care Med. 2005;33:361–7.
13. Mutoh T, Guest RJ, Lamm WJ, Albert RK. Prone position alters the effect of volume overload on regional pleural pressures and improves hypoxemia in pigs in vivo. Am Rev Respir Dis. 1992;146:300–6.
14. Pelosi P, Bottino N, Chiumello D, Caironi P, Panigada M, Gamberoni C, Colombo G, Bigatello LM, Gattinoni L. Sigh in supine and prone position during acute respiratory distress syndrome. Am J Respir Crit Care Med. 2003;167:521–7.
15. Mentzelopoulos SD, Roussos C, Zakynthinos SG. Static pressure volume curves and body posture in acute respiratory failure. Intensive Care Med. 2005;31:1683–92.
16. Mentzelopoulos SD, Roussos C, Zakynthinos SG. Prone position reduces lung stress and strain in severe acute respiratory distress syndrome. Eur Respir J. 2005;25:534–44.
17. Reutershan J, Schmitt A, Dietz K, Unertl K, Fretschner R. Alveolar recruitment during prone position: time matters. Clin Sci (Lond). 2006;110:655–63.
18. Chiumello D, Carlesso E, Cadringher P, Caironi P, Valenza F, Polli F, Tallarini F, Cozzi P, Cressoni M, Colombo A, Marini JJ, Gattinoni L. Lung stress and strain during mechanical ventilation for acute respiratory distress syndrome. Am J Respir Crit Care Med. 2008;178:346–55.
19. Jonson B, Richard JC, Straus C, Mancebo J, Lemaire F, Brochard L. Pressure‑volume curves and compliance in acute lung injury: evidence of recruitment above the lower inflection point. Am J Respir Crit Care Med. 1999;159:1172–8.
20. Maggiore SM, Jonson B, Richard JC, Jaber S, Lemaire F, Brochard L. Alveo‑lar derecruitment at decremental positive end‑expiratory pressure levels in acute lung injury: comparison with the lower inflection point, oxy‑genation, and compliance. Am J Respir Crit Care Med. 2001;164:795–801.
21. Crotti S, Mascheroni D, Caironi P, Pelosi P, Ronzoni G, Mondino M, Marini JJ, Gattinoni L. Recruitment and derecruitment during acute respiratory failure: a clinical study. Am J Respir Crit Care Med. 2001;164:131–40.
22. Ranieri VM, Rubenfeld GD, Thompson BT, Ferguson ND, Caldwell E, Fan E, Camporota L, Slutsky AS. Acute respiratory distress syndrome: the Berlin Definition. JAMA. 2012;307:2526–33.
23. Ranieri VM, Giuliani R, Fiore T, Dambrosio M, Milic‑Emili J. Volume‑pressure curve of the respiratory system predicts effects of PEEP in ARDS: “occlusion” versus “constant flow” technique. Am J Respir Crit Care Med. 1994;149:19–27.
24. Dellamonica J, Lerolle N, Sargentini C, Beduneau G, Di Marco F, Mercat A, Richard JC, Diehl JL, Mancebo J, Rouby JJ, Lu Q, Bernardin G, Brochard L. PEEP‑induced changes in lung volume in acute respiratory distress syndrome. Two methods to estimate alveolar recruitment. Intensive Care Med. 2011;37:1595–604.
25. Richard JC, Brochard L, Vandelet P, Breton L, Maggiore SM, Jonson B, Clabault K, Leroy J, Bonmarchand G. Respective effects of end‑expiratory

Page 9 of 9Aguirre‑Bermeo et al. Ann. Intensive Care (2018) 8:25
and end‑inspiratory pressures on alveolar recruitment in acute lung injury. Crit Care Med. 2003;31:89–92.
26. Olegard C, Sondergaard S, Houltz E, Lundin S, Stenqvist O. Estimation of functional residual capacity at the bedside using standard moni‑toring equipment: a modified nitrogen washout/washin technique requiring a small change of the inspired oxygen fraction. Anesth Analg. 2005;101:206–12.
27. Dellamonica J, Lerolle N, Sargentini C, Beduneau G, Di Marco F, Mercat A, Richard JC, Diehl JL, Mancebo J, Rouby JJ, Lu Q, Bernardin G, Brochard L. Accuracy and precision of end‑expiratory lung‑volume measurements by automated nitrogen washout/washin technique in patients with acute respiratory distress syndrome. Crit Care. 2011;15:R294.
28. Chatte G, Sab JM, Dubois JM, Sirodot M, Gaussorgues P, Robert D. Prone position in mechanically ventilated patients with severe acute respiratory failure. Am J Respir Crit Care Med. 1997;155:473–8.
29. Mancebo J, Fernandez R, Blanch L, Rialp G, Gordo F, Ferrer M, Rodriguez F, Garro P, Ricart P, Vallverdu I, Gich I, Castano J, Saura P, Dominguez G, Bonet A, Albert RK. A multicenter trial of prolonged prone ventilation in severe acute respiratory distress syndrome. Am J Respir Crit Care Med. 2006;173:1233–9.
30. Ibanez J, Raurich JM. Normal values of functional residual capacity in the sitting and supine positions. Intensive Care Med. 1982;8:173–7.
31. Amato MB, Meade MO, Slutsky AS, Brochard L, Costa EL, Schoenfeld DA, Stewart TE, Briel M, Talmor D, Mercat A, Richard JC, Carvalho CR, Brower RG. Driving pressure and survival in the acute respiratory distress syn‑drome. N Engl J Med. 2015;372:747–55.
32. Protti A, Cressoni M, Santini A, Langer T, Mietto C, Febres D, Chierichetti M, Coppola S, Conte G, Gatti S, Leopardi O, Masson S, Lombardi L, Lazzerini M, Rampoldi E, Cadringher P, Gattinoni L. Lung stress and strain during mechanical ventilation: any safe threshold? Am J Respir Crit Care Med. 2011;183:1354–62.
33. Protti A, Andreis DT, Monti M, Santini A, Sparacino CC, Langer T, Votta E, Gatti S, Lombardi L, Leopardi O, Masson S, Cressoni M, Gattinoni L. Lung stress and strain during mechanical ventilation: any difference between statics and dynamics? Crit Care Med. 2013;41:1046–55.
34. Galiatsou E, Kostanti E, Svarna E, Kitsakos A, Koulouras V, Efremidis SC, Nakos G. Prone position augments recruitment and prevents alveolar overinflation in acute lung injury. Am J Respir Crit Care Med. 2006;174:187–97.
35. Nieszkowska A, Lu Q, Vieira S, Elman M, Fetita C, Rouby JJ. Incidence and regional distribution of lung overinflation during mechanical ventilation with positive end‑expiratory pressure. Crit Care Med. 2004;32:1496–503.
36. Chiumello D, Marino A, Brioni M, Cigada I, Menga F, Colombo A, Crimella F, Algieri I, Cressoni M, Carlesso E, Gattinoni L. Lung recruitment assessed by respiratory mechanics and computed tomography in patients with acute respiratory distress syndrome. What Is the relationship? Am J Respir Crit Care Med. 2016;193:1254–63.
37. Dreyfuss D, Saumon G. Ventilator‑induced lung injury: lessons from experimental studies. Am J Respir Crit Care Med. 1998;157:294–323.
38. Gonzalez‑Lopez A, Garcia‑Prieto E, Batalla‑Solis E, Amado‑Rodriguez L, Avello N, Blanch L, Albaiceta GM. Lung strain and biological response in mechanically ventilated patients. Intensive Care Med. 2012;38:240–7.
39. Bellani G, Guerra L, Musch G, Zanella A, Patroniti N, Mauri T, Messa C, Pesenti A. Lung regional metabolic activity and gas volume changes induced by tidal ventilation in patients with acute lung injury. Am J Respir Crit Care Med. 2011;183:1193–9.
40. Guerin C, Beuret P, Constantin JM, Bellani G, Garcia‑Olivares P, Roca O, Meertens JH, Maia PA, Becher T, Peterson J, Larsson A, Gurjar M, Hajjej Z, Kovari F, Assiri AH, Mainas E, Hasan MS, Morocho‑Tutillo DR, Baboi L, Chre‑tien JM, Francois G, Ayzac L, Chen L, Brochard L, Mercat A, investigators of the APRONET Study Group, the REVA Network, the Réseau recherche de la Société Française d’Anesthésie‑Réanimation (SFAR‑recherche), the ESICM Trials Group. A prospective international observational prevalence study on prone positioning of ARDS patients: the APRONET (ARDS Prone Position Network) study. Intensive Care Med. 2018;44:22–37. https://doi.org/10.1007/s00134‑017‑4996‑5.
41. Grasso S, Mascia L, Del Turco M, Malacarne P, Giunta F, Brochard L, Slutsky AS, Marco Ranieri V. Effects of recruiting maneuvers in patients with acute respiratory distress syndrome ventilated with protective ventilatory strategy. Anesthesiology. 2002;96:795–802.
42. Gattinoni L, Caironi P, Cressoni M, Chiumello D, Ranieri VM, Quintel M, Russo S, Patroniti N, Cornejo R, Bugedo G. Lung recruitment in patients with the acute respiratory distress syndrome. N Engl J Med. 2006;354:1775–86.
43. Nakos G, Tsangaris I, Kostanti E, Nathanail C, Lachana A, Koulouras V, Kastani D. Effect of the prone position on patients with hydrostatic pulmonary edema compared with patients with acute respiratory distress syndrome and pulmonary fibrosis. Am J Respir Crit Care Med. 2000;161:360–8.
44. Cressoni M, Cadringher P, Chiurazzi C, Amini M, Gallazzi E, Marino A, Brioni M, Carlesso E, Chiumello D, Quintel M, Bugedo G, Gattinoni L. Lung inhomogeneity in patients with acute respiratory distress syndrome. Am J Respir Crit Care Med. 2014;189:149–58.

Additional file 1. The institutional protocol.InstitutionalProtocolOur institutional protocol is based on previous data and experience[1-3] and isdetailedbelow.
MechanicalventilationsettingsinARDSpatientsThe volume assist-control mode with constant inspiratory flow is used. Werecommendtouseprotectiveventilationwithindividualizedlowtidalvolume(Vt)and moderate PEEP levels. Essentially, PEEP is titrated according to the gasexchange(SatO2,measuredbypulseoxymeter,around95%)withend-inspiratoryplateau airway pressure (Pplat) not higher than 28 cm H2O and withouthemodynamicinstability(meanarterialpressureabove65mmHgandnoneedforfluid replacement), and an inspiratory to expiratory ratio ≤ 1:2 have to be setimmediatelyafterARDSdiagnosis.PronePositionIfpatienthaveaPaO2/FiO2ratioof<150mmHgandFiO2of≥0.6withPEEPofatleast5cmH2Othephysicianmusttoconsiderproneposition.ThepatientshavetobemaintainedinPPforatleast16consecutivehours.ThepronesessionscouldbestoppedwhenPaO2/FIO2ratioare≥150mmHgwithPEEP≤10cmH2OandFiO2≤0.6 measured in supine position and after one our of the last prone positionphase.
BerlinARDScriteria NO
PaO2/FiO2ra5oof<150mmHgFiO2of≥0.6
PEEPofatleast5cmH2ONO
YES
Proneposi5oninthefirst24H
Protec5veven5la5on*
YES
*Tidalvolumearound6ml/kgofpredictedbodyweightandPEEPtoreachaPlateaupressurenothigher
than28cmH2O.
Neuromuscularblockingagentsarerecommendedduringthefirst48H

Five people were usually involved and the process typically took five to tenminutes. One person has to be dedicated to themanagement of the head of thepatient,theendotrachealtubeandtheventilatorlines.Thispersonattheheadofthebedhadtocoordinatethestepsoftheprocedure.Aftertheturn,thepatients’armswereplacedalongsidetheirbodies.Theirheadsandnecksweremovedfromlateraltomidlinetocontralateralpositionsatvaryingintervals. Special care was taken to protect the eyes. A slight reverseTrendelenburgpositionisusedtominimizefacialedema.Neuromuscular blocking agents are used early and have to be stopped at thediscretionoftheattendingphysicianfrom48hoursofARDStreatment.Insupineandpronepositiontheinclinationwas30°fromthehorizontal.WeaningWhen the prone sessions were stopped the physician could considered to startweaningphase.FirstwemadeagraduallydecreaseofPEEP(stepsof2cmH2O)upto8cmH2O(keepingarterialoxygensaturationbetween93and98%,estimatedbyapulseoximeter).ThenFiO2wasgraduallydecreasedto0.45tokeepthesamearterial oxygen saturation. At this time, the use of pressure support ventilationcouldbeconsidered.Theinitiallevelofpressuresupportwastitratedtoachievearespiratory rate of 25-30breaths/minute andwasdecreased twiceperday (2-4cmH2Oeachtime)asclinicallytolerated.Lastly,PEEPwasdecreasedto5cmH2O.At this moment, extubation had to be considered if patients are capable ofresuming spontaneous breathing. Spontaneous breathing trial was conductedeitherwithpressuresupportventilation(7cmH2OofpressuresupportatZEEP)orT-piece trials in30–120minutes.Spontaneousbreathing trialswereperformedonceortwiceperday.References:1.RialpG,BetbeséAJ,Pérez-MárquezM,ManceboJ.Short-termeffectsofinhalednitric oxide and prone position in pulmonary and extrapulmonary acuterespiratorydistresssyndrome.AmJRespirCritCareMed.2001;164:243-9.2.ManceboJ,FernándezR,BlanchL,RialpG,GordoF,FerrerM,RodriguezF,GarroP,RicartP,VallverdúI,GichI,CastañoJ,SauraP,DomínguezG,BonetA,AlbertRK.A multicenter trial of prolonged prone ventilation in severe acute respiratorydistresssyndrome.AmJRespirCritCareMed.2006;173:1233-9.3.GuérinC,ReignierJ,RichardJC,BeuretP,GacouinA,BoulainT,MercierE,BadetM,MercatA,BaudinO,ClavelM,ChatellierD,JaberS,RosselliS,ManceboJ,SirodotM, Hilbert G, Bengler C, Richecoeur J, Gainnier M, Bayle F, Bourdin G, Leray V,GirardR,BaboiL,AyzacL.Pronepositioning insevereacuterespiratorydistresssyndrome.NEnglJMed.2013;368:2159-68.

1
Additional file 2. Additional patient per patient physiological data in supine and prone position (Table S1 and Table S2). Table S1. Patients’ respiratory characteristics at each position.
Supine Position Prone Position
Patient
Vt at
ZEEP
(ml)
Pplat at
ZEEP
(cmH2O)
Crs at ZEEP
(ml/cm H2O)
∆ Paw at
ZEEP
(cm H2O)
Vt at
PEEP
(ml)
Pplat at
PEEP
(cmH2O)
Crs at PEEP
(ml/cm H2O)
∆ Paw at
PEEP
(cm H2O)
Vt at
ZEEP
(ml)
Pplat at
ZEEP
(cmH2O)
Crs at ZEEP
(ml/cm H2O)
∆ Paw at
ZEEP
(cm H2O)
Vt at
PEEP
(ml)
Pplat at
PEEP
(cmH2O)
Crs at PEEP
(ml/cm H2O)
∆ Paw at
PEEP
(cm H2O)
1
500 28 25 20
500 26 28 18
2
425 20 43 10
425 20 43 10
3
350 22 29 12
350 21 32 11
4
475 21 53 9
475 24 40 12
5 375 10 38 10 425 18 53 8 400 10 40 10 425 18 53 8
6 280 10 28 10 450 21 41 11 300 10 30 10 450 22 38 12
7 325 10 33 10 450 22 38 12 450 10 45 10 450 20 45 10
8 160 8 20 8 475 26 26 18 200 8 25 8 475 21 37 13
9 185 10 19 10 350 29 18 19 200 10 20 10 350 30 18 20
10 300 10 30 10 425 28 24 18 325 10 33 10 425 25 28 15
11 525 10 53 10 475 20 48 10 525 10 53 10 475 20 48 10
12 230 10 23 10 375 23 29 13 220 10 22 10 375 23 29 13
13 350 10 35 10 375 20 38 10 475 10 48 10 375 20 38 10
14 325 10 33 10 375 28 21 18 350 10 35 10 375 29 20 19
15 350 10 35 10 475 25 32 15 370 10 37 10 475 22 40 12
16 350 8 44 8 450 19 41 11 250 8 31 8 450 20 38 12
17 375 12 31 12 400 22 40 10 350 12 29 12 400 20 50 8
18 255 12 21 12 350 22 35 10 375 12 31 12 350 23 32 11
19 550 12 46 12 400 19 57 7 675 12 56 12 400 19 57 7
20 400 12 33 12 500 27 33 15 300 12 25 12 500 30 28 18
Mean ± SD 333 ± 105 10 ± 1 33 ± 10 10 ± 1 425 ± 51 23 ± 4 36 ± 11 13 ± 4 360 ± 127 10 ± 1 35 ± 11 10 ± 1 425 ± 51 23 ± 4 37 ± 10 12 ± 4
Data are presented as mean ± standard deviation.
Abbreviations: Crs, Compliance; PEEP, positive end-expiratory pressure; Pplat, end-inspiratory plateau airway pressure; Vt, Tidal volume; Vt at ZEEP, Vt delivered from ZEEP, that generated a Pplat equal to basal PEEP; ZEEP, Zero end-expiratory
pressure; ∆ Paw, Driving airway pressure.

2
Table S2. Main characteristics of patients in each position according to number of days of mechanical ventilation before the study.
Variable Early
Late
Supine
n=9 Prone n=9 P
Supine n=11
Prone n=11 P
Vt, ml/Kg of PBW (n=20) 6.9 ± 1.7 6.9 ± 1.7
7.0 ± 1.2 7.0 ± 1.2 PEEP, cm H2O (n=20) 10 ± 1 10 ± 1
10 ± 1 10 ± 1
PaO2/FiO2, mm Hg 220 ± 60 302 ± 128 0.093
202 ± 56 264 ± 94 0.075
PaCO2, mm Hg 41 ± 9 42 ± 10 0.999
40 ± 7 42 ± 9 0.182
Peak airway pressure, cm H2O 39 ± 5 42 ± 5 0.064
42 ± 9 41 ± 7 0.905
Pplat, cm H2O 24 ± 4 23 ± 4 0.491
22 ± 3 22 ± 3 0.932
Compliance, ml/cm H2O 34 ± 12 35 ± 12 0.499
38 ± 10 38 ± 9 0.999
∆ Paw, cm H2O 14 ± 5 13 ± 4 0.491
12 ± 3 12 ± 3 0.932
FRC, ml 851 ± 332 1085 ± 354 0.011
1058 ± 436 1185 ± 593 0.424
EELV, ml 1388 ± 435 1772 ± 557 0.011
1711 ± 477 1880 ± 853 0.248
Vt delivered from ZEEP, that generated a Pplat equal to basal PEEP, ml (n=16) 306 ± 120 (n=8) 353 ± 157 (n=8) 0.068
361 ± 87 (n=8) 368 ± 99 (n=8) 0.671
Vrec, ml (n=16) 237 ± 132 (n=8) 275 ± 136 (n=8) 0.674
302 ± 233 (n=8) 374 ± 228 (n=8) 0.575
Dynamic strain at ZEEP 0.57 ± 0.28 0.41 ± 0.12 0.011
0.47 ± 0.17 0.46 ± 0.21 0.722
Dynamic strain at PEEP, (n=16) 0.43 ± 0.16 (n=8) 0.33 ± 0.08 (n=8) 0.012
0.33 ± 0.12 (n=8) 0.33 ± 0.17 (n=8) 0.674
Static strain at PEEP, (n=16) 0.53 ± 0.13 (n=8) 0.49 ± 0.16 (n=8) 0.484
0.49 ± 0.19 (n=8) 0.47 ± 0.10 (n=8) 0.673
Global strain at PEEP, (n=16) 0.96 ± 0.23 (n=8) 0.82 ± 0.16 (n=8) 0.093
0.83 ± 0.25 (n=8) 0.80 ± 0.21 (n=8) 0.484
Data are presented as mean ± standard deviation. Abbreviations: EELV, end-expiratory lung volume; FRC, functional residual capacity; PBW, Predicted body weight; PEEP, Positive end-expiratory pressure; Pplat, end-inspiratory plateau airway pressure; Vrec, PEEP-induced lung volume recruitment; Vd/Vt, dead space; Vt, tidal volume; ∆ Paw, Driving airway pressure (VT / Crs). Dynamic strain at ZEEP = Vt / FRC; Dynamic strain at PEEP = Vt / (FRC + Vrec); Static strain at PEEP = (EELV - FRC) / (FRC + Vrec); Global strain at PEEP = (EELV - FRC + Vt) / (FRC + Vrec).

45
8. RESULTADOS
En el estudio del alargamiento de la pausa inspiratoria a todos los pacientes se
pudo alargar la pausa inspiratoria a 0.7sg manteniendo una PEEP intrínseca <
a 1 cmH2O y sin invertir la relación inspiración-espiración. El alargamiento de la
pausa inspiratoria disminuyó significativamente la fracción de espacio muerto
(Vd/Vt) y la PaCO2 con respecto a la situación basal (0.70 ± 0.07 frente a 0.64 ±
0.08, p=<0.01 y 54 ± 9 mmHg frente a 50 ± 8 mmHg, p=<0.01
respectivamente).
La prolongación de la pausa inspiratoria permitió en la tercera fase del estudio
una disminución significativa del Vt por Kg de peso predicho (PBW) comparado
con los parámetros basales (6.3 ml/Kg/PBW frente a 5.6 ml/Kg/PBW, p=<0.01)
manteniendo los mismos niveles de pH y PaCO2 que en la situación basal.
Las medidas de mecánica respiratoria, intercambio de gases y hemodinámia
están presentadas en la Tabla 1.

46
Tabla 1. Mecánica respiratoria, intercambio de gases y hemodinámia durante el
estudio.
Phase 1 (Basal)
Phase 2 (Alargamiento de
pausa inspiratoria)
Phase 3 (Reducción de
Vt) p = Diferencias
intergrupos
EIP (segundos) 0.12 ± 0.04 0.7 ± 0 0.7 ± 0 <0.001 a, b
Ppico (cmH2O) 38 ± 6 38 ± 6 35 ± 5 <0.001 b, c
Pmedia (cmH2O) Pplat (cmH2O)
15 ± 3
24 ± 3
18 ± 2
24 ± 3
17 ± 2
22 ± 3
<0.001
<0.001
a, b, c
b, c
PEEPi (cmH2O) 0.2 ± 0.2 0.5 ± 0.4 0.5 ± 0.4 0.06
Vt (mL) 378 ± 73 378 ± 73 336 ± 61 <0.001 b, c
Vt (mL/Kg/PBW) 6.3 ± 0.8 6.3 ± 0.8 5.6 ± 0.8 <0.001 b, c
Vdfis (mL) 267 ± 71 244 ± 65 216 ± 58 <0.001 a, b, c
Vd/Vt 0.70 ± 0.07 0.64 ± 0.08 0.64 ± 0.08 <0.001 a, b
Crs (mL/cmH2O) 29 ± 9 29 ± 9 32 ± 11 0.001 b, c
∆ Paw (cmH2O) 13.6 ± 3.6 13.4 ± 3.6 10.9 ± 3.1 <0.001 a, b, c
Raw (cmH2O/L/sg) 14 ± 5 13 ± 5 13 ± 4 0.28
pH 7.31 ± 0.07 7.34 ± 0.09 7.31 ± 0.08 <0.001 a, c
PaO2 (mmHg) 102 ± 23 98 ± 23 105 ± 29 0.35
PaCO2 (mmHg) 54 ± 9 50 ± 8 54 ± 10 <0.001 a, c
EtCO2 (mmHg) 41 ± 6 39 ± 6 43 ± 7 0.002 a, c
P(a-et)CO2 (mmHg) 13 ± 6 12 ± 8 12 ± 9 0.27
PAM (mmHg) 80 ± 12 76 ± 9 77 ± 12 0.08
FC (latidos/min) 87 ± 19 83 ± 20 86 ± 21 0.14
Temperature (°C) 36.7 ± 0.9 36.7 ± 0.9 36.6 ± 0.8 0.61 Los datos están presentados como número (%) o media ± desvío estándar. Crs, Compliancia estática del sistema respiratorio; EIP, pausa inspiratoria; EtCO2, dióxido de carbono exhalado al final de la espiración; FiO2, fracción inspirada de oxigeno; FC, frecuencia cardiaca; PAM, presión arterial media; PaO2, Presión parcial de oxígeno en sangre arterial; PaCO2: Presión parcial de dióxido de carbono en sangre arterial; PBW, Peso Predicho; PEEPi, Presión positiva intrínseca al final de la espiración; Pmedia, presión media; Ppico, presión pico; Pplat, presión plateau; P(a-et)CO2, gradiente de CO2 entre valor arterial y valor exhalado; Raw, resistencia de vías aéreas; Vdfis, espacio muerto fisiológico; Vd/Vt, fracción de espacio muerto; Vt, volume corriente; ∆Paw, presión de distensión estática del sistema respiratorio (Pplat – PEEP). . Diferencias intergrupos (p<0.05): a, fase 1 frente a fase 2; b, fase 1 frente a fase 3; c, fase 2 frente a fase 3.

47
En el estudio de los volúmenes pulmonares la relación entre la PaO2 y FiO2
aumento significativamente con el cambio de supino a prono (210 ± 57 mmHg
frente a 281 ± 109 mmHg, p=0.02). Los volúmenes pulmonares aumentaron
significativamente con el cambio de posición (EELV en supino 1566 ± 476 ml
frente a EELV en prono 1832 ± 719 ml, p=<0.01 y la CRF en supino 965 ±
397ml frente a CRF en prono 1140 ± 490 ml, p=0.02), sin embargo el Vrec no
cambió (269 ± 186 ml en supino frente a 324 ± 188 ml en prono, p=0.5). Con el
cambio de posición de supino a prono se evidenció una disminución
significativa del strain dinámico con PEEP (0.52 ± 0.23 frente a 0.44 ± 0.18,
p=0.04) y del strain dinámico sin PEEP (0.38 ± 0.14 frente a 0.33 ± 0.13,
p=0.02).
Se clasificó a los pacientes de acuerdo al tiempo de diagnóstico de SDRA en
temprano (< 72 horas) n=9 (45%) y tardío (> 72 horas) n=11 (55%). Con el
cambio de posición de supino a prono en los pacientes con SDRA temprano se
encontró un aumento significativo de la CRF (851 ± 332 ml en supino frente a
1085 ± 354 ml en prono, p=0.01) y del EELV (1388 ± 435m ml en supino frente
a 1772 ± 557 ml en prono, p=0.01) sin cambio significativo del Vrec (237 ± 132
ml en supino frente a 275 ± 136 ml en prono, p=0.67) y una disminución
significativa del strain dinámico sin PEEP (0.57 ± 0.28 en supino frente a 0.41 ±
0.12 en prono, p=0.01) y del strain dinámico con PEEP (0.43 ± 0.16 en supino
frente a 0.33 ± 0.08 en prono, p=0.01). Sin embargo, en los pacientes con
SDRA tardío, estos cambios no fueron significativos.
Las principales variables del estudio están detalladas en la Tabla 2.

48
Tabla 2. Características principales de los pacientes en cada posición.
Supino n=20
Prono n=20 p=
PaO2/FiO2, mmHg 210 ± 57 281 ± 109 0.021
PaCO2, mmHg 41 ± 8 42 ± 9 0.400
Ppico, cmH2O 41± 7 41 ± 6 0.284
Pplat, cmH2O 23 ± 4 23 ± 4 0.446
Crs, ml/cmH2O 36 ± 11 37 ± 10 0.594
∆ Paw, cmH2O 13 ± 4 12 ± 4 0.446
CRF, ml 965 ± 397 1140 ± 490 0.021
EELV, ml 1566 ± 476 1832 ± 719 0.009
Vt necesario para generar P. Plateau igual a la PEEP basal, ml (n=16) 333 ± 105 360 ± 127 0.073
Vrec, ml (n=16) 269 ± 186 324 ± 188 0.501
Strain dinámico con ZEEP 0.52 ± 0.23 0.44 ± 0.18 0.040
Strain dinámico con PEEP, (n=16) 0.38 ± 0.14 0.33 ± 0.13 0.020
Strain estático con PEEP, (n=16) 0.51 ± 0.16 0.48 ± 0.13 0.438
Strain global con PEEP, (n=16) 0.89 ± 0.24 0.81 ± 0.18 0.121
Los datos están presentados en media ± desvio estandar.
Crs, Compliancia estática del sistema respiratorio, EELV, volumen pulmonar al final de la espiración; CRF, capacidad
residual funcional; PaO2, Presión parcial de oxigeno en sangre arterial; PaCO2: Presión parcial de dióxido de carbono
en sangre arterial; PEEP, presión positiva al final de la espiración; Ppico, presión pico; Pplat, Presion plateau; Vrec,
volumen pulmonar reclutado inducido por la PEEP; Vt, volumen corriente; ∆ Paw, presión de distensión estática del
sistema respiratorio. Strain dinámico con ZEEP = Vt / CRF; Strain dinámico con PEEP = Vt / (CRF + Vrec); Strain
estático con PEEP = (EELV - CRF) / (CRF + Vrec); Strain global con PEEP = (EELV - CRF + Vt) / (CRF + Vrec).

49
9. DISCUSIÓN
La hipótesis del estudio sobre el alargamiento de la pausa inspiratoria
planteaba que esta prolongación podría permitir disminuir el volumen corriente
administrado y de esta manera proporcionar una herramienta mas para ayudar
en la ventilación protectiva. Efectivamente el principal hallazgo de este estudio
fue que el alargamiento de la pausa inspiratoria permite disminuir
significativamente el Vt administrado manteniendo los mismos niveles de
PaCO2 (ver Figura 2). Como consecuencia de esto, la presión plateau (Pplat) y
la presión de distensión estática del sistema respiratorio (∆ Paw) disminuyeron
significativamente mejorando la mecánica respiratoria.
Figura 2. Valores individuales de PaCO2 en cada fase del estudio. El asterisco
marca la reducción significativa de los valores de PaCO2 durante el
alargamiento de la pausa inspiratoria.
35
40
45
50
55
60
65
70
75
80
Fase 1 (Basal)
Fase 2 (Alargamiento de
pausa inspiratoria)
Fase 3 (Reducción de Vt)
*
PaC
O2 (
mm
Hg)

50
Como se ha descrito previamente, una de las principales consecuencias de
utilizar Vt bajos en la ventilación protectiva es la hipercapnia. Algunas
maniobras han sido descritas para disminuir la hipercapnia, una de ellas es el
uso de humidificadores activos que disminuyen el espacio muerto sin aumentar
las resistencias de las vías aéreas (13, 48). Otra opción para disminuir la
hipercapnia puede ser aumentar la frecuencia respiratoria. Sin embargo, el uso
de frecuencias respiratorias elevadas puede producir un aumento de la presión
positiva intrínseca al final de la espiración (PEEPi) (14, 49) y puede producir
daño pulmonar inducido por la ventilación (50, 51). Mas aún, un estudio de
Vieillard-Baron et al. (52) demostró que el aumento de la frecuencia respiratoria
no reduce la PaCO2, produce una hiperinflación dinámica y reduce el gasto
cardíaco.
Diversos estudios han demostrado que el alargamiento de la pausa inspiratoria
aumenta significativamente la eliminación de la PaCO2 disminuyendo la
hipercapnia y el espacio muerto fisiológico (15-20). Esto se explica porque la
difusión del CO2 a través de la membrana alveolo-capilar es tiempo
dependiente y el alargamiento de la pausa inspiratoria aumenta el tiempo
disponible para el intercambio (53-55). Se debe considerar que el alargamiento
de la pausa inspiratoria puede producir hiperinflación y alteraciones en el gasto
cardiaco al producir un aumento de la presión media de las vías aéreas, de la
PEEPi y una inversión en la relación inspiración-espiración (52, 56). Sin
embargo, en el estudio de Devaquet et al. (18) y en el presente estudio, se
consiguió un aumento significativo del alargamiento de la pausa inspiratoria
acompañado de una disminución significativa de la PaCO2 sin producir estos

51
efectos adversos. De esta manera, si al alargar la pausa inspiratoria se realiza
una monitorización de la PEEPi y de la relación inspiración-espiración, el
alargamiento de la pausa inspiratoria es una herramienta útil para disminuir
significativamente la PaCO2. Estos resultados constituyen el aporte clínico del
presente estudio ya que el alargamiento de la pausa inspiratoria permite
disminuir significativamente el Vt administrado, ayudando en la ventilación
protectiva. Además esta estrategia mejora la mecánica respiratoria con una
disminución significativa del espacio muerto fisiológico (Vdfis), Pplat y de la ∆
Paw. Con el presente trabajo se propone una estrategia de ventilación que
puede ser utilizada por los médicos responsables de los pacientes con SDRA
en etapas tempranas.
La hipótesis del estudio sobre los volúmenes pulmonares planteaba que la
posición prono podría aumentar los volúmenes pulmonares y disminuir el strain
en el tejido pulmonar. Efectivamente, el principal hallazgo de este estudio fue
que la posición prono en comparación con la posición supino, aumenta los
volúmenes pulmonares disminuyendo el strain dinámico en el tejido pulmonar y
que el volumen pulmonar reclutado inducido por la PEEP no se modifica con el
cambio de posición.
En la actualidad la información sobre la variación de los volúmenes pulmonares
debido al cambio de posición de supino a prono en pacientes con SDRA es
contradictoria. Dos estudios demostraron que la PP aumenta el EELV (36, 37).
Sin embargo el estudio realizado por Pelosi et al. (38) no encontró un aumento
significativo del EELV en la PP. El estudio realizado por Mentzelopoulos et al.
(40) encontró un aumento significativo del EELV y de la CRF y en otro estudio

52
realizado por este mismo grupo de investigadores (39) se encontró que la PP
en pacientes con SDRA aumenta el EELV y disminuye el strain. La razón por la
cual existen datos contradictorios de la variación de los volúmenes pulmonares
con el cambio de posición de supino a prono en los estudios previos puede ser
explicada por diferencias entre los pacientes con respecto a su mecánica
respiratoria, extensión y distribución de lesión pulmonar y presencia de mayor o
menor presión abdominal (25, 57).
En este estudio se confirma que los volúmenes pulmonares aumentan en la
posición prono, con un aumento del 18% de CRF y un 17% en el EELV. El
aumento de los volúmenes pulmonares en posición prono se debe a que con el
cambio de posición aumenta el porcentaje de volumen pulmonar bien aireado a
expensas de una disminución del porcentaje de volumen pulmonar poco
aireado. Esta modificación de los porcentajes de tejidos pulmonares se debe
considerar como una mejor distribución del gas administrado más no un
aumento del reclutamiento del tejido pulmonar (28, 58) (ver Figura 3). Esta
llamada “redistribución del aire administrado” puede explicar también porque el
Vrec no varia con el cambio de posición de supino a prono.
Un estudio previo realizado en animales con daño pulmonar (26) y otro estudio
realizado en pacientes con SDRA (27) evidenciaron mediante tomografía
computarizada que el porcentaje de Vrec fue similar en posición supino y
prono. Con diferente metodología, los datos de nuestro estudio corroboran
estos resultados (ver Figura 3), lo cual sugiere que en la posición prono el
aumento de los aumento de los volúmenes pulmonares se debe probablemente
a la redistribución del gas intrapulmonar (aumento de porcentaje de tejido bien
aireado a expensas de una disminución del tejido poco aireado) y no a un

53
aumento del reclutamiento (entendido como disminuición del tejido no aireado)
inducido por la PEEP.
Figura 3. Variación de los volúmenes pulmonares con el cambio de posición.

54
Niveles altos de strain estático (deformación del tejido pulmonar causado por la
PEEP) y de strain dinámico (deformación del tejido pulmonar causado por el Vt)
se han asociado con daño pulmonar inducido por la ventilación (45, 59). En un
modelo animal, Protti et al. encontraron que el strain más perjudicial es el strain
dinámico (46). Los hallazgos de nuestro estudio demuestran una disminución
significativa del strain mas perjudicial (strain dinámico) en la posición prono.
Estos datos podrían constituir otro mecanismo de protección de la PP contra el
daño pulmonar inducido por la ventilación y explicar el beneficio encontrado en
la supervivencia de los pacientes con SDRA grave.
Se realizó una división de los pacientes en SDRA temprano y tardío: en los
pacientes con SDRA temprano los volúmenes pulmonares aumentan y el strain
dinámico disminuye pero en los pacientes con SDRA tardío estos hallazgos no
fueron observados. Esto puede ser explicado por la presencia de mayor
afectación intersticial en la fase tardía del SDRA (60). Estos hallazgos pueden
explicar el beneficio del uso temprano de la PP en la supervivencia de los
pacientes con SDRA.

55
10. CONCLUSIONES
1. El estudio de los efectos fisiológicos de las dos estrategias estudiadas
en pacientes con insuficiencia respiratoria grave (alargamiento de la
pausa inspiratoria y posición prono) proporcionan nueva información
para ayudar en la ventilación mecánica de estos pacientes.
2. El alargamiento de la pausa inspiratoria constituye una herramienta
relativamente inocua y fácil para disminuir el volumen corriente
administrado y el espacio muerto y ayudar en la ventilación protectiva.
3. La posición prono aumenta los volúmenes pulmonares y disminuye el
strain dinámico en el tejido pulmonar lo cual ayuda a comprender el
efecto beneficioso del prono en la supervivencia.
4. En la posición prono existe una mejor distribución del gas administrado
lo que explica un aumento de los volúmenes pulmonares y que el
volumen pulmonar reclutado por la PEEP no varíe.

56
11. IMPLICACIONES FUTURAS
La relativa sencillez e inocuidad de las maniobras estudiadas en la presente
tesis facilita su aplicación en el manejo clínico diario de los pacientes con
insuficiencia respiratoria aguda severa.
El estudio del alargamiento de la pausa inspiratoria demuestra que la
prolongación de la pausa inspiratoria permite disminuir significativamente el
volumen corriente administrado. Sus implicaciones futuras son importantes
porque proporciona una nueva herramienta a pie de cama para ayudar en la
ventilación mecánica protectiva. De la misma manera, los hallazgos del estudio
servirán de base para futuros estudios clínicos que valoren el uso de esta
maniobra en otras patologías.
El aumento de los volúmenes pulmonares y la disminución del strain dinámico
en la posición prono, proporciona una explicación para uno de los posibles
mecanismos por los cuales la posición prono mejora los desenlaces clínicos y
justifica continuar con su uso en pacientes con SDRA severo. En este estudio,
también se evidenció que el volumen pulmonar reclutado inducido por la PEEP
no se modifica con el cambio de posición de supino a prono. Esto genera varias
hipótesis sobre el sinergismo de la posición prono y la PEEP. Los datos
encontrados sirven de base para futuros estudios clínicos individualizados en
un primer momento y aleatorizados después que valoren el ajuste de la PEEP
en la posición prono y su influencia en los desenlaces clínicos.

57
12. BIBLIOGRAFIA
1. Esteban A, Anzueto A, Frutos F, Alia I, Brochard L, Stewart TE, et al.
Characteristics and outcomes in adult patients receiving mechanical ventilation:
a 28-day international study. JAMA. 2002;287:345-55.
2. Esteban A, Ferguson ND, Meade MO, Frutos-Vivar F, Apezteguia C,
Brochard L, et al. Evolution of mechanical ventilation in response to clinical
research. Am J Respir Crit Care Med. 2008;177:170-7.
3. Esteban A, Frutos-Vivar F, Muriel A, Ferguson ND, Penuelas O, Abraira
V, et al. Evolution of mortality over time in patients receiving mechanical
ventilation. Am J Respir Crit Care Med. 2013;188:220-30.
4. Ware LB, Matthay MA. The acute respiratory distress syndrome. N Engl
J Med. 2000;342:1334-49.
5. Gattinoni L, Pesenti A. The concept of "baby lung". Intensive Care Med.
2005;31:776-84.
6. Ashbaugh DG, Bigelow DB, Petty TL, Levine BE. Acute respiratory
distress in adults. Lancet. 1967;2:319-23.
7. Ranieri VM, Rubenfeld GD, Thompson BT, Ferguson ND, Caldwell E,
Fan E, et al. Acute respiratory distress syndrome: the Berlin Definition. JAMA.
2012;307:2526-33.
8. Bellani G, Laffey JG, Pham T, Fan E, Brochard L, Esteban A, et al.
Epidemiology, Patterns of Care, and Mortality for Patients With Acute
Respiratory Distress Syndrome in Intensive Care Units in 50 Countries. JAMA.
2016;315:788-800.

58
9. Eichacker PQ, Gerstenberger EP, Banks SM, Cui X, Natanson C. Meta-
analysis of acute lung injury and acute respiratory distress syndrome trials
testing low tidal volumes. AM J RESPIR CRIT CARE MED. 2002;166:1510-4.
10. Briel M, Meade M, Mercat A, Brower RG, Talmor D, Walter SD, et al.
Higher vs lower positive end-expiratory pressure in patients with acute lung
injury and acute respiratory distress syndrome: systematic review and meta-
analysis. JAMA. 2010;303:865-73.
11. Carvalho CR, Barbas CS, Medeiros DM, Magaldi RB, Lorenzi Filho G,
Kairalla RA, et al. Temporal hemodynamic effects of permissive hypercapnia
associated with ideal PEEP in ARDS. Am J Respir Crit Care Med.
1997;156:1458-66.
12. Vieillard-Baron A, Schmitt JM, Augarde R, Fellahi JL, Prin S, Page B, et
al. Acute cor pulmonale in acute respiratory distress syndrome submitted to
protective ventilation: incidence, clinical implications, and prognosis. Crit Care
Med. 2001;29:1551-5.
13. Moran I, Bellapart J, Vari A, Mancebo J. Heat and moisture exchangers
and heated humidifiers in acute lung injury/acute respiratory distress syndrome
patients. Effects on respiratory mechanics and gas exchange. Intensive Care
Med. 2006;32:524-31.
14. Richard JC, Brochard L, Breton L, Aboab J, Vandelet P, Tamion F, et al.
Influence of respiratory rate on gas trapping during low volume ventilation of
patients with acute lung injury. Intensive Care Med. 2002;28:1078-83.
15. Mercat A, Diehl JL, Michard F, Anguel N, Teboul JL, Labrousse J, et al.
Extending inspiratory time in acute respiratory distress syndrome. Crit Care
Med. 2001;29:40-4.

59
16. Uttman L, Jonson B. A prolonged postinspiratory pause enhances CO2
elimination by reducing airway dead space. Clin Physiol Funct Imaging.
2003;23:252-6.
17. Aboab J, Niklason L, Uttman L, Kouatchet A, Brochard L, Jonson B. CO2
elimination at varying inspiratory pause in acute lung injury. Clin Physiol Funct
Imaging. 2007;27:2-6.
18. Devaquet J, Jonson B, Niklason L, Si Larbi AG, Uttman L, Aboab J, et al.
Effects of inspiratory pause on CO2 elimination and arterial PCO2 in acute lung
injury. J Appl Physiol. 2008;105:1944-9.
19. Astrom E, Uttman L, Niklason L, Aboab J, Brochard L, Jonson B. Pattern
of inspiratory gas delivery affects CO2 elimination in health and after acute lung
injury. Intensive Care Med. 2008;34:377-84.
20. Aboab J, Niklason L, Uttman L, Brochard L, Jonson B. Dead space and
CO(2) elimination related to pattern of inspiratory gas delivery in ARDS patients.
Crit Care. 2012;16:R39.
21. Guerin C, Reignier J, Richard JC, Beuret P, Gacouin A, Boulain T, et al.
Prone positioning in severe acute respiratory distress syndrome. N Engl J Med.
2013;368:2159-68.
22. Albert RK, Keniston A, Baboi L, Ayzac L, Guerin C. Prone position-
induced improvement in gas exchange does not predict improved survival in the
acute respiratory distress syndrome. Am J Respir Crit Care Med. 2014;189:494-
6.
23. Broccard A, Shapiro RS, Schmitz LL, Adams AB, Nahum A, Marini JJ.
Prone positioning attenuates and redistributes ventilator-induced lung injury in
dogs. Crit Care Med. 2000;28:295-303.

60
24. Valenza F, Guglielmi M, Maffioletti M, Tedesco C, Maccagni P, Fossali T,
et al. Prone position delays the progression of ventilator-induced lung injury in
rats: does lung strain distribution play a role? Crit Care Med. 2005;33:361-7.
25. Gattinoni L, Taccone P, Carlesso E, Marini JJ. Prone position in acute
respiratory distress syndrome. Rationale, indications, and limits. Am J Respir
Crit Care Med. 2013;188:1286-93.
26. Richard JC, Bregeon F, Costes N, Bars DL, Tourvieille C, Lavenne F, et
al. Effects of prone position and positive end-expiratory pressure on lung
perfusion and ventilation. Crit Care Med. 2008;36:2373-80.
27. Cornejo RA, Diaz JC, Tobar EA, Bruhn AR, Ramos CA, Gonzalez RA, et
al. Effects of prone positioning on lung protection in patients with acute
respiratory distress syndrome. Am J Respir Crit Care Med. 2013;188:440-8.
28. Santini A, Protti A, Langer T, Comini B, Monti M, Sparacino CC, et al.
Prone position ameliorates lung elastance and increases functional residual
capacity independently from lung recruitment. Intensive Care Med Exp.
2015;3:55.
29. Richard JC, Maggiore SM, Jonson B, Mancebo J, Lemaire F, Brochard L.
Influence of tidal volume on alveolar recruitment. Respective role of PEEP and
a recruitment maneuver. Am J Respir Crit Care Med. 2001;163:1609-13.
30. Gattinoni L, Caironi P, Cressoni M, Chiumello D, Ranieri VM, Quintel M,
et al. Lung recruitment in patients with the acute respiratory distress syndrome.
N Engl J Med. 2006;354:1775-86.
31. Richard JC, Brochard L, Vandelet P, Breton L, Maggiore SM, Jonson B,
et al. Respective effects of end-expiratory and end-inspiratory pressures on
alveolar recruitment in acute lung injury. Crit Care Med. 2003;31:89-92.

61
32. Dellamonica J, Lerolle N, Sargentini C, Beduneau G, Di Marco F, Mercat
A, et al. PEEP-induced changes in lung volume in acute respiratory distress
syndrome. Two methods to estimate alveolar recruitment. Intensive Care Med.
2011;37:1595-604.
33. Guerin C, Beuret P, Constantin JM, Bellani G, Garcia-Olivares P, Roca
O, et al. A prospective international observational prevalence study on prone
positioning of ARDS patients: the APRONET (ARDS Prone Position Network)
study. Intensive Care Med. 2018;44:22-37.
34. Marini JJ, Gattinoni L. Ventilatory management of acute respiratory
distress syndrome: a consensus of two. Crit Care Med. 2004;32:250-5.
35. Gordo-Vidal F, Enciso-Calderon V. [Acute respiratory distress syndrome,
mechanical ventilation and right ventricular function]. Med Intensiva.
2012;36:138-42.
36. Pelosi P, Bottino N, Chiumello D, Caironi P, Panigada M, Gamberoni C,
et al. Sigh in supine and prone position during acute respiratory distress
syndrome. Am J Respir Crit Care Med. 2003;167:521-7.
37. Reutershan J, Schmitt A, Dietz K, Unertl K, Fretschner R. Alveolar
recruitment during prone position: time matters. Clin Sci (Lond). 2006;110:655-
63.
38. Pelosi P, Tubiolo D, Mascheroni D, Vicardi P, Crotti S, Valenza F, et al.
Effects of the prone position on respiratory mechanics and gas exchange during
acute lung injury. Am J Respir Crit Care Med. 1998;157:387-93.
39. Mentzelopoulos SD, Roussos C, Zakynthinos SG. Prone position
reduces lung stress and strain in severe acute respiratory distress syndrome.
Eur Respir J. 2005;25:534-44.

62
40. Mentzelopoulos SD, Roussos C, Zakynthinos SG. Static pressure
volume curves and body posture in acute respiratory failure. Intensive Care
Med. 2005;31:1683-92.
41. Fletcher R, Jonson B, Cumming G, Brew J. The concept of deadspace
with special reference to the single breath test for carbon dioxide. Br J Anaesth.
1981;53:77-88.
42. Ranieri VM, Giuliani R, Fiore T, Dambrosio M, Milic-Emili J. Volume-
pressure curve of the respiratory system predicts effects of PEEP in ARDS:
"occlusion" versus "constant flow" technique. Am J Respir Crit Care Med.
1994;149:19-27.
43. Jonson B, Richard JC, Straus C, Mancebo J, Lemaire F, Brochard L.
Pressure-volume curves and compliance in acute lung injury: evidence of
recruitment above the lower inflection point. Am J Respir Crit Care Med.
1999;159:1172-8.
44. Maggiore SM, Jonson B, Richard JC, Jaber S, Lemaire F, Brochard L.
Alveolar derecruitment at decremental positive end-expiratory pressure levels in
acute lung injury: comparison with the lower inflection point, oxygenation, and
compliance. Am J Respir Crit Care Med. 2001;164:795-801.
45. Protti A, Cressoni M, Santini A, Langer T, Mietto C, Febres D, et al. Lung
stress and strain during mechanical ventilation: any safe threshold? Am J
Respir Crit Care Med. 2011;183:1354-62.
46. Protti A, Andreis DT, Monti M, Santini A, Sparacino CC, Langer T, et al.
Lung stress and strain during mechanical ventilation: any difference between
statics and dynamics? Crit Care Med. 2013;41:1046-55.

63
47. Olegard C, Sondergaard S, Houltz E, Lundin S, Stenqvist O. Estimation
of functional residual capacity at the bedside using standard monitoring
equipment: a modified nitrogen washout/washin technique requiring a small
change of the inspired oxygen fraction. Anesth Analg. 2005;101:206-12.
48. Moran I, Cabello B, Manero E, Mancebo J. Comparison of the effects of
two humidifier systems on endotracheal tube resistance. Intensive Care Med.
2011;37:1773-9.
49. de Durante G, del Turco M, Rustichini L, Cosimini P, Giunta F, Hudson
LD, et al. ARDSNet lower tidal volume ventilatory strategy may generate
intrinsic positive end-expiratory pressure in patients with acute respiratory
distress syndrome. Am J Respir Crit Care Med. 2002;165:1271-4.
50. Hotchkiss JR, Jr., Blanch L, Murias G, Adams AB, Olson DA,
Wangensteen OD, et al. Effects of decreased respiratory frequency on
ventilator-induced lung injury. Am J Respir Crit Care Med. 2000;161:463-8.
51. Conrad SA, Zhang S, Arnold TC, Scott LK, Carden DL. Protective effects
of low respiratory frequency in experimental ventilator-associated lung injury.
Crit Care Med. 2005;33:835-40.
52. Vieillard-Baron A, Prin S, Augarde R, Desfonds P, Page B, Beauchet A,
et al. Increasing respiratory rate to improve CO2 clearance during mechanical
ventilation is not a panacea in acute respiratory failure. Crit Care Med.
2002;30:1407-12.
53. Knelson JH, Howatt WF, DeMuth GR. Effect of respiratory pattern on
alveolar gas exchange. J Appl Physiol. 1970;29:328-31.
54. Shanholtz C, Brower R. Should inverse ratio ventilation be used in adult
respiratory distress syndrome? Am J Respir Crit Care Med. 1994;149:1354-8.

64
55. Aboab J, Niklason L, Uttman L, Brochard L, Jonson B. Dead space and
CO2 elimination related to pattern of inspiratory gas delivery in ARDS patients.
Crit Care. 2012;16:R39.
56. Armstrong BW, Jr., MacIntyre NR. Pressure-controlled, inverse ratio
ventilation that avoids air trapping in the adult respiratory distress syndrome.
Crit Care Med. 1995;23:279-85.
57. Nieszkowska A, Lu Q, Vieira S, Elman M, Fetita C, Rouby JJ. Incidence
and regional distribution of lung overinflation during mechanical ventilation with
positive end-expiratory pressure. Crit Care Med. 2004;32:1496-503.
58. Chiumello D, Marino A, Brioni M, Cigada I, Menga F, Colombo A, et al.
Lung Recruitment Assessed by Respiratory Mechanics and Computed
Tomography in Patients with Acute Respiratory Distress Syndrome. What Is the
Relationship? Am J Respir Crit Care Med. 2016;193:1254-63.
59. Dreyfuss D, Saumon G. Ventilator-induced lung injury: lessons from
experimental studies. Am J Respir Crit Care Med. 1998;157:294-323.
60. Nakos G, Tsangaris I, Kostanti E, Nathanail C, Lachana A, Koulouras V,
et al. Effect of the prone position on patients with hydrostatic pulmonary edema
compared with patients with acute respiratory distress syndrome and pulmonary
fibrosis. Am J Respir Crit Care Med. 2000;161:360-8.