Embed Size (px)
Citation preview

Adverse Reactions Associated with Methylene Blue
Inactivated Fresh Frozen Plasma (MB‐FFP)
Constantina
Politis
Hellenic Coordinating Haemovigilance
Centre (SKAE)

Background
Pathogen
inactivation
is
expected
to
reduce
the
risk
of
transfusion‐associated
infections
and
immunomodulation
disturbances
Pathogen
reduction
technologies
applied
for
the
safety
of
therapeutic FFP ‐
•S/D procedure used in plasma pools
•Methylene
Blue and light used in single FFP units
•Intercept Blood System used in single FFP units
•Mirasol
PRT System used in single FFP units
•Octaplas/ OctaplasLG

Background
Directive
2002/98/EC
instructs
EU
Member
States
to
make
use of scientific progress in the
– Detection– Inactivation– Elimination
The Council of Europe recommends active haemovigilance
and
post‐marketing
assessment
of
pathogen
reduced
products
of transfusion‐transmissible
pathogenic agents

Aim of the study
The
safety
and
quality
of
MB‐FFP
for
transfusion
of
patients
with
coagulopathy
with
or
without
bleeding
and
other
clinical
indications
for
plasma
transfusion,
over
a
period
of
10 years in comparison with the use of quarantine FFP
Disease categories•TTP•3rd
degree burns, wounds‐trauma •Massive transfusion•Septicaemia•Cardiovascular disorders•Other

Methods
• Use of
the
Theraflex
MB‐Plasma
system
including
the
Plasmaflex
for
leucodepletion
and
Blueflex
for
MB
and
photoproduct removal
• Use of Quarantine FFP (40% leucoreduced prior to storage)
• Data from 8 Blood Establishments supplying FFP to 13
large hospitals including 4 university clinics
Type of FFP
Units
Patients
Theraflex
MB‐FFP
132,325
26,320
Quarantine FFP
314,895
57,718
Total FFP
447,220
84,038

QualityCoagulation changes
Fibrinogen and
Factors V and VIIIStago
Diagnostica
assays
Cytokine concentration
IL‐6, IL‐8
MCSF free and totalBiosource
and Diacel
Elisa testing
Examined in 0.5% of MB‐FFP
units in the initial years of the
study
(C.Politis
et al, Vox
Sang.
2007;92)
SafetySeroconversion
In patients negative for HIV,
HCV, HBV 6 months after
transfusion with MB‐FFP
(period before NAT)
Adverse reactions
Non‐infectious
Infectious
Viral, bacterial, other
Parameters examined
AllergicNHFTRTRALITADOther

Results

Coagulation Factor Activity and Cytokines Concentrations in FFP following MB inactivation
(n=88 units)
Parameter Before MB mean (SD) After MB mean (SD) Loss (%)
Fibrinogen (mg/dl) 253.5 (47.5) 206.6 (37.4) 18
Factor VII (%) 81.9 (17.1) 63.1 (13.3) 18
Factor V (%) 116.3 (18.3) 95.5 (19.1) 22
IL‐6 (pg/ml) 2.18 (1.93) 0.73 (0.91) 63.1
IL‐8 (pg/ml) 6.77 (3.87) 4.34 (2.72) 68.5
GMCSF free (pg/ml) 2.14 (1.46) 1.42 (1.11) 65.3
GMCSF total (pg/ml) 0.73 (0.78) 0.4 (0.63) 58.3
C.Politis et al, Vox Sang. (2007);92;319‐326

Coagulation Factor Losses
30%
Cytokine Concentrations
58% - 68%Within internationally
accepted range

Clinical use of FFP
MB‐FFP
5.0 units / patient
Quarantine‐FFP
5.5 units / patient
Use of both types of FFP varies considerably among the 13
hospitals
reporting
to
the
8
blood
establishments
of
the
study

Greece Total Adverse Reactions, 2001‐2011
Adverse Reaction MB‐FFP Quarantine FFP
n Incidence n IncidenceAllergic/Anaphylactic 3* 1:44,108 29 1:10,858NHFTR 0 0:132,325 18 1:17,494TRALI 0 0:132,325 3 1:104,695TACO 0 0:132,325 1 1:314,895TAD 0 0:132,325 2 1:157,447Bacterial 0 0:132,325 6 1:52,482Other 0 0:132,325 1 1:314,895Total 3 1:44,108 60 1:5,248
Difference between MB‐FFP and quarantine FFP p<0.0001*Mild allergic reactions in three patients with TTP, trauma and septicaemia respectively

Greece Total Adverse Reactions by severity, 2001‐2011
Adverse ReactionMB‐FFP Quarantine FFP
(314,895 units)(132,325 units)Grade 1 Grades 2‐3 Grade 1 Grades 2‐3
Allergic/Anaphylactic 3* 0 21 8
NHFTR 0 0 15 3TRALI 0 0 2 1TACO 0 0 1 0TAD 0 0 1 1Bacterial 0 0 3 3Other 0 0 1 0Total 3 0 44 16Incidence 1:44,108 0:132,325 1:7,157 1:19,681
*all mild (grade 1)

Distribution of Adverse Reactions by Severity
Grade 1 Grade 2-3
Q‐FFP
MB‐FFP
n=44(1:7,157)
n=16(1:19,681)
n=0

Type of FFP
AARs Severity grades Imputability levels
n Incidence 1 2‐3 1 2 3
MB‐FFP 3* 1:44,108 3 0 0 1 2
Quarantine
FFP 29 1:10,853 21 8 9 12 8
Total 32 1:13,975 24 8 9 13 10
Greece Allergic adverse reactions (AARs), 2001‐2011
Difference p<0.0001*1 in 2005 and 2 in 2009

Safety Parameters
No
seroconversion
or
viral
ARs
associated
with
either
type
of
FFP arose within this study
Report of HIV transmissionA
hospital,
not
using
MB‐FFP
and
NAT
for
blood screening
for
HIV/HCV/HBV,
reported
to
SKAE
the
transmission
of
HIV
with
the
transfusion
of
one
unit
of
whole
blood
derived
quarantine
FFP in 2005Investigation
of
the
implicated
donor
showed
that
donation
took place during the serological window period

Conclusions
• The incidence
of
ARs
is
statistically
significantly
higher
in
quarantine FFP than in MB‐FFP
• Only three
mild
allergic
ARs
associated
with
transfusion
of
MB‐FFP (imputability level 2‐3) were observed
• High frequencies of allergic and anaphylactic as well as NHFTR and
bacterial
ARs
were
observed
in
association
with
quarantine
FFP.
TRALI
(3
cases),
TACO
(1
case)
and
TAD
(1
case) associated with quarantine FFP were also reported
This study demonstrates the safety and quality of MB‐FFP

Next steps
Future work
focusing
on
clinical
endpoints
and
cost‐effectiveness modeling
of
risk
assessment
for
emerging infections should be done in compliance with
the
recommendations
of
the
Council
of
Europe

Sources of European haemovigilance data
• Greece• France, the Agence Française de Sécurité
Sanitaire des
Produits de Santé
(Afssaps)
• Austria, the Central Institute for Blood Transfusion, University Clinic Innsbruck
• United Kingdom, (SHOT) 2007‐2010 Annual Reports
• Spain, the Centro de Transfusión de Galicia (CTG) and the Centro de Transfusión de la Comunidad Valenciana
• Belgium, the Agence Fédérale des Médicaments et des
Produits de Santé
(AFMPS)

European haemovigilance dataCountry
Number of
units
transfused
YEARTOTAL
2007 2008 2009 2010Greece n 12,616 33,522 33,610 29,413 109,161
% of total 1.1% 2.8% 2.8% 2.5% 9.75%France n 0 58,725 204,812 246,452 509,989
% of total 0.0% 4.9% 17.2% 20.7% 45.58%Austria n 0 0 2,962 4,592 7,554
% of total 0.0% 0.0% 0.2% 0.4% 0.67%UK n 9,228 19,860 18,408 14,268 61,764
% of total 0.8% 1.7% 1.5% 1.2% 5.52%Spain n 37,500 39,062 41,075 36,721 154,358
% of total 3.2% 3.3% 3.5% 3.1% 13.8%Belgium n 83,419 88,953 84,625 90,099 347,096
% of total 7.0 7.5 7.1 7.6 31.2%TOTAL n 142,763 240,122 385,492 421,545 1,189,922
% of total 12.0 20.2 32.4 35.4 100.0

Global distribution of Severity Grade 2 ‐
4
AARs by country
Greece France Austria UK Spain BelgiumAARs 0 64 0 4 4 10/10,000 by country 0.0 1.25 0.0 0.65 0.26 0.29No AARs 109,161 509,925 7,554 61,760 154,354 347,086Total 109,161 509,989 7,554 61,764 154,358 347,096
Comparing the rates in the different countries (association
Fisher’s exact test with the Bonferroni’s correction of the α‐
error, the comparisons are considered significant at the limit
of 0.003), the rate of AAR is significantly higher in France
than in Greece, Spain and Belgium (p < 0.05). No other
differences between countries were found.

Greece France Austria UK Spain BelgiumAAR 0 15 0 1 4 0/10,000 by
country
0.0 0.29 0.0 0.19 0.34 0.0
No Grade 2 AAR 96,545 509,974 7,554 52,535 116,854 263,677Total 96,545 509,989 7,554 52,536 116,858 263,677
Comparing the rates in the different countries (association
Fisher’s exact test), the rates of Grade 2 AAR were not
significantly different between countries.
Global distribution of Grade 2 AAR by country
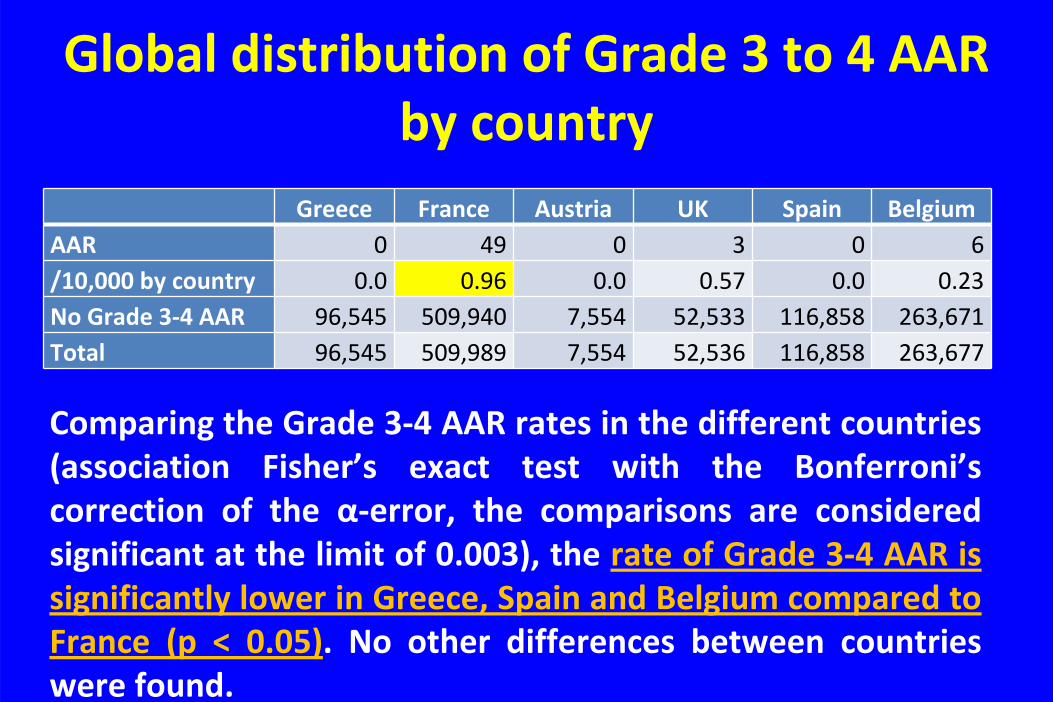
Greece France Austria UK Spain BelgiumAAR 0 49 0 3 0 6/10,000 by country 0.0 0.96 0.0 0.57 0.0 0.23No Grade 3‐4 AAR 96,545 509,940 7,554 52,533 116,858 263,671Total 96,545 509,989 7,554 52,536 116,858 263,677
Comparing the Grade 3‐4 AAR rates in the different countries
(association
Fisher’s
exact
test
with
the
Bonferroni’s
correction
of
the α‐error,
the
comparisons
are
considered
significant at the limit of 0.003), the rate of Grade 3‐4 AAR is
significantly lower in Greece, Spain and Belgium compared to
France
(p
<
0.05).
No
other
differences
between
countries
were found.
Global distribution of Grade 3 to 4 AAR by country

• The incidence of AARs is significantly higher with Quarantine plasma compared to MB‐FFP in Greece
• In contrast
to
France
based
on
their
respective
haemovigilance data in Belgium, Greece, UK,
Spain
and Austria
no
unusual
allergic
event
rates
have
been observed
leading
to
continuous
usage
of
MB
plasma
Overall conclusion

Thank you
Nikos Beloyiannis - Idealist Greek partisan, victim of the civil warHungarian Village named after “The man with the red carnation”