Embed Size (px)
Citation preview

Adverse Impact:What is it?
How do you calculate it?
Kyle E. Brink
Jeffrey L. Crenshaw
Personnel Board of Jefferson County
www.AdverseImpact.org
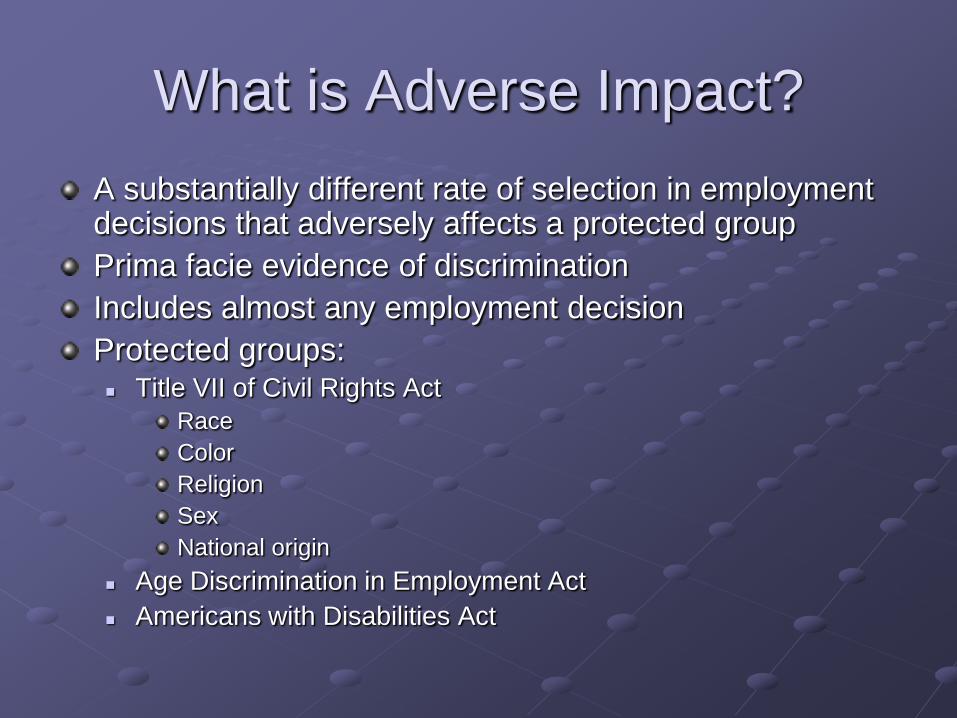
What is Adverse Impact?
A substantially different rate of selection in employment decisions that adversely affects a protected group
Prima facie evidence of discrimination
Includes almost any employment decision
Protected groups: Title VII of Civil Rights Act
Race
Color
Religion
Sex
National origin
Age Discrimination in Employment Act
Americans with Disabilities Act

Importance of Adverse Impact
Disparate treatment: obvious legal, ethical, and moral issues
Disparate impact: murky Bias vs. true differences
Perceived tradeoff between diversity & utility
Adverse impact could result in an investigation and/or litigation regardless of intent to discriminate
If adverse impact exists, assumed to be discriminatory unless there is validity evidence to support procedure

2007 Title VII Discrimination
Discrimination
Chargesa
Monetary Benefits for
Charging Partiesb
Race/Color 30,510 $ 67,700,000
Religion 2,880 $ 6,400,000
Sex 24,826 $ 135,400,000
National Origin 9,396 $ 22,800,000
Total 67,612 $ 232,300,000aIncludes all charges, not just those based on disparate impact.bDoes not include monetary benefits obtained through litigation.
Source: http://www.eeoc.gov/types/index.html

History of Adverse Impact
1964: U.S. Civil Rights Act, Title VII Outlawed employment discrimination
1966: EEOC Guidelines on Employment Testing Procedures 1st mention of the concept; no definition
1968: Employment Tests by Contractors & Subcontractors (U.S. Department of Labor) Report data separately for groups when feasible
1970: Guidelines on Employee Selection Procedures (EEOC) Revised version of 1966 guidelines
Differential validity; different rejection rates
1971: Employee Testing and Other Selection Procedures (U.S. Department of Labor) Language similar to 1970 EEOC guidelines
Source: Biddle (2005); Lawshe (1987)
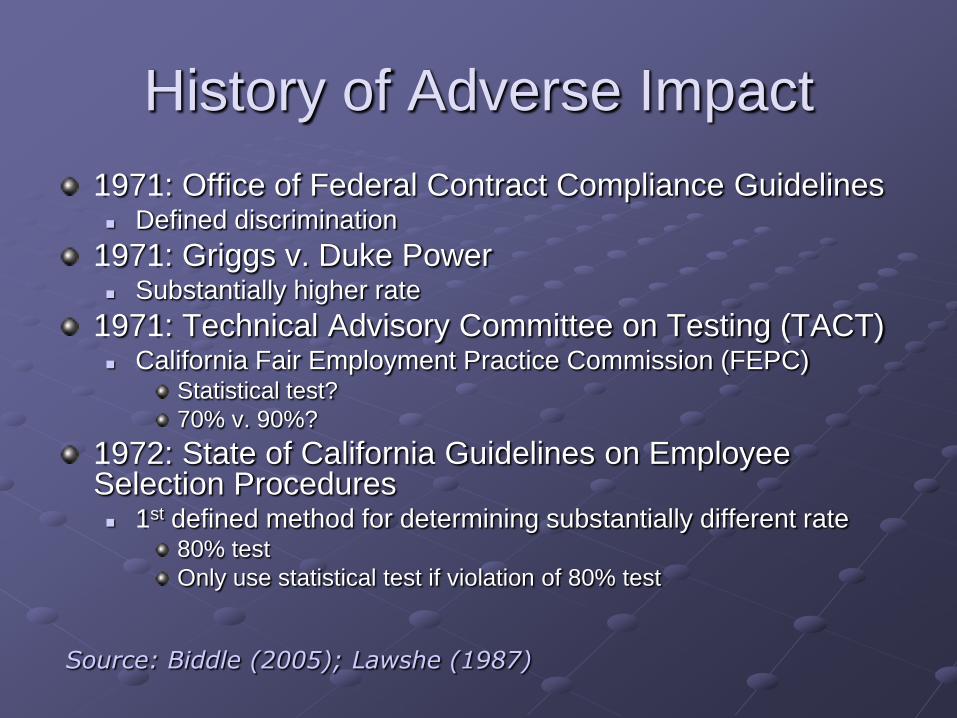
History of Adverse Impact
1971: Office of Federal Contract Compliance Guidelines Defined discrimination
1971: Griggs v. Duke Power Substantially higher rate
1971: Technical Advisory Committee on Testing (TACT) California Fair Employment Practice Commission (FEPC)
Statistical test?
70% v. 90%?
1972: State of California Guidelines on Employee Selection Procedures 1st defined method for determining substantially different rate
80% test
Only use statistical test if violation of 80% test
Source: Biddle (2005); Lawshe (1987)

History of Adverse Impact
1976: Federal Executive Agency Guidelines on Employee Selection Procedures (U.S. Dept. of Justice) Dropped the differential validity term
Added unfairness: group members obtain lower test score when difference is not reflected in job performance
Added adverse impact: a substantially different rate of selection
1978: Uniform Guidelines on Employee Selection Procedures (EEOC, CSC, DOL, DOJ) Maintained adverse impact definition and added 80% test
1979: Uniform Employee Selection Guidelines Interpretation and Clarification (Questions and Answers)
Civil Rights Act of 1991 Prohibits adjusting score or using different cutoff scores on the
basis of group membership
Source: Biddle (2005); Lawshe (1987)

California FEPC Definition
Adverse effect refers to a total employment process which results in a significantly higher percentage of a protected group in the candidate population being rejected for employment, placement, or promotion. The difference between the rejection rates for a protected group and the remaining group must be statistically significant at the .05 level. In addition, if the acceptance rate of the protected group is greater than or equal to 80% of the acceptance rate of the remaining group, then adverse effect is said to be not present by definition.
Statistical test 1st, then 80% rule Appears you must violate both to claim AI exists
Source: Biddle (2005)

1978 EEOC Uniform Guidelines
A selection rate for any race, sex, or ethnic group which is less than four-fifths (4/5) (or eighty percent) of the rate for the group with the highest rate will generally be regarded by the Federal enforcement agencies as evidence of adverse impact, while a greater than four-fifths rate will generally not be regarded by Federal enforcement agencies as evidence of adverse impact. Smaller differences in selection rate may nevertheless constitute adverse impact, where they are significant in both statistical and practical terms or where a user's actions have discouraged applicants disproportionately on grounds of race, sex, or ethnic group. Greater differences in selection rate may not constitute adverse impact where the differences are based on small numbers and are not statistically significant, or where special recruiting or other programs cause the pool of minority or female candidates to be atypical of the normal pool of applicants from that group…
Source: Uniform Guidelines Section 4 (D)

1978 EEOC Uniform Guidelines
…Where the user's evidence concerning the impact of a selection procedure indicates adverse impact but is based upon numbers which are too small to be reliable, evidence concerning the impact of the procedure over a longer period of time and/or evidence concerning the impact which the selection procedure had when used in the same manner in similar circumstances elsewhere may be considered in determining adverse impact. Where the user has not maintained data on adverse impact as required by the documentation section of applicable guidelines, the Federal enforcement agencies may draw an inference of adverse impact of the selection process from the failure of the user to maintain such data, if the user has an underutilization of a group in the job category, as compared to the group's representation in the relevant labor market or, in the case of jobs filled from within, the applicable work force.
80% rule 1st, then statistical test; no absolute criteria Appears you only have to violate one or the other to claim AI exists
Source: Uniform Guidelines Section 4 (D)

AI Analysis Considerations
Span covered Single event (e.g., one administration, year, job class, group,
location)*
Multiple events (more than one administration…)
Comparison group Hires vs. applicants*
Workforce vs. labor force
Test/analysis type Descriptive statistics
Practical significance*
Statistical significance*
Decision/outcome in question Pass/fail vs. hired/not hired
Total process vs. one component
*Focus of this presentation

4/5ths (80%) Rule
1) Calculate the selection rate for each group
Each group that makes up > 2% of applicant pool
2) Observe which group has the highest selection
rate
This is not always the white, male, or “majority” group
3) Calculate impact ratios by dividing the selection
rate of each group by that of the highest group
4) Determine if the selection rates are substantially
different (i.e., impact ratio < .80)
Source: Uniform Guidelines Q&A 12

4/5ths (80%) Rule
Applicants Hires Selection
Rate
White 80 48 48/80 =.6
(60%)
Black 40 12 12/40 = .3
(30%)
Impact Ratio .3/.6 = .5
(50%)
The impact ratio (.5) is less than .8 which is evidence that,
based on the 4/5ths rule, there is adverse impact.
Source: Uniform Guidelines Q&A 12

4/5ths (80%) Rule
Could be considered a test of practical
significance
Focuses on an effect size (impact ratio = ratio of
selection rates)
Excessive Type I & II errors
Subject to considerable sampling errors, especially
with small sample size and selection ratio
Incorrectly indicates AI exists (i.e., Type I error) 20%
or more of the time when 50 or fewer hires
Roth, Bobko, & Switzer (2006)
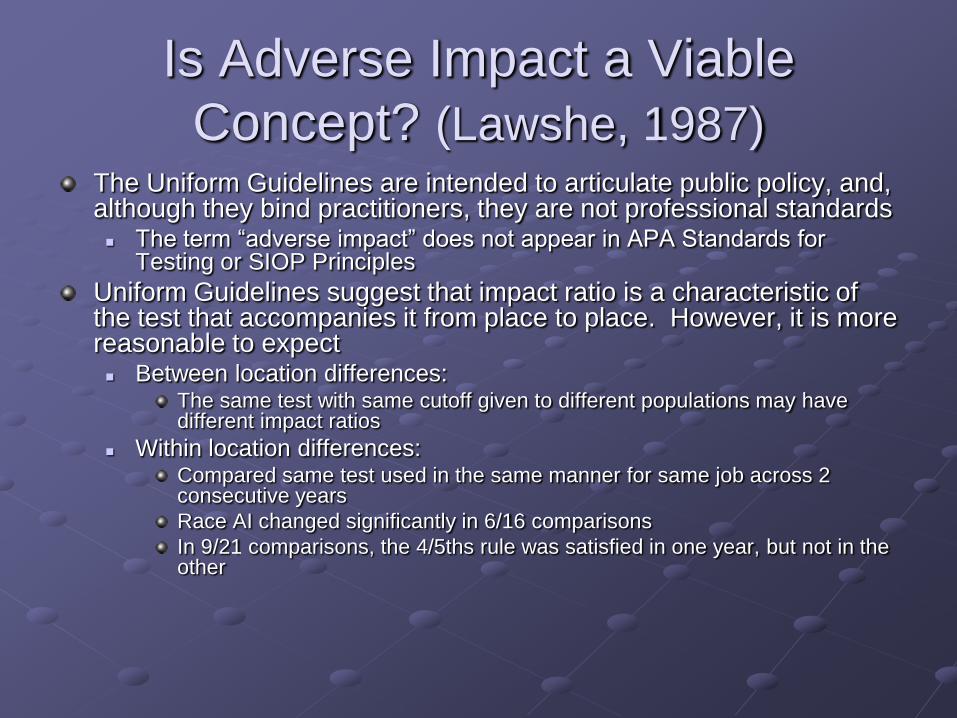
Is Adverse Impact a Viable
Concept? (Lawshe, 1987)The Uniform Guidelines are intended to articulate public policy, and, although they bind practitioners, they are not professional standards The term “adverse impact” does not appear in APA Standards for
Testing or SIOP Principles
Uniform Guidelines suggest that impact ratio is a characteristic of the test that accompanies it from place to place. However, it is more reasonable to expect Between location differences:
The same test with same cutoff given to different populations may have different impact ratios
Within location differences: Compared same test used in the same manner for same job across 2 consecutive years
Race AI changed significantly in 6/16 comparisons
In 9/21 comparisons, the 4/5ths rule was satisfied in one year, but not in the other

Statistical Significance:
Decisions & Errors
Truth (unknown)
No AI AI
Decision
No AI
Correct
acceptance
(1- α)
Type II error (β)
AIType I error
(α)
Correct
rejection
(Power; 1-β)
Null hypothesis: There is no difference (no AI); any difference is due to chance.

Statistical Significance
Impact ratio is much more powerful than significance test, but at the expense of Type I error
Tests of statistical significance can control Type I error α level = .05, probability (p) value < .05
Less than 5% (1/20) probability due to chance or sampling error
Tests of statistical significance cannot control Type II error Typically have low power in the context of selection decisions
due to small sample size
When power is low, it is unclear if non-significant results
Are due to chance or lack of power
Indicate adverse impact truly does not exist
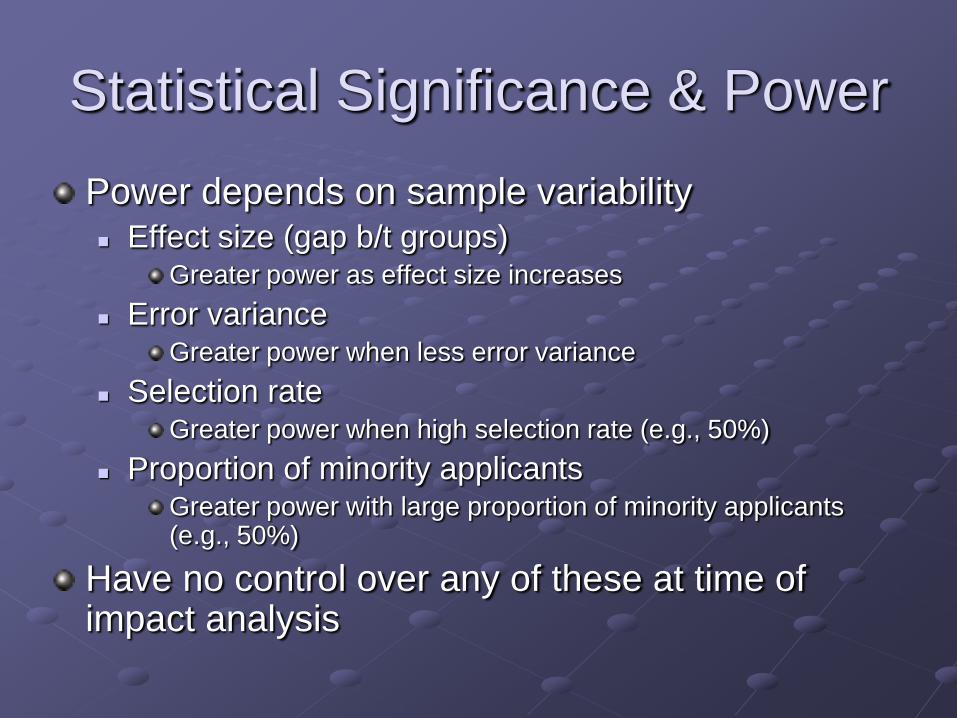
Statistical Significance & Power
Power depends on sample variability Effect size (gap b/t groups)
Greater power as effect size increases
Error varianceGreater power when less error variance
Selection rateGreater power when high selection rate (e.g., 50%)
Proportion of minority applicantsGreater power with large proportion of minority applicants (e.g., 50%)
Have no control over any of these at time of impact analysis

Statistical Significance & Power
Power depends on sample size (N)
Widen timeframe
Combine geographic areas
Combine events from several jobs, job groups or divisions
Combine selection procedures
Combine different ethnic groups
Have some control over these if circumstances are appropriate
Source: Biddle (2005); Uniform Guidelines Section 4 (D)

Combined Samples Warning!
17.6%17.6%2552554545HispanicHispanic
0.630.6328.0%28.0%500500140140WhiteWhiteCombinedCombined
17.6%17.6%2552554545HispanicHispanic
0.630.6328.0%28.0%500500140140WhiteWhiteCombinedCombined
13.3%13.3%2252253030HispanicHispanic
1.001.0013.3%13.3%3003004040WhiteWhiteFt. WorthFt. Worth
50.0%50.0%30301515HispanicHispanic
1.001.0050.0%50.0%200200100100WhiteWhiteDallasDallas
IRIRPass Pass
RateRateTotal NTotal N# Hired# HiredGroupGroupRegionRegion
13.3%13.3%2252253030HispanicHispanic
1.001.0013.3%13.3%3003004040WhiteWhiteFt. WorthFt. Worth
50.0%50.0%30301515HispanicHispanic
1.001.0050.0%50.0%200200100100WhiteWhiteDallasDallas
IRIRPass Pass
RateRateTotal NTotal N# Hired# HiredGroupGroupRegionRegion

Statistical Significance & Power
Power depends on statistical decisions α level
Higher α level results in greater power
Court prefers α = .05
Tails1 tail (directional) has greater power than 2 tail (non-directional)
Court prefers 2 tails
Some argue that 1 tail would be more appropriate
Statistical test chosen (tests vary in power)Stay abreast of best practices
Seek guidance if needed

α Level & Tails
Note: Blue shaded area = α

Statistical Tests: Chi-Square
Test of association between two qualitative variables 2 X 2 contingency table
E.g., association between pass vs. fail X male vs. female
Compares fit between observed frequencies and expected frequencies Expected frequencies are what you would expect if
there was no relationship between the 2 variables

Statistical Tests: Chi-Square

Statistical Tests: ZD
Z-test of the difference in selection rates A.k.a. 2-SD test or Pooled Two-Sample Z-Score test
Difference between two proportions or selection rates
Mathematically equivalent to chi-square (when testing 2 X 2 table)Chi-square = ZD squared; square root of chi-square = ZD
Source: Moore & McCabe (1993); Morris (2001); OFCCP (1993)

Comparison Problem
When comparing test results, we are
comparing apples and oranges
4/5ths = ratio of selection rates
2-SD = difference in selection rates
Absolute difference ≠ relative difference
.10/.15 vs. .45/.50
Difference in selection rate = .5 vs. .5
Ratio of selection rate = .67 vs. .90

Statistical Tests: ZIR
Z-test of the ratio of selection rates
Sampling distribution is non-symmetric
0 - 1, 1 - ∞
Take natural log of ratio
Source: Morris (2001)

ZD vs. ZIR
Both Numerator = effect size
Denominator = standard error of effect size when null hypothesis is true (i.e., no differences)
If |Z| > 1.96, then sig at two-tailed α =.05
ZIR
Effect size is same as the impact ratio (selection rate ratio)
Slightly more power (especially as proportion of minority applicants gets smaller)
Can build confidence intervals around impact ratio

Confidence Intervals for ZIR
Problem with statistical tests Large N; is the significant result meaningful?
Small N; is it really non-significant or is it a result of low power?
Advantage of confidence interval Large N; helps distinguish b/t trivial & substantial statistical significance
Small N; help understand degree of potential Type II error when non-sig
Effect size (i.e., impact ratio) provides best estimate of magnitude of the difference
Confidence interval (CI) communicates degree of precision (i.e., sampling error) in that estimate CI does not eliminate problem of low power, but provides more
comprehensive picture of results
If CI includes 1.0, degree of AI is not statistically significant
Problem: still only accurate when expected frequency of minority hires > 18 and IR > .2
Statistical Tests: Fisher Exact Test
For a 2 X 2 contingency table
Calculates the exact probability of obtaining the observed frequency table or one more extreme (i.e., stronger association) assuming no true relationship between the two variables.
The resulting probability level is taken as the significance level.

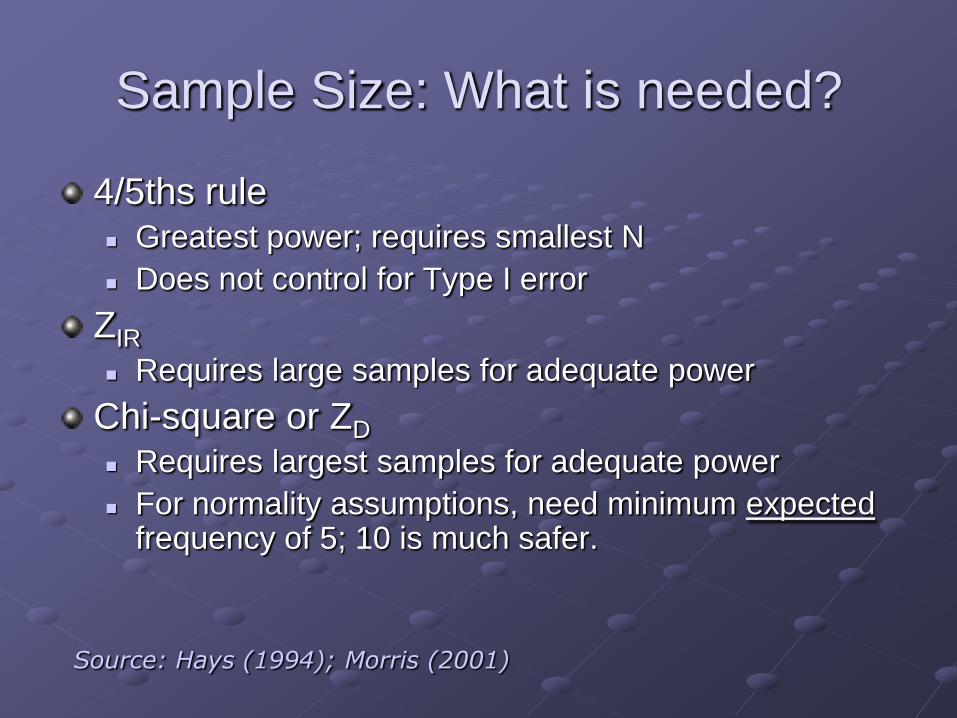
Sample Size: What is needed?
Federal enforcement agencies offer no established threshold and little guidance
Uniform Guidelines (Q&A #20) Seem to suggest that 4 hires from an applicant pool
of 30 is too small
OFCCP If the number of total persons in the pool of
applicants/candidates is less than 30 and the number of expected minority/female selections is less than 5, a small numbers test (preferably Fisher's exact) should be used
Sample Size: What is needed?
4/5ths rule Greatest power; requires smallest N
Does not control for Type I error
ZIR
Requires large samples for adequate power
Chi-square or ZD
Requires largest samples for adequate power
For normality assumptions, need minimum expectedfrequency of 5; 10 is much safer.
Source: Hays (1994); Morris (2001)

Sample Size: Small N
When sample is small N (e.g., N < 100 and minimum expected frequency < 5) Fisher’s exact has lowest Type I error, but at the
expense of power
4/5ths has the highest power, but at the expense of Type I error
N of 1 rule is improvement over 4/5ths, but still relatively high Type I error
ZD appears to be the best method available
All statistical methods have extremely low power when population impact ratio = .8
Source: Collins & Morris (2008)

Practical Tests
N of 1 (flip-flop) rule Calculates an adjusted impact ratio
Assume one more person from the minority group and one less person from the majority group were hired (and, consequently, one less minority and one more majority were hired).
If the resulting selection ratios are such that the minority selection ratio is now larger than the majority selection ratio, selection rate differences may be attributed to small sample size.
One person rule If the difference between actual minority hires and expected
minority hires (rounded down to the nearest whole number) is less than 1, selection rate differences may be attributed to small sample size.
Source: Uniform Guidelines Q&A 21; Roth, Bobko & Switzer (2006)

Practical Tests
Shortfall analysis How many more in minority group would need to pass
to exceed 80%?
How many more in minority group would need to pass to bring passing rates very close?
How many more in minority group would need to pass to eliminate statistical significance?
Shortfall analyses typically assumes row and column totals stay the same If 1 more minority passes, then 1 less minority fails, 1
less majority passes, & 1 more majority fails
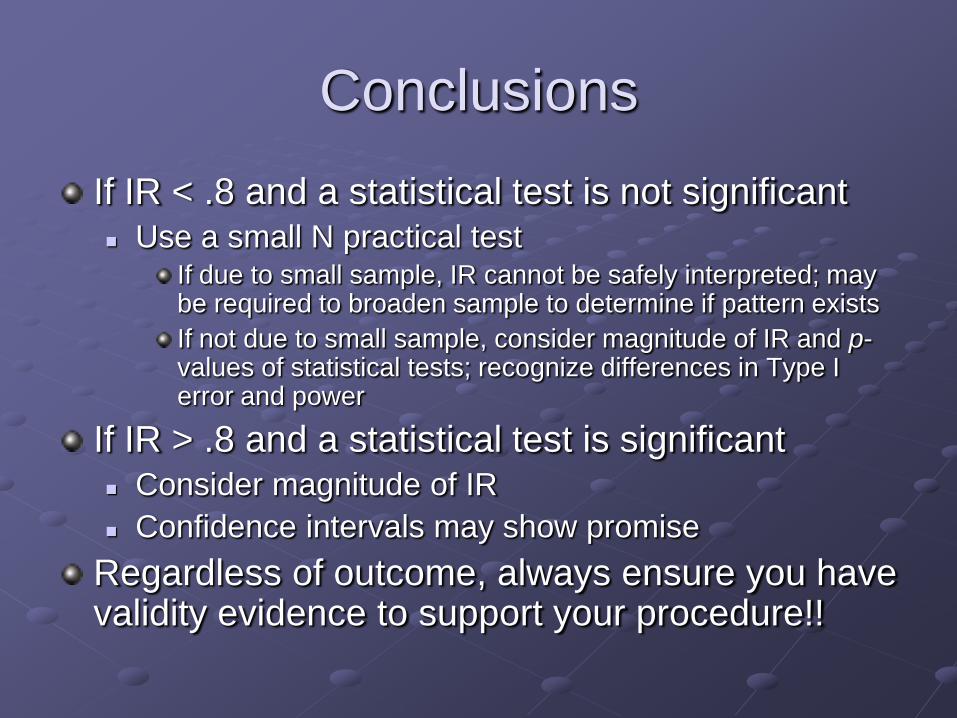
Conclusions
If IR < .8 and a statistical test is not significant Use a small N practical test
If due to small sample, IR cannot be safely interpreted; may be required to broaden sample to determine if pattern exists
If not due to small sample, consider magnitude of IR and p-values of statistical tests; recognize differences in Type I error and power
If IR > .8 and a statistical test is significant Consider magnitude of IR
Confidence intervals may show promise
Regardless of outcome, always ensure you have validity evidence to support your procedure!!

References
Biddle, D. (2005) Adverse Impact and Test Validation: A practitioner’s Guide to Valid and Defensible Employment Testing.England: Gower.
Collins, M. W. & Morris, S. B. (2008). Testing for adverse impact when sample size is small. Journal of Applied Psychology, 93, 463-471.
Equal Employment Opportunity Commission, Civil Service Commission, Department of Labor, & Department of Justice. (1978). Uniform guidelines on employee selection procedures. Federal Register, 43, 38290-38315.
Hays, W. L. (1994) Statistics (5th ed.). New York: Holt, Rinehart & Winston.
Lawshe, C. H. (1987). Adverse Impact: Is it a viable concept? Professional Psychology Research and Practice, 18, 492-497.
Moore, D. S. & McCabe, G. P. (1993). Introduction to the Practice of Statistics (2nd ed.). New York: W.H. Freeman & Company.

References
Morris, S. B. (2001). Sample size required for adverse impact analysis. Applied HRM Research, 6, 13-32.
Morris, S. B. & Lobsenz, R. E. (2000). Significance tests and confidence intervals for the adverse impact ratio. Personnel Psychology, 53, 89-111.
Office of Federal Contract Compliance Programs (1993). Federal contract compliance manual. Washington, D.C.: Department of Labor, Employment Standards Administration, Office of Federal Contract Compliance Programs (SUDOC# L 36.8: C 76/1993).
Roth, P. L., Bobko, Pl, & Switzer III, F. S. (2006), Modeling the behavior of the 4/5ths rule for determining adverse impact: Reasons for caution. Journal of Applied Psychology, 91, 507-522.
www.AdverseImpact.org