Embed Size (px)
Citation preview

Adventures with Data
Definitions and Reporting(and maybe some solutions)
Miranda Pearson
Keith Fortowsky
CIRPA Conference 2017

• Fall 2017: 15,276 total students
– 13,375 Undergraduate level
– 1,901 Graduate level
• ERP System: Ellucian Banner
• Analytics and Reporting: new Cognos 11 implementation
(Enterprise); Tableau (Desktop for IR users); home-built
centralized reports via Access
• Metadata: Data Cookbook
About University of Regina

• Informal session
• “Student Data Special Interest
Group”
• Introduce yourself (name and
institution) the first time you
speak
• Let’s continue the
conversation after the session
and conference!
Let’s discuss!
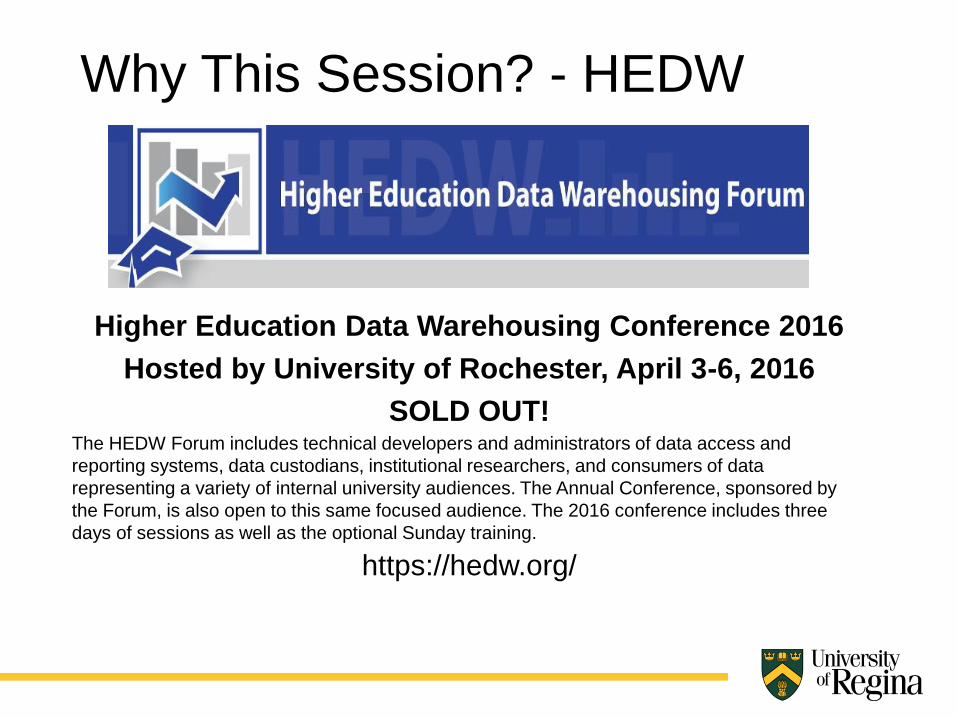
Higher Education Data Warehousing Conference 2016
Hosted by University of Rochester, April 3-6, 2016
SOLD OUT!The HEDW Forum includes technical developers and administrators of data access and
reporting systems, data custodians, institutional researchers, and consumers of data
representing a variety of internal university audiences. The Annual Conference, sponsored by
the Forum, is also open to this same focused audience. The 2016 conference includes three
days of sessions as well as the optional Sunday training.
https://hedw.org/
Why This Session? - HEDW

• Data Warehousing and reporting concepts and roles
• Duplicate headcounts (majors and minors, HEDW)
• Registered and Withdrawn student counts
• Single class counts
• Applicants vs. Applications
• Retention rates
• Elements of at-risk students
• MORE ? – audience suggestions please !
Today’s Topics

• Are you or is someone else in your IR office or institution
(IT department?) knowledgeable about:
– Data Architecture or Information Architecture
– Facts and Dimensions
– Conformed dimensions
– Grain of a table
• Does your institution have a defined role responsible for
understanding how your data fits together conceptually –
NOT (just) data tables and queries? A “Data Architect”,
“Information Architect”, “BI Architect”, or other?
Concepts and Roles

• Generally combine multiple fields from the student
information system (e.g. Banner) or possibly from a
combination of systems (e.g. SIS and LMS)
• Initial set up of fields was commonly transactional
– Little thought to reporting or summarizing
• Context is required
– Difficult to document and describe concisely
– Difficult to share solutions
• What complex data definitions do you struggle with and
want to see how others handle them?
Complex Data Definitions

• Count all students touching a program for purposes of
program capacity planning
– First Major AND Second Major (and possibly Minors)
– Concurrent programs
========================
How Do You Report on Double Majors?: The Process
Towards Counting “Hidden” Students
HEDW MARCH 10, 2016
Katarina Durasova & Michelle Stine, Penn State
https://hedw.org/hedwpresentation/how-do-you-report-on-double-majors-the-process-towards-counting-hidden-students/
Duplicate Headcounts


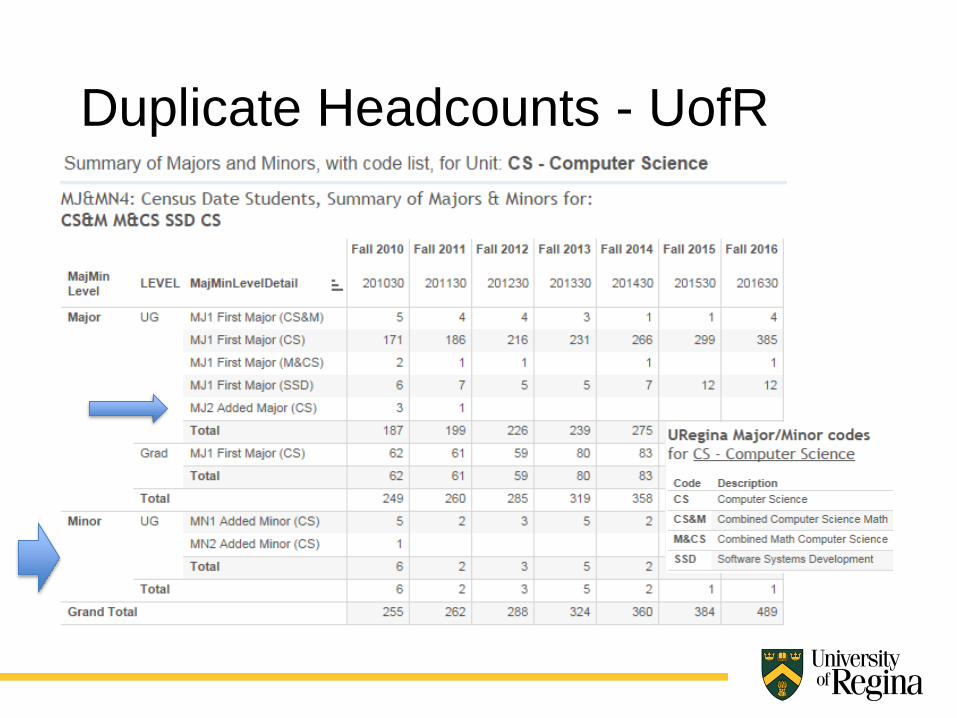
Duplicate Headcounts - UofR

(Filters on <>””: MajMinLevelDetail = )IF LEN([ProgramList])>=3
AND contains(" "+UPPER([ProgramList])+" "," "+TRIM(UPPER([Program Code]))+" ")
THEN "PROG "+TRIM([Program Code])
ELSEIF LEN([ProgramSearch])>=3 and [ProgramSearch]=left([Program Code],LEN([ProgramSearch]))
THEN "PROG "+TRIM([ProgramSearch])+"*"
ELSE
if contains(" "+UPPER([MajMinList])+" "," "+TRIM(UPPER([Major Code 1]))+" ")
then "MJ1 First Major ("+TRIM(UPPER([Major Code 1]))+")"
elseif contains(" "+UPPER([MajMinList])+" "," "+TRIM(UPPER([Major Code 2]))+" ")
then "MJ2 Added Major ("+TRIM(UPPER([Major Code 2]))+")"
elseif contains(" "+UPPER([MajMinList])+" "," "+TRIM(UPPER([Minor Code 1]))+" ")
then "MN1 Added Minor ("+TRIM(UPPER([Minor Code 1]))+")"
elseif contains(" "+UPPER([MajMinList])+" "," "+TRIM(UPPER([Minor Code 2]))+" ")
then "MN2 Added Minor ("+TRIM(UPPER([Minor Code 2]))+")"
else ""
endEND
Duplicate Headcounts – UofR Calculation

• Peak counts for purposes of teaching/class capacity
planning
• Withdrawn students usually require space and teaching
resources for a good portion of the course duration
• Related question: Do you distinguish between Enrolled vs.
Registered students?
Registered & Withdrawn Students

• Query containing one row per course registration with
identification of registration status and credit hours. Option
to summarize by registered and withdrawn for Course
Seats and Program Head Count.
Registered & Withdrawn: UofR
Term SID / PIDM Course CRNETL reporting
as of date
Registration
StatusCredit Hours
201730 13 8011 R 3.0
201730 13 8022 W 3.0
201730 13 8025 W 3.0
201730 13 9199 W 1.0
# Registered # WithdrawnRegistered
Credit Hours
Withdrawn
Credit Hours
Course Seats 1 3 3.0 7.0
Program Head
Count 1 0 3.0 7.0
• Identifying single classes, for purposes of teaching load,
where the “class” may be split up amongst multiple
sections, organisational funding units, and/or multiple
faculties/colleges
Single Classes (“Meets”)

Query to identify class sections taught on the same day, at
the same time, by the same instructor or ‘team’ (may be
various locations with web and distance delivery.
• 1 Meet (= “class” for Instructor)
• has 1 or more Courses (= “class” for Student)
multi-level: GEOG 410 & 810 &/or crosslisted: GEOL 410
• each course has 1 or more Sections
• often want to split for attribution ex 1 meet for teaching
load is 0.8 meets UnderGrad and 0.2 meets Graduate
Single Meets: UofR
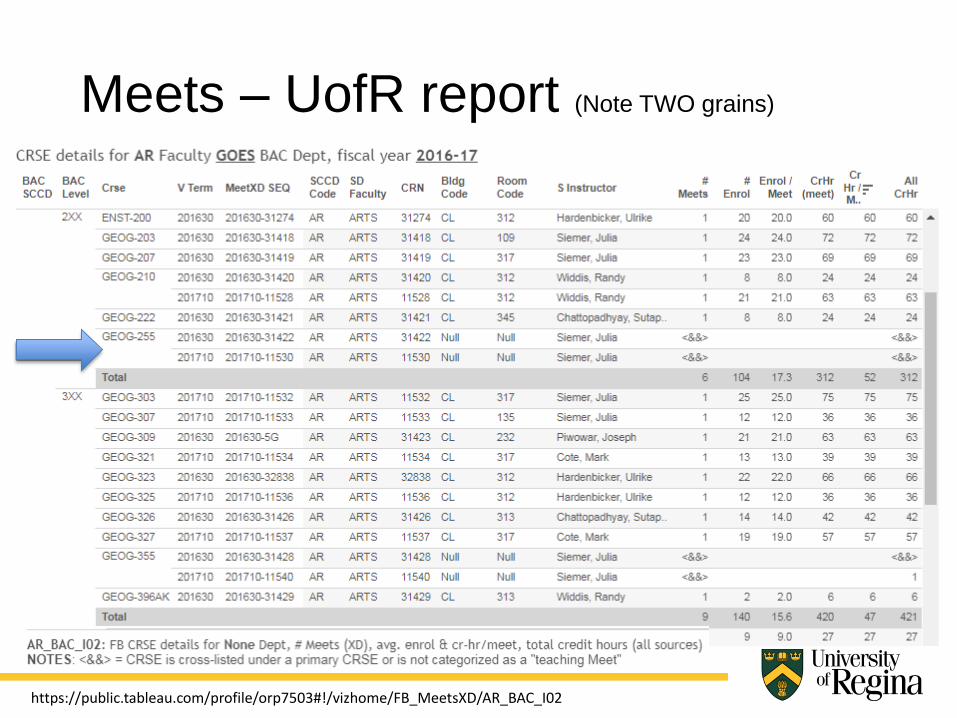
Meets – UofR report (Note TWO grains)
https://public.tableau.com/profile/orp7503#!/vizhome/FB_MeetsXD/AR_BAC_I02

• If an applicant submits more than one application in a
term, identification of the proper application (i.e. program)
to count when measuring new individuals touched by
recruitment.
Applicants vs. Applications
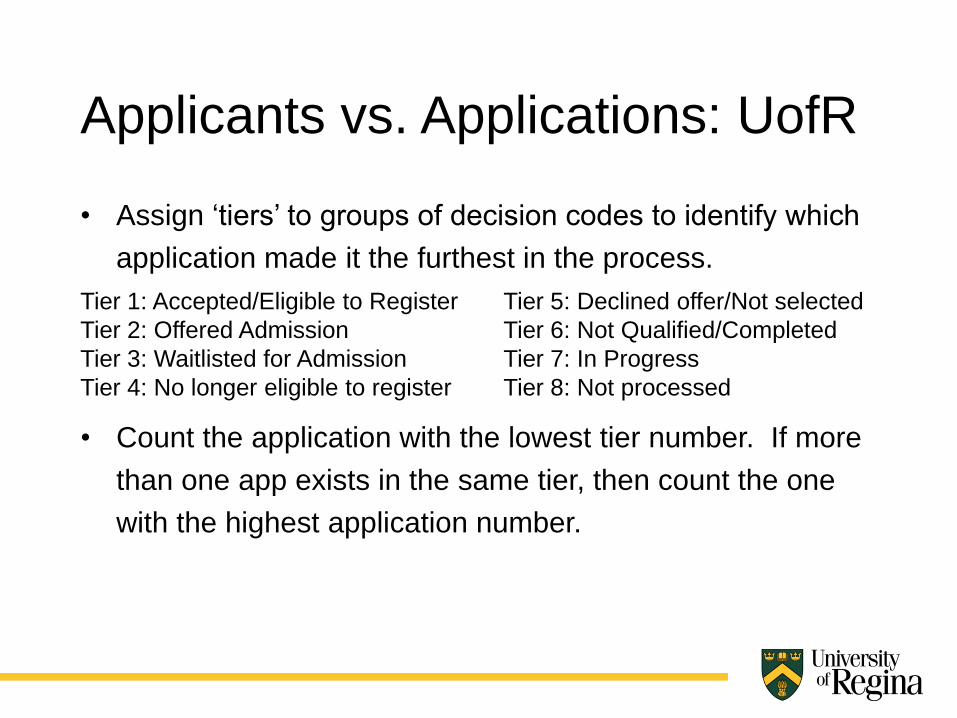
• Assign ‘tiers’ to groups of decision codes to identify which
application made it the furthest in the process.
Applicants vs. Applications: UofR
Tier 1: Accepted/Eligible to Register
Tier 2: Offered Admission
Tier 3: Waitlisted for Admission
Tier 4: No longer eligible to register
Tier 5: Declined offer/Not selected
Tier 6: Not Qualified/Completed
Tier 7: In Progress
Tier 8: Not processed
• Count the application with the lowest tier number. If more
than one app exists in the same tier, then count the one
with the highest application number.

• Calculation of retention rates that are meaningful at a
faculty or department or program level, using less specific
definitions than CSRDE reporting
Retention Rates

• Identification of each element that may feed into identifying
student as “at risk” of dropping out or failing
• For example: identifying Financial risk but ensuring it is not
based on library fees for overdue books (as use of library
may indicate success) or outstanding fees for a student
who is sponsored when fees are not paid until after
successful completion.
Elements of At Risk Students

• Delegate’s contact information is in the mobile app
• LinkedIn discussions
• Coming soon to the CIRPA website: discussion forum
behind the secure login area
Continue the discussion

Miranda Pearson Keith Fortowsky
Institutional Data Quality Analyst Director, Institutional Research
[email protected] & Data Governance Officer
306-585-5446 [email protected]
306-585-5438
University of Regina, Office of Resource Planning:
www.uregina.ca/orp
Contact Us