Embed Size (px)
Citation preview

Advantage Power Pricing Pilot
Confidential and Proprietary Page i ©2016 Navigant Consulting, Inc. Do not distribute or copy
Advantage Power Pricing Pilot Impact and Process Evaluation
Prepared for: PowerStream Inc. 161 Cityview Blvd. Vaughan, ON L4H 0A9 T: 905.532.4417 F: 905.532.4447 www.PowerStream.ca
Submitted by: Navigant Consulting Ltd. Bay Adelaide Centre, 333 Bay St, Suite 1250 416.927.1641 navigant.com Reference No.: 172240 July 7, 2016

Advantage Power Pricing Pilot
Confidential and Proprietary Page 1 ©2016 Navigant Consulting, Inc. Do not distribute or copy
TABLE OF CONTENTS
Disclaimer ...................................................................................................................... 5
Executive Summary ...................................................................................................... 6
Key Findings and Recommendations 7 Program Overview 8 Evaluation Approach 10 Impact Evaluation Findings 11 Process Evaluation Findings 13
1. Introduction ............................................................................................................. 15
1.1 Program Overview 15 1.1.1 APP Design Principles.................................................................................................... 16 1.1.2 APP Rates ...................................................................................................................... 17 1.1.3 APP Technology ............................................................................................................. 19 1.1.4 APP Participants ............................................................................................................. 19 1.1.5 Summer 2015 APP Events ............................................................................................. 21
1.2 Objectives of the Evaluation 23 1.2.1 Impact Evaluation Objectives ......................................................................................... 23 1.2.2 Process Evaluation Objectives ....................................................................................... 23
2. Evaluation Approach .............................................................................................. 24
2.1 Impact Evaluation 24 2.1.1 Regression with Pre-Program Processing ..................................................................... 24 2.1.2 Control Group Selection ................................................................................................. 25 2.1.3 Hourly Demand Impact Estimation ................................................................................. 27 2.1.4 Daily Energy Impact Estimation ..................................................................................... 29
2.2 Process Evaluation Approach 30
3. Impact Findings ....................................................................................................... 33
3.1 Event Demand Impacts 34 3.1.1 Overall Average Event Impacts ...................................................................................... 34 3.1.2 Hourly Event Impacts ..................................................................................................... 36 3.1.3 Average Event Impacts by Sub-Group ........................................................................... 40
3.2 System Peak Demand Impacts 42 3.3 Summer Energy Impacts 44 3.4 Participant Cost Impacts 47
3.4.1 Commodity Cost Impacts ............................................................................................... 47 3.4.2 Participant Rebates ........................................................................................................ 49
3.5 Conservation Settings Over Time 52
4. Process Evaluation Findings ................................................................................. 54
4.1 Participant Demographics 55 4.2 Motivations for Program Participation 58 4.3 Program Enrollment Process 61 4.4 Participant Technology Engagement 64 4.5 Participant Satisfaction with the APP 67

Advantage Power Pricing Pilot
Confidential and Proprietary Page 2 ©2016 Navigant Consulting, Inc. Do not distribute or copy
4.6 Participant Support of the Initiative 70 4.7 Participant Comfort 72
5. Conclusion & Recommendations .......................................................................... 74
Attached as separate documents:
Appendix A: APP Hourly Load Plots (PDF) Appendix B: APP Hourly Impacts (XLSX)

Advantage Power Pricing Pilot
Confidential and Proprietary Page 3 ©2016 Navigant Consulting, Inc. Do not distribute or copy
TABLE OF FIGURES Figure 1: Summer 2015 APP Prices .......................................................................................................... 18 Figure 2: Summer 2015 RPP TOU Prices ................................................................................................. 18 Figure 3: Comparison of RPP TOU and APP Prices and Scheduling ....................................................... 19 Figure 4: Participant Density Map by FSA ................................................................................................. 20 Figure 5: Demographic Distribution of APP Participants ........................................................................... 21 Figure 6: APP Price Level Days in Summer of 2015 ................................................................................. 22 Figure 7: Final Distribution of Summer 2015 Hours ................................................................................... 22 Figure 8: Day-Type CDH Thresholds ......................................................................................................... 26 Figure 9: Participant Surveys – Timing and Completion Rate ................................................................... 30 Figure 10: Process Evaluation Overview ................................................................................................... 31 Figure 11: Average Program Impacts by Price .......................................................................................... 34 Figure 12: APP Period Impacts Compared to 50% Cycling Residential DR Impacts ................................ 35 Figure 13: Average APP High Day ............................................................................................................ 36 Figure 14: Average APP Medium Day ....................................................................................................... 38 Figure 15: Average APP Low Day ............................................................................................................. 39 Figure 16: Example Critical Peak Event (2015-07-28) .............................................................................. 40 Figure 17: Average Event Impact (kW) by Conservation Setting .............................................................. 40 Figure 18: Average Event Impact (%) by Conservation Setting ................................................................ 41 Figure 19: Average Event Impact (kW) by Demographic .......................................................................... 42 Figure 20: Average Event Impact (%) by Demographic ............................................................................ 42 Figure 21: Average Participant Impacts (kW) During System Peak Coincident Hours ............................. 43 Figure 22: Average Participant Impacts (kW) During System Peak Coincident Hours by Conservation Setting ........................................................................................................................................................ 43 Figure 23: Average Participant Impacts (kW) During System Peak Coincident Hours by Demographic Group ......................................................................................................................................................... 44 Figure 24: Summer Energy Savings (kWh) by Conservation Setting ........................................................ 45 Figure 25: Summer Energy Savings (%) by Conservation Setting ............................................................ 46 Figure 26: Summer Energy Savings (kWh) by Segment ........................................................................... 46 Figure 27: Summer Energy Savings (%) by Segment ............................................................................... 47 Figure 28: Average Total Summer Commodity Cost Savings ($) .............................................................. 48 Figure 29: Average Total Summer Commodity Cost Impact (%) ............................................................... 49 Figure 30: APP Summer Rebate Incentive Summary Statistics ................................................................ 50 Figure 31: Distribution of APP Rebates by Conservation Setting .............................................................. 51 Figure 32: Weekly Conservation Setting Distribution Over Time ............................................................... 52 Figure 33: Participant Conservation Setting Changes Over Time ............................................................. 53 Figure 34: Participant Age Range .............................................................................................................. 56 Figure 35: Full-Time Residents in Participant Households ........................................................................ 57 Figure 36: Participants’ Previous Experience with CDM Programming ..................................................... 58 Figure 37: Customer Motivations for Participation ..................................................................................... 58 Figure 38: Importance of the Energate, Thermostat in Customer Decision to Participate ........................ 59 Figure 39: Initial Impressions of the Energate Thermostat ........................................................................ 60 Figure 40: Importance of the Risk-Free Aspect in Gaining Participation ................................................... 61 Figure 41: Ease of Program Enrollment ..................................................................................................... 61 Figure 42: Materials Consulted by Participants Prior to Enrollment .......................................................... 62 Figure 43: Materials Sufficient for Enrollment ............................................................................................ 63 Figure 44: Participant Educated about Program Prior to Enrollment ......................................................... 63 Figure 45: Experience with Installation Technician .................................................................................... 64

Advantage Power Pricing Pilot
Confidential and Proprietary Page 4 ©2016 Navigant Consulting, Inc. Do not distribute or copy
Figure 46: Frequency of Viewing Price Information ................................................................................... 65 Figure 47: Methods Used for Viewing Price Information ........................................................................... 65 Figure 48: Actions Taken Based on Pricing Information ............................................................................ 66 Figure 49: Technology Interaction ............................................................................................................. 67 Figure 50: Participant Experience with the APP ........................................................................................ 67 Figure 51: Engaged Customer Satisfaction ............................................................................................... 68 Figure 52: All Customer Satisfaction .......................................................................................................... 69 Figure 53: Engaged Customer Comfortability with the Energate Thermostat ........................................... 70 Figure 54: All Customer Comfort with Energate Thermostat ..................................................................... 70 Figure 55: Likelihood of Recommending the Energate System................................................................. 71 Figure 56: Likelihood of Recommending the APP ..................................................................................... 71 Figure 57: Participant Intention to Continue Use of the Thermostat and Portal ........................................ 72 Figure 58: Behaviour Change Influenced by the APP ............................................................................... 72 Figure 59: Engaged Customer Comfort Changes during Peak Events ..................................................... 73 Figure 60: All Customer Comfort Changes during Peak Events................................................................ 73

Advantage Power Pricing Pilot
Confidential and Proprietary Page 5 ©2016 Navigant Consulting, Inc. Do not distribute or copy
DISCLAIMER This report was prepared by Navigant Consulting, Inc. (Navigant) for PowerStream Inc. The work presented in this report represents Navigant’s professional judgment based on the information available at the time this report was prepared. Navigant is not responsible for the reader’s use of, or reliance upon, the report, nor any decisions based on the report. NAVIGANT MAKES NO REPRESENTATIONS OR WARRANTIES, EXPRESSED OR IMPLIED. Readers of the report are advised that they assume all liabilities incurred by them, or third parties, as a result of their reliance on the report,

Advantage Power Pricing Pilot
Confidential and Proprietary Page 6 ©2016 Navigant Consulting, Inc. Do not distribute or copy
EXECUTIVE SUMMARY The Energate-PowerStream Advantage Power Pricing (APP) pilot is an experimental pilot program designed to test the response of technology-enabled residential customers to dynamic electricity prices. The central guiding principles of the program design being tested by this pilot are to empower customers to achieve bill savings and to contribute toward the Ontario Ministry of Energy’s long-term demand response (DR) goals through customer price-response. The program design was developed by PowerStream and Energate in close consultation and collaboration with staff from Ontario’s Independent Electricity System Operator (IESO), Ministry of Energy, and the Ontario Energy Board (OEB). The pilot design is closely modeled on the Oklahoma Gas and Electric (OG&E) SmartHours program (over 100,000 participants currently), modified to reflect the locally-specific needs of the Ontario market. The summer1 2015 pilot was funded by the Ministry of Ontario Smart Grid Fund and through contributions (in resources and in kind) by Energate, PowerStream, Util-Assistand Environics Analytics. Additional funding for the installation of Energate thermostats and related load control equipment was provided by the peaksaver PLUS® residential demand response initiative. Since its original inception, the pilot has been extended to cover the winter of 2015/2016 and the summer of 2016 with funding provided by the IESO Conservation Fund. This report represents Navigant’s evaluation of the APP pilot for the summer of 2015. It is comprised of two evaluation elements:
1. Impact Evaluation. The estimation of program demand and energy impacts through the use of participant and non-participant hourly electricity (AMI/SmartMeter) consumption data and econometric modeling.
2. Process Evaluation. An evaluation of the effectiveness of the APP design and delivery mechanism in meeting programmatic objectives and an assessment of the pilot’s strategic possibilities based on an analysis of five separate participant surveys.
This executive summary is divided into five sections:
• Key Findings and Recommendations. This section provides the most important impact and process findings of the evaluation, and provides recommendations for adjustments in program design to improve the program’s ability to meet its twin goals of customer engagement and peak demand reductions.
• Program Overview. This section briefly summarises the APP program design and implementation in the summer of 2015.
• Evaluation Approach. This section briefly describes the analytic approach used by the impact and process evaluations teams.
• Impact Evaluation Findings. This section summarises the most important findings of the impact evaluation.
1 Unless stated otherwise, all references to summer in this report should be understood to refer to the Ontario Energy Board’s Regulated Price Plan “summer” that runs from May 1st through to the end of October.
Advantage Power Pricing Pilot
Confidential and Proprietary Page 7 ©2016 Navigant Consulting, Inc. Do not distribute or copy
• Process Evaluation Findings. This section summarises the most important findings of the process evaluation.
Key Findings and Recommendations
Navigant’s key finding of its evaluation of the summer 2015 APP pilot are:
1. The APP pilot delivered an average demand reduction of 1.1 kW per home during the summer 2015 system coincident peak hour. Participants that selected the most aggressive conservation settings2 (“Max Savings” and “Savings”) delivered an average demand reduction of more than 1.5 kW. Given a program population of more than 1,000 participants, this represents and aggregate program impact of over 1 MW. Given these impacts, and the observed uptake of Oklahoma Gas and Electric’s “SmartHours” program (approximately 10% of residential participants) this suggests a province-wide potential of more than 400 MW of DR capacity.
2. On average participants paid $74 less in electricity commodity costs than they would have, absent the program. This is equivalent to a reduction in average participant commodity costs of 17%. The average commodity cost reduction for a participant using the “Max Savings” conservation setting was approximately 25%.
3. Approximately one fifth of participants contributed, on average, only modest peak demand impacts and materially increased their energy consumption. Participants selecting the “Max Comfort” conservation setting delivered on average only 0.3 kW of demand reductions during the summer 2015 system coincident peak hour and increased their summer energy consumption by over 9%.
4. APP has been successful in penetrating a segment of PowerStream’s customer-base previously unengaged with utility-based energy efficiency efforts. Nearly 70% of APP participants indicated that they had not previously participated in any PowerStream offered Conservation and Demand Management (CDM) initiative.
5. Nearly 80% of respondents said that the risk-free aspect of the program was very important in their decision to enroll. Maintaining the first-year risk-free “commodity cost guarantee”3 is likely to be essential for any successful wider program roll-out.
6. Engaged customers’4 perception of the program improved over the course of the program. By the final survey, 56% of engaged customers said that the program had surpassed their initial expectations.
Based these six key findings, Navigant has the following recommendations for improving the APP design and maximizing the value of future impact evaluations in future years:
1. PowerStream should consider withdrawing the “Max Comfort” conservation setting option. Participants using this conservation setting deliver very modest demand response impacts, and it is possible that some of these participants may be “gaming” the program – enrolling only to receive the discounted APP Off-Peak price with no intention of taking active demand response actions.
2 Energate device conservation settings are explained in the “Program Overview” section immediately below. 3 PowerStream provides participants with a guarantee that their electricity commodity costs will not be higher than under standard RPP TOU rates for the first year of participation. See below for more details. 4 Engaged customers are defined as those participants who completed all three monthly surveys and the final survey.
Advantage Power Pricing Pilot
Confidential and Proprietary Page 8 ©2016 Navigant Consulting, Inc. Do not distribute or copy
Navigant understands that the flexibility to avoid automatic thermostat offsets is an important and attractive component of the program for customers. One possibility for avoiding participant alienation could be to offer a “Max Comfort” override option that lasts for a day – participants can choose to avoid having their thermostat controlled on any given day, but cannot set this option as a default.
2. For evaluation purposes, PowerStream should consider deploying Critical price events as a randomized control trial (RCT) for the summer of 2016. This recommendation will enhance future year evaluation. By subjecting only some (randomly selected by strata) portion of the participant group to a given Critical peak event, the impacts of such events can be estimated with greater precision and allow for the more robust development of ex-ante forecast impacts, should those be required in future years.
3. For evaluation purposes, PowerStream may wish to consider calling High and Medium price days on cooler summer days. For this year’s evaluation it has not been possible to derive separate estimates for non-A/C behavioural demand response and A/C driven demand response impacts on High and Medium days simply because the price level is so closely correlated with outdoor temperatures. Calling High and Medium price events on days in which very little A/C is in use (as well as on very hot days) would allow Navigant to estimate the incremental impact of A/C response, although it is possible that doing so may result in participant confusion regarding the price signal and potentially frustrate some participants.
4. PowerStream should consider leveraging its link with participants to promote additional energy efficiency initiatives. Seventy percent of APP participants have not previously engaged with other PowerStream-offered CDM initiatives, indicating a substantial marketing opportunity for other, non-APP CDM initiatives. Given the high-levels of program satisfaction indicated by participants, such participants are likely to be receptive to messaging regarding the incremental benefits such programs could offer them.
5. PowerStream should continue to provide participants with ongoing energy management advice to help participants optimize their APP response to the twin goals of reducing system peak demand and achieving bill savings. Participant impressions of the initiative as well as the extent to which they interacted with the program’s tools consistently increased throughout the program period. Maintaining this on-going engagement will be key to maintaining and improving program achievements over time.
Program Overview
The APP pilot design was developed by PowerStream and Energate in collaboration and consultation with the Ministry of Energy, the IESO and the OEB. As part of the design phase, all of the parties agreed that the structure of the pilot should be determined by a number of key design principles. The core philosophy embodied by these principles was that the pilot design should empower, and not compel, customers, to deliver demand response by offering them an opportunity to realize meaningful bill savings through price response in a manner consistent with the goals of Ontario’s Long Term Energy Plan (LTEP). As such, a key imperative of the pilot was that prices to which participants were subject, and the periods these prices were applied, should be reflective of, and responsive to, IESO-identified system needs. Customers enrolled in the APP remained subject to the standard Regulated Price Plan (RPP) time-of-use (TOU) rates, were billed by PowerStream under these rates and were required to pay them as usual. In

Advantage Power Pricing Pilot
Confidential and Proprietary Page 9 ©2016 Navigant Consulting, Inc. Do not distribute or copy
addition, participants received a monthly “shadow bill” that tracked what their bill would have been under the APP rate. At the close of the summer, if participants’ shadow bills were lower than their actual TOU bills, they received the difference from PowerStream as a rebate. Participants whose APP shadow bill exceeded their standard TOU bill were not penalized. To support participant price-response, all customers enrolled in the program for the summer of 2015 were equipped with an Energate Foundation that allowed participants to automate their thermostat’s response to APP price fluctuations. Automatic thermostat response could be fixed at one of five settings, from the “Max Comfort” (which applied no set-point offset) through to “Max Savings” (which applied the most aggressive set-point offset). The summer 2015 APP commodity prices and the degree-offset by comfort setting are summarized in Figure ES - 1, below. This is table is a detail drawn from some of the program educational literature provided to participants.
Figure ES - 1: Comfort Setting Offsets and APP Prices
Source: PowerStream
The APP rate design consists of two main elements:
• A daily “APP period” from 3pm to 9pm on non-holiday summer weekdays. The price in this period varies based on the IESO’s day-ahead forecast system demand and may take one of three possible values – “High”, “Medium” or “Low” prices.
• An irregular (unscheduled) Critical peak price. Critical peak periods may be called at any point of any day in the summer, and are limited to lasting no more than four hours. Participants receive at least two hours’ warning prior to any Critical peak period. In the summer of 2015 all Critical peak events overlapped the standard APP period.
All other hours are classified as “Off-Peak”. This period will be referred to in this report as the “APP Off-Peak” to distinguish it from the RPP TOU Off-Peak period. The APP prices for the summer of 2015, along with the approximate number of hours in the summer to which they were anticipated to apply are shown in the figure below. The APP prices were set to be “revenue-neutral” with standard RPP TOU rates. In other words, absent any change in participants’ load

Advantage Power Pricing Pilot
Confidential and Proprietary Page 10 ©2016 Navigant Consulting, Inc. Do not distribute or copy
as a result of the program, the total revenue recovered from participants would be approximately the same as if they had been subject to standard RPP TOU rates.
Figure ES - 2: Summer 2015 APP Prices
APP Price Period
Price (₵/kWh)
% of Summer Hours
Critical Peak 60 > 0.5% High 48 4% Medium 24 5% Low 12 9% APP Off-Peak 5 82%
Source: PowerStream interval data, IESO day-ahead historical day-ahead demands ,OEB RPP prices, and Navigant analysis APP participants were recruited beginning in October of 2014. PowerStream advertised the program using direct mail, bill inserts and email alerts. Only participants deemed eligible for peaksaver® PLUS enrollment were considered for enrollment into the APP. PowerStream’s initial enrollment goal was approximately 1,000 participants. Enthusiasm for the program led to APP being over-subscribed and requiring that PowerStream close enrollment to new customers. Altogether 1,047 participants had enrolled and were eligible to receive incentive rebates from PowerStream by the end of the summer of 2015.
Evaluation Approach
Impacts were estimated through the use of an econometric technique known as regression with pre-program matching (RPPM). RPPM is a quasi-experimental technique that establishes a control group for impact estimation through the careful matching of pre-participation participant and potential control customer consumption patterns. This approach minimizes the potential for model specification bias by using non-participating customers with demonstrably similar historical consumption patterns as the basis for the counterfactual (baseline) that drives impact estimation. Navigant used hourly interval data from participants and from over 100,000 non-participants (the base pool from which controls were selected) from the summers of 2013, 2014 and 2015 in its analysis. The process evaluation was driven by data provided by five different participant surveys. In addition to allowing Navigant’s evaluation team to assess the reported behaviours, opinions and satisfaction of participants, the longitudinal (i.e., surveying the same participants at different points in time) nature of the survey deployment allowed for a nuanced analysis of how the reported behaviours, opinions and satisfaction of participants changed over time. Summary of the five surveys is provided below.
Figure ES - 3: Participant Surveys: Timing and Completion Rate
Survey Timing Completes Pre-pilot Survey April 2015 250

Advantage Power Pricing Pilot
Confidential and Proprietary Page 11 ©2016 Navigant Consulting, Inc. Do not distribute or copy
In-Program Survey 1 July 2015 296 In-Program Survey 2 August 2015 283 In-Program Survey 3 September 2015 166 Final Survey December 2015 276
Source: Navigant analysis
Impact Evaluation Findings
Navigant’s key impact evaluation findings include:
1. The APP pilot delivers substantial demand reductions coincident with the IESO system peak. The average per participant demand impact during the IESO system peak hour on July 28 was 1.1 kW overall, and more than 1.5 kW for participants using the “Savings” or “Max Savings” conservation setting.
2. APP period demand reductions in High and Critical price periods are higher than those from many 50% A/C cycling programs at similar temperatures. High and Critical price event impacts tend to be approximately 30% greater at any given temperature than the 50% A/C cycling impacts reported for four such programs, including Ontario’s peakSaver.
3. Participants on average realized material commodity cost reductions due to program participation. On average, compared to what they would have paid absent the program, participants would have paid $74 more of commodity charges over the course of the summer of 2015 than they did when subject to the APP rate and program design.
4. APP period demand impacts are consistent across the APP period. Automated pre-cooling delivers APP impacts that remain reasonably consistent across all hours of the period, avoiding the classic asymmetry of impacts typically observed for set-point offset demand response programs.
5. On average participating in the APP increased customer energy consumption. Energy consumption increases are statistically significant only for participants selecting the “Max Comfort” conservation setting. It is, however, Navigant’s opinion that the overall average participant increase in consumption - though not statistically significant – is real and represents a rational economic response to program price signals.
6. Most participants did not change their conservation settings over the course of the summer. Nearly three quarters of participants employed the same conservation setting at the end of the summer as at the start of it. Approximately a fifth of participants used the “Max Comfort” setting. Given the very modest demand impacts attributable to this group, PowerStream may wish to consider withdrawing this option from the program.
The average demand impact per participant during the APP period (3pm to 9pm, prevailing time), by price level is presented in Figure ES - 3, below.

Advantage Power Pricing Pilot
Confidential and Proprietary Page 12 ©2016 Navigant Consulting, Inc. Do not distribute or copy
Figure ES - 4: Average Program Impacts by Price
APP Price Mean Lower 90% CI*
Point Estimate (kW)
Mean Upper 90% CI*
Critical Peak Event 0.67 0.88 1.09 High Price Day 0.47 0.52 0.58 Medium Price Day 0.20 0.23 0.27 Low Price Day 0.03 0.06 0.10 *The average 90% confidence interval surrounding the estimate impacts in the given price period.
Source: PowerStream interval data, Util-Assist tracking data, Energate conservation setting data, Environment Canada weather
data, and Navigant analysis These impacts are the average across all of the relevant events and all participants. The average estimated kW per participant impact for critical peak events includes the estimated impact from a “test” critical peak event called on May 29 (when the average outdoor temperature was only in the mid-20s). If this test event were to be dropped, the average critical peak event impact would be approximately 0.98 kW per participant. The degree to which average participant impacts per event vary with outdoor temperature may be observed in Figure ES - 4. In this plot, the estimated impact (Y-axis) of each APP period (on days where the average event temperature was higher than 20 degrees Celsius) is plotted against the average outdoor temperature. Different colour dots capture the different price levels. To compare the APP results with those of other residential DR programs, Navigant has also plotted the reported ex-post DR impacts for individual days from four residential A/C programs that employ 50% cycling strategies5.
5 Many of these programs also employ other cycling strategies – e.g., 65%, 100%, etc. but often much less frequently than the 50% events. For consistency across programs, only the 50% cycling strategy impacts have been plotted.

Advantage Power Pricing Pilot
Confidential and Proprietary Page 13 ©2016 Navigant Consulting, Inc. Do not distribute or copy
Figure ES - 5: APP Period Impacts Compared to 50% Cycling Residential DR Impacts
Source: PowerStream interval data, Util-Assist tracking data, Energate conservation setting data, Environment Canada weather data, Duke Energy Progress, Ontario Power Authority, Pacific Gas & Electric, Southern California Edison and Navigant analysis
Process Evaluation Findings
Navigant’s key process evaluation findings include:
1. The majority of participants would recommend the program and technology to friends and family. 80% of engaged customers6 and 62% of larger group said that they were “very likely” to recommend the Energate thermostat and portal to others, and 73% of engaged and 67% of the larger group of customers said they would recommend the APP program.
2. The APP has been successful in penetrating a segment of PowerStream’s customer-base previously unengaged with utility-based energy efficiency efforts. Nearly 70% of APP
6 Engaged customers are defined as those participants who completed all three monthly surveys and the final survey. The larger pool of customers are defined as those participants who responded to three or fewer surveys.
Advantage Power Pricing Pilot
Confidential and Proprietary Page 14 ©2016 Navigant Consulting, Inc. Do not distribute or copy
participants indicated that they had not previously participated in a PowerStream offered CDM initiative.
3. The primary value proposition of the program which led to sign-ups was the perceived ability of the APP to help the customer reduce their electricity bills. A secondary reason for participation was the ability of the program to help the customer better understand the manner in which their homes consume energy.
4. Nearly 80% of respondents said that the risk-free aspect of the program was very important in their decision to enroll. Maintaining the risk-free guarantee that the customer’s commodity costs under the program cannot be higher than under standard RPP TOU rates for the first year of participation is likely to be essential for any successful wider program roll-out.
5. Engaged customers’ perception of the program improved over the course of the program. By the final survey, 56% of engaged customers said that the program had surpassed their initial expectations. In comparison, only 32% of customers in the larger pool said the program was better than expected, though satisfaction with the program was still generally high.
6. Satisfaction with the program increased over time. The longer customers participate in the program, the more they like it. The percentage who responded that the program had performed better than they expected started at 30% in the June survey and ended at 43% by the final survey.
7. Participant responses clearly demonstrate a high level of satisfaction with the enrollment process. In total, almost the entire participant-base (91%) said they found the enrollment process easy.
8. Participants are likely tech-savvy customers interested in trying out new devices and technologies. Half of the people who signed up said that their initial impression of the Energate thermostat was that it was a sophisticated technology that they wanted to experiment with in their home.
9. APP customers were proactive with regard to informing themselves about the program. In addition to reviewing the participant package provided by Powerstream, 57% of customers looked up program information on Powerstream’s website and 40% spoke with a representative before signing up. Four-fifths of participants said that the materials provided were sufficient for enrollment, and 86% felt fully educated on the program when they signed up.
10. From the beginning, people were enthusiastic about the program and the Energate device. A third of respondents in the post-enrollment survey said that they thought the Energate thermostat was “a technology that all homes in Powerstream’s territory would likely benefit from.”
11. Participants will continue to engage with the program in the future. A very high percentage (80 to 90%) of customers in the engaged group as well as the larger group said that they expected to continue using the thermostat and portal in the future.
12. The program has resulted in a sustained self-reported price-responsive energy-savings behaviour change. Two thirds of engaged customers reported that they took additional energy saving actions every day, depending on the peak price and 88% of engaged customers claimed to have developed lasting energy saving behaviours and habits through their use of the Energate device over the course of the pilot.

Advantage Power Pricing Pilot
Confidential and Proprietary Page 15 ©2016 Navigant Consulting, Inc. Do not distribute or copy
1. INTRODUCTION The Energate-PowerStream Advantage Power Pricing (APP) pilot is an experimental program designed to test the response of technology-enabled residential customers to dynamic electricity prices. The central guiding principles of the program design being tested by this pilot are to provide customers with an opportunity to achieve significant bill savings, and to contribute toward the Ontario Ministry of Energy’s long-term demand response (DR) goals by empowering customers with information and enabling technologies. The program design was developed by PowerStream and Energate in close consultation with staff from Ontario’s Independent Electricity System Operator (IESO), Ministry of Energy, and the Ontario Energy Board (OEB). The pilot is closely modeled on the very successful Oklahoma Gas and Electric (OG&E) SmartHours program, modified to reflect the locally-specific needs of the Ontario market. The summer7 2015 pilot was funded by the Ministry of Ontario SmartGrid Fund, and through contributions (in resources and in kind) by Energate, PowerStream and Environics Analytics. Since its original inception, the pilot has been extended to cover the winter of 2015/2016 and the summer of 2016 with funding provided by the IESO Conservation Fund. This report represents Navigant’s evaluation of the APP pilot for the summer of 2015. It is comprised of two evaluation elements:
1. Impact Evaluation. The estimation of program demand and energy impacts through the use of participant and non-participant hourly electricity (AMI/SmartMeter) consumption data and econometric modeling.
2. Process Evaluation. An evaluation of the effectiveness of the APP design and delivery mechanism in meeting programmatic objectives and an assessment of the pilot’s strategic possibilities based on an analysis of five separate participant surveys.
This introductory chapter is divided into two sections:
• Program Overview. This section provides an overview of the guiding principles of the program design, the program design elements and the customers enrolled to participate.
• Objectives of the Evaluation. This section lists the objectives establish for this evaluation by PowerStream and Energate in consultation with staff from the IESO, the Ministry of Energy and the OEB.
1.1 Program Overview
This section of Chapter 1 provides an overview of the APP as it was deployed in the summer of 2015, and is divided into five sub-sections:
• APP Design Principles. A summary of the design principles adopted by Energate and PowerStream in consultation with the Ministry of Energy, the IESO and the OEB.
7 Unless stated otherwise, all references to summer in this report should be understood to refer to the Regulated Price Plan “summer” that runs from May 1st through to the end of October.

Advantage Power Pricing Pilot
Confidential and Proprietary Page 16 ©2016 Navigant Consulting, Inc. Do not distribute or copy
• APP Rates A description of the rates imposed as part of the APP and the approach used to generate those rates.
• APP Technology. A description of the technology deployed to APP participants in the summer of 2015.
• APP Participants. A description of how participants were recruited, from which parts of PowerStream’s service territory and from what demographic groups.
• Summer 2015 APP Events. A summary of the APP pricing events deployed in the summer of 2015.
1.1.1 APP Design Principles
The APP pilot design was developed by PowerStream and Energate in collaboration and consultation with the Ministry of Energy, the IESO and the OEB. As part of the design phase, all of the parties agreed that the structure of the pilot should be determined by a number of key design principles. The core philosophy embodied by these principles was that the pilot design should empower, and not compel, customers, to deliver demand response by offering them an opportunity to realize meaningful bill savings through price response in a manner consistent with the goals of Ontario’s Long Term Energy Plan (LTEP). As such, a key imperative of the pilot was that prices to which participants were subject, and the periods these prices were applied, should be reflective of, and responsive to, IESO-identified system needs. The pilot design’s guiding principles8 were:
1. Participation is voluntary. No customers will ever be subjected to the APP rate structure without their consent and customers will be able to withdraw from the program at any time.9
2. Participants must be empowered, not compelled, to deliver demand response. Participants are provided with a strong price signal and an enabling technology to respond to that signal easily, but are not required to undertake any response..
3. Participants will face no risk in the first year of participation. For the first year of participation, participants will be offered “no-lose” billing to ensure that recruitment and retention goals are met.
4. The program pricing structure will be designed to meet long-term forecast, rather than historical, system peak capacity needs. The goal of the APP is to test the demand response (DR) capabilities of the program design to better serve long-term provincial capacity needs.
5. APP prices will be reflective of system requirements and costs. Price changes will be correlated with system requirements and costs.
6. APP prices will be set in a manner consistent with the OEB’s principles of cost-recovery as laid out in the RPP. The dynamic prices will be set such that, absent any change in participants’ load as a result of the program, the total revenue recovered from participants will be approximately the same as if they had been subject to standard RPP TOU rates.
8 These principles have been edited and condensed from the original set of nine principles to reflect pilot evolution and based on their relevance to the pilot evaluation. 9 Participants that withdrew prior to the close of summer 2015 were not eligible for the APP rebate that acted as the program incentive..
Advantage Power Pricing Pilot
Confidential and Proprietary Page 17 ©2016 Navigant Consulting, Inc. Do not distribute or copy
1.1.2 APP Rates
Customers enrolled in the APP remained subject to the standard Regulated Price Plan (RPP) time-of-use (TOU) rates, were billed by PowerStream under these rates and were required to pay them as usual. In addition, participants received a monthly “shadow bill” that tracked what their bill would have been under the APP rate. At the close of the summer, if participants’ shadow bills were lower than their actual TOU bills, they received the difference from PowerStream as a rebate. Participants whose APP shadow bill exceeded their standard TOU bill were not penalized. To support participant price-response, all customers enrolled in the program for the summer of 2015 were equipped with an Energate Foundation that allowed participants to automate their thermostat’s response to APP price fluctuations. Automatic thermostat response could be fixed at one of five settings, from the “Max Comfort” (which applied no set-point offset) through to “Max Savings” (which applied the most aggressive set-point offset). The APP rate design consists of two main elements:
• A daily “APP period” from 3pm to 9pm on non-holiday summer weekdays. The price in this period varies based on the IESO’s day-ahead forecast system demand and may take one of three possible values – “High”, “Medium” or “Low” prices.
• An irregular (unscheduled) Critical peak price. Critical peak periods may be called at any point of any day in the summer, and are limited to lasting no more than four hours. Participants receive at least two hours’ warning prior to any Critical peak period. In the summer of 2015 all Critical peak events overlapped the standard APP period.
All other hours are classified as “Off-Peak”. This period will be referred to in this report as the “APP Off-Peak” to distinguish it from the RPP TOU Off-Peak period. The prices to be applied in all APP periods were determined by Navigant based on guidance from PowerStream, Energate, the Ministry, the IESO and the OEB. Prices were determined based on historical PowerStream customer data in a manner consistent with the OEB’s approach to setting the RPP TOU prices: absent any change in load in response to the program, APP rate prices should be approximately revenue neutral to the standard RPP TOU prices. The APP prices for the summer of 2015, along with the approximate number of hours in the summer to which they were anticipated to apply are shown in the figure below. The APP prices were set to be “revenue-neutral” with standard RPP TOU rates. In other words, absent any change in participants’ load as a result of the program, the total revenue recovered from participants would be approximately the same as if they had been subject to standard RPP TOU rates.
Advantage Power Pricing Pilot
Confidential and Proprietary Page 18 ©2016 Navigant Consulting, Inc. Do not distribute or copy
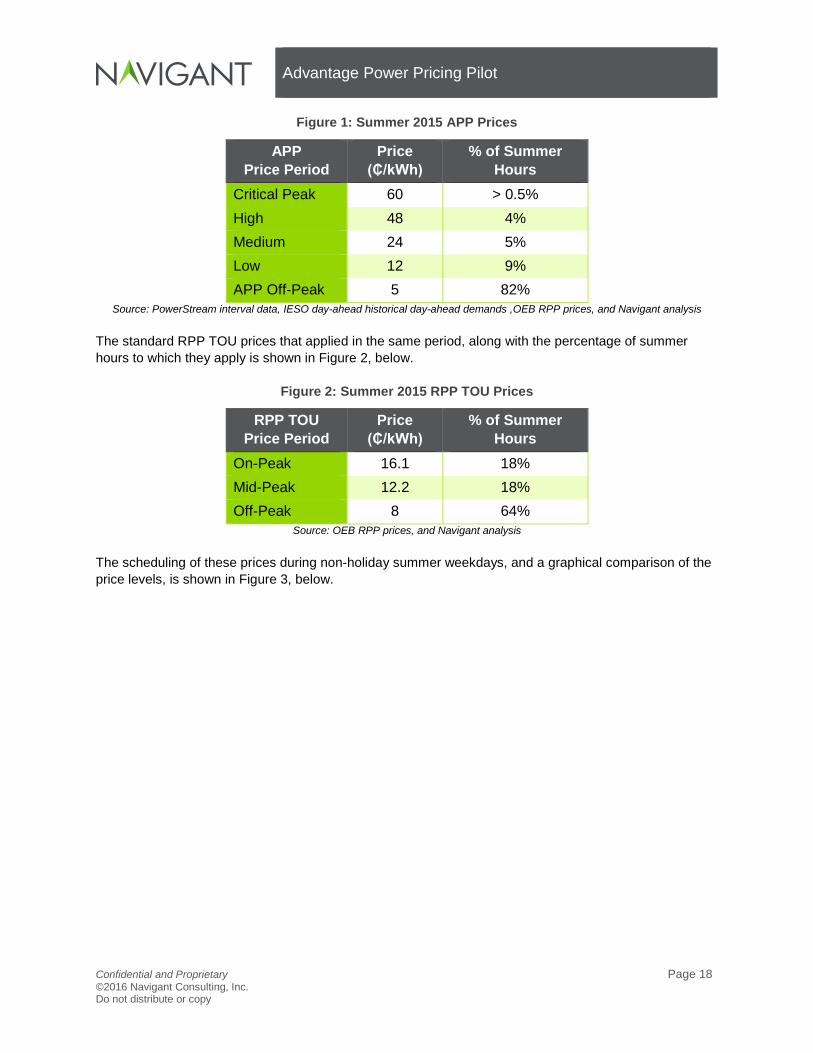
Figure 1: Summer 2015 APP Prices
APP Price Period
Price (₵/kWh)
% of Summer Hours
Critical Peak 60 > 0.5% High 48 4% Medium 24 5% Low 12 9% APP Off-Peak 5 82%
Source: PowerStream interval data, IESO day-ahead historical day-ahead demands ,OEB RPP prices, and Navigant analysis The standard RPP TOU prices that applied in the same period, along with the percentage of summer hours to which they apply is shown in Figure 2, below.
Figure 2: Summer 2015 RPP TOU Prices
RPP TOU Price Period
Price (₵/kWh)
% of Summer Hours
On-Peak 16.1 18% Mid-Peak 12.2 18% Off-Peak 8 64%
Source: OEB RPP prices, and Navigant analysis The scheduling of these prices during non-holiday summer weekdays, and a graphical comparison of the price levels, is shown in Figure 3, below.

Advantage Power Pricing Pilot
Confidential and Proprietary Page 19 ©2016 Navigant Consulting, Inc. Do not distribute or copy
Figure 3: Comparison of RPP TOU and APP Prices and Scheduling
Source: PowerStream interval data, IESO day-ahead historical day-ahead demands ,OEB RPP prices, and Navigant analysis
1.1.3 APP Technology
To help them respond to the APP price signal, participants were provided with an Energate Foundation, free of charge. The Foundation is a bundle of enabling technologies that consists of a “smart” thermostat10 and an online portal (“Home Energy Gateway”). The bundle automatically controls the participant’s thermostat in response to price changes according to customer-set preferences. In addition to Foundation-automated response, participants receive day-ahead price signals by phone, email or SMS to encourage them to undertake incremental actions to reduce electricity consumption during the APP window.
1.1.4 APP Participants
APP participants were recruited beginning in May of 2015. PowerStream advertised the program using direct mail, bill inserts and email alerts. Only participants deemed eligible for peakSaver PLUS enrollment were considered for enrollment into the APP.
10 The Energate thermostat is not a “learning” thermostat. It is a two-way communicating thermostat with an advanced display that can be controlled remotely via the online portal or a mobile device app.
Advantage Power Pricing Pilot
Confidential and Proprietary Page 20 ©2016 Navigant Consulting, Inc. Do not distribute or copy
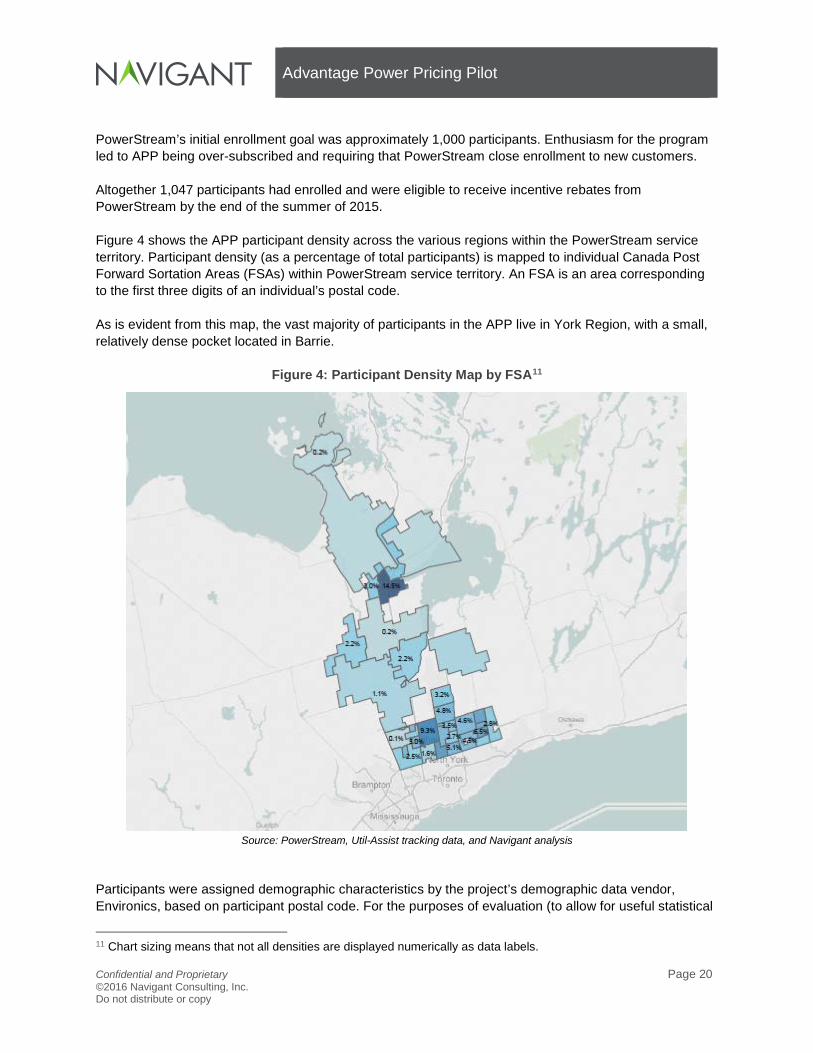
PowerStream’s initial enrollment goal was approximately 1,000 participants. Enthusiasm for the program led to APP being over-subscribed and requiring that PowerStream close enrollment to new customers. Altogether 1,047 participants had enrolled and were eligible to receive incentive rebates from PowerStream by the end of the summer of 2015. Figure 4 shows the APP participant density across the various regions within the PowerStream service territory. Participant density (as a percentage of total participants) is mapped to individual Canada Post Forward Sortation Areas (FSAs) within PowerStream service territory. An FSA is an area corresponding to the first three digits of an individual’s postal code. As is evident from this map, the vast majority of participants in the APP live in York Region, with a small, relatively dense pocket located in Barrie.
Figure 4: Participant Density Map by FSA11
Source: PowerStream, Util-Assist tracking data, and Navigant analysis
Participants were assigned demographic characteristics by the project’s demographic data vendor, Environics, based on participant postal code. For the purposes of evaluation (to allow for useful statistical
11 Chart sizing means that not all densities are displayed numerically as data labels.

Advantage Power Pricing Pilot
Confidential and Proprietary Page 21 ©2016 Navigant Consulting, Inc. Do not distribute or copy
comparisons across groups) these highly granular demographic features were aggregated into four mutually exclusive groups. The distribution of participants used in the impact estimation sample by demographic is shown Figure 5, below.
Figure 5: Demographic Distribution of APP Participants
Source: PowerStream, Environics, and Navigant analysis
1.1.5 Summer 2015 APP Events
The APP price to be deployed for any given APP price period was determined through a comparison of the day-ahead IESO forecast of system demand during the APP price period with a set of threshold values established during the program design phase. Thresholds were set (and subsequently adjusted) such that the approximate goal number of APP price level days were met. The distribution of APP prices across the summer is illustrated in Figure 6, below. As can be seen in this plot, most APP days in the “shoulder” part of the summer were Low price days, with the High price days clustered together in heat waves in late July and very early September. Critical peak events are flagged by the purple boxes. Note that the first Critical peak event (in late May) was intended principally as a test event.

Advantage Power Pricing Pilot
Confidential and Proprietary Page 22 ©2016 Navigant Consulting, Inc. Do not distribute or copy
Figure 6: APP Price Level Days in Summer of 2015
Source: PowerStream and Navigant analysis
Figure 7, below, provides the final distribution of summer 2015 hours across all five of the different APP price periods. This may be compared to Figure 1 which provides the anticipated distribution of hours used to set the APP prices.
Figure 7: Final Distribution of Summer 2015 Hours
APP Price Period
% of Summer Hours
Critical Peak 0.4% High 3% Medium 5% Low 9% APP Off-Peak 83%
Source: PowerStream and Navigant analysis Critical peak events were called on the following days:
• May 29: 3pm – 5pm
• July 28: 5pm – 7pm
• July 29: 3pm – 7pm
• August 17: 2pm – 6pm
• September 1: 3pm – 6pm

Advantage Power Pricing Pilot
Confidential and Proprietary Page 23 ©2016 Navigant Consulting, Inc. Do not distribute or copy
1.2 Objectives of the Evaluation
This section of Chapter 1 is divided into two sub-sections. The first outlines the objectives of the impact evaluation, the second outlines the objectives of the process evaluation.
1.2.1 Impact Evaluation Objectives
The objectives of the impact evaluation were to estimate:
1. The average impact (kW/participant) in each hour of the APP period, in the pre-cooling period, and in the snapback period immediately following the APP period by:
o APP price level (“Critical Peak”, “HIGH”, “MEDIUM”, “LOW”) o Participant conservation setting group o Demographic group.
2. The average event period impact (kW/participant) by: o APP price level (“Critical Peak”, “HIGH”, “MEDIUM”, “LOW”) o Participant conservation setting group o Demographic group.
3. The average impact (kW/participant) on: o The single highest Ontario demand hour of the summer of 2015 (5pm – 6pm EPT, July
28) o The peak hours of each of the days in summer of 2015 when Ontario system demand
was highest: 5pm – 6pm EPT, July 28 5pm – 6pm EPT, July 29 5pm – 6pm EPT, August 17 5pm – 6pm EPT, September 2 6pm – 7pm EPT, September 8
4. The average historical seasonal energy impact of participation (kWh/participant for summer 2015) 5. The effect of seasonal fatigue. Is there a statistically and practically significant decay in the
aggressiveness of comfort settings selected by participants over the course of the summer?
1.2.2 Process Evaluation Objectives
The objectives of the process evaluation were to assess:
1. Participant satisfaction with the initiative, technology, and its benefits; 2. Customer behaviour change brought on through participation in the initiative; 3. Customer motivations for participating; 4. Participant demographics and characteristics; and, 5. What enhancements could be incorporated into the current offering that could increase the
chances of program success for a wider program deployment.

Advantage Power Pricing Pilot
Confidential and Proprietary Page 24 ©2016 Navigant Consulting, Inc. Do not distribute or copy
2. EVALUATION APPROACH This chapter describes the analytic approaches deployed by Navigant to complete the process and impact evaluation. This chapter is divided into two sections. The first describes Navigant’s approach to estimating program impacts, and the second describes Navigant’s approach to the process evaluation.
2.1 Impact Evaluation
Impacts were estimated using hourly AMI from participants and from over 100,000 eligible non-participants over a three year period (2013, 2014 and 2015). This section of Chapter 2 provides a description of the analytic approach used. It is divided into four sub-sections:
• Regression with Pre-Program Processing, This sub-section describes the theoretical basis for Navigant’s econometric approach.
• Control Group Selection. This sub-section describes the approach used to select the control group participants that were included in the analysis.
• Hourly Demand Impact Estimation. This sub-section describes the set of regression equations estimated by Navigant to deliver all of the estimated demand response impacts.
• Daily Energy Impact Estimation. This sub-section describes the set of regression equations estimated by Navigant to deliver all of the estimated energy savings impacts.
2.1.1 Regression with Pre-Program Processing
All of the estimated impacts reported in this evaluation were estimated using a technique known as regression with pre-program matching (RPPM) 12. RPPM is a quasi-experimental approach whereby a control group is selected by comparing participant pre-participation consumption with a large pool of non-participants and assigning to each participant the non-participant with the most similar pre-program period consumption patterns. This control customer is sometimes referred to as the given participant’s match, or matched control. In program evaluation, the basic logic of matching is to balance the participant and non-participant samples by matching on the exogenous covariates known to have a high correlation with the outcome variable. Doing so increases the efficiency of the estimate and reduces the potential for model specification bias. Formally, the argument is that if the outcome variable Y is independently distributed conditional on X and D (conditional independence assumption), where X is a set of exogenous variables and D is the program
12 See, for instance, Ho, Daniel E., Kosuke Imai, Gary King, and Elizabeth Stuart. 2007. Matching as nonparametric preprocessing for reducing model dependence in parametric causal inference. Political Analysis 15(3): 199-236. Abadie, A. and G.W. Imbens. 2011. “Bias-Corrected Matching Estimators for Average Treatment Effects”. Journal of Business and Economic Statistics 29(1):1-11.

Advantage Power Pricing Pilot
Confidential and Proprietary Page 25 ©2016 Navigant Consulting, Inc. Do not distribute or copy
variable, then the analyst can gain some power in the estimate of savings and reduce potential model specification bias by assuring that the distribution of X is the same for treatment and control observations. Regression analysis is used to control for remaining non-program differences between participants and their matches. In this context, the development of a matched control group is viewed as a useful “pre-processing” step in a regression analysis to assure that the distributions of the covariates (i.e., the explanatory variables on which the output variable depends) for the treatment group are the same as those for the comparison group that provides the baseline measure of the output variable. Typically the control variables with the highest correlation with a customer’s energy use during the evaluation period –and thus, the primary variables for matching –are the customer’s energy use in a similar period in the past. A recent report authored at Lawrence Berkeley National Laboratory cites the RPPM (sometimes referred to as “matched control group” or MCG method) method as a reasonable alternative to establishing baseline conditions when the “gold standard” of program evaluations, a randomized control trial (RCT), is not an option.13 The RPPM method is now common in the economics literature—and the energy industry—for program evaluations conducted with observational, rather than experimental, data.14
2.1.2 Control Group Selection
In order to select the control group PowerStream provided Navigant with hourly AMI data for participants and for over 100,000 eligible non-participants extending from May 2013 through until October 2015. Initially Navigant had planned to do full hourly matching, that is compare each participant’s complete set of hourly data in the matching period summer (2013 in this case, see below for more details) to each potential control customer’s hourly values in the same period. This proved to be computationally impractical – it was estimated that to do so would require 100% of Navigant’s SQL Energy server resources for over two weeks. Instead, Navigant established a set of fifteen day types, and compared participant and non-participant average hourly loads on those fifteen days. So, rather than comparing a vector of 4,416 values (184 summer days times 24 hours) for each participant and non-participant, the comparison was between vectors of 360 values (15 day-types times 24 hours). The matching period was divided into three two-month periods (May/June, July/August, September/October). Five day types were applied to each period. Four of these day-types were assigned to non-holiday weekdays where the total cooling degree hours (CDH) met certain criteria (see Figure 8 for the criteria), and the fifth was applied to all holidays and weekends.
13 State and Local Energy Efficiency Action Network. 2012. Evaluation, Measurement and Verification (EM&V) of Residential Behavior-Based Energy Efficiency Programs: Issues and Recommendations. Prepared by A. Todd, E. Stuart, S. Schiller, and C. Goldman, Lawrence Berkeley National Laboratory. 14 See, for instance, Cameron, A. Colin, and P.K. Trivedi, Microeconometrics: Methods and Applications, Cambridge University Press, 2005.

Advantage Power Pricing Pilot
Confidential and Proprietary Page 26 ©2016 Navigant Consulting, Inc. Do not distribute or copy
Figure 8: Day-Type CDH Thresholds
Day Type Total CDH Thresholds
Day Type Period A: May/June Period B: July/Aug Period C: Sept/Oct
Wee
kday
s 1 >= 77 >= 177 >= 120 2 45 to 77 97 to 177 31 to 120 3 7 to 45 37 to 97 0 to 31 4 0 to 7 0 to 37 0
Weekends/ Holidays 5 All Days
Source: Environment Canada weather data and Navigant analysis The weather data thresholds were selected based on the observed weather in 2015 such that for each period (May/June, etc.) 10% of the non-holiday weekdays were day type 1, 25% were day type 2, 30% were day type 3 and the remaining 35% were day type 4. These day types thresholds were applied to the matching period data15, and participant and interval data were then averaged by day-type and hour. With this complete, a match (with replacement) was selected for each participant based on minimizing the sum of squared differences between each participant’s matching period data series and all of the non-participants’. Only non-participants with a complete series of summer data were included in the matching algorithm. Navigant used the summer of 2013 as the matching period. This year was used (instead of 2014) based on the observation that in some cases there existed no days in the summer of 2014 that matched the CDH thresholds of some of the 2015-selected day-types; days were simply hotter in 2013 and 2015 than in 2014. The 2014 data (not used for matching) were used for match validation and the set of average hourly demands by day-type for each customer in 201416 was included in the regression (see below) to correct for any remaining difference between the participants and controls. This approach was used to select the 100 best matches for each participant. The control customer actually selected to be the participant match was the best matched non-participant from the same demographic group. Customer demographic groupings were provided by the project’s demographic analysis vendor, Environics. The names provided by Environics for the four demographic segments are:
• Affluent Older Families
• Asian Families
• Middle Aged Families
• Multi-Ethnic Families
15 Note that the matching period distribution of days meeting the various day-type criteria did not necessarily match that of the 2015 summer used to establish the weather thresholds. 16 Or 2013 where no 2014 day-type existed.

Advantage Power Pricing Pilot
Confidential and Proprietary Page 27 ©2016 Navigant Consulting, Inc. Do not distribute or copy
Environics’ demographic data, which is developed from the Canadian population,provides a much more granular breakdown of customer demographics (as indicated by customer postal code) than suggested by the categories above, but in order to support the requirement that impacts be reported by demographic segment Navigant requested that Environics create aggregated demographic groups of approximately equal size.
2.1.3 Hourly Demand Impact Estimation
All demand impacts were estimated using a set of linear regressions. The models shown below were estimated separately for each unique combination of demographic segment and conservation setting – in all this equation was estimated 20 times. The conservation data provided by Energate is only weekly in frequency, so it is possible that participants included in (for example) a “Max Savings” regression could, at some point, have had another conservation setting during that week. The regression equation that delivered the estimated weekday impacts is:
( )
( )
( )
360
, 1, ,1
2 3
2, , 3, , ,1 1
3 3
4, , , , , ,1 1
3 6
5, 1 , , 6, , , , ,1 1
1
_ 2
_ 3
_
i t t d i t dd
w i t w w i t i t ww w
pc pr i t pc t pr t i tpr pc
h pr i t h t h pr pr i t i t h th pr h
y prekw Dt
APP AM APP EMA CDH AM
APP PCool PR EMA CDH
PR APP Hr PR APP EMA CDH Hr
α β
β β
β
β β
=
= =
= =
== =
= +
+ +
+
+ +
∑
∑ ∑
∑∑
∑∑ ( )
( )
( )
( )
( )
6
1
4
7, 2 , , ,3
6
8, 3 , , ,4
3 6
9, , , , ,1 1
16
10 , , ,1
4
_ _ 5
_ _ 6
8 _ _ 7
8
h pr i t i t t h th
h pr i t i t t h th
s pr pr i t i t s tpr s
i t c t i tc
PR APP EMA CDH CPP SB Hr
PR APP EMA CDH CPP SB Hr
PR APP EMA CDH APP SB
APP CPP
β
β
β
β ε
=
==
==
= =
=
+
+
+
+ +
∑
∑
∑
∑∑
∑
Where:
,i ty = Hourly consumption of customer i in hour of sample t.
tα = A time-wise fixed effect.
,i tprekw = The average 2014 (pre-participation) consumption of customer i on the hour of
the appropriate day-type (see discussion in section 2.1.2 above) observed in hour t
Advantage Power Pricing Pilot
Confidential and Proprietary Page 28 ©2016 Navigant Consulting, Inc. Do not distribute or copy
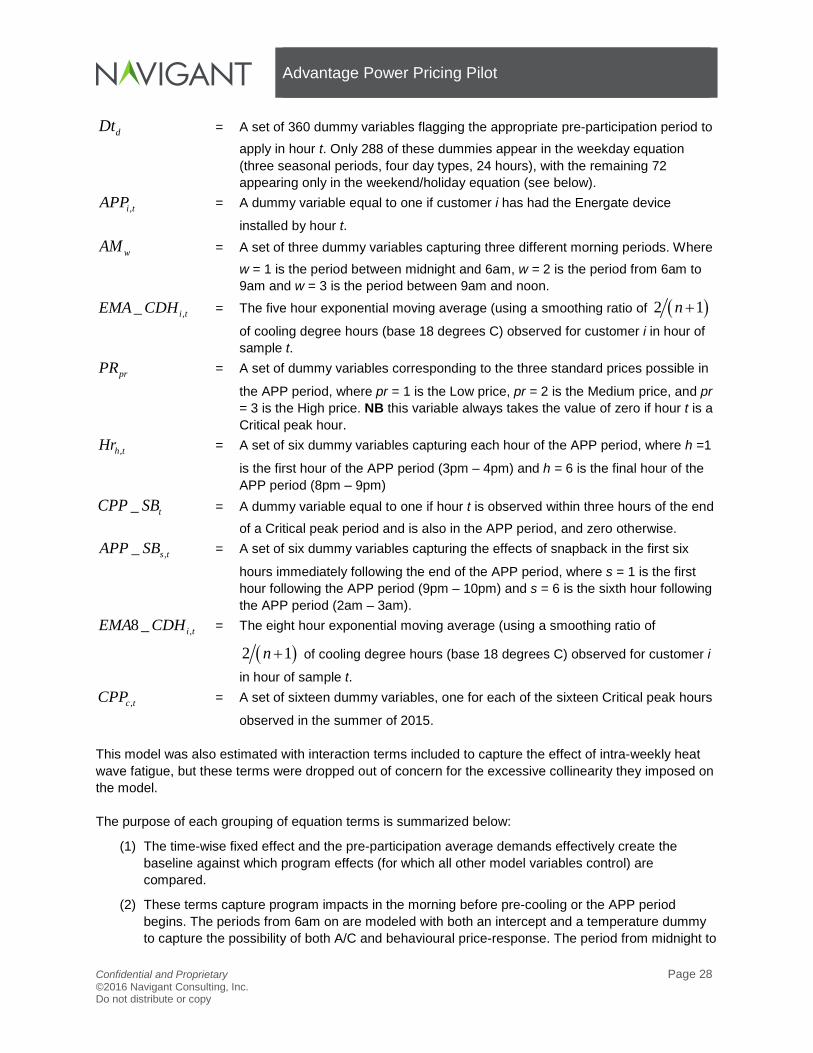
dDt = A set of 360 dummy variables flagging the appropriate pre-participation period to apply in hour t. Only 288 of these dummies appear in the weekday equation (three seasonal periods, four day types, 24 hours), with the remaining 72 appearing only in the weekend/holiday equation (see below).
,i tAPP = A dummy variable equal to one if customer i has had the Energate device
installed by hour t.
wAM = A set of three dummy variables capturing three different morning periods. Where w = 1 is the period between midnight and 6am, w = 2 is the period from 6am to 9am and w = 3 is the period between 9am and noon.
,_ i tEMA CDH = The five hour exponential moving average (using a smoothing ratio of ( )2 1n +
of cooling degree hours (base 18 degrees C) observed for customer i in hour of sample t.
prPR = A set of dummy variables corresponding to the three standard prices possible in
the APP period, where pr = 1 is the Low price, pr = 2 is the Medium price, and pr = 3 is the High price. NB this variable always takes the value of zero if hour t is a Critical peak hour.
,h tHr = A set of six dummy variables capturing each hour of the APP period, where h =1
is the first hour of the APP period (3pm – 4pm) and h = 6 is the final hour of the APP period (8pm – 9pm)
_ tCPP SB = A dummy variable equal to one if hour t is observed within three hours of the end of a Critical peak period and is also in the APP period, and zero otherwise.
,_ s tAPP SB = A set of six dummy variables capturing the effects of snapback in the first six
hours immediately following the end of the APP period, where s = 1 is the first hour following the APP period (9pm – 10pm) and s = 6 is the sixth hour following the APP period (2am – 3am).
,8 _ i tEMA CDH = The eight hour exponential moving average (using a smoothing ratio of
( )2 1n + of cooling degree hours (base 18 degrees C) observed for customer i
in hour of sample t.
,c tCPP = A set of sixteen dummy variables, one for each of the sixteen Critical peak hours
observed in the summer of 2015. This model was also estimated with interaction terms included to capture the effect of intra-weekly heat wave fatigue, but these terms were dropped out of concern for the excessive collinearity they imposed on the model. The purpose of each grouping of equation terms is summarized below:
(1) The time-wise fixed effect and the pre-participation average demands effectively create the baseline against which program effects (for which all other model variables control) are compared.
(2) These terms capture program impacts in the morning before pre-cooling or the APP period begins. The periods from 6am on are modeled with both an intercept and a temperature dummy to capture the possibility of both A/C and behavioural price-response. The period from midnight to
Advantage Power Pricing Pilot
Confidential and Proprietary Page 29 ©2016 Navigant Consulting, Inc. Do not distribute or copy
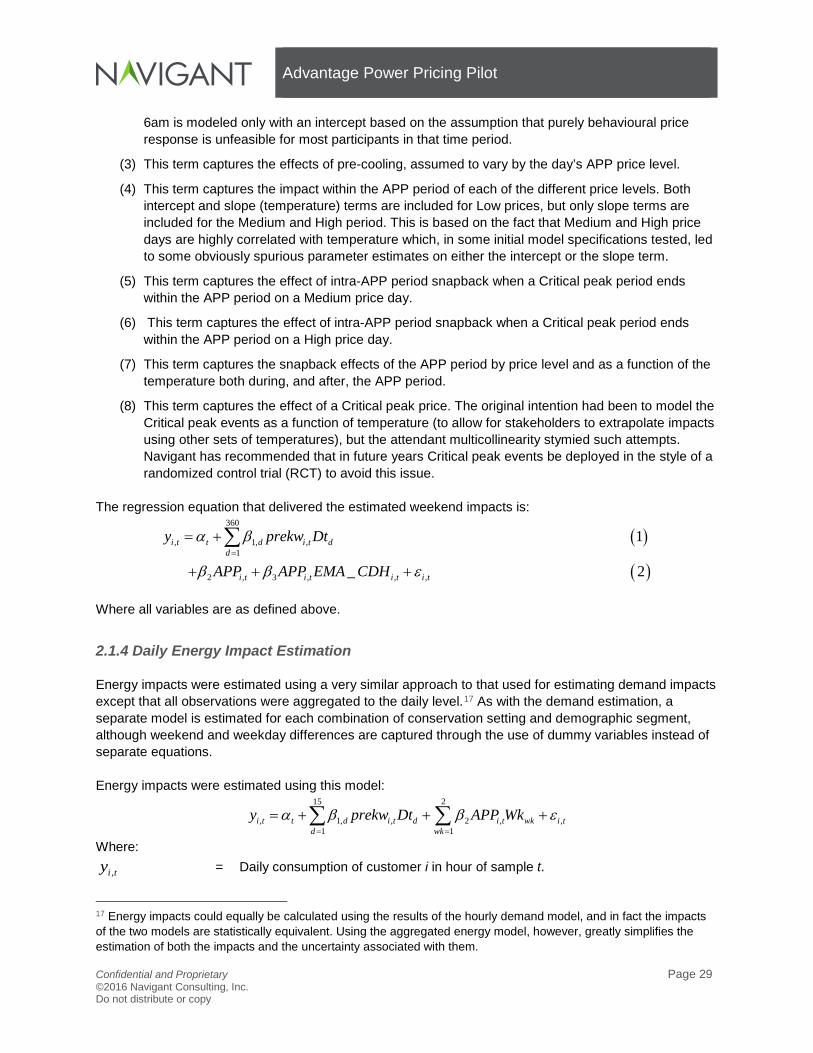
6am is modeled only with an intercept based on the assumption that purely behavioural price response is unfeasible for most participants in that time period.
(3) This term captures the effects of pre-cooling, assumed to vary by the day’s APP price level.
(4) This term captures the impact within the APP period of each of the different price levels. Both intercept and slope (temperature) terms are included for Low prices, but only slope terms are included for the Medium and High period. This is based on the fact that Medium and High price days are highly correlated with temperature which, in some initial model specifications tested, led to some obviously spurious parameter estimates on either the intercept or the slope term.
(5) This term captures the effect of intra-APP period snapback when a Critical peak period ends within the APP period on a Medium price day.
(6) This term captures the effect of intra-APP period snapback when a Critical peak period ends within the APP period on a High price day.
(7) This term captures the snapback effects of the APP period by price level and as a function of the temperature both during, and after, the APP period.
(8) This term captures the effect of a Critical peak price. The original intention had been to model the Critical peak events as a function of temperature (to allow for stakeholders to extrapolate impacts using other sets of temperatures), but the attendant multicollinearity stymied such attempts. Navigant has recommended that in future years Critical peak events be deployed in the style of a randomized control trial (RCT) to avoid this issue.
The regression equation that delivered the estimated weekend impacts is:
( )
( )
360
, 1, ,1
2 , 3 , , ,
1
_ 2
i t t d i t dd
i t i t i t i t
y prekw Dt
APP APP EMA CDH
α β
β β ε=
= +
+ + +
∑
Where all variables are as defined above.
2.1.4 Daily Energy Impact Estimation
Energy impacts were estimated using a very similar approach to that used for estimating demand impacts except that all observations were aggregated to the daily level.17 As with the demand estimation, a separate model is estimated for each combination of conservation setting and demographic segment, although weekend and weekday differences are captured through the use of dummy variables instead of separate equations. Energy impacts were estimated using this model:
15 2
, 1, , 2 , ,1 1
i t t d i t d i t wk i td wk
y prekw Dt APP Wkα β β ε= =
= + + +∑ ∑
Where:
,i ty = Daily consumption of customer i in hour of sample t.
17 Energy impacts could equally be calculated using the results of the hourly demand model, and in fact the impacts of the two models are statistically equivalent. Using the aggregated energy model, however, greatly simplifies the estimation of both the impacts and the uncertainty associated with them.
Advantage Power Pricing Pilot
Confidential and Proprietary Page 30 ©2016 Navigant Consulting, Inc. Do not distribute or copy
tα = A time-wise fixed effect.
,i tprekw = The average 2014 (pre-participation) consumption of customer i on the the
appropriate day-type (see discussion in section 2.1.2 above) observed on day t
dDt = A set of 15 dummy variables flagging the appropriate pre-participation period to apply on day t.
,i tAPP = A dummy variable equal to one if customer i has had the Energate device
installed by day t.
wkWk = A set of two dummy variables capturing whether a day is a non-holiday weekday or a weekend.
2.2 Process Evaluation Approach
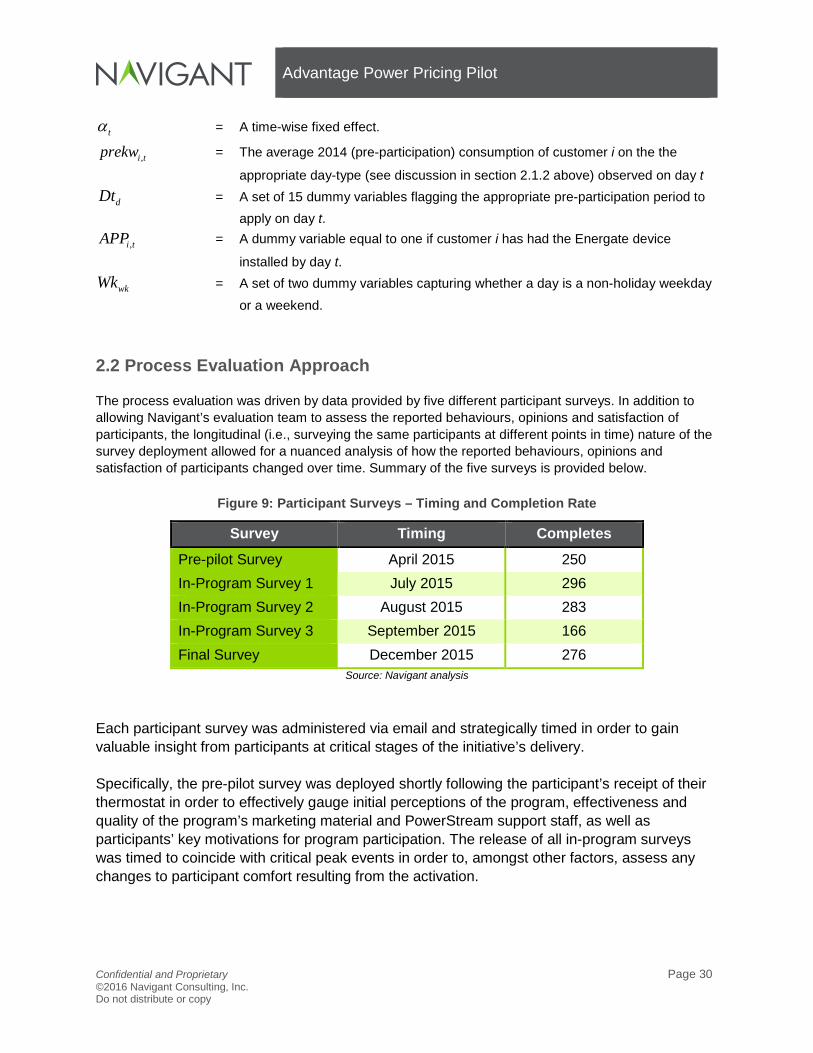
The process evaluation was driven by data provided by five different participant surveys. In addition to allowing Navigant’s evaluation team to assess the reported behaviours, opinions and satisfaction of participants, the longitudinal (i.e., surveying the same participants at different points in time) nature of the survey deployment allowed for a nuanced analysis of how the reported behaviours, opinions and satisfaction of participants changed over time. Summary of the five surveys is provided below.
Figure 9: Participant Surveys – Timing and Completion Rate
Survey Timing Completes Pre-pilot Survey April 2015 250 In-Program Survey 1 July 2015 296 In-Program Survey 2 August 2015 283 In-Program Survey 3 September 2015 166 Final Survey December 2015 276
Source: Navigant analysis Each participant survey was administered via email and strategically timed in order to gain valuable insight from participants at critical stages of the initiative’s delivery. Specifically, the pre-pilot survey was deployed shortly following the participant’s receipt of their thermostat in order to effectively gauge initial perceptions of the program, effectiveness and quality of the program’s marketing material and PowerStream support staff, as well as participants’ key motivations for program participation. The release of all in-program surveys was timed to coincide with critical peak events in order to, amongst other factors, assess any changes to participant comfort resulting from the activation.

Advantage Power Pricing Pilot
Confidential and Proprietary Page 31 ©2016 Navigant Consulting, Inc. Do not distribute or copy
Lastly, the final survey was administered at the conclusion of the program as a means to assess the value participants’ assigned to the program as well as the ability of the program’s technology – specifically the Energate thermostat – to influence their homes’ energy use. PowerStream has received approval and funding from the IESO to extend the Summer APP a further twelve months (until the end of October 2016). Consequently, a further set of surveys will be deployed during, and following, this additional period of program delivery. The results of these surveys will be valuable as they will allow Navigant to assess, and PowerStream to understand, how participant interactions with the program and its technology have evolved over a sustained period of time. Each of the five surveys administered to participants was developed in partnership with PowerStream and Energate. This collaborative approach was used to ensure all feedback desired from participants was collected. The feedback sought through each survey provided insight into participant attitudes and perceptions of the APP as well as the energy efficiency actions they had taken in response to various tools and information made available through the program. Figure 10, below demonstrates the various areas explored through each survey completed.
Figure 10: Process Evaluation Overview
Process Evaluation
Element Evaluation Goal
Participant satisfaction with the initiative, supportive technology, and its benefits
The pre-pilot survey was used to gauge participant expectations of the initiative and technology prior to engagement as well as the perceived value to the customer of participation in the pilot. The post-pilot survey was used to assess the performance of the initiative’s technology against expectations, overall satisfaction of the participant as well as to identify any positive or negative experiences. Positive and negative experiences were explored to provide PowerStream with actionable intelligence for improving the program’s design.
Behaviour change brought on through participation in the initiative.
This assessment provided insight into how the technology and/or program impacted the way participants use electricity. The information collected can impact the future value-proposition for the initiative, future customer engagement activities as well as provide an understanding of the energy efficiency gains the APP influenced.
Exploration of the motivations for participation and previous CDM program participation
This exploration was critical to understanding the various customer segments/types of customers attracted to the program. This assessment also confirmed whether or not the participants were a first- or multiple-time participant in CDM programs.

Advantage Power Pricing Pilot
Confidential and Proprietary Page 32 ©2016 Navigant Consulting, Inc. Do not distribute or copy
Process Evaluation
Element Evaluation Goal
Marketing and advertising effectiveness assessment
Specifically, this assessment identified how participants first heard of the program as well as the most influential factor(s) in their decision to participate.
Observed bill savings and information presentation.
This assessment determined the participants’ perceived financial benefit from participating against their expectations. As well, questions were asked regarding the format of the information presented to the participants on their energy use in order to determine effectiveness as well as areas for improvement.
Participant comfort
A critical component of all conservation and demand response programs that rely on changes to HVAC load is participant comfort. As such, the survey assessed the extent to which any perceived or real comfort-related issues impacted participants when critical peak pricing events were active.
Information material to the impact evaluation
Additional information required collection through the participant surveys in order to inform the program’s impact estimation. As such, this data was solicited through strategically designed questions within the survey instruments.

Advantage Power Pricing Pilot
Confidential and Proprietary Page 33 ©2016 Navigant Consulting, Inc. Do not distribute or copy
3. IMPACT FINDINGS This chapter presents the findings of Navigant’s evaluation of the impacts of the APP in the summer of 2015. Navigant’s key impact evaluation findings include:
1. The APP pilot delivers substantial demand reductions coincident with the IESO system peak. The average per participant demand impact during the IESO system peak hour on July 28 was 1.1 kW overall, and more than 1.5 kW for participants using the “Savings” or “Max Savings” conservation setting.
2. APP period demand reductions in High and Critical price periods are higher than those from many 50% A/C cycling programs at similar temperatures. High and Critical price event impacts tend to be approximately 30% greater at any given temperature than the 50% A/C cycling impacts reported for four such programs, including Ontario’s peakSaver.
3. Participants on average realized material commodity cost reductions due to program participation. On average, compared to what they would have paid absent the program, participants would have paid $74 more of commodity charges over the course of the summer of 2015 than they did when subject to the APP rate and program design.
4. APP period demand impacts are consistent across the APP period. Automated pre-cooling delivers APP impacts that remain reasonably consistent across all hours of the period, avoiding the classic asymmetry of impacts typically observed for set-point offset demand response programs.
5. On average participating in the APP increased customer energy consumption. Energy consumption increases are statistically significant only for participants selecting the “Max Comfort” conservation setting. It is, however, Navigant’s opinion that the overall average participant increase in consumption - though not statistically significant – is real and represents a rational economic response to program price signals.
6. Most participants did not change their conservation settings over the course of the summer. Nearly three quarters of participants employed the same conservation setting at the end of the summer as at the start of it. Approximately a fifth of participants used the “Max Comfort” setting. Given the very modest demand impacts attributable to this group, PowerStream may wish to consider withdrawing this option from the program.
The remainder of this chapter is divided into five sections:
1. Event Demand Impacts. This section provides the estimated average demand (kW) impacts by APP price level, and for each of the critical peak events, as well as hourly plots of average actual and counterfactual (baseline) participant demand.
2. System Peak Demand Impacts. This section provides the estimated average demand (kW) impacts during each of the summer 2015 system peak hours, as defined by the IESO.
3. Summer Energy Impacts. This section provides the estimated average seasonal energy (kWh) impacts for the summer of 2015.
4. Participant Cost Impacts. This section provides the estimated participant bill impacts (i.e., the total impact on customer electricity commodity costs of participating in the APP), as well as the distribution of rebates paid out by PowerStream.

Advantage Power Pricing Pilot
Confidential and Proprietary Page 34 ©2016 Navigant Consulting, Inc. Do not distribute or copy
5. Conservation Settings Over Time. This section describes how participant’s Energate conservation settings evolved during the summer.
3.1 Event Demand Impacts
This section of Chapter 3 is itself divided into three sub-sections:
• Overall Average Event Impacts. This sub-section provides and discusses the overall average APP period impacts by price level.
• Hourly Event Impacts. This sub-section provides and discusses a graphical overview of hourly event impacts, some numerical examples of those impacts in text. Complete average hourly impacts may be found in Appendix B, attached as a separate Excel spreadsheet document.
• Average Event Impacts by Sub-Group. This sub-section provides and discusses the average APP period impacts by demographic segment and conservation setting.
3.1.1 Overall Average Event Impacts
The average demand impact per participant during the APP period (3pm to 9pm, prevailing time), by price level is presented in Figure 11, below.
Figure 11: Average Program Impacts by Price
APP Price Mean Lower 90% CI*
Point Estimate (kW)
Mean Upper 90% CI*
Critical Peak Event 0.67 0.88 1.09 High Price Day 0.47 0.52 0.58 Medium Price Day 0.20 0.23 0.27 Low Price Day 0.03 0.06 0.10 *The average 90% confidence interval surrounding the estimate impacts in the given price period.
Source: PowerStream interval data, Util-Assist tracking data, Energate conservation setting data, Environment Canada weather data, and Navigant analysis
These impacts are the average across all of the relevant events and all participants. It is very important to bear in mind that the average estimated kW per participant impact for critical peak events includes the estimated impact from a “test” critical peak event called on May 29 (when the average outdoor temperature was only in the mid-20s). If this test event were to be dropped, the average critical peak event impact would be approximately 0.98 kW per participant. The degree to which average participant impacts per event vary with outdoor temperature may be observed in Figure 12. In this plot, the estimated impact (Y-axis) of each APP period (on days where the average event temperature was higher than 20 degrees Celsius) is plotted against the average outdoor temperature. Different colour dots capture the different price levels.

Advantage Power Pricing Pilot
Confidential and Proprietary Page 35 ©2016 Navigant Consulting, Inc. Do not distribute or copy
To compare the APP results with those of other residential DR programs, Navigant has also plotted the reported ex-post DR impacts for individual days from four residential A/C programs that employ 50% cycling strategies18. The variation in impacts, and the approximate relationship between temperature and average per-participant APP impacts can be clearly seen in Figure 12. For example, critical peak event impacts could be as high as 1.1 kW (average outdoor temperature, 32 degrees), or as low as 0.4 kW (average outdoor temperature, 25 degrees).
Figure 12: APP Period Impacts Compared to 50% Cycling Residential DR Impacts
Source: PowerStream interval data, Util-Assist tracking data, Energate conservation setting data, Environment Canada weather data, Duke Energy Progress, Ontario Power Authority, Pacific Gas & Electric, Southern California Edison and Navigant analysis
18 Many of these programs also employ other cycling strategies – e.g., 65%, 100%, etc. but often much less frequently than the 50% events. For consistency across programs, only the 50% cycling strategy impacts have been plotted.

Advantage Power Pricing Pilot
Confidential and Proprietary Page 36 ©2016 Navigant Consulting, Inc. Do not distribute or copy
The non-PowerStream data points on the plot above are drawn from: • Duke Energy Progress’ (formerly Progress Energy Carolinas) EnergyWise Home (program year
2011) • Ontario Power Authority’s peakSaver program (program years 2010, 2011, 2012 and 2013) • Pacific Gas and Electric’s SmartAC Program (program years 2012, 2013 and 2014) • Southern California Edison’s Summer Discount Program (program years 2013 and 2014)
3.1.2 Hourly Event Impacts
This sub-section of section 3.1 provides a graphical summary and discussion of hourly program impacts. The complete set of values corresponding to these graphs (and for the various sub-groups, non-APP days, etc.) may all be found in Appendix B in a separate Excel spreadsheet document. Figure 13, below shows the average actual and counterfactual (baseline) demand of all participants in the estimation sample on High price days. The actual observe hourly consumption (or average hourly demand) is shown by a solid black line. The dashed black line corresponds to the counterfactual. This is the baseline – what Navigant has estimated average participant demand would have been on these days had there been no APP program. The very finely dotted lines on either side of the counterfactual dashed line trace out the 90% confidence interval, and the thicker dotted line (above the rest, and read off the right axis) tracks the average hourly outdoor drybulb temperature in Celsius.
Figure 13: Average APP High Day
Source: PowerStream interval data, Util-Assist tracking data, Energate conservation setting data, Environment Canada weather
data, and Navigant analysis Three things are evident from this plot:
1. APP period event impacts are substantial, and consistent across the APP period.
2. Pre-cooling and post-event snapback impacts are also substantial.

Advantage Power Pricing Pilot
Confidential and Proprietary Page 37 ©2016 Navigant Consulting, Inc. Do not distribute or copy
3. In non-APP period hours (price – 4.9 cents/kWh) there is a modest, but clear increase in participant demand over what there would have been absent the program.
The average demand impacts across the APP period are reasonably consistent, with an average impact in the first and last hour of approximately 0.43 kW and a peak impact between 5pm and 6pm (prevailing time) of approximately 0.59 kW, reflecting the underlying baseline pattern of residential demand. From a DR evaluation perspective this consistent impact is an important finding, given the approach used to achieve the DR. Recall that the Energate thermostat provides automatic participant demand response by adjusting the thermostat set-point, and not by applying a cycling algorithm. The classic pattern of temperature offset DR is of relatively large impacts in the first hour of an event that decay (sometimes rapidly) over the course of the event, whereas DR approaches that use cycling tend to have much more consistent impacts across the event period. The decay in impacts typically observed with set-point offset-style DR relates to compressor run-time. In the first hour or so of an event most participants’ compressors are barely running, if at all due to the sudden change in thermostat set-point. As the homes gradually heat up, however, internal temperatures gradually approach, or reach the new set-point, at which point the compressor must run again in order to maintain the new set-point. The end result is the classic thermostat offset DR load profile – large impacts in the first hour that decay over the event. Cycling avoids this issue by constraining the thermostat run-time itself (rather than the set-point temperature). The trade-off is that snapback from A/C cycling tends to be much higher than from thermostat offset programs. In the case of APP, however, Energate’s pre-cooling algorithm effectively arrests DR impact decay and moderates snapback by pre-cooling participant homes in the three hours prior to the APP period. The trade-off in this case is the easily observed increase in average demand immediately prior to the event, which, for APP High price days was approximately 0.35 kW. The complete set of values underlying the plot above may be found in Appendix B an Excel spreadsheet. Figure 14, below, shows the average program impacts on Medium price days. As would be expected all impacts are more moderate than on High price days – DR impacts are lower, but so too are the pre-cooling and snapback impacts.

Advantage Power Pricing Pilot
Confidential and Proprietary Page 38 ©2016 Navigant Consulting, Inc. Do not distribute or copy
Figure 14: Average APP Medium Day19
Source: PowerStream interval data, Util-Assist tracking data, Energate conservation setting data, Environment Canada weather
data, and Navigant analysis Figure 15, below, shows the average program impacts on Low price days. Again, all impacts are lower than on the higher-priced APP days. Note in particular that pre-cooling has nearly no impact on average. This is in large part due to the fact that Low price days were, on average much cooler than the higher priced days.
19 Plot legend same as in Figure 13

Advantage Power Pricing Pilot
Confidential and Proprietary Page 39 ©2016 Navigant Consulting, Inc. Do not distribute or copy
Figure 15: Average APP Low Day20
Source: PowerStream interval data, Util-Assist tracking data, Energate conservation setting data, Environment Canada weather
data, and Navigant analysis Figure 16, below shows the average program impacts on one of the five days in the summer of 2015 on which a CPP event was called – the period of the CPP event is flagged by the purple columns. Unsurprisingly, given the temperature on this day, impacts (both DR and pre-cooling/snapback) are quite high. Interestingly, the incremental impacts of the CPP event appear, while material, relatively modest. The wider confidence interval around the estimated impacts during (an immediately following) the CPP event is principally due to the fact that CPP events were relatively infrequent, resulting in a higher variation to impact ratio than found for more common APP price periods (e.g., High price days). All of the plots shown in this sub-section may be found in Appendix A, in a separate PDF document. These show average impacts for the entire sample, as well as split out by each of the sub-groups. The values underlying these graphics may be found in Appendix B, in a separate Excel spreadsheet document.
20 Plot legend same as in Figure 13

Advantage Power Pricing Pilot
Confidential and Proprietary Page 40 ©2016 Navigant Consulting, Inc. Do not distribute or copy
Figure 16: Example Critical Peak Event (2015-07-28) 21
Source: PowerStream interval data, Util-Assist tracking data, Energate conservation setting data, Environment Canada weather
data, and Navigant analysis
3.1.3 Average Event Impacts by Sub-Group
This sub-section of section 3.1 provides the average estimated impact per participant by price level and by sub-group (conservation setting and demographic segment). Figure 17, below shows the average per participant kW impacts by conservation setting and APP price period, as well as the overall average.
Figure 17: Average Event Impact (kW) by Conservation Setting
Price Period: Critical Peak Event
High Price Day
Medium Price Day
Low Price Day
Con
serv
atio
n Se
tting
Max Comfort 0.20 0.13 0.01 -0.02 Comfort 1.02 0.45 0.16 0.02 Balanced 1.05 0.60 0.28 0.08 Savings 1.19 0.78 0.36 0.12 Max Savings 1.15 0.75 0.38 0.14 Average 0.88 0.52 0.23 0.06
Source: PowerStream interval data, Util-Assist tracking data, Energate conservation setting data, Environment Canada weather data, and Navigant analysis
21 Plot legend same as in Figure 13

Advantage Power Pricing Pilot
Confidential and Proprietary Page 41 ©2016 Navigant Consulting, Inc. Do not distribute or copy
Three things stand out in this table:
1. In most cases the direction of the impacts relative one another is as expected (more aggressive conservation settings yield higher savings, higher priced days yield higher savings).
2. Participants selecting “Max Savings” appear, during the highest priced periods, to be contributing less demand response than participants that have selected the less aggressive “Savings” conservation setting (e.g., 1.19 kW vs. 1.15 kW).
3. On low price APP events, participants with the “Max Comfort” setting appear to be increasing, rather than decreasing demand.
Regarding the third point listed above: in this case the estimated impacts for “Max Comfort” conservation setting participants on Medium and Low price days are not statistically significantly different from zero at the 90% level of confidence – given the uncertainty, the hypothesis that in fact there was no impact at all cannot be rejected. That being said, these remain the best available estimates of the impact of this sub-group at these price levels. Further, it seems very possible that, in fact, “Max Savings” participants could be increasing their demand during the Low price periods. Recall that the APP Low price (12 cents/kWh) was lower than the TOU On-Peak and Mid-Peak prices in force in the summer of 2015 (16.1 and 12.2 cents/kWh, respectively). Facing a discount, and with the selected conservation setting providing no automatic DR, an increase in demand during Low price periods by “Max Comfort” participants is exactly what economic theory would lead one to expect. The counter-intuitive finding flagged in point #2 above (that “Max Savings” impacts are lower than “Savings” impacts on Critical and High days) is substantially clarified by normalizing the average savings levels to participant baselines, that is expressing the impacts as a percentage of what demand would have been absent the program. The percentage impacts are shown in Figure 18 below.
Figure 18: Average Event Impact (%) by Conservation Setting
Price Period: Critical Peak Event
High Price Day
Medium Price Day
Low Price Day
Con
serv
atio
n Se
tting
Max Comfort 10% 7% 1% -2% Comfort 39% 22% 11% 2% Balanced 49% 34% 21% 8% Savings 55% 43% 27% 12% Max Savings 56% 42% 31% 14% Average 41% 29% 18% 6%
Source: PowerStream interval data, Util-Assist tracking data, Energate conservation setting data, Environment Canada weather data, and Navigant analysis
Shown from this perspective it becomes clear that at least part of the difference in impacts is due to a difference in the consumption profile of the “Max Savings” participants from the “Savings” participants; the “Max Savings” participants tend to be slightly more frugal consumers and thus have less demand to curtail.

Advantage Power Pricing Pilot
Confidential and Proprietary Page 42 ©2016 Navigant Consulting, Inc. Do not distribute or copy
Figure 19, below shows the average per participant kW impacts by demographic and APP price period, as well as the overall average.
Figure 19: Average Event Impact (kW) by Demographic
Price Period: Critical Peak Event
High Price Day
Medium Price Day
Low Price Day
Dem
ogra
phic
Affluent Older Families 0.93 0.56 0.25 0.05 Asian Families 0.96 0.60 0.25 0.07 Middle Aged Families 0.85 0.50 0.24 0.08 Multi-Ethnic Families 0.78 0.43 0.18 0.04 Average 0.88 0.52 0.23 0.06
Source: PowerStream interval data, Util-Assist tracking data, Energate conservation setting data, Environment Canada weather data, and Navigant analysis
Although the absolute Critical peak impacts are much higher for the “Affluent Older Families” group than for the “Multi-Ethnic Families” group, the relative impacts (i.e., as a percentage of baseline demand) are very similar across the “Affluent Older Families”, “Middle Aged Families” and “Multi-Ethnic Families” groups, as shown in Figure 20.
Figure 20: Average Event Impact (%) by Demographic
Price Period: Critical Peak Event
High Price Day
Medium Price Day
Low Price Day
Dem
ogra
phic
Affluent Older Families 39% 28% 17% 5% Asian Families 47% 35% 21% 8% Middle Aged Families 40% 29% 18% 8% Multi-Ethnic Families 39% 26% 15% 5% Average 41% 29% 18% 6%
Source: PowerStream interval data, Util-Assist tracking data, Energate conservation setting data, Environment Canada weather data, and Navigant analysis
3.2 System Peak Demand Impacts
In addition to average impacts by APP price period, Navigant has estimated the average program impact in the hours of the summer that were coincident with the Ontario electricity system peaks, as reported by the IESO. These average impacts per participant are shown in Figure 21, below.

Advantage Power Pricing Pilot
Confidential and Proprietary Page 43 ©2016 Navigant Consulting, Inc. Do not distribute or copy
Figure 21: Average Participant Impacts (kW) During System Peak Coincident Hours
Date Hour Ending (EPT):
Mean Lower 90% CI
Point Estimate (kW)
Mean Upper 90% CI
2015-07-28 18 0.92 1.13 1.34 2015-07-29 18 0.80 1.01 1.22 2015-08-17 18 0.79 1.00 1.21 2015-09-02 18 0.79 0.86 0.93 2015-09-08 19 0.55 0.61 0.66
Source: PowerStream interval data, Util-Assist tracking data, Energate conservation setting data, Environment Canada weather data, and Navigant analysis
Of the five system peak hours, the first three coincided with APP Critical peak events. The two peak hours in September were not Critical peak events but did take place during High price APP periods. Figure 22, below, shows the estimated impacts by conservation settings as well as overall. Note the very high DR impacts for “Savings” and “Max Savings” participants during the time of system peak on July 28.
Figure 22: Average Participant Impacts (kW) During System Peak Coincident Hours by Conservation Setting
Hour Name: 5CP Hour 1 5CP Hour 2 5CP Hour 3 5CP Hour 4 5CP Hour 5 Date: 2015-07-28 2015-07-29 2015-08-17 2015-09-02 2015-09-08 Hour Ending (EPT): 18 18 18 18 19
Con
serv
atio
n Se
tting
Max Comfort 0.31 0.16 0.29 0.19 0.01 Comfort 1.14 1.20 1.23 0.81 0.37 Balanced 1.28 1.23 1.14 0.99 0.71 Savings 1.74 1.32 1.29 1.33 0.96 Max Savings 1.54 1.33 1.32 1.23 1.04 Average 1.13 1.01 1.00 0.86 0.61
Source: PowerStream interval data, Util-Assist tracking data, Energate conservation setting data, Environment Canada weather data, and Navigant analysis
Figure 23, below, shows the estimated impacts by demographic group as well as overall.

Advantage Power Pricing Pilot
Confidential and Proprietary Page 44 ©2016 Navigant Consulting, Inc. Do not distribute or copy
Figure 23: Average Participant Impacts (kW) During System Peak Coincident Hours by Demographic Group
Hour Name: 5CP Hour 1 5CP Hour 2 5CP Hour 3 5CP Hour 4 5CP Hour 5
Date: 2015-07-28 2015-07-29 2015-08-17 2015-09-02 2015-09-08
Hour Ending (EPT): 18 18 18 18 19
Con
serv
atio
n Se
tting
Affluent Older Families 1.13 1.13 1.20 0.93 0.70 Asian Families 1.28 1.12 1.04 0.96 0.63 Middle Aged Families 1.03 0.96 0.92 0.83 0.55 Multi-Ethnic Families 1.11 0.83 0.83 0.73 0.54 Average 1.13 1.01 1.00 0.86 0.61
Source: PowerStream interval data, Util-Assist tracking data, Energate conservation setting data, Environment Canada weather data, and Navigant analysis
3.3 Summer Energy Impacts
Nearly all of the estimated energy impacts of the APP are not statistically significant at the 90% confidence level. A statistically non-significant result means that the hypothesis that the program has had no effect (on energy use) cannot be rejected at the selected level of confidence – the confidence interval that bounds the estimate straddles zero. Put more simply, it indicates that a very high degree of uncertainty as to whether the program has had any effect. A statistically non-significant result may be interpreted in one of two ways:
1. The program has had no impact. This is often an interpretation applied for purely behavioural types of treatment (e.g., in-home displays, online portals, etc.)
2. An impact exists, but is highly uncertain. Sufficient external evidence exists of a program effect (or the likelihood of a program effect) that the estimated point estimate of the impact, is reported as the best available (although imperfect) estimate of the program effect.
Figure 25, below shows the estimated average seasonal energy savings, by day type and in total. Savings are shown for the program overall, and by conservation setting. The only statistically significant estimated savings are indicated with an asterisk. Note that a negative estimate indicates an increase in consumption (i.e., negative savings).

Advantage Power Pricing Pilot
Confidential and Proprietary Page 45 ©2016 Navigant Consulting, Inc. Do not distribute or copy
Figure 24: Summer Energy Savings (kWh) by Conservation Setting
Day Type: Weekdays Weekends/ Holidays Total
Con
serv
atio
n Se
tting
Max Comfort -244 * -124 * -367 * Comfort 21 5 26 Balanced -72 -63 -134 Savings -118 -57 -174 Max Savings -102 -69 -170 Average -114 -73 -187
* Statistically significant at 90% confidence level Source: PowerStream interval data, Util-Assist tracking data, Energate conservation setting data, Environment Canada weather
data, and Navigant analysis Navigant’s interpretation of these results is that:
1. Participants selecting the “Max Comfort” setting have increased their total energy consumption as a result of their participation in the program (due to the substantially discounted rate all participants receive in most hours).
2. On average, participants as a whole have increased their energy consumption as a result of the program, but the magnitude of that increase is highly uncertain.
The result that “Max Comfort” participants have increase consumption is reasonable and intuitive. These participants have revealed, through their selection for the “Max Comfort” conservation setting, that they are disinclined to compromise their comfort in response to a price signal. The relative importance of comfort to these participants naturally suggests that receiving a steep discount in the APP Off-Peak hours (a rate of 4.9 cents/kW, for over 80% of summer hours) will lead them to increasing their overall level of consumption. Although the estimated energy savings for the other conservation settings groups are highly uncertain, two factors suggest that the most reasonable interpretation is that energy consumption has increased. Firstly, the point estimates of three of the four remaining conservation settings are reasonably consistent, and secondly the combined effect of the rate design and the enabling technology make this outcome (increased consumption) reasonable and intuitive. The net energy impact of the automated thermostat response should be approximately zero – energy reductions achieved during the APP period are compensated for by increases in consumption during the pre-cooling and snapback period. In all other hours, participants receive a substantial rate discount, which would be expected to lead (all else equal) to an increase in consumption. It is helpful to place the results shown above in the context of average baseline seasonal energy consumption. The percentage savings for each of the groups shown above is presented in Figure 25, below. On average participants increased consumption by 4.5%, with “Max Comfort” participants increasing their consumption by over 9%.

Advantage Power Pricing Pilot
Confidential and Proprietary Page 46 ©2016 Navigant Consulting, Inc. Do not distribute or copy
Figure 25: Summer Energy Savings (%) by Conservation Setting
Day Type: Weekdays Weekends/ Holidays Total
Con
serv
atio
n Se
tting
Max Comfort -9.4% * -9.7% * -9.4% * Comfort 0.7% 0.3% 0.6% Balanced -2.7% -4.7% -3.3% Savings -4.2% -4.2% -4.2% Max Savings -3.7% -5% -4% Average -4.1% -5.5% -4.5%
* Statistically significant at 90% confidence level Source: PowerStream interval data, Util-Assist tracking data, Energate conservation setting data, Environment Canada weather
data, and Navigant analysis Figure 26, below, shows the estimate energy savings by demographic group. As above, in most cases the increase in consumption is not statistically significant, with the sole exception being the weekend consumption of the “Affluent Older Families” demographic.
Figure 26: Summer Energy Savings (kWh) by Segment
Day Type: Weekdays Weekends/ Holidays Total
Dem
ogra
phic
Affluent Older Families -188 -116 * -303 Asian Families -12 -24 -35 Middle Aged Families -96 -63 -158 Multi-Ethnic Families -155 -87 -241 Average -114 -73 -187
* Statistically significant at 90% confidence level Source: PowerStream interval data, Util-Assist tracking data, Energate conservation setting data, Environment Canada weather
data, and Navigant analysis Figure 27 presents the estimated savings by demographic group as a percentage of baseline electricity consumption.

Advantage Power Pricing Pilot
Confidential and Proprietary Page 47 ©2016 Navigant Consulting, Inc. Do not distribute or copy
Figure 27: Summer Energy Savings (%) by Segment
Day Type: Weekdays Weekends/ Holidays Total
Dem
ogra
phic
Affluent Older Families -6% -7.7% * -6.4% Asian Families -0.4% -1.9% -0.9% Middle Aged Families -3.6% -4.9% -4% Multi-Ethnic Families -6% -6.8% -6.1% Average -4.1% -5.5% -4.5%
* Statistically significant at 90% confidence level Source: PowerStream interval data, Util-Assist tracking data, Energate conservation setting data, Environment Canada weather
data, and Navigant analysis
3.4 Participant Cost Impacts
This section of Chapter 3 provides the estimated program impacts on participant costs and is divided into two sub-sections:
• Commodity Cost Impacts. This sub-section provides the average estimated impact on participant electricity commodity costs, compared to what they would have been had they not participated in the program at all.
• Participant Rebates. This sub-section summarizes the rebates issued to APP participants. Rebates represent the difference between what participants actually paid in standard TOU rates for their summer 2015 consumption and the commodity costs imposed by the APP and tracked by shadow bills.
3.4.1 Commodity Cost Impacts
This sub-section provides the average estimated impact of the APP on participant commodity costs compared to what they would have paid had they not participated in the APP at all. These average commodity cost impacts are calculated by:
• Applying the APP prices to the actual consumption observed for the participants in the sample.
• Applying the standard TOU rate prices to counterfactual (baseline) consumption for all participants in the sample.
• Averaging these two values across the customer groups of interest (i.e., conservation setting and demographic group) by hour.
• Taking the difference of the seasonal total of the average values calculated above. This analysis represents a truer estimate of participant commodity cost benefits than an examination of the rebates (incentives) provided by PowerStream, since it is effectively a comparison of what those costs would have been without the program with the commodity costs imposed by the APP rate. That is, it
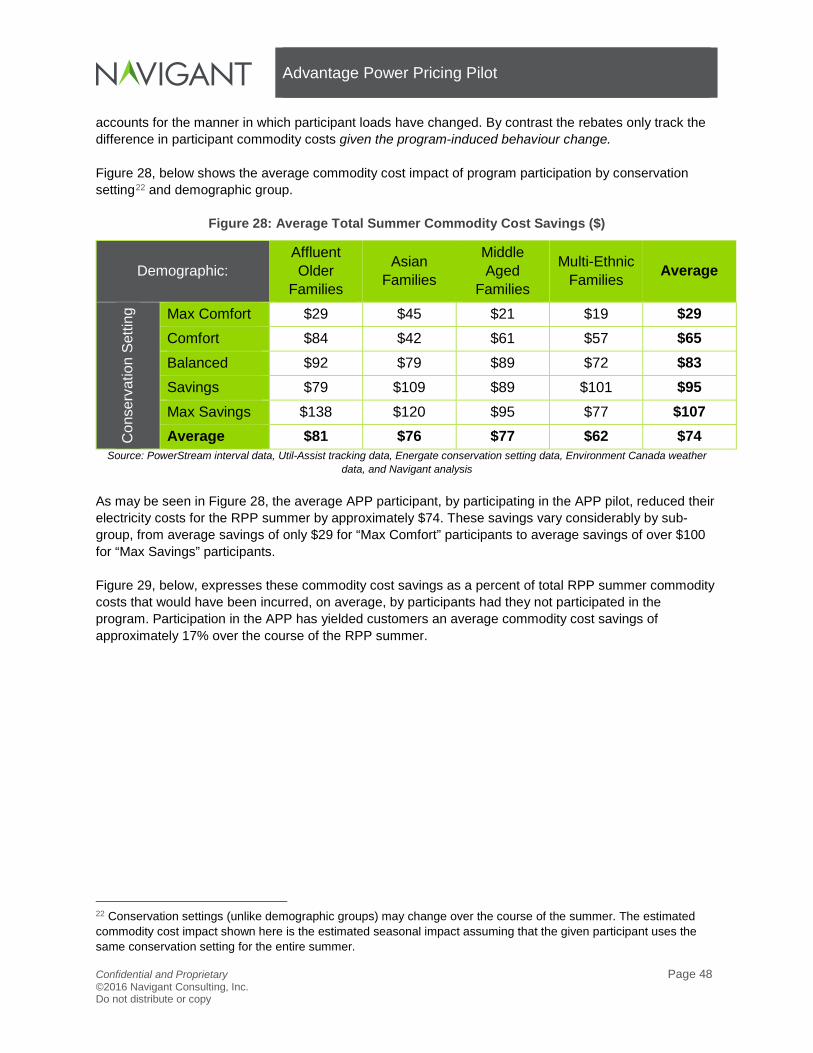
Advantage Power Pricing Pilot
Confidential and Proprietary Page 48 ©2016 Navigant Consulting, Inc. Do not distribute or copy
accounts for the manner in which participant loads have changed. By contrast the rebates only track the difference in participant commodity costs given the program-induced behaviour change. Figure 28, below shows the average commodity cost impact of program participation by conservation setting22 and demographic group.
Figure 28: Average Total Summer Commodity Cost Savings ($)
Demographic: Affluent Older
Families
Asian Families
Middle Aged
Families
Multi-Ethnic Families Average
Con
serv
atio
n Se
tting
Max Comfort $29 $45 $21 $19 $29 Comfort $84 $42 $61 $57 $65 Balanced $92 $79 $89 $72 $83 Savings $79 $109 $89 $101 $95 Max Savings $138 $120 $95 $77 $107 Average $81 $76 $77 $62 $74
Source: PowerStream interval data, Util-Assist tracking data, Energate conservation setting data, Environment Canada weather data, and Navigant analysis
As may be seen in Figure 28, the average APP participant, by participating in the APP pilot, reduced their electricity costs for the RPP summer by approximately $74. These savings vary considerably by sub-group, from average savings of only $29 for “Max Comfort” participants to average savings of over $100 for “Max Savings” participants. Figure 29, below, expresses these commodity cost savings as a percent of total RPP summer commodity costs that would have been incurred, on average, by participants had they not participated in the program. Participation in the APP has yielded customers an average commodity cost savings of approximately 17% over the course of the RPP summer.
22 Conservation settings (unlike demographic groups) may change over the course of the summer. The estimated commodity cost impact shown here is the estimated seasonal impact assuming that the given participant uses the same conservation setting for the entire summer.

Advantage Power Pricing Pilot
Confidential and Proprietary Page 49 ©2016 Navigant Consulting, Inc. Do not distribute or copy
Figure 29: Average Total Summer Commodity Cost Impact (%)
Demographic: Affluent Older
Families
Asian Families
Middle Aged Families
Multi-Ethnic Families Average
Con
serv
atio
n Se
tting
Max Comfort 6% 12% 5% 5% 7% Comfort 14% 13% 13% 14% 13% Balanced 18% 20% 20% 18% 19% Savings 18% 25% 21% 23% 22% Max Savings 27% 26% 25% 19% 25% Average 16% 19% 18% 15% 17%
Source: PowerStream interval data, Util-Assist tracking data, Energate conservation setting data, Environment Canada weather data, and Navigant analysis
Since the econometric approach used to estimate impacts relies on estimating average relationships (e.g., between demand and the APP price), the variation around individual participant impacts would make it inappropriate (and potentially) misleading to report the distribution of individual participant commodity cost savings.
3.4.2 Participant Rebates
This sub-section provides some summary statistics relating to the rebates (incentives) issued to APP participants for their participation in the program. Recall that program participants, while enrolled in the program, were required to continue to pay their standard monthly bill, calculated based on the existing RPP TOU rate. PowerStream also provided a shadow bill that tracked participants’ costs under the alternative APP rate. At the end of the summer period, if the total billing amount under the APP rate was less than the actuals paid by a participant, that participant received a rebate for the difference. When the APP rate would have resulted in a participant paying more than under the conventional RPP TOU rate, no rebate was issued and no penalty applied. Figure 30, below, reports the maximum, minimum and mean rebates calculated by PowerStream for all APP participants that were included in the econometric estimation sample. Negative values for rebates are shown to provide context only – participants with a calculated negative rebate would have received no rebate from PowerStream, nor been charged any incremental fee. Figure 30 reports summary statistics of actual rebates by conservation setting, but it must be understood that many of the participants whose rebates contribute to the distributions shown below may have used more than one conservation setting over the summer. In this case, the conservation setting to which each participant is assigned is that which they selected for the most days in the summer of 2015.

Advantage Power Pricing Pilot
Confidential and Proprietary Page 50 ©2016 Navigant Consulting, Inc. Do not distribute or copy
Figure 30: APP Summer Rebate Incentive Summary Statistics
Max Comfort Comfort Balanced Savings Max
Savings All
Participants
Max Rebate $357 $367 $328 $410 $283 $410 Mean Rebate $53 $76 $84 $95 $98 $80 Min Rebate -$80 -$18 -$10 $4 -$14 -$80
Source: PowerStream interval data, Util-Assist tracking data, Energate conservation setting data, Environment Canada weather data, and Navigant analysis
The most immediately striking thing about Figure 30 is the counter-intuitive maximum rebate received by a participant that most often used the “Max Savings” conservation setting. As may be observed from Figure 31 this appears principally due to the existence of outlier participants in each of the other conservation setting groups that achieved unusually high rebates. It is also important to bear in mind what, precisely the rebate metric is tracking. A participant with a high rebate is one for whom the differential in commodity costs under the APP and TOU rate – given their behavioural response to the pilot is very high. Put another way, a participant could achieve a substantial rebate by increasing their consumption considerably in the APP Off-Peak periods. This would substantially increase their commodity costs over what they would have been absent the program, while still being much lower than they would have been under the APP rate, thus delivering a substantial rebate. Consider the following (entirely hypothetical) example:
• APP participant X enrolls in program for no other reason than to reduce his electricity commodity costs between 11am and 3pm on non-holiday weekdays (APP Off-Peak period, but RPP TOU On-Peak period)
• Participant X increases his consumption from 11am to 3pm on non-holiday summer weekdays by 500 kWh, and otherwise makes no change to his consumption profile.
• The cost impacts for this participant are:
o Commodity cost impact: 16.1 cents23 x 500 kWh = $80.50 increase in participant commodity cost.
o APP Rebate: $80.50 - 4.9 cents24 x 500 kWh = $56 rebate from PowerStream Thus rebates are achieved both by motivated participants working hard to reduce their demand during times of system need, but also by participants that may (in effect) be gaming the pilot in order to avoid status quo RPP TOU charges. In all likelihood most participants fall on the spectrum between these two extremes, but this duality is a useful lens though which to examine the distribution of individual participant rebates by most-often-selected conservation setting shown in Figure 31, below. In particular, although not definitive, it seems overwhelmingly likely that participants most motivated to “game” the program will elect to use the “Max Comfort” conservation setting and those most motivated to
23 On-Peak RPP TOU rate, summer of 2015. 24 Off-Peak APP rate

Advantage Power Pricing Pilot
Confidential and Proprietary Page 51 ©2016 Navigant Consulting, Inc. Do not distribute or copy
make system-benefiting changes to their demand will elect to use the “Savings” or “Max Savings” conservation settings.
Figure 31: Distribution of APP Rebates by Conservation Setting
Source: PowerStream interval data, Util-Assist tracking data, Energate conservation setting data, Environment Canada weather
data, and Navigant analysis
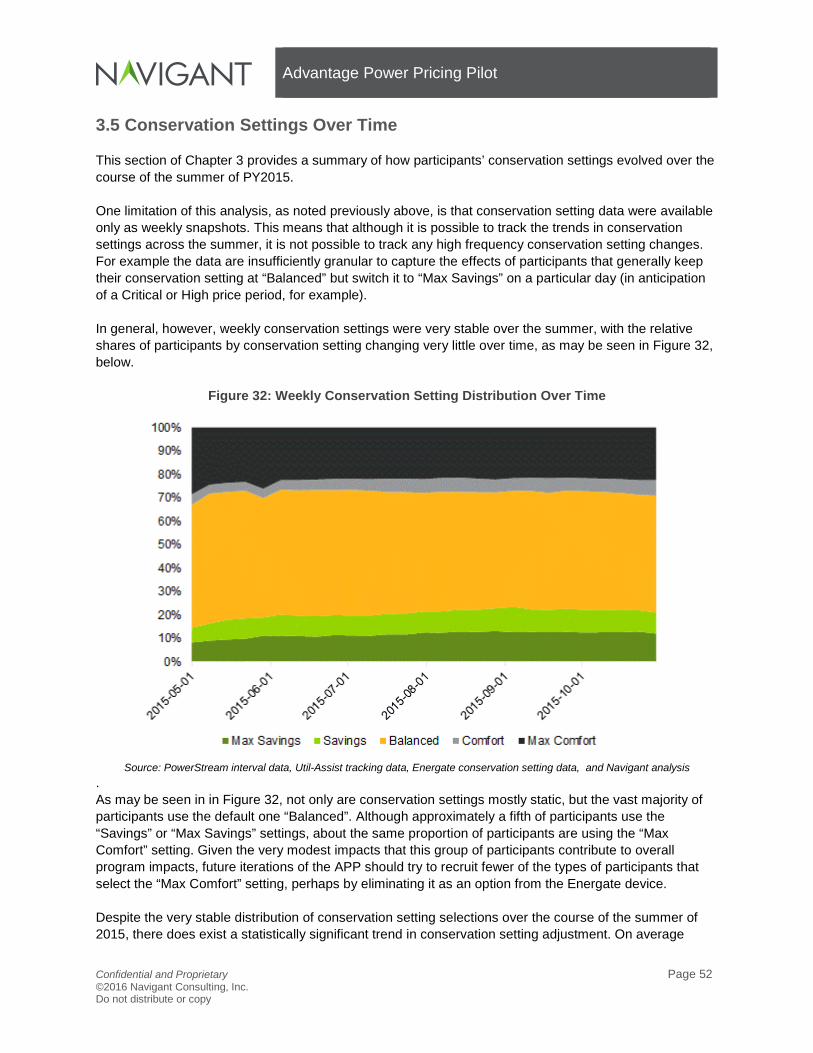
Advantage Power Pricing Pilot
Confidential and Proprietary Page 52 ©2016 Navigant Consulting, Inc. Do not distribute or copy
3.5 Conservation Settings Over Time
This section of Chapter 3 provides a summary of how participants’ conservation settings evolved over the course of the summer of PY2015. One limitation of this analysis, as noted previously above, is that conservation setting data were available only as weekly snapshots. This means that although it is possible to track the trends in conservation settings across the summer, it is not possible to track any high frequency conservation setting changes. For example the data are insufficiently granular to capture the effects of participants that generally keep their conservation setting at “Balanced” but switch it to “Max Savings” on a particular day (in anticipation of a Critical or High price period, for example). In general, however, weekly conservation settings were very stable over the summer, with the relative shares of participants by conservation setting changing very little over time, as may be seen in Figure 32, below.
Figure 32: Weekly Conservation Setting Distribution Over Time
Source: PowerStream interval data, Util-Assist tracking data, Energate conservation setting data, and Navigant analysis
. As may be seen in in Figure 32, not only are conservation settings mostly static, but the vast majority of participants use the default one “Balanced”. Although approximately a fifth of participants use the “Savings” or “Max Savings” settings, about the same proportion of participants are using the “Max Comfort” setting. Given the very modest impacts that this group of participants contribute to overall program impacts, future iterations of the APP should try to recruit fewer of the types of participants that select the “Max Comfort” setting, perhaps by eliminating it as an option from the Energate device. Despite the very stable distribution of conservation setting selections over the course of the summer of 2015, there does exist a statistically significant trend in conservation setting adjustment. On average

Advantage Power Pricing Pilot
Confidential and Proprietary Page 53 ©2016 Navigant Consulting, Inc. Do not distribute or copy
participants made their conservation settings more aggressive (e.g., moving from “Balanced” to “Savings”) rather than less aggressive over the summer, suggesting that instead of seasonal exhaustion disengaging participants, some other program factor is increasing participant program engagement over the course of the summer. Figure 33, below, shows the distribution of how participants changed their conservation settings between the first setting selected and the final one. A negative number on the X-axis indicates a group of participants that move to a less aggressive setting (e.g., “Balanced” to “Comfort”). A positive number indicates a move to a more aggressive setting. Thus, given there are only five conservation settings, this figure indicates (see far right column) that 3% of participants started with a “Max Comfort” setting and had moved to a “Max Savings” setting by the end of the summer.
Figure 33: Participant Conservation Setting Changes Over Time
Source: PowerStream interval data, Util-Assist tracking data, Energate conservation setting data, and Navigant analysis
Nearly three quarters of participants did not change their conservation setting, and, on average, those that did were more likely to select a more aggressive conservation strategy. This suggests that the gradual effect of the price signal, rather than exhausting participants, is in fact pushing them to try to achieve higher savings.
0.2% 1%5% 5%
71%
6% 8%2% 3%
0%
10%
20%
30%
40%
50%
60%
70%
80%
-4 -3 -2 -1 0 1 2 3 4
% o
f Par
ticip
ants
Change in Conservation Setting, May 1 to October 31
More Comfort No Change More Savings
Advantage Power Pricing Pilot
Confidential and Proprietary Page 54 ©2016 Navigant Consulting, Inc. Do not distribute or copy
4. PROCESS EVALUATION FINDINGS This chapter presents the findings of Navigant’s process evaluation of the APP pilot in the summer of 2015. Navigant’s key process evaluation findings include:
1. The majority of participants would recommend the program and technology to friends and family. 80% of engaged customers25 and 62% of larger group said that they were “very likely” to recommend the Energate thermostat and portal to others, and 73% of engaged and 67% of the larger group of customers said they would recommend the APP program.
2. The APP has been successful in penetrating a segment of PowerStream’s customer-base previously unengaged with utility-based energy efficiency efforts. Nearly 70% of APP participants indicated that they had not previously participated in a PowerStream offered CDM initiative.
3. The primary value proposition of the program which led to sign-ups was the perceived ability of the APP to help the customer reduce their electricity bills. A secondary reason for participation was the ability of the program to help the customer better understand the manner in which their homes consume energy.
4. Nearly 80% of respondents said that the risk-free aspect of the program was very important in their decision to enroll. Maintaining the risk-free guarantee that the customer’s commodity costs under the program cannot be higher than under standard RPP TOU rates for the first year of participation is likely to be essential for any successful wider program roll-out.
5. Engaged customers’ perception of the program improved over the course of the program. By the final survey, 56% of engaged customers said that the program had surpassed their initial expectations. In comparison, only 32% of customers in the larger pool said the program was better than expected, though satisfaction with the program was still generally high.
6. Satisfaction with the program increased over time. The longer customers participate in the program, the more they like it. The percentage who responded that the program had performed better than they expected started at 30% in the June survey and ended at 43% by the final survey.
7. Participant responses clearly demonstrate a high level of satisfaction with the enrollment process. In total, almost the entire participant-base (91%) said they found the enrollment process easy.
8. Participants are likely tech-savvy customers interested in trying out new devices and technologies. Half of the people who signed up said that their initial impression of the Energate thermostat was that it was a sophisticated technology that they wanted to experiment with in their home.
9. APP customers were proactive with regard to informing themselves about the program. In addition to reviewing the participant package provided by Powerstream, 57% of customers looked up program information on Powerstream’s website and 40% spoke with a representative before signing up. Four-fifths of participants said that the materials provided were sufficient for enrollment, and 86% felt fully educated on the program when they signed up.
25 Engaged customers are defined as those participants who completed all three monthly surveys and the final survey. The larger pool of customers are defined as those participants who responded to three or fewer surveys.
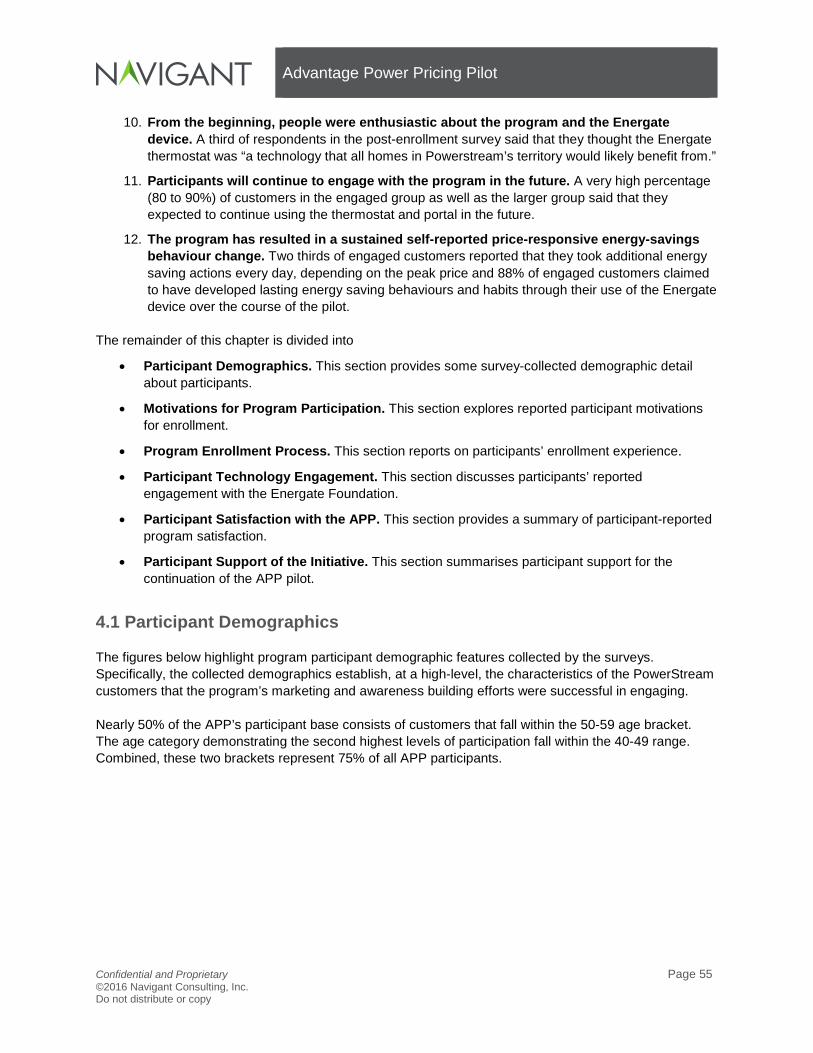
Advantage Power Pricing Pilot
Confidential and Proprietary Page 55 ©2016 Navigant Consulting, Inc. Do not distribute or copy
10. From the beginning, people were enthusiastic about the program and the Energate device. A third of respondents in the post-enrollment survey said that they thought the Energate thermostat was “a technology that all homes in Powerstream’s territory would likely benefit from.”
11. Participants will continue to engage with the program in the future. A very high percentage (80 to 90%) of customers in the engaged group as well as the larger group said that they expected to continue using the thermostat and portal in the future.
12. The program has resulted in a sustained self-reported price-responsive energy-savings behaviour change. Two thirds of engaged customers reported that they took additional energy saving actions every day, depending on the peak price and 88% of engaged customers claimed to have developed lasting energy saving behaviours and habits through their use of the Energate device over the course of the pilot.
The remainder of this chapter is divided into
• Participant Demographics. This section provides some survey-collected demographic detail about participants.
• Motivations for Program Participation. This section explores reported participant motivations for enrollment.
• Program Enrollment Process. This section reports on participants’ enrollment experience.
• Participant Technology Engagement. This section discusses participants’ reported engagement with the Energate Foundation.
• Participant Satisfaction with the APP. This section provides a summary of participant-reported program satisfaction.
• Participant Support of the Initiative. This section summarises participant support for the continuation of the APP pilot.
4.1 Participant Demographics
The figures below highlight program participant demographic features collected by the surveys. Specifically, the collected demographics establish, at a high-level, the characteristics of the PowerStream customers that the program’s marketing and awareness building efforts were successful in engaging. Nearly 50% of the APP’s participant base consists of customers that fall within the 50-59 age bracket. The age category demonstrating the second highest levels of participation fall within the 40-49 range. Combined, these two brackets represent 75% of all APP participants.
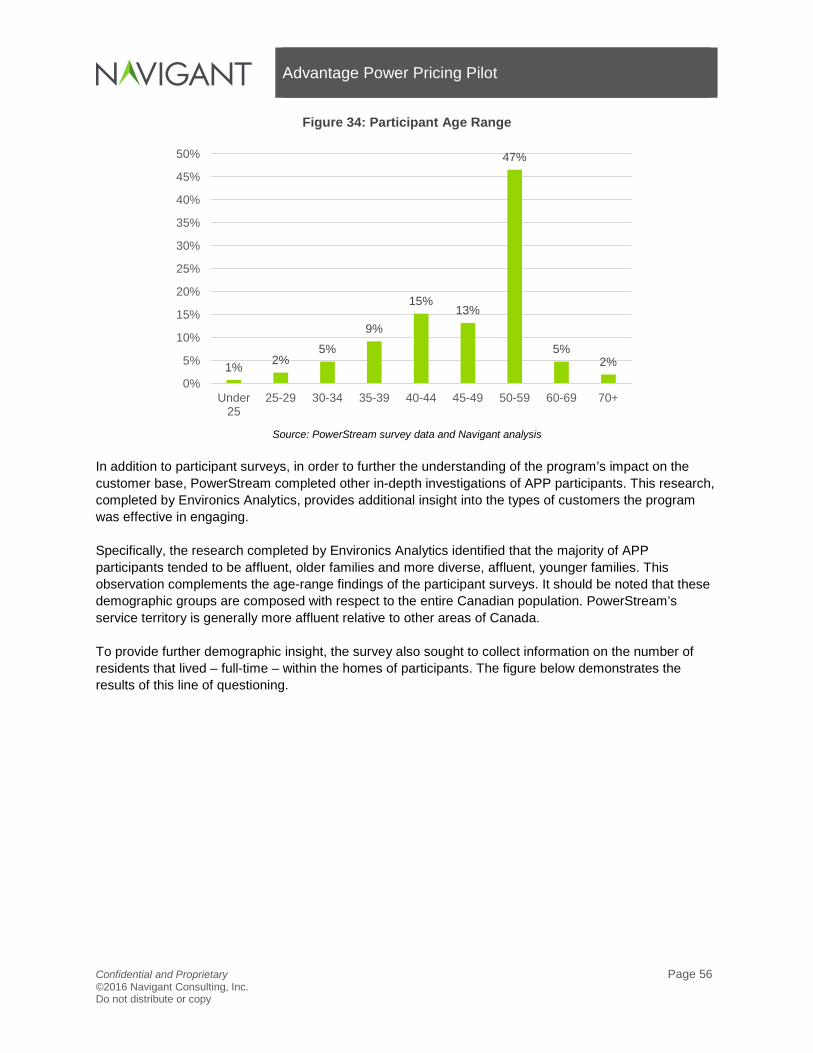
Advantage Power Pricing Pilot
Confidential and Proprietary Page 56 ©2016 Navigant Consulting, Inc. Do not distribute or copy
Figure 34: Participant Age Range
Source: PowerStream survey data and Navigant analysis
In addition to participant surveys, in order to further the understanding of the program’s impact on the customer base, PowerStream completed other in-depth investigations of APP participants. This research, completed by Environics Analytics, provides additional insight into the types of customers the program was effective in engaging. Specifically, the research completed by Environics Analytics identified that the majority of APP participants tended to be affluent, older families and more diverse, affluent, younger families. This observation complements the age-range findings of the participant surveys. It should be noted that these demographic groups are composed with respect to the entire Canadian population. PowerStream’s service territory is generally more affluent relative to other areas of Canada. To provide further demographic insight, the survey also sought to collect information on the number of residents that lived – full-time – within the homes of participants. The figure below demonstrates the results of this line of questioning.
1% 2%5%
9%
15%13%
47%
5%2%
0%
5%
10%
15%
20%
25%
30%
35%
40%
45%
50%
Under25
25-29 30-34 35-39 40-44 45-49 50-59 60-69 70+

Advantage Power Pricing Pilot
Confidential and Proprietary Page 57 ©2016 Navigant Consulting, Inc. Do not distribute or copy
Figure 35: Full-Time Residents in Participant Households
Source: PowerStream survey data and Navigant analysis
Figure 35 provides results in two streams: “Engaged Customers” and “All Customers”. Engaged Customers are defined as those participants who completed all three monthly surveys and the final survey. The larger pool of customers, or All Customers, are defined as those participants who responded to three or fewer surveys. Throughout this description of the findings of the process review, Navigant has demonstrated, where appropriate, participant feedback by these two streams. Nearly 70% of APP participants indicated that they had not previously participated in a PowerStream funded CDM initiative. Consequently, it can be concluded that APP has been successful in penetrating a segment of PowerStream’s customer-base previously unengaged with energy efficiency efforts. As a result of PowerStream’s success in reaching this market, it is plausible to suggest that a wider-scale roll-out of APP will provide an opportunity to further the reach and energy savings performance of more traditional CDM initiatives. Given the high levels of APP satisfaction participants have demonstrated, it is likely that this customer segment will now be more aware of and interested in participating in other PowerStream offered energy efficiency programs.
2%
44%
22%27%
0%5%6%
36%
20%
29%
7%2%
0%5%
10%15%20%25%30%35%40%45%50%
1 2 3 4 to 5 6 or more Prefer not tosay
Engaged Customers All Customers

Advantage Power Pricing Pilot
Confidential and Proprietary Page 58 ©2016 Navigant Consulting, Inc. Do not distribute or copy
Figure 36: Participants’ Previous Experience with CDM Programming
Source: PowerStream survey data and Navigant analysis
4.2 Motivations for Program Participation
As demonstrated in Figure 37, below, the primary value-proposition of the program which lead to sign-ups was the perceived ability of the APP to assist the customer save money on electricity bills as well as to better understand how their home consumes electricity.
Figure 37: Customer Motivations for Participation
Source: PowerStream survey data and Navigant analysis
69%
30%
0%
10%
20%
30%
40%
50%
60%
70%
80%
First program Not first program
90%
53%
35% 36%
23%
0%10%20%30%40%50%60%70%80%90%
100%
To save moneyon my
electricity bills
To betterunderstand my
electricityusage
Forenvironmentalreasons: it is
important to domy part
To receive theEnergate
thermostat
Other

Advantage Power Pricing Pilot
Confidential and Proprietary Page 59 ©2016 Navigant Consulting, Inc. Do not distribute or copy
A secondary, yet still important reason for participation was the availability of the Energate thermostat. In total, over a third of the participants said they signed up for this reason. Figure 38 below complements this finding. Specifically, when asked independently about the role of the thermostat in the customer’s decision to participate, 89% responded that this technology was either “very” or “somewhat important” in their choice to enroll. Only 11% of respondents said the thermostat was not a motivating factor in their decision to participate.
Figure 38: Importance of the Energate, Thermostat in Customer Decision to Participate
Source: PowerStream survey data and Navigant analysis
Participation appears to be materially driven by customer interest in trying out new devices and technologies. Half of the people who signed up said that their initial impression of the Energate thermostat was that it was a sophisticated technology that they wanted to experiment with in their home.
58%
31%
7%4%
0%
10%
20%
30%
40%
50%
60%
70%
Very important Somewhatimportant
Not very important Not at all important(did not impact my
decision toparticipate)

Advantage Power Pricing Pilot
Confidential and Proprietary Page 60 ©2016 Navigant Consulting, Inc. Do not distribute or copy
Figure 39: Initial Impressions of the Energate Thermostat
Source: PowerStream survey data and Navigant analysis
Strategically, in order to gain meaningful levels of APP participation, PowerStream incorporated a risk-free element into the initiative. Specifically, participants received a rebate from PowerStream if their commodity costs under the APP would have been lower than their actual TOU commodity costs, but were not penalized if their TOU commodity costs were higher than their APP shadow commodity costs. In total, 78% of respondents said that the risk-free aspect of the program was very important in their decision to sign up. Given the importance of this factor in participant decision making processes, PowerStream should consider how to limit customer exposure to the potential financial impacts of a CPP initiative – temporarily – if the program is rolled out on a wider basis.
67%
52%
12%
37%
5%
0%10%20%30%40%50%60%70%80%
A highlyvaluable toolfor monitoringand adjustingmy electricity
use
A sophisticatedtechnology Iwould enjoy
experimentingwith in my
home
A complicatedtechnology Iwill need to
furtherresearch in
order to fullyunderstand
A technologythat all homes
inPowerStream'sterritory wouldlikely benefit
from
Other

Advantage Power Pricing Pilot
Confidential and Proprietary Page 61 ©2016 Navigant Consulting, Inc. Do not distribute or copy
Figure 40: Importance of the Risk-Free Aspect in Gaining Participation
Source: PowerStream survey data and Navigant analysis
4.3 Program Enrollment Process
Participant responses clearly demonstrate a high level of satisfaction with the initiatives enrollment process as significant positive feedback was provided. In total, nearly all participants (91%) said they found the enrollment process easy.
Figure 41: Ease of Program Enrollment
Source: PowerStream survey data and Navigant analysis
78%
17%
2% 3%0%
10%
20%
30%
40%
50%
60%
70%
80%
90%
Very important Somewhatimportant
Not very important Not at all important(did not impact my
decision toparticipate)
45% 46%
6%2% 1%
0%
5%
10%
15%
20%
25%
30%
35%
40%
45%
50%
Strongly Agree Agree Neutral Disagree StronglyDisagree
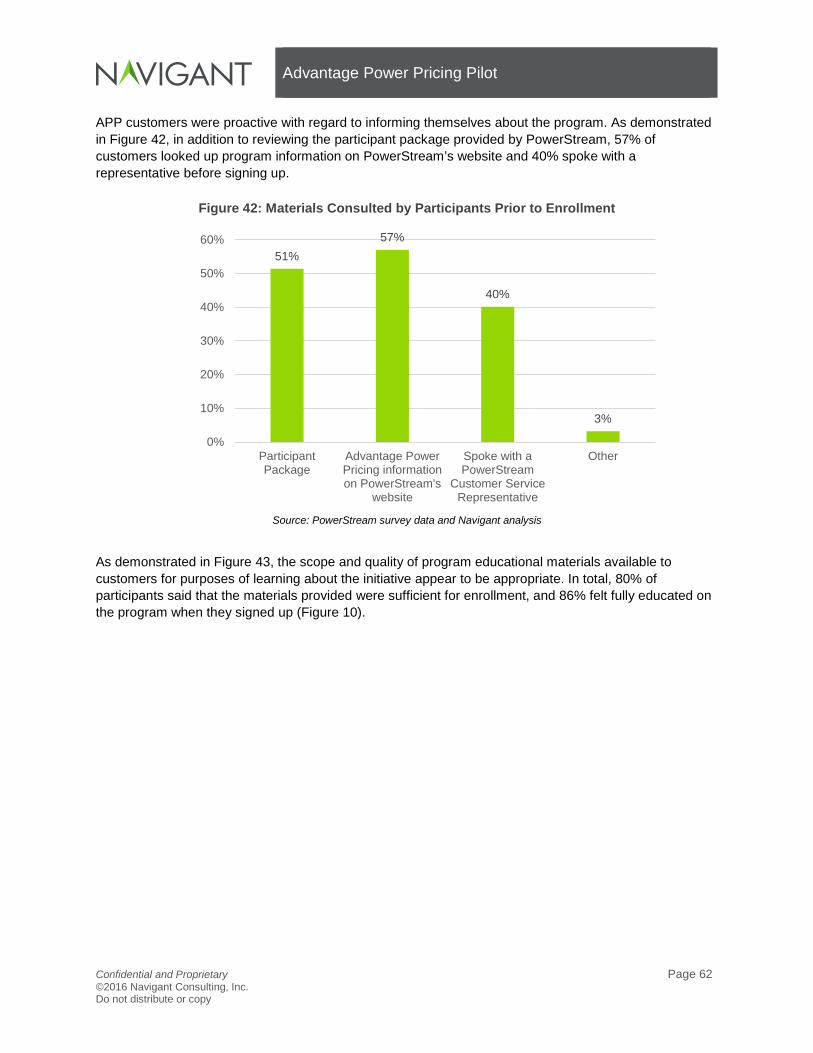
Advantage Power Pricing Pilot
Confidential and Proprietary Page 62 ©2016 Navigant Consulting, Inc. Do not distribute or copy
APP customers were proactive with regard to informing themselves about the program. As demonstrated in Figure 42, in addition to reviewing the participant package provided by PowerStream, 57% of customers looked up program information on PowerStream’s website and 40% spoke with a representative before signing up.
Figure 42: Materials Consulted by Participants Prior to Enrollment
Source: PowerStream survey data and Navigant analysis
As demonstrated in Figure 43, the scope and quality of program educational materials available to customers for purposes of learning about the initiative appear to be appropriate. In total, 80% of participants said that the materials provided were sufficient for enrollment, and 86% felt fully educated on the program when they signed up (Figure 10).
51%57%
40%
3%
0%
10%
20%
30%
40%
50%
60%
ParticipantPackage
Advantage PowerPricing informationon PowerStream's
website
Spoke with aPowerStream
Customer ServiceRepresentative
Other

Advantage Power Pricing Pilot
Confidential and Proprietary Page 63 ©2016 Navigant Consulting, Inc. Do not distribute or copy
Figure 43: Materials Sufficient for Enrollment
Source: PowerStream survey data and Navigant analysis
Figure 44: Participant Educated about Program Prior to Enrollment
Source: PowerStream survey data and Navigant analysis
Participants gave high satisfaction ratings to the installation technician as well as the installation process as a whole. Specifically, as demonstrated in Figure 45, 90% of APP participants indicated that they were happy overall with the technician and the installation. One area for improvement is technician education as 20% of the participant base said the technician wasn’t able to help them understand how the program works.
80%
20%
0%
10%
20%
30%
40%
50%
60%
70%
80%
90%
Yes No, I needed further information
86%
14%
0%
10%
20%
30%
40%
50%
60%
70%
80%
90%
Yes No

Advantage Power Pricing Pilot
Confidential and Proprietary Page 64 ©2016 Navigant Consulting, Inc. Do not distribute or copy
Figure 45: Experience with Installation Technician
Source: PowerStream survey data and Navigant analysis
4.4 Participant Technology Engagement
In order to gauge the participant ability with the Energate thermostat as well as the program’s pricing information to influence behaviour, Navigant’s process evaluation considered month-over-month survey results from highly engaged customers and compared them to the results of all participants. As demonstrated inFigure 46, all engaged customers viewed pricing information on a daily basis primarily through the thermostat or email (seeFigure 47).
8%
11%
21%
3%
4%
90%
88%
76%
95%
96%
0% 20% 40% 60% 80% 100% 120%
Overall, I was happy with the technicianand the installation process
The thermostat was working when thetechnician left
The technician was able to help informme about how Advantage Power
Pricing works.
The technician was professional andcourteous
The technician was on-time for theinstallation
Yes No

Advantage Power Pricing Pilot
Confidential and Proprietary Page 65 ©2016 Navigant Consulting, Inc. Do not distribute or copy
Figure 46: Frequency of Viewing Price Information
Source: PowerStream survey data and Navigant analysis
Figure 47: Methods Used for Viewing Price Information
Source: PowerStream survey data and Navigant analysis
100%
0% 0% 0% 0%
63%
18%11%
5% 0%0%
20%
40%
60%
80%
100%
120%
Once a day ormore
Every two orthree days
Once or twiceper week
Less than onceper week
I do not viewelectricity
pricinginformation
Engaged Customers All Customers
85%
24%
39%
24%
71%
7%2% 0%
84%
20%
34%
23%
67%
4%0% 2%
0%
10%
20%
30%
40%
50%
60%
70%
80%
90%
Engaged Customers All Customers

Advantage Power Pricing Pilot
Confidential and Proprietary Page 66 ©2016 Navigant Consulting, Inc. Do not distribute or copy
The pricing information viewed by participants resulted in participants adjusting their electricity consumption. As demonstrated in Figure 48, over half of both the engaged and all customer segments indicated that they took efficiency actions when a critical peak pricing period was active.
Figure 48: Actions Taken Based on Pricing Information
Source: PowerStream survey data and Navigant analysis
Although all customers indicated that they viewed pricing information regularly, as demonstrated in Figure 49, participants did not leverage their Energate thermostat as consistently. Consequently, it is reasonable to assume that a key success factor of the program was the varied mechanisms used to inform participants about daily electricity pricing.
85%
71%66%
5%0%
54%
40% 38%
5%1%
0%
10%
20%
30%
40%
50%
60%
70%
80%
90%
Yes. I takeadditional action
when a critical peakpricing period is
indicated.
Yes. I takeadditional actionwhen a high on-
peak pricing periodis indicated.
Yes. I take variousadditional actions
everyday dependingon peak price.
No. I do not takeany additional
actions based onthe electricity
pricing informationprovided to me.
Unsure
Engaged Customers All Customers
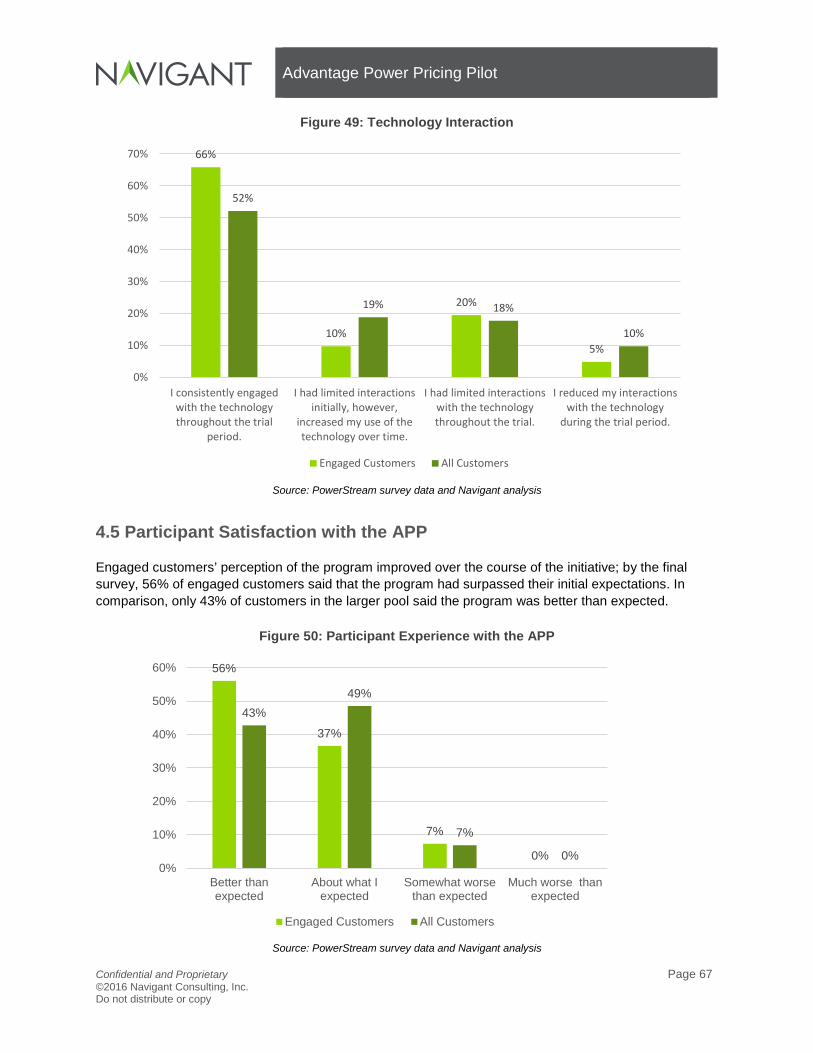
Advantage Power Pricing Pilot
Confidential and Proprietary Page 67 ©2016 Navigant Consulting, Inc. Do not distribute or copy
Figure 49: Technology Interaction
Source: PowerStream survey data and Navigant analysis
4.5 Participant Satisfaction with the APP
Engaged customers’ perception of the program improved over the course of the initiative; by the final survey, 56% of engaged customers said that the program had surpassed their initial expectations. In comparison, only 43% of customers in the larger pool said the program was better than expected.
Figure 50: Participant Experience with the APP
Source: PowerStream survey data and Navigant analysis
66%
10%
20%
5%
52%
19% 18%
10%
0%
10%
20%
30%
40%
50%
60%
70%
I consistently engagedwith the technologythroughout the trial
period.
I had limited interactionsinitially, however,
increased my use of thetechnology over time.
I had limited interactionswith the technologythroughout the trial.
I reduced my interactionswith the technology
during the trial period.
Engaged Customers All Customers
56%
37%
7%
0%
43%49%
7%
0%0%
10%
20%
30%
40%
50%
60%
Better thanexpected
About what Iexpected
Somewhat worsethan expected
Much worse thanexpected
Engaged Customers All Customers

Advantage Power Pricing Pilot
Confidential and Proprietary Page 68 ©2016 Navigant Consulting, Inc. Do not distribute or copy
Engaged customers had very high satisfaction. As demonstrated in Figure 51, by the final survey, 100% of engaged respondents were satisfied or very satisfied. The larger pool of customers was slightly less satisfied (Figure 52), with 9% of respondents giving a dissatisfied rating by the end of the program.
Figure 51: Engaged Customer Satisfaction
Source: PowerStream survey data and Navigant analysis
66%
71%
68%
68%
29%
27%
27%
33%
5%
2%
5%
0%
0% 10% 20% 30% 40% 50% 60% 70% 80% 90% 100%
July
August
September
Final
Very satisfied Satisfied Dissatisfied
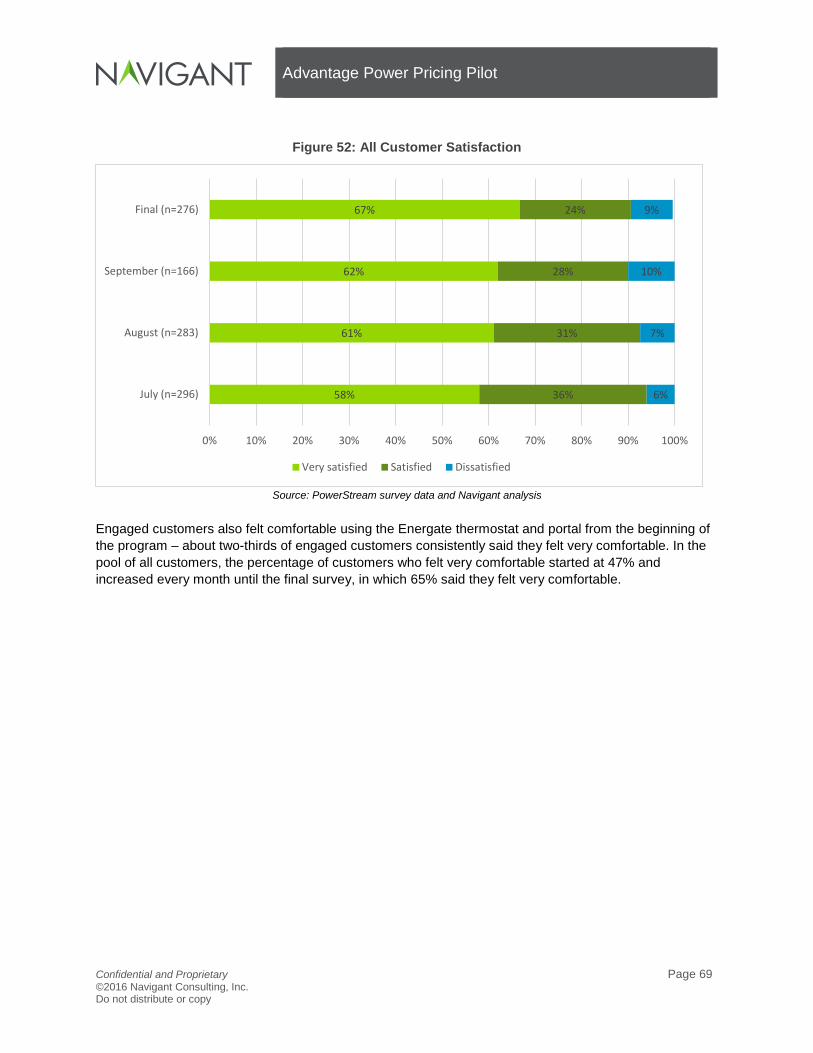
Advantage Power Pricing Pilot
Confidential and Proprietary Page 69 ©2016 Navigant Consulting, Inc. Do not distribute or copy
Figure 52: All Customer Satisfaction
Source: PowerStream survey data and Navigant analysis
Engaged customers also felt comfortable using the Energate thermostat and portal from the beginning of the program – about two-thirds of engaged customers consistently said they felt very comfortable. In the pool of all customers, the percentage of customers who felt very comfortable started at 47% and increased every month until the final survey, in which 65% said they felt very comfortable.
58%
61%
62%
67%
36%
31%
28%
24%
6%
7%
10%
9%
0% 10% 20% 30% 40% 50% 60% 70% 80% 90% 100%
July (n=296)
August (n=283)
September (n=166)
Final (n=276)
Very satisfied Satisfied Dissatisfied
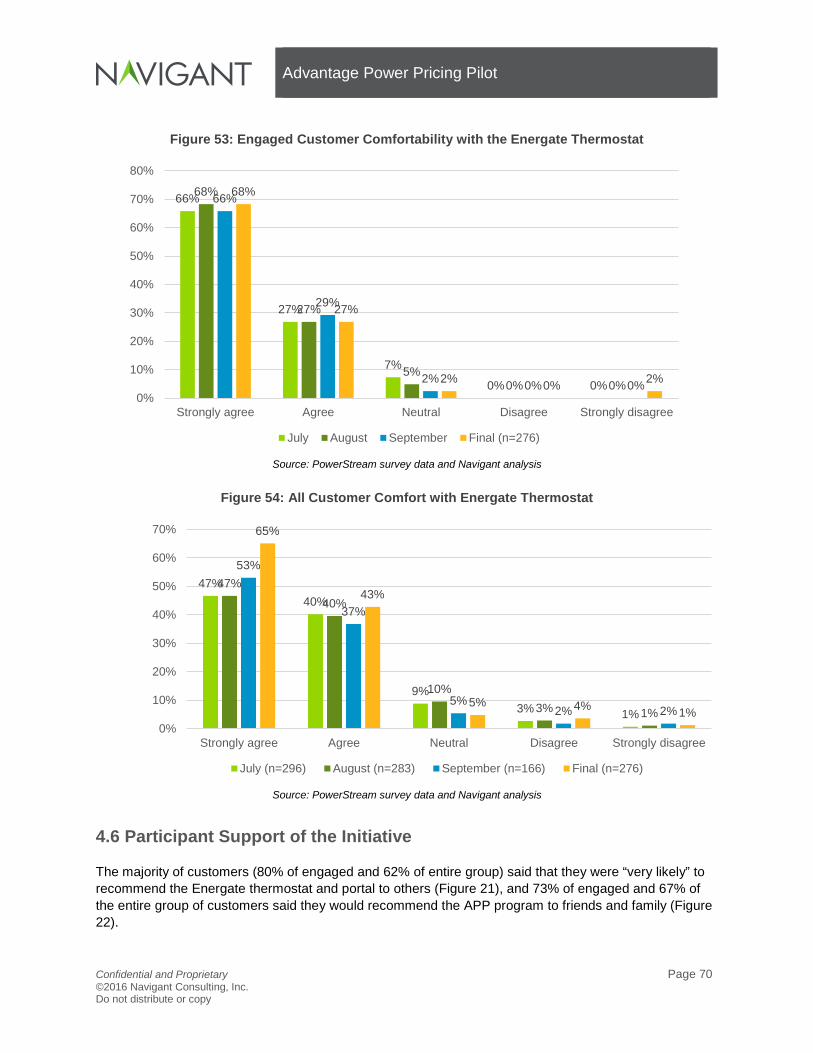
Advantage Power Pricing Pilot
Confidential and Proprietary Page 70 ©2016 Navigant Consulting, Inc. Do not distribute or copy
Figure 53: Engaged Customer Comfortability with the Energate Thermostat
Source: PowerStream survey data and Navigant analysis
Figure 54: All Customer Comfort with Energate Thermostat
Source: PowerStream survey data and Navigant analysis
4.6 Participant Support of the Initiative
The majority of customers (80% of engaged and 62% of entire group) said that they were “very likely” to recommend the Energate thermostat and portal to others (Figure 21), and 73% of engaged and 67% of the entire group of customers said they would recommend the APP program to friends and family (Figure 22).
66%
27%
7%
0% 0%
68%
27%
5%0% 0%
66%
29%
2% 0% 0%
68%
27%
2% 0% 2%0%
10%
20%
30%
40%
50%
60%
70%
80%
Strongly agree Agree Neutral Disagree Strongly disagree
July August September Final (n=276)
47%40%
9%3% 1%
47%40%
10%3% 1%
53%
37%
5%2% 2%
65%
43%
5% 4% 1%0%
10%
20%
30%
40%
50%
60%
70%
Strongly agree Agree Neutral Disagree Strongly disagree
July (n=296) August (n=283) September (n=166) Final (n=276)

Advantage Power Pricing Pilot
Confidential and Proprietary Page 71 ©2016 Navigant Consulting, Inc. Do not distribute or copy
Figure 55: Likelihood of Recommending the Energate System
Source: PowerStream survey data and Navigant analysis
Figure 56: Likelihood of Recommending the APP
Source: PowerStream survey data and Navigant analysis
A very high percentage of customers in the engaged group as well as the larger group said that they expected to continue using the thermostat and portal in the future, and that they had developed lasting price-responsive energy consumption behaviours and habits through the device.
80%
17%
0%
62%
29%
7%
0%
10%
20%
30%
40%
50%
60%
70%
80%
90%
Very likely Like Unlikely
Engaged Customers All Customers
73%
17%10%
67%
24%
9%
0%
10%
20%
30%
40%
50%
60%
70%
80%
Very likely Like Unlikely
Engaged Customers All Customers

Advantage Power Pricing Pilot
Confidential and Proprietary Page 72 ©2016 Navigant Consulting, Inc. Do not distribute or copy
Figure 57: Participant Intention to Continue Use of the Thermostat and Portal
Source: PowerStream survey data and Navigant analysis
Figure 58: Behaviour Change Influenced by the APP
Source: PowerStream survey data and Navigant analysis
4.7 Participant Comfort
As previously discussed, a critical component of all conservation and demand response programs that rely on changes to HVAC load is participant comfort. As such, the survey assessed the extent to which any perceived or real comfort-related issues impacted participants when peak pricing events were active. As demonstrated, both engaged and all customer segments demonstrated a level of comfort change
90%
0%7%
85%
4%10%
0%
10%
20%
30%
40%
50%
60%
70%
80%
90%
100%
Yes No Unsure
Engaged Customers All Customers
88%
0%
12%
83%
6%11%
0%
10%
20%
30%
40%
50%
60%
70%
80%
90%
100%
Yes No Unsure
Engaged Customers All Customers

Advantage Power Pricing Pilot
Confidential and Proprietary Page 73 ©2016 Navigant Consulting, Inc. Do not distribute or copy
during CPP events. However, given the observed high levels of program satisfaction indicated by all participants, as well as the fact that the majority of participants suggest that they will continue to engage with the technology following program completion, it can be assumed that these comfort issues are not prohibitive to the future success of the initiative.
Figure 59: Engaged Customer Comfort Changes during Peak Events
Source: PowerStream survey data and Navigant analysis
Figure 60: All Customer Comfort Changes during Peak Events
Source: PowerStream survey data and Navigant analysis
22%
0%
59%
2% 2%
24%
7%
54%
7% 7%
39%
17%
34%
2% 5%
0%
10%
20%
30%
40%
50%
60%
70%
Yes No – no one was at home during
the event
No – family members were at home during the
event
Unsure N/A
July August September
32%
14%
34%
14%
5%
29%
1%
41%
13%
3%
46%
11%
29%
8%5%
0%5%
10%15%20%25%30%35%40%45%50%
Yes No – no one was at home during
the event
No – family members were at home during the
event
Unsure N/A
July (n=296) August (n=283) September (n=166)

Advantage Power Pricing Pilot
Confidential and Proprietary Page 74 ©2016 Navigant Consulting, Inc. Do not distribute or copy
5. CONCLUSION & RECOMMENDATIONS The first summer of the APP pilot has been successful at meeting its design goals. The pilot design has been shown to deliver substantial peak demand response capability at the time of system peak, it has done so while also delivering meaningful cost saving to participants, and it has done so without any substantial detrimental impacts on customer satisfaction. Navigant’s key finding of its evaluation of the summer 2015 APP pilot are:
1. The APP pilot delivered an average demand reduction of 1.1 kW per home during the summer 2015 system coincident peak hour. Participants that selected the most aggressive conservation settings26 (“Max Savings” and “Savings”) delivered an average demand reduction of more than 1.5 kW. Given a program population of more than 1,000 participants, this represents and aggregate program impact of over 1 MW. Given these impacts, and the observed uptake of Oklahoma Gas and Electric’s “SmartHours” program (approximately 10% of residential participants) this suggests a province-wide potential of more than 400 MW of DR capacity.
2. On average participants paid $74 less in electricity commodity costs than they would have, absent the program. This is equivalent to a reduction in average participant commodity costs of 17%. The average commodity cost reduction for a participant using the “Max Savings” conservation setting was approximately 25%.
3. Approximately one fifth of participants contributed, on average, only modest peak demand impacts and materially increased their energy consumption. Participants selecting the “Max Comfort” conservation setting delivered on average only 0.3 kW of demand reductions during the summer 2015 system coincident peak hour and increased their summer energy consumption by over 9%.
4. APP has been successful in penetrating a segment of PowerStream’s customer-base previously unengaged with utility-based energy efficiency efforts. Nearly 70% of APP participants indicated that they had not previously participated in any PowerStream offered Conservation and Demand Management (CDM) initiative.
5. Nearly 80% of respondents said that the risk-free aspect of the program was very important in their decision to enroll. Maintaining the first-year risk-free “commodity cost guarantee”27 is likely to be essential for any successful wider program roll-out.
6. Engaged customers’28 perception of the program improved over the course of the program. By the final survey, 56% of engaged customers said that the program had surpassed their initial expectations.
Based these six key findings, Navigant has the following recommendations for improving the APP design and maximizing the value of future impact evaluations in future years:
1. PowerStream should consider withdrawing the “Max Comfort” conservation setting option. Participants using this conservation setting deliver very modest demand response impacts, and it is possible that some of these participants may be “gaming” the program –
26 Energate device conservation settings are explained in the “Program Overview” section immediately below. 27 PowerStream provides participants with a guarantee that their electricity commodity costs will not be higher than under standard RPP TOU rates for the first year of participation. See below for more details. 28 Engaged customers are defined as those participants who completed all three monthly surveys and the final survey.

Advantage Power Pricing Pilot
Confidential and Proprietary Page 75 ©2016 Navigant Consulting, Inc. Do not distribute or copy
enrolling only to receive the discounted APP Off-Peak price with no intention of taking active demand response actions.
Navigant understands that the flexibility to avoid automatic thermostat offsets is an important and attractive component of the program for customers. One possibility for avoiding participant alienation could be to offer a “Max Comfort” override option that lasts for a day – participants can choose to avoid having their thermostat controlled on any given day, but cannot set this option as a default.
2. For evaluation purposes, PowerStream should consider deploying Critical price events as a randomized control trial (RCT) for the summer of 2016. This recommendation will enhance future year evaluation. By subjecting only some (randomly selected by strata) portion of the participant group to a given Critical peak event, the impacts of such events can be estimated with greater precision and allow for the more robust development of ex-ante forecast impacts, should those be required in future years.
3. For evaluation purposes, PowerStream may wish to consider calling High and Medium price days on cooler summer days. For this year’s evaluation it has not been possible to derive separate estimates for non-A/C behavioural demand response and A/C driven demand response impacts on High and Medium days simply because the price level is so closely correlated with outdoor temperatures. Calling High and Medium price events on days in which very little A/C is in use (as well as on very hot days) would allow Navigant to estimate the incremental impact of A/C response, although it is possible that doing so may result in participant confusion regarding the price signal and potentially frustrate some participants.
4. PowerStream should consider leveraging its link with participants to promote additional energy efficiency initiatives. Seventy percent of APP participants have not previously engaged with other PowerStream-offered CDM initiatives, indicating a substantial marketing opportunity for other, non-APP CDM initiatives. Given the high-levels of program satisfaction indicated by participants, such participants are likely to be receptive to messaging regarding the incremental benefits such programs could offer them.
5. PowerStream should continue to provide participants with ongoing energy management advice to help participants optimize their APP response to the twin goals of reducing system peak demand and achieving bill savings. Participant impressions of the initiative as well as the extent to which they interacted with the program’s tools consistently increased throughout the program period. Maintaining this on-going engagement will be key to maintaining and improving program achievements over time.