Embed Size (px)
Citation preview

Advantage Oil & Gas Ltd. ‐ 1
Q3
2017 Third Quarter Report
Financial and Operating Highlights2017 2016 2017 2016
Financial ($000, except as otherwise indicated)Sales including realized hedging 51,706$ 56,697$ 193,832$ 143,937$ Funds from operations 36,722$ 45,132$ 139,319$ 112,251$
per share (1) 0.20$ 0.24$ 0.75$ 0.62$ Total capital expenditures 89,798$ 35,640$ 175,051$ 97,971$ Working capital deficit (2) 37,017$ 5,023$ 37,017$ 5,023$ Bank indebtedness 156,351$ 178,971$ 156,351$ 178,971$ Basic weighted average shares (000) 185,953 184,572 185,533 181,188 OperatingDaily Production
Natural gas (mcf/d) 219,812 207,332 225,480 191,970 Liquids (bbls/d) 1,395 1,205 1,215 903 Total mcfe/d (3) 228,182 214,562 232,770 197,388 Total boe/d (3) 38,030 35,760 38,795 32,898
Average prices (including hedging)Natural gas ($/mcf) 2.26$ 2.71$ 2.87$ 2.52$ Liquids ($/bbl) 46.95$ 45.58$ 52.18$ 46.19$
Cash netbacks ($/mcfe) (3)
Natural gas and liquids sales 2.06$ 2.27$ 2.80$ 1.80$ Realized gains on derivatives 0.40 0.60 0.25 0.86 Royalty (expense) recovery 0.02 (0.08) (0.08) (0.02) Operating expense (0.25) (0.25) (0.25) (0.29) Transportation expense (4) (0.35) (0.05) (0.36) (0.03)
Operating netback 1.88 2.49 2.36 2.32 General and administrative (0.07) (0.09) (0.10) (0.11) Finance expense (0.08) (0.11) (0.08) (0.14) Other income 0.01 - - 0.01
Cash netbacks 1.74$ 2.29$ 2.18$ 2.08$
(1) Based on basic weighted average shares outstanding.
(2) Working capital deficit (surplus) includes trade and other receivables, prepaid expenses and deposits, and trade and other accrued liabilities.
(3)
(4)
Three months ended Nine months endedSeptember 30 September 30
A boe and mcfe conversion ratio has been calculated using a conversion rate of six thousand cubic feet of natural gas equivalent to one barrel of liquids.
Commencing on November 1, 2016, Advantage requested that its natural gas marketing contract be modified to reflect natural gas transportation as a cost. Prior to November 1, 2016, Advantage's realized natural gas prices were reduced for natural gas transportation from the sales points to AECO. This change has no effect on cash flow, cash netbacks, or net income; however, Advantage believes this is more instructive for our investors to compare cost structures going forward.

Advantage Oil & Gas Ltd. ‐ 2
MESSAGE TO SHAREHOLDERS
Production Up, Cash Costs Down & Increased Hedging Further Reinforces
Operational Strength and Financial Flexibility
Advantage Oil & Gas Ltd. (“Advantage” or the “Corporation”) is pleased to report that its continued focus on financial discipline, operational excellence and prudent capital allocation has resulted in solid results during the third quarter and nine months of 2017. The third quarter was very active with well operations at all of our Montney land blocks and high construction activity levels at our Glacier gas plant expansion project. Capital expenditures for the quarter were $90 million of which 85% was invested to develop well productivity and to expand our facility infrastructure capacities for 2018 development and beyond. Additionally, the Corporation’s cash flow has maintained our strong balance sheet with a total debt to cash flow ratio of 1.0 at the end of the third quarter. These results and additional achievements in the quarter enhances the Corporation’s operational and financial flexibility and continues the ongoing successful execution of our multi-year development plan.
Cash flow for the quarter was $36.7 million or $0.20/share and $139.3 million or $0.75/share for the nine months, an increase of 21% as compared to the nine months of 2016. Advantage received a natural gas and liquids price of $2.46/mcfe ($14.76/boe) which included realized hedging gains of $0.40/mcfe. This resulted in a strong cash flow margin of 71% made possible by our industry leading low corporate cash costs of $0.73/mcfe for the third quarter of 2017, despite an AECO daily natural gas price that averaged $1.46/mcf.
Production was up 6% to 228.2 mmcfe/d (38,030 boe/d) for the third quarter and up 18% to 232.8 mmcfe/d (38,795 boe/d) for the nine months, on-track with our annual production guidance range of 230 mmcfe/d to 240 mmcfe/d. Natural gas liquids were up 16% to 1,395 bbls/d (75% condensate) and represented 14% of total revenue. These production gains were achieved despite significant TransCanada Pipeline Limited (“TCPL”) transportation restrictions which occurred due to maintenance and pipeline system upgrading work during the quarter.
Total corporate cash costs were $0.73/mcfe during the third quarter and $0.87/mcfe for the nine months (including royalties, operating costs, transportation expense, G&A and finance expense). During the third quarter, operating costs were maintained at an industry leading low cost of $0.25/mcfe resulting from continued optimization of our water disposal and equipment maintenance costs.
The Corporation also made the following accomplishments during the third quarter of 2017 which enhances future flexibility and continues to prove up our significant resource upside:
Increased natural gas hedging positions to 56% of natural gas production for the fourth quarter of 2017 at Cdn $3.27/mcf and 61% for the first quarter of 2018 at Cdn $3.34/mcf. For 2018 and 2019, we increased our hedging positions to 37% of production at Cdn $3.32/mcf and 16% of production at Cdn $3.02/mcf, respectively.
Market diversification currently includes fixed price hedges, Henry Hub and Dawn market exposures and access to the Alliance pipeline in 2018 which will provide opportunities into the mid-west U.S. Advantage’s AECO exposure for this upcoming winter is 9%, 43% in 2018 and 54% in 2019.
Developed current standing completed well productivity of 100 mmcf/d (“IP30”) at Glacier with additional wells to be drilled by year-end 2017 to provide sufficient production capability in support of our 2018 production.

Advantage Oil & Gas Ltd. ‐ 3
Middle Montney success advanced in west Glacier with two new wells that exceed current type curves. Strong well productivity was achieved in two separate Glacier Middle Montney layers through the application of refined completion and frac designs.
Completed the drilling of 6 wells on our undeveloped lands at Valhalla, Progress and Wembley to satisfy land expiries and to begin delineating the multiple layers of the Montney reservoir which have demonstrated encouraging results on adjacent industry lands.
Recent Glacier Achievements Include Strong Middle Montney Well Results Which Enhances Future Operational Flexibility
We completed 15 out of 16 wells that were previously drilled on our largest single pad to date at Glacier. Eleven of the 15 wells were Upper and Lower Montney wells which were individually produced in-line to our Glacier gas plant to ascertain flow capabilities. Based on initial production rates for these wells, we estimate an average IP30 of 7.7 mmcf/d per well with several wells exhibiting rates of over 10 mmcf/d. These wells have an average horizontal lateral length of 2,050 meters and were fracture stimulated with up to 30 frac stages and 63 frac ports utilizing an average of 70 tonnes of proppant per frac stage (up to 880 lbs/ft). Advantage utilized multiple mechanical completion techniques on this pad including cased ports, open hole and Stage Completions systems. The wells are expected to be placed on-stream as required through 2018 to support the Corporation’s planned growth. The average drill, complete, equipping and tie-in cost of these wells was $4.7 million per well, on-track with our budget expectations.
Two Middle Montney wells on the 16 well pad located in west Glacier demonstrated excellent results in an area where there has been limited Middle Montney drilling to date. One well was drilled and completed in the second layer of the Middle Montney with an estimated IP30 of 7.8 mmcf/d. An additional well was drilled and completed in the third layer of the Middle Montney with an estimated IP30 of 5.1 mmcf/d. This was the first horizontal well drilled in this specific layer of the Middle Montney in west Glacier. These wells were completed using modified frac techniques, as compared to earlier Middle Montney wells, to evaluate short and longer term production impacts. As expected, these two Middle Montney wells confirmed that the average recoverable propane plus (“C3+”) liquids yield of the Middle Montney wells in west Glacier is approximately 26 bbls/mmcf as compared to east Glacier which averages 50 bbls/mmcf.
The expansion of Advantage’s 100% owned Glacier gas plant to a raw processing capacity of 400 mmcf/d is progressing on-schedule with project completion targeted for early in the second quarter of 2018. This plant expansion is anticipated to support our future production growth to approximately 2021 based on our current annual growth rate and/or accommodate third party processing opportunities.
Delineation Drilling and Completion Activities Proceeding as Planned on New Undeveloped Lands at Progress, Valhalla and Wembley
Advantage began delineation drilling on its 94 net Montney sections of undeveloped lands outside of Glacier in the third quarter with four wells drilled in Valhalla and one well drilled in each of the Progress and Wembley land blocks. Completion activities at Valhalla are currently underway while well completions at Progress and Wembley are anticipated to begin before year-end. The Valhalla well results are expected to be available in the fourth quarter and are planned to be brought on-production after the Glacier gas plant expansion is commissioned and increased gas gathering pipeline capacity between Valhalla and Glacier is completed in 2018. Two additional wells at Progress are scheduled to be rig released during the first quarter of 2018.

Advantage Oil & Gas Ltd. ‐ 4
Increased Commodity Risk Management Positions and Market Diversification
Advantage increased its natural gas fixed price hedging positions to 56% of natural gas production for the fourth quarter of 2017 at Cdn $3.27/mcf and 61% of production for the first quarter of 2018 at Cdn $3.34/mcf. For 2018 and 2019, our hedging positions increased to 37% of production at Cdn $3.32/mcf and 16% of production at Cdn $3.02/mcf, respectively. Advantage capitalized on its previously secured strong basis positions and Dawn exposure to add attractive fixed price hedging contracts which continue to provide downside cash flow protection. The Corporation’s industry leading low cost structure also provides us with the ability to hedge at lower prices while still generating attractive cash margins.
On November 1, 2017, we began transporting 55,600 GJ/d (52,700 mcf/d) from Alberta to the Dawn market in Southern Ontario through participation in TCPL’s long term fixed price service open season. This provides physical market diversification of approximately 20% of our current production. Advantage has internally approved proceeding with a new sales gas meter station on the Alliance Pipeline system. We anticipate completion of the meter station in 2018.
Advantage’s market diversification as a percentage of estimated total future production, net of royalties, are illustrated below:
Market Diversification 2017 Q4 2018 2019
Natural Gas Fixed Prices (1) 54% 35% 15% AECO 27% 43% 54% Dawn 15% 10% 16% Henry Hub - 8% 9% Liquids 4% 4% 6%
(1) Advantage has exposure to commodity price risk at various market hubs and therefore may fix prices at multiple markets. Please refer to the Consolidated Financial Statements and Management’s Discussion and Analysis for additional information.
Looking Forward
Advantage is on-track with its 2017 annual guidance and has developed increased financial and operational flexibility for 2018 and beyond. We will continue our strategy of sustainable and profitable growth while exercising financial discipline and prudent capital allocation as we finalize our 2018 budget plans which are expected to be released prior to year-end 2017.
Advantage’s Montney development at Glacier has been successfully executed since 2008 based on maintaining an industry leading low cost structure, preserving a strong balance sheet, mitigating downside cash flow volatility and preserving operational flexibility. These factors, in conjunction with a disciplined focus on investment returns, will serve us well in the future.

Advantage Oil & Gas Ltd. ‐ 5
Advisory
The information in this report contains certain forward-looking statements, including within the meaning of the United States Private Securities Litigation Reform Act of 1995. These statements relate to future events or our future intentions or performance. All statements other than statements of historical fact may be forward-looking statements. Forward-looking statements are often, but not always, identified by the use of words such as “seek”, “anticipate”, “plan”, “continue”, “estimate”, “guidance”, “demonstrate”, “expect”, “may”, “can”, “will”, “project”, “predict”, “potential”, “target”, “intend”, “could”, “might”, “should”, “believe”, “would” and similar expressions and include statements relating to, among other things, the Corporation's plans to continue development of its oil and natural gas resource contained within its land holdings and increase production; Advantage's anticipated annual 2017 production guidance range; the Corporation's drilling plans for 2017, including the anticipated number of wells to be drilled, completed and put on-stream and the expected timing thereof; the Corporation's belief that drilling additional wells in 2017 will provide the well capability to achieve its 2018 production target; estimated average cost to drill, complete, equip and tie-in wells; expected timing of completion of expansion of the Corporation's Glacier gas plant, including the anticipated raw processing capacity following such expansion; Advantage's expectation that the expansion of the Corporation's Glacier gas plant will support anticipated production growth and/or accommodate third party processing opportunities; anticipated timing of available well results from Valhalla and bringing wells on production; anticipated timing of service for meter station on the Alliance pipeline and the expected opportunities therefrom; Advantage's future hedging positions and the terms of the Corporation's derivative contracts; the Corporation's belief that it is on track to meet its 2017 annual production guidance and that it has significant financial and operational flexibility; the Corporation's plans to continue its strategy as it finalizes its 2018 budget plans and the anticipated timing of announcement of such budget plans; the Corporation's belief that its continued focus on prudent capital allocation and returns will serve it well in the future; and other matters. Advantage’s actual decisions, activities, results, performance or achievement could differ materially from those expressed in, or implied by, such forward-looking statements and accordingly, no assurances can be given that any of the events anticipated by the forward-looking statements will transpire or occur or, if any of them do, what benefits that Advantage will derive from them.
These statements involve substantial known and unknown risks and uncertainties, certain of which are beyond Advantage’s control, including, but not limited to: changes in general economic, market and business conditions; industry conditions; impact of significant declines in market prices for oil and natural gas; actions by governmental or regulatory authorities including increasing taxes and changes in investment or other regulations; changes in tax laws, royalty regimes and incentive programs relating to the oil and gas industry; the effect of acquisitions; Advantage's success at acquisition, exploitation and development of reserves; failure to achieve production targets on timelines anticipated or at all; unexpected drilling results; changes in commodity prices, currency exchange rates, capital expenditures, reserves or reserves estimates and debt service requirements; the occurrence of unexpected events involved in the exploration for, and the operation and development of, oil and gas properties, including hazards such as fire, explosion, blowouts, cratering, and spills, each of which could result in substantial damage to wells, production facilities, other property and the environment or in personal injury; changes or fluctuations in production levels; individual well productivity; lack of available capacity on pipelines; delays in anticipated timing of drilling and completion of wells; delays in completion of the expansion of the Glacier gas plant; delay in completion of sales gas meter station on the Alliance Pipeline system; lack of available capacity on pipelines; individual well productivity; competition from other producers; the lack of availability of qualified personnel or management; credit risk; changes in laws and regulations including the adoption of new environmental laws and regulations and changes in how they are interpreted and enforced; our ability to comply with current and future environmental or other laws; stock market volatility and market valuations; liabilities inherent in oil and natural gas operations; uncertainties associated with estimating oil and natural gas reserves; competition for, among other things, capital, acquisitions of reserves, undeveloped lands and skilled personnel; incorrect assessments of the value of acquisitions; geological, technical, drilling and processing problems and other difficulties in producing petroleum reserves; ability to obtain required approvals of regulatory authorities; and ability to access sufficient capital from internal and external sources. Many of these risks and uncertainties and additional risk factors are described in the Corporation’s Annual Information Form dated March 2, 2017 which is available at www.Sedar.com and www.advantageog.com. Readers are also referred to risk factors described in other documents Advantage files with Canadian securities authorities.
With respect to forward-looking statements contained in this report, Advantage has made assumptions regarding, but not limited to: timing of regulatory approvals, conditions in general economic and financial markets; effects of regulation by governmental agencies; current and future commodity prices and royalty regimes; future exchange rates; royalty rates; future operating costs, cash costs and liquids transportation costs; frac stages per well; lateral lengths per well; well costs; expected annual production growth rate; availability of skilled labor; availability of drilling and related equipment; timing and amount of capital expenditures; the impact of increasing competition; the price of crude oil and natural gas; that the Corporation will have sufficient cash flow, debt or equity sources or other financial resources required to fund its capital and operating expenditures and requirements as needed; that the Corporation’s conduct and results of operations will be consistent with its expectations; that the Corporation will have the ability to develop the Corporation’s properties in the manner currently contemplated; available pipeline capacity; that

Advantage Oil & Gas Ltd. ‐ 6
the Corporation will be able to complete the expansion and increase capacity at the Glacier gas plant; that Advantage's production will increase; current or, where applicable, proposed assumed industry conditions, laws and regulations will continue in effect or as anticipated; and that the estimates of the Corporation’s production and reserves volumes and the assumptions related thereto (including commodity prices and development costs) are accurate in all material respects. Production estimates contained herein are expressed as anticipated average production over the calendar year. In determining anticipated production for the years ended December 31, 2017 and 2018 Advantage considered historical drilling, completion and production results for prior years and took into account the estimated impact on production of the Corporation's 2017 and 2018 expected drilling and completion activities.
Management has included the above summary of assumptions and risks related to forward-looking information in order to provide shareholders with a more complete perspective on Advantage's future operations and such information may not be appropriate for other purposes. Advantage’s actual results, performance or achievement could differ materially from those expressed in, or implied by, these forward-looking statements and, accordingly, no assurance can be given that any of the events anticipated by the forward-looking statements will transpire or occur, or if any of them do so, what benefits that Advantage will derive there from. Readers are cautioned that the foregoing lists of factors are not exhaustive. These forward-looking statements are made as of the date of this report and Advantage disclaims any intent or obligation to update publicly any forward-looking statements, whether as a result of new information, future events or results or otherwise, other than as required by applicable securities laws.
This report contains a number of oil and gas metrics, including operating netbacks, which do not have standardized meanings or standard methods of calculation and therefore such measures may not be comparable to similar measures used by other companies and should not be used to make comparisons. Such metrics have been included herein to provide readers with additional measures to evaluate the Corporation's performance; however, such measures are not reliable indicators of the future performance of the Corporation and future performance may not compare to the performance in previous periods and therefore such metrics should not be unduly relied upon. Management uses these oil and gas metrics for its own performance measurements and to provide securityholders with measures to compare Advantage's operations over time. Readers are cautioned that the information provided by these metrics, or that can be derived from the metrics presented in this news release, should not be relied upon for investment or other purposes. Operating netback is calculated by adding natural gas and liquids sales with realized gains and losses on derivatives and subtracting royalty expense, operating expense and transportation expense.
References in this report to IP30 rates and other short-term production rates are useful in confirming the presence of hydrocarbons, however such rates are not determinative of the rates at which such wells will commence production and decline thereafter and are not indicative of long term performance or of ultimate recovery. Additionally, such rates may also include recovered "load oil" fluids used in well completion stimulation. While encouraging, readers are cautioned not to place reliance on such rates in calculating the aggregate production of Advantage.
Barrels of oil equivalent (boe) and thousand cubic feet of natural gas equivalent (mcfe) may be misleading, particularly if used in isolation. Boe and mcfe conversion ratios have been calculated using a conversion rate of six thousand cubic feet of natural gas equivalent to one barrel of oil. A boe and mcfe conversion ratio of 6 mcf: 1 bbl is based on an energy equivalency conversion method primarily applicable at the burner tip and does not represent a value equivalency at the wellhead. Given that the value ratio based on the current price of crude oil as compared to natural gas is significantly different from the energy equivalency of 6:1, utilizing a conversion on a 6:1 basis may be misleading as an indication of value.
The Corporation discloses several financial measures that do not have any standardized meaning prescribed under International Financial Reporting Standards ("IFRS"). These financial measures include operating netbacks, cash netbacks, cash costs and total debt to cash flow ratio. Cash netbacks are dependent on the determination of funds from operations and include the primary cash sales and expenses on a per mcfe basis that comprise funds from operations. Total debt to cash flow ratio is calculated as indebtedness under the Corporation's credit facilities plus working capital deficit divided by funds from operations for the prior twelve month period. Management believes that these financial measures are useful supplemental information to analyze operating performance and provide an indication of the results generated by the Corporation’s principal business activities. Investors should be cautioned that these measures should not be construed as an alternative to net income or other measures of financial performance as determined in accordance with IFRS. Advantage’s method of calculating these measures may differ from other companies, and accordingly, they may not be comparable to similar measures used by other companies. Please see the Corporation’s most recent Management’s Discussion and Analysis, which is available at www.sedar.com and www.advantageog.com for additional information about these financial measures, including a reconciliation of funds from operations to cash provided by operating activities.

Advantage Oil & Gas Ltd. ‐ 7
CONSOLIDATED MANAGEMENT’S DISCUSSION & ANALYSIS
The following Management’s Discussion and Analysis (“MD&A”), dated as of November 2, 2017, provides a detailed explanation of the consolidated financial and operating results of Advantage Oil & Gas Ltd. (“Advantage”, the “Corporation”, “us”, “we” or “our”) for the three and nine months ended September 30, 2017 and should be read in conjunction with the unaudited condensed consolidated interim financial statements for the three and nine months ended September 30, 2017 and the audited consolidated financial statements and MD&A for the year ended December 31, 2016. The consolidated financial statements have been prepared in accordance with International Financial Reporting Standards (“IFRS”), representing generally accepted accounting principles (“GAAP”) for publicly accountable enterprises in Canada. All references in the MD&A and consolidated financial statements are to Canadian dollars unless otherwise indicated. The term “boe” or barrels of oil equivalent and “mcfe” or thousand cubic feet equivalent may be misleading, particularly if used in isolation. A boe or mcfe conversion ratio of six thousand cubic feet of natural gas equivalent to one barrel of oil (6 mcf: 1 bbl) is based on an energy equivalency conversion method primarily applicable at the burner tip and does not represent a value equivalency at the wellhead. As the value ratio between natural gas and crude oil based on the current prices of natural gas and crude oil is significantly different from the energy equivalency of 6:1, utilizing a conversion on a 6:1 basis may be misleading as an indication of value.
Forward‐Looking Information and Other Advisories
This MD&A contains certain forward-looking statements and forward-looking information (collectively, "forward-looking statements"), which are based on our current internal expectations, estimates, projections, assumptions and beliefs. These statements relate to future events or our future performance. All statements other than statements of historical fact may be forward-looking statements. Forward-looking statements are often, but not always, identified by the use of words such as "seek", "anticipate", "plan", "continue", "estimate", "expect", "may", "will", "project", "predict", "potential", "targeting", "intend", "could", "might", "should", "believe", "would" and similar or related expressions. These statements are not guarantees of future performance.
In particular, forward-looking statements included in this MD&A include, but are not limited to, the Corporation’s ability to meet its production targets; anticipated annual production for the remainder of 2017; the Corporation’s expectations with respect to the market for natural gas and volatility in natural gas prices; the anticipated advantages from the Corporation’s participation in the Dawn market; effect of commodity prices on the Corporation’s financial results, condition and performance; industry conditions, including the effect of changes in commodity prices, weather and general economic conditions on the natural gas industry and demand for natural gas; the Corporation’s future financial flexibility; the Corporation's hedging activities; terms of the Corporation's derivative contracts, including the timing of settlement of such contracts; effect of fluctuations in commodity prices as compared to valuation assumptions on actual gains or losses realized on cash settlement of derivatives; average royalty rates and the impact of well depths, well production rates, commodity prices and gas cost allowance on average corporate royalty rates; future royalty rates, including the anticipated 2017 average royalty rate; the Corporation’s expectations regarding increased corporate transportation expense, including the timing and amount thereof; terms of the Corporation's equity compensation plans; the Corporation's expectation that it will realize lower cash finance expense in future periods of 2017; future commitments and contractual obligations; terms of the Corporation's credit facilities, including timing of the next review of the credit facilities, effect of revisions or changes in reserve estimates and commodity prices on the borrowing base, and limitations on the utilization of hedging contracts; the Corporation's expectations regarding extension of Advantage's credit facilities at each annual review; the Corporation’s belief that it is well positioned to successfully execute its multi-year development plan at Glacier, Alberta; the Corporation's strategy for managing its capital structure, including the use of equity financing arrangements, share repurchases, obtaining additional financing through bank indebtedness, refinancing current debt, issuing other financial or equity-based instruments, declaring a dividend or adjusting capital spending; the timing of reviews of capital structure and forecast information by Management and the Board of Directors; effect of the Corporation's continual financial assessment processes on the Corporation's ability to mitigate risks; the Corporation's ability to satisfy all liabilities and commitments and meet future obligations as they become due; expected timing of completion of expansion of the Corporation's Glacier gas plant; the Corporation's drilling and completion plans, including the anticipated timing thereof; the Corporation’s expectations regarding future development activities and areas that have the potential for liquids-rich and multi-layer development; the Corporation’s plans to put additional wells on-stream and the expected timing thereof; expected timing of completion of in-line production testing activity; achieving production and bringing additional wells on production on the Corporation’s 16-well pad; the focus of the Corporation’s capital expenditures and operations; the Corporation's expectation that certain wells will meet Advantage's annual and quarterly 2017 production targets; the Corporation's intentions to monitor debt levels to ensure an optimal mix of financing and cost of capital; the timing and impact of amendments to the IFRS 2, IFRS 9, IFRS 15 and IFRS 16 accounting pronouncements; and the statements under "critical accounting estimates" in this MD&A.
These forward-looking statements involve substantial known and unknown risks and uncertainties, many of which are beyond our control, including, but not limited to, risks related to changes in general economic, market and business conditions; continued volatility

Advantage Oil & Gas Ltd. ‐ 8
in market prices for oil and natural gas; the impact of significant declines in market prices for oil and natural gas; stock market volatility; changes to legislation and regulations and how they are interpreted and enforced; our ability to comply with current and future environmental or other laws; actions by governmental or regulatory authorities including increasing taxes, regulatory approvals, changes in investment or other regulations; changes in tax laws, royalty regimes and incentive programs relating to the oil and gas industry; the effect of acquisitions; our success at acquisition, exploitation and development of reserves; unexpected drilling results; failure to achieve production targets on timelines anticipated or at all; changes in commodity prices, currency exchange rates, capital expenditures, reserves or reserves estimates and debt service requirements; the occurrence of unexpected events involved in the exploration for, and the operation and development of, oil and gas properties; hazards such as fire, explosion, blowouts, cratering, and spills, each of which could result in substantial damage to wells, production facilities, other property and the environment or in personal injury; changes or fluctuations in production levels; individual well productivity; delays in anticipated timing of drilling and completion of wells; lack of available capacity on pipelines; delays in timing of completion of the expansion of the Corporation's Glacier gas plant; the failure to extend our credit facilities at each annual review; competition from other producers; the lack of availability of qualified personnel or management; ability to access sufficient capital from internal and external sources; credit risk; and the risks and uncertainties described in the Corporation’s Annual Information Form which is available at www.sedar.com and www.advantageog.com. Readers are also referred to risk factors described in other documents Advantage files with Canadian securities authorities.
With respect to forward-looking statements contained in this MD&A, in addition to other assumptions identified herein, Advantage has made assumptions regarding, but not limited to: current and future prices of oil and natural gas; that the current commodity price and foreign exchange environment will continue or improve; conditions in general economic and financial markets; effects of regulation by governmental agencies; receipt of required regulatory approvals; royalty regimes; future exchange rates; royalty rates; future operating costs; availability of skilled labour; availability of drilling and related equipment; timing and amount of capital expenditures; the impact of increasing competition; the price of crude oil and natural gas; that the Corporation will have sufficient cash flow, debt or equity sources or other financial resources required to fund its capital and operating expenditures and requirements as needed; that the Corporation’s conduct and results of operations will be consistent with its expectations; that the Corporation will have the ability to develop the Corporation’s crude oil and natural gas properties in the manner currently contemplated; availability of pipeline capacity; that current or, where applicable, proposed assumed industry conditions, laws and regulations will continue in effect or as anticipated as described herein; and that the estimates of the Corporation’s production, reserves and resources volumes and the assumptions related thereto (including commodity prices and development costs) are accurate in all material respects.
Management has included the above summary of assumptions and risks related to forward-looking information provided in this MD&A in order to provide shareholders with a more complete perspective on Advantage's future operations and such information may not be appropriate for other purposes. Advantage’s actual results, performance or achievement could differ materially from those expressed in, or implied by, these forward-looking statements and, accordingly, no assurance can be given that any of the events anticipated by the forward-looking statements will transpire or occur, or if any of them do so, what benefits that Advantage will derive there from. Readers are cautioned that the foregoing lists of factors are not exhaustive. These forward-looking statements are made as of the date of this MD&A and Advantage disclaims any intent or obligation to update publicly any forward-looking statements, whether as a result of new information, future events or results or otherwise, other than as required by applicable securities laws.

Advantage Oil & Gas Ltd. ‐ 9
Non‐GAAP Measures
The Corporation discloses several financial and performance measures in the MD&A that do not have any standardized meaning prescribed under GAAP. These financial and performance measures include “funds from operations”, “cash netbacks”, “net capital expenditures” and “free cash flow”, which should not be considered as alternatives to, or more meaningful than “net income”, “comprehensive income”, “cash provided by operating activities”, “cash used in investing activities”, or individual expenses presented within the condensed consolidated statement of comprehensive income as determined in accordance with GAAP. Management believes that these measures provide an indication of the results generated by the Corporation’s principal business activities and provide useful supplemental information for analysis of the Corporation’s operating performance and liquidity. Advantage’s method of calculating these measures may differ from other companies, and accordingly, they may not be comparable to similar measures used by other companies.
Funds from operations, as presented, is based on cash provided by operating activities, before expenditures on decommissioning liability and changes in non-cash working capital, reduced for finance expense excluding accretion. Management believes these adjustments to cash provided by operating activities increase comparability between reporting periods. Cash netbacks are dependent on the determination of funds from operations and include the primary cash sales and expenses on a per mcfe basis that comprise funds from operations. Funds from operations reconciled to cash provided by operating activities is as follows:
September 30 September 30($000) 2017 2016 2017 2016Cash provided by operating activities 56,661$ 47,888$ 18 % 156,553$ 117,807$ 33 % Expenditures on decommissioning liability 166 620 (73) % 820 1,366 (40) % Changes in non-cash working capital (18,507) (1,222) 1,414 % (13,091) 500 (2,718) % Finance expense (1) (1,598) (2,154) (26) % (4,963) (7,422) (33) %Funds from operations 36,722$ 45,132$ (19) % 139,319$ 112,251$ 24 %(1) Finance expense excludes non-cash accretion expense.
% change
Three months ended Nine months ended
% change
Net capital expenditures include total capital expenditures related to property, plant and equipment and exploration and evaluation assets incurred during the period. Management considers this measure reflective of actual capital activity for the period as it excludes changes in working capital related to other periods. Free cash flow is calculated as funds from operations less net capital expenditures incurred during the period. Management considers free cash flow to be a useful measure in assessing the Corporation’s liquidity and ability to generate funds for future capital investments and debt repayments.

Advantage Oil & Gas Ltd. ‐ 10
Overview
$000 per mcfe $000 per mcfe $000 per mcfe $000 per mcfe43,282$ 2.06$ 44,811$ 2.27$ 177,987$ 2.80$ 97,377$ 1.80$ 8,424 0.40 11,886 0.60 15,845 0.25 46,560 0.86
520 0.02 (1,606) (0.08) (4,812) (0.08) (1,263) (0.02) (5,283) (0.25) (4,917) (0.25) (15,762) (0.25) (15,868) (0.29) (7,250) (0.35) (1,025) (0.05) (23,167) (0.36) (1,759) (0.03)
39,693 1.88 49,149 2.49 150,091 2.36 125,047 2.32 (1,560) (0.07) (1,863) (0.09) (6,113) (0.10) (5,789) (0.11) (1,598) (0.08) (2,154) (0.11) (4,963) (0.08) (7,422) (0.14)
187 0.01 - - 304 - 415 0.01 36,722$ 1.74$ 45,132$ 2.29$ 139,319$ 2.18$ 112,251$ 2.08$
0.20$ 0.24$ 0.75$ 0.62$
(1)
(2) General and administrative expense excludes non-cash share based compensation.
(3) Finance expense excludes non-cash accretion expense.
Funds from operations and cash netbacks
Per basic weighted average share
Prior to November 1, 2016, the natural gas prices we realized were reduced for transportation from the sales points to AECO. Commencing on November 1, 2016, gas transportation is no longer deducted from realized natural gas prices, but rather presented as Transportation Expense (see "Transportation Expense"). In the first and second quarters of 2016, transportation expense represented only costs related to our liquids production. Natural gas transportation was $0.30/mcf for three and nine months ended September 30, 2016.
Natural gas and liquids sales (1)
Realized gains on derivativesRoyalty recovery (expense)Operating expenseTransportation expense (1)
Operating income and operating netbacksGeneral and administrative expense (2)
Finance expense (3)
Other income
Three months endedSeptember 30
Nine months endedSeptember 30
2017 2016 2017 2016
Advantage realized funds from operations of $36.7 million and $139.3 million with cash netbacks of $1.74/mcfe and $2.18/mcfe for the three and nine months ended September 30, 2017, respectively. Funds from operations on a per share basis was $0.20 and $0.75 for the three and nine months ended September 30, 2017, respectively. Funds from operations for the third quarter of 2017 decreased by $8.4 million or 19% as compared to the same period in 2016, primarily due to lower natural gas revenues resulting from depressed prices partially offset by a 6% increase in production and a 17% reduction in total corporate cash costs to $0.73/mcfe (includes royalties, operating expense, transportation expense, general and administrative expense, and finance expense). For the nine months ended September 30, 2017, funds from operations increased by $27.1 million or 24% compared to 2016. Year-to-date 2017 results include an 18% increase in production, a Montney leading low cash cost structure of $0.87/mcfe, a 60% increase in average realized natural gas prices and realized derivative gains of $15.8 million from our commodity risk management program (see “Commodity Price Risk Management and Market Diversification”). Advantage’s strong funds from operations and balance sheet funded our planned capital program during the period and resulted in a total debt to twelve-month funds from operations ratio of 1.0 as at September 30, 2017. Excluding realized gains on derivatives, Advantage’s cash netback was $1.34/mcfe and $1.93/mcfe for the three and nine months ended September 30, 2017, respectively, resulting in a margin representing greater than 65% of our realized natural gas and liquids sales.

Advantage Oil & Gas Ltd. ‐ 11
Natural Gas and Liquids Sales
($000) 2017 2016 2017 2016Natural gas sales 37,257$ 39,761$ (6) % 160,673$ 85,953$ 87 %Realized gains on derivatives 8,424 11,886 (29) % 15,845 46,560 (66) %Natural gas sales including hedging 45,681 51,647 (12) % 176,518 132,513 33 %Liquids sales 6,025 5,050 19 % 17,314 11,424 52 %Total (1)
51,706$ 56,697$ (9) % 193,832$ 143,937$ 35 %(1) Total excludes unrealized derivative gains and losses.
% change % change
Three months endedSeptember 30
Nine months endedSeptember 30
For the three months ended September 30, 2017, total sales including realized derivative gains was $51.7 million, a decrease of $5.0 million or 9% as compared to the same period of 2016. The decrease to total sales was primarily attributable to a 12% decrease in realized natural gas prices, partially offset by a 24% increase in realized liquids prices and a 6% increase in total production volumes. For the nine months ended September 30, 2017, total sales including realized derivative gains was $193.8 million, an increase of $49.9 million or 35% that was the result of an 18% increase in production volumes and a 60% increase in realized natural gas prices, partially offset by lower realized gains on derivatives due to differences in natural gas prices and contracts outstanding during the periods (see “Commodity Price Risk Management and Market Diversification”).
Liquids sales has increased significantly during 2017 as compared to 2016 due to higher realized liquids prices and additional Middle Montney wells coming on production, for which liquids are extracted at our Glacier gas plant refrigeration facilities. Liquids production was comprised of approximately 71% condensate during 2017.
Production
2017 2016 2017 2016Natural gas (mcf/d) 219,812 207,332 6 % 225,480 191,970 17 %Liquids (bbls/d) 1,395 1,205 16 % 1,215 903 35 %Total - mcfe/d 228,182 214,562 6 % 232,770 197,388 18 %Total - boe/d 38,030 35,760 6 % 38,795 32,898 18 %Natural gas (%) 96% 97% 97% 97%Liquids (%) 4% 3% 3% 3%
% change % change
Three months endedSeptember 30
Nine months endedSeptember 30
Total production for the three and nine months ended September 30, 2017 increased 6% to 228 mmcfe/d and 18% to 233 mmcfe/d, compared to the respective periods of 2016. While overall production increased through the continued successful execution of our ongoing development plans, production for the third quarter of 2017 was marginally impacted by curtailments from maintenance and expansion activities executed by TransCanada Pipelines Limited (“TCPL”) with our production 2% lower than the second quarter of 2017. Despite the production restrictions experienced, Advantage anticipates average annual production for 2017 to be unchanged from our previously disclosed guidance range of 230 to 240 mmcfe/d.

Advantage Oil & Gas Ltd. ‐ 12
Commodity Prices and Marketing
2017 2016 2017 2016Average Realized PricesNatural gas, excluding hedging ($/mcf) 1.84$ 2.08$ (12) % 2.61$ 1.63$ 60 %Natural gas, including hedging ($/mcf) 2.26$ 2.71$ (17) % 2.87$ 2.52$ 14 %Liquids, excluding and including hedging ($/bbl) 46.95$ 45.58$ 3 % 52.18$ 46.19$ 13 %
Benchmark PricesAECO daily ($/mcf) 1.46$ 2.32$ (37) % 2.31$ 1.85$ 25 %AECO monthly ($/mcf) 1.85$ 2.20$ (16) % 2.52$ 1.85$ 36 %NYMEX ($US/mmbtu) 3.00$ 2.78$ 8 % 3.16$ 2.26$ 40 %Edmonton Light ($/bbl) 57.11$ 54.34$ 5 % 60.71$ 49.42$ 23 %
% change % change
Three months endedSeptember 30
Nine months endedSeptember 30
Advantage’s natural gas production is delivered directly into TCPL with over 50% sold at the AECO monthly price and the remainder at the AECO daily price (see “Commodity Price Risk Management and Market Diversification”). Realized natural gas prices, excluding hedging, for the three months ended September 30, 2017 were lower than the same period of 2016 due to weaker AECO prices, while realized natural gas prices for the nine months ended September 30, 2017 were significantly higher than the comparative period in 2016 due to stronger average AECO prices and natural gas transportation expense which was previously deducted from our gas sales price. Alberta natural gas prices, in particular AECO, have been significantly challenged and volatile during the third quarter of 2017 and continuing into October. While prices were stronger and stable during the first half of 2017, planned pipeline maintenance and expansion activities conducted by TCPL on the Alberta system resulted in receipt and delivery curtailments that placed pressure on prices beginning in July and were more pronounced in September and October 2017. We believe that significant downward pressure on AECO prices has resulted primarily from restrictions in delivery interruptible service that has limited periodic inventory injections causing an extremely tight market with little flexibility for growing supply to clear the system. With the reduction in maintenance and restrictions as we enter the winter season, we would expect the market to be better balanced and less price volatility. Advantage participated in TCPL’s long term, fixed price service open season whereby industry committed to transporting approximately 1.5 bcf/d from Empress, Alberta to the Dawn market in Southern Ontario. Advantage’s commitment to this firm transportation service was 55,600 GJ/d (52,700 mcf/d) that began November 1, 2017 and represents approximately 20% of our current production. The Dawn market provides Advantage with additional physical market diversification from AECO with a corresponding increase in transportation expense to access this market. Advantage expects a more stable market with modestly improved AECO prices as maintenance and restrictions subside combined with the export of gas to eastern Canada.
Prior to November 1, 2016, the natural gas prices we realized were reduced for transportation from the sales points to AECO. Commencing on November 1, 2016, gas transportation is no longer deducted from realized natural gas prices, but rather presented as Transportation Expense (see “Transportation Expense”).
Advantage Oil & Gas Ltd. ‐ 13
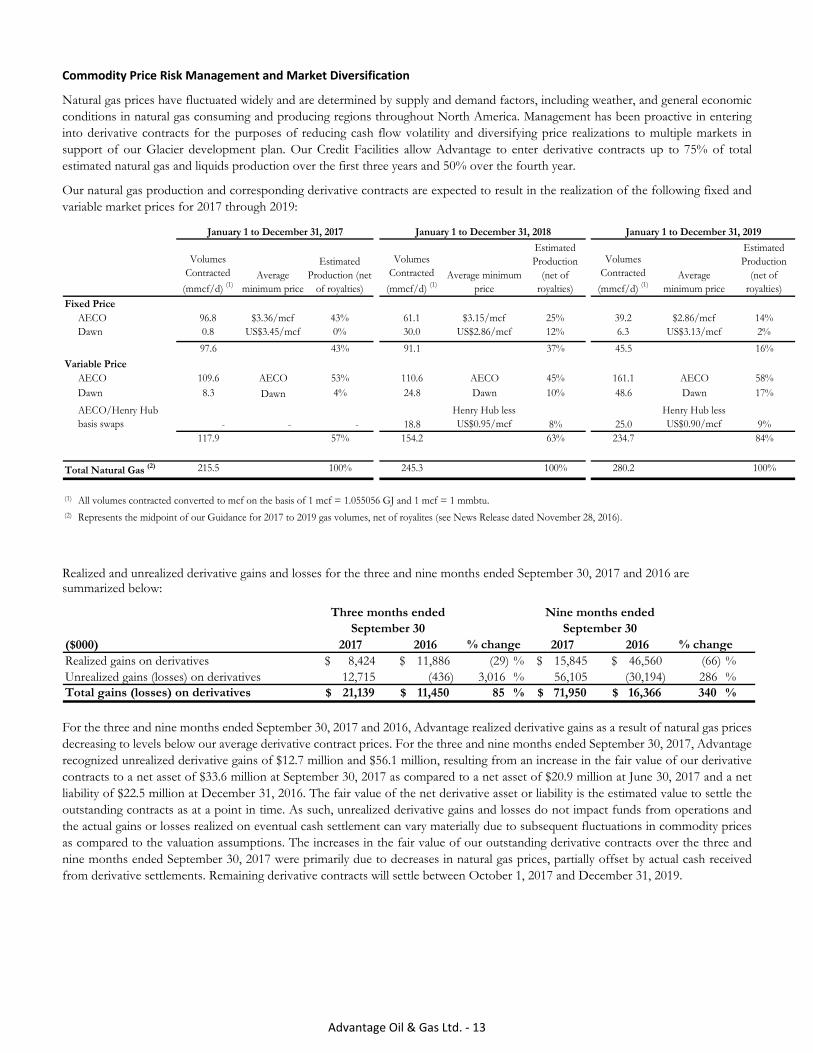
Commodity Price Risk Management and Market Diversification
Natural gas prices have fluctuated widely and are determined by supply and demand factors, including weather, and general economic conditions in natural gas consuming and producing regions throughout North America. Management has been proactive in entering into derivative contracts for the purposes of reducing cash flow volatility and diversifying price realizations to multiple markets in support of our Glacier development plan. Our Credit Facilities allow Advantage to enter derivative contracts up to 75% of total estimated natural gas and liquids production over the first three years and 50% over the fourth year.
Our natural gas production and corresponding derivative contracts are expected to result in the realization of the following fixed and variable market prices for 2017 through 2019:
Volumes Contracted
(mmcf/d) (1)Average
minimum price
Estimated Production (net
of royalties)
Volumes Contracted
(mmcf/d) (1)Average minimum
price
Estimated Production
(net of royalties)
Volumes Contracted
(mmcf/d) (1)Average
minimum price
Estimated Production
(net of royalties)
AECO 96.8 $3.36/mcf 43% 61.1 $3.15/mcf 25% 39.2 $2.86/mcf 14%Dawn 0.8 US$3.45/mcf 0% 30.0 US$2.86/mcf 12% 6.3 US$3.13/mcf 2%
97.6 43% 91.1 37% 45.5 16%
AECO 109.6 AECO 53% 110.6 AECO 45% 161.1 AECO 58%Dawn 8.3 Dawn 4% 24.8 Dawn 10% 48.6 Dawn 17%
AECO/Henry Hub basis swaps - - - 18.8
Henry Hub less US$0.95/mcf 8% 25.0
Henry Hub less US$0.90/mcf 9%
117.9 57% 154.2 63% 234.7 84%
Total Natural Gas (2) 215.5 100% 245.3 100% 280.2 100%
(1) All volumes contracted converted to mcf on the basis of 1 mcf = 1.055056 GJ and 1 mcf = 1 mmbtu.(2) Represents the midpoint of our Guidance for 2017 to 2019 gas volumes, net of royalites (see News Release dated November 28, 2016).
January 1 to December 31, 2017 January 1 to December 31, 2018 January 1 to December 31, 2019
Fixed Price
Variable Price
Realized and unrealized derivative gains and losses for the three and nine months ended September 30, 2017 and 2016 are summarized below:
($000) 2017 2016 2017 2016Realized gains on derivatives 8,424$ 11,886$ (29) % 15,845$ 46,560$ (66) %Unrealized gains (losses) on derivatives 12,715 (436) 3,016 % 56,105 (30,194) 286 %Total gains (losses) on derivatives 21,139$ 11,450$ 85 % 71,950$ 16,366$ 340 %
% change % change
Three months endedSeptember 30
Nine months endedSeptember 30
For the three and nine months ended September 30, 2017 and 2016, Advantage realized derivative gains as a result of natural gas prices decreasing to levels below our average derivative contract prices. For the three and nine months ended September 30, 2017, Advantage recognized unrealized derivative gains of $12.7 million and $56.1 million, resulting from an increase in the fair value of our derivative contracts to a net asset of $33.6 million at September 30, 2017 as compared to a net asset of $20.9 million at June 30, 2017 and a net liability of $22.5 million at December 31, 2016. The fair value of the net derivative asset or liability is the estimated value to settle the outstanding contracts as at a point in time. As such, unrealized derivative gains and losses do not impact funds from operations and the actual gains or losses realized on eventual cash settlement can vary materially due to subsequent fluctuations in commodity prices as compared to the valuation assumptions. The increases in the fair value of our outstanding derivative contracts over the three and nine months ended September 30, 2017 were primarily due to decreases in natural gas prices, partially offset by actual cash received from derivative settlements. Remaining derivative contracts will settle between October 1, 2017 and December 31, 2019.

Advantage Oil & Gas Ltd. ‐ 14
Royalty Expense
2017 2016 2017 2016Royalty expense (recovery) ($000) (520)$ 1,606$ (132) % 4,812$ 1,263$ 281 % per mcfe (0.02)$ 0.08$ (125) % 0.08$ 0.02$ 300 %Royalty Rate (percentage of natural gas and liquids sales) (1.2) % 3.6 % (4.8) % 2.7 % 1.3 % 1.4 %
% change % change
Three months endedSeptember 30
Nine months endedSeptember 30
Advantage pays royalties to the owners of mineral rights from which we have leases. The Corporation has mineral leases with provincial governments, individuals and other companies. Our current average royalty rates are determined by various royalty regimes that incorporate factors including well depths, well production rates, and commodity prices. Royalties also include the impact of gas cost allowance (“GCA”) which is a reduction of royalties payable to the Alberta Provincial Government (the “Crown”) to recognize capital and operating expenditures incurred by Advantage in the gathering and processing of the Crown’s share of our natural gas production. Royalty expense increased during 2017 as compared to 2016 primarily due to higher corporate production and realized commodity prices in 2017 and a $2.1 million GCA recovery in the second quarter of 2016. Royalties in the third quarter of 2017 were particularly low due to the weak natural gas price environment and a recovery of royalties previously paid during 2017 associated with certain royalty incentive programs. Advantage can experience significantly reduced royalty rates during periods of low commodity prices. We anticipate a 2017 average royalty rate of between 3.0% and 5.0%.
Operating Expense
2017 2016 2017 2016Operating expense ($000) 5,283$ 4,917$ 7 % 15,762$ 15,868$ (1) % per mcfe 0.25$ 0.25$ - % 0.25$ 0.29$ (14) %
% change % change
Three months endedSeptember 30
Nine months endedSeptember 30
Operating costs per mcfe remained consistent for the three months ended September 30, 2017 and 2016, and decreased by 14% to $0.25/mcfe for the nine months ended September 30, 2017 compared to the same period of 2016. The lower year-to-date 2017 operating costs per mcfe were due to reduced water disposal and handling costs attributable to an additional 100% owned water disposal well which was placed in-service in 2016, continued efficiency improvement with equipment maintenance procedures and higher plant throughput.

Advantage Oil & Gas Ltd. ‐ 15
Transportation Expense
2017 2016 2017 2016Transportation expense Natural gas ($000) 6,324$ -$ - % 20,454$ -$ - % per mcf 0.31$ -$ - % 0.33$ -$ - % Liquids ($000) 926$ 1,025$ (10) % 2,713$ 1,759$ 54 % per bbl 7.22$ 9.25$ (22) % 8.18$ 7.11$ 15 %
Total transportation expense ($000) 7,250$ 1,025$ 607 % 23,167$ 1,759$ 1,217 % per mcfe 0.35$ 0.05$ 600 % 0.36$ 0.03$ 1,100 %
% change % change
Three months endedSeptember 30
Nine months endedSeptember 30
Transportation expense represents the cost of transporting our natural gas and liquids to the sales points, including associated fuel costs. Prior to November 1, 2016, natural gas transportation was presented as a reduction against realized natural gas prices (see “Commodity Prices and Marketing”) as our transportation contracts were permanently assigned to a third party marketer. With the increase in transportation commitments corresponding to our continued growth, commencing November 1, 2016 Advantage chose to have these contracts permanently assigned back to Advantage and natural gas transportation expense is presented separately. This change has no effect on funds from operations, cash netbacks, or net income. Higher liquids recoveries and production at our Glacier gas plant has resulted in a corresponding increase in liquids transportation expense (see “Production”). The increase in liquids transportation expense per bbl between the nine months ended September 30, 2016 and 2017 was due to higher costs realized during the second quarter of 2017 attributable to wet conditions from spring breakup that typically result in partial truck loads, more trucking of liquids and additional wait times at facilities. Advantage participated in TCPL’s long term, fixed price service open season from Empress, Alberta to the Dawn market in Southern Ontario. Advantage’s commitment to this firm transportation service was 55,600 GJ/d (52,700 mcf/d) that began November 1, 2017 and represents approximately 20% of our current production. The Dawn market provides Advantage with additional physical market diversification from AECO with a corresponding increase in transportation expense to access this market. We expect our corporate transportation expense may increase approximately $0.20/mcf beginning November 1, 2017 as transportation of our firm commitment from AECO to the Dawn market is approximately $1.00/mcf.
General and Administrative Expense
2017 2016 2017 2016General and administrative expense Cash expense ($000) 1,560$ 1,863$ (16) % 6,113$ 5,789$ 6 % per mcfe 0.07$ 0.09$ (22) % 0.10$ 0.11$ (9) % Share based compensation ($000) 1,502$ 898$ 67 % 3,870$ 2,365$ 64 % per mcfe 0.07$ 0.05$ 40 % 0.06$ 0.04$ 50 %
Total general and administrative expense ($000) 3,062$ 2,761$ 11 % 9,983$ 8,154$ 22 % per mcfe 0.14$ 0.14$ - % 0.16$ 0.15$ 7 % Employees at September 30 29 26 12 %
% change % change
Three months endedSeptember 30
Nine months endedSeptember 30
Cash general and administrative (“G&A”) expense for the nine months ended September 30, 2017 increased slightly compared to the same period of 2016, but decreased by 9% to $0.10/mcfe due to increased production in the 2017 period.
Share based compensation represents non-cash G&A expense associated with Advantage’s stock option plan and restricted and performance award plan that are designed to provide for long-term compensation to employees and contractors and to align the interests of these individuals with those of shareholders. Share based compensation for the nine months ended September 30, 2017 increased by $1.5 million compared to the same period of 2016 mainly due to an increase in the value of performance awards granted in 2014 that vested in the second quarter of 2017 and revaluations of performance multipliers associated with outstanding performance awards that can result in quarterly expense variability. As at September 30, 2017, a total of 2.0 million stock options and 1.6 million performance awards are unexercised which represents 1.9% of Advantage’s total outstanding common shares.

Advantage Oil & Gas Ltd. ‐ 16
Depreciation Expense
2017 2016 2017 2016Depreciation expense ($000) 29,256$ 32,056$ (9) % 88,551$ 87,850$ 1 % per mcfe 1.39$ 1.62$ (14) % 1.39$ 1.62$ (14) %
% change % change
Three months endedSeptember 30
Nine months endedSeptember 30
Depreciation of natural gas and liquids properties is provided on the units-of–production method based on total proved and probable reserves, including future development costs, on a component basis. The rate of depreciation expense per mcfe has decreased during 2017 due to a decline in total costs including future development costs as a proportion of total proved and probable reserves, resulting from the continued efficiency of our reserve additions. Continued production increases at Glacier has resulted in higher depreciation expense for the nine months ended September 30, 2017 compared to the same period of 2016 (see “Production”).
Finance Expense
2017 2016 2017 2016Finance expense
Cash expense ($000) 1,598$ 2,154$ (26) % 4,963$ 7,422$ (33) % per mcfe 0.08$ 0.11$ (27) % 0.08$ 0.14$ (43) %Accretion expense ($000) 278$ 198$ 40 % 728$ 624$ 17 % per mcfe 0.01$ 0.01$ - % 0.01$ 0.01$ - %Total finance expense ($000) 1,876$ 2,352$ (20) % 5,691$ 8,046$ (29) % per mcfe 0.09$ 0.12$ (25) % 0.09$ 0.15$ (40) %
% change % change
Three months endedSeptember 30
Nine months endedSeptember 30
Our average bank indebtedness was lower during the nine months ended September 30, 2017 compared to the same period of 2016 due to free cash flow which reduced debt and proceeds from the equity financing that closed on March 8, 2016. This lower average bank indebtedness contributed to a decrease in cash finance expense for 2017 as compared to 2016. Interest rates are primarily based on short term bankers’ acceptance rates plus a stamping fee and determined by total debt to the trailing four quarters Earnings before Interest, Taxes, Depreciation and Amortization (“EBITDA”) ratio as calculated pursuant to our Credit Facilities. In 2017, we expect lower cash finance expense as a result of our lower average bank indebtedness and lower interest rates as determined by our total debt to EBITDA ratio.
Accretion expense represents non-cash charges that increase the carrying value of decommissioning liabilities to their maturity values as a result of the passage of time.

Advantage Oil & Gas Ltd. ‐ 17
Taxes
Deferred income taxes arise from differences between the accounting and tax bases of our assets and liabilities. For the three and nine months ended September 30, 2017, the Corporation recognized deferred income tax expenses of $5.4 million and $28.7 million as a result of $18.4 million and $102.3 million income before taxes, respectively. As at September 30, 2017, the Corporation had a deferred income tax liability of $63.9 million.
Net Income (Loss) and Comprehensive Income (Loss)
2017 2016 2017 2016Net income (loss) and comprehensive income (loss) ($000) 13,026$ 8,185$ 59 % 73,614$ (6,889)$ 1,169 % per share - basic 0.07$ 0.04$ 75 % 0.40$ (0.04)$ 1,100 % per share - diluted 0.07$ 0.04$ 75 % 0.39$ (0.04)$ 1,075 %
% change % change
Three months endedSeptember 30
Nine months endedSeptember 30
Advantage reported net income of $13.0 million and $73.6 million for the three and nine months ended September 30, 2017, respectively. Net income for the nine months ended September 30, 2017 was most significantly impacted by higher production and stronger commodity prices, which also contributed to funds from operations of $139.3 million. With the decrease in natural gas prices at September 30, 2017 to levels below our average derivative contract prices, an unrealized gain on derivatives of $56.1 million was recognized during the nine months ended September 30, 2017. Increased net income realized in the three months ended September 30, 2017 compared to the same period of 2016 was primarily the result of higher production and unrealized gains on derivatives of $12.7 million, partially offset by weaker natural gas prices. Unrealized gains and losses on derivatives are non-cash, can fluctuate greatly between periods and result from changes to the estimated value to settle outstanding derivative contracts (see “Commodity Price Risk Management and Market Diversification”). Excluding the impact from unrealized gains and losses on derivatives that can result in net income volatility, Advantage would still have recognized net income for these reporting periods.
Contractual Obligations and Commitments
The Corporation has contractual obligations in the normal course of operations including purchases of assets and services, operating agreements, transportation commitments, sales contracts and bank indebtedness. These obligations are of a recurring and consistent nature and impact cash flow in an ongoing manner. The following table is a summary of the Corporation’s remaining contractual obligations and commitments as at September 30, 2017. Advantage has no guarantees or off-balance sheet arrangements other than as disclosed.
($ millions) Total 2017 2018 2019 2020 2021 2022 After 2022Building leases 2.1$ 0.3$ 1.1$ 0.7$ -$ -$ -$ -$
Transportation (1) 416.5 10.0 48.9 54.0 52.7 48.4 46.2 156.3 Bank indebtedness (2) - principal 157.3 - - 157.3 - - - -
- interest 12.7 1.9 7.3 3.5 - - - - Total contractual obligations 588.6$ 12.2$ 57.3$ 215.5$ 52.7$ 48.4$ 46.2$ 156.3$
(1)
(2)
Payments due by period
The Corporation has commitments for the transportation of its natural gas and liquids. During the three months ended September 30, 2017, the Corporation finalizedthe terms of a firm service agreement on TCPL's Canadian Mainline to the Southern Ontario Dawn trading hub for a 10-year period commencing November 1, 2017.The agreement allows for early termination after 5 years, subject to higher fees during the last two years.
As at September 30, 2017, the Corporation’s bank indebtedness was governed by a credit facility agreement with a syndicate of financial institutions. Under the termsof the agreement, the facility is reviewed annually, with the next review scheduled in June 2018. The facility is revolving and extendible at each annual review for afurther 364 day period at the option of the syndicate. If not extended, the credit facility is converted at that time into a one-year term facility, with the principalpayable at the end of such one-year term. Management fully expects that the facility will be extended at each annual review.

Advantage Oil & Gas Ltd. ‐ 18
Liquidity and Capital Resources
The following table is a summary of the Corporation’s capitalization structure:
($000, except as otherwise indicated) September 30, 2017Bank indebtedness (non-current) 156,351$ Working capital deficit 37,017
Total debt (1) 193,368$ Shares outstanding 185,962,315 Shares closing market price ($/share) 7.82$ Market capitalization 1,454,225$
Total capitalization 1,647,593$
Total debt to funds from operations (2)1.0
(1) Total debt is a non-GAAP measure that includes bank indebtedness and working capital deficit. (2) Total debt to funds from operations is calculated by dividing total debt by funds from operations for the previous four quarters.
Advantage has a $400 million credit facility of which $244 million or 61% was available at September 30, 2017 (see “Bank Indebtedness, Credit Facilities and Other Obligations”). The Corporation’s twelve-month trailing funds from operations of $194 million was partially supplemented by working capital and bank indebtedness to fund our net capital expenditure program of $205 million over the same period Through continuous careful management of our bank indebtedness and timing of capital expenditures, total debt to twelve-month trailing funds from operations remained low at 1.0 times as at September 30, 2017. Advantage has a strong balance sheet, a disciplined commodity risk management program, an industry leading low cost structure, and substantial available liquidity such that it is well positioned to continue successfully executing our multi-year development plan.
Advantage monitors its capital structure and makes adjustments according to market conditions in an effort to meet its objectives given the current outlook of the business and industry in general. The capital structure of the Corporation is composed of working capital, bank indebtedness, and share capital. Advantage may manage its capital structure by issuing new common shares, repurchasing outstanding common shares, obtaining additional financing through bank indebtedness, refinancing current debt, issuing other financial or equity-based instruments, declaring a dividend, or adjusting capital spending. The capital structure is reviewed by Management and the Board of Directors on an ongoing basis. Management of the Corporation’s capital structure is facilitated through its financial and operational forecasting processes. Selected forecast information is frequently provided to the Board of Directors. This continual financial assessment process further enables the Corporation to mitigate risks. The Corporation continues to satisfy all liabilities and commitments as they come due.
Shareholders’ Equity
As at September 30, 2017, Advantage had 186.0 million common shares outstanding. During the nine months ended September 30, 2017, Advantage issued 1.3 million common shares to employees and contractors in exchange for the exercise of 1.1 million stock options and the settlement of 0.4 million performance shares. As at September 30, 2017, a total of 2.0 million stock options and 1.6 million performance awards were outstanding, which represents 1.9% of Advantage’s total outstanding common shares. On March 8, 2016, Advantage closed the equity financing of 13,427,075 common shares issued for net proceeds of $95.1 million which was used initially to reduce bank indebtedness. As at November 2, 2017, Advantage had 186.0 million common shares outstanding.
Bank Indebtedness, Credit Facilities and Other Obligations
At September 30, 2017, Advantage had bank indebtedness outstanding of $156.4 million, an increase of $3.2 million since December 31, 2016. The change in bank indebtedness was consistent with the timing and execution of Advantage’s planned capital expenditure program. Advantage’s credit facilities have a borrowing base of $400 million that is collateralized by a $1 billion floating charge demand debenture covering all assets of the Corporation and has no financial covenants (the “Credit Facilities”). The borrowing base for the Credit Facilities is determined by the banking syndicate through an evaluation of our reserve estimates based upon their own commodity price expectations. Revisions or changes in the reserve estimates and commodity prices can have either a positive or a negative impact on the borrowing base. On October 20, 2017, the semi-annual redetermination of the Credit Facilities borrowing base was completed, with no changes to the borrowing base of $400 million, comprised of a $20 million extendible revolving operating loan facility from one financial institution and a $380 million extendible revolving loan facility from a syndicate of financial institutions. The next annual

Advantage Oil & Gas Ltd. ‐ 19
review is scheduled to occur in June 2018. There can be no assurance that the Credit Facilities will be renewed at the current borrowing base level at that time.
Advantage’s working capital deficit of $37.0 million as at September 30, 2017 increased from $6.2 million at December 31, 2016 due to differences in the timing and volume of capital expenditures between the two periods. Our working capital includes items expected for normal operations such as trade receivables, prepaid expenses, deposits, and trade payables and accruals. Working capital varies primarily due to the timing of such items, the current level of business activity including our capital expenditure program, commodity price volatility, and seasonal fluctuations. Our working capital is normally in a deficit position due to our capital development activities. We do not anticipate any problems in meeting future obligations as they become due as they can be satisfied with funds from operations and our available Credit Facilities. Capital Expenditures
($000) 2017 2016 2017 2016Drilling, completions and workovers 61,242$ 24,440$ 99,016$ 35,001$ Well equipping and facilities 27,486 11,037 68,380 57,120 Other - - 123 - Expenditures on property, plant and equipment 88,728 35,477 167,519 92,121 Expenditures on exploration and evaluation assets 1,070 163 7,532 5,850 Net capital expenditures (1)
89,798$ 35,640$ 175,051$ 97,971$
(1) Net capital expenditures excludes change in decommissioning liability.
Three months endedSeptember 30
Nine months endedSeptember 30
Advantage invested $175.1 million on property, plant, equipment and land purchases during the nine months ended September 30, 2017.
During the third quarter of 2017, site construction levels increased for the announced expansion of our 100% owned Glacier gas plant to 400 mmcf/d raw gas capability, including 6,800 bbls/d of liquids, with an anticipated completion date of early second quarter 2018. Year-to-date, $52 million has been invested in the expansion with the majority of the expenditures related to equipment purchases, engineering design and permitting. During the third quarter of 2017, approximately 6 kilometers of gas gathering system was looped with two additional 10” pipelines to accommodate future production growth and prepare for increasing production volumes that will be processed at our expanded facility. Advantage’s strategy of owning and operating our own infrastructure has helped us achieve an industry leading low cost structure.
Drilling activity resumed in July 2017 utilizing two rigs. Within Advantage’s undeveloped lands, delineation drilling began at Valhalla, Progress and Wembley with the drilling of four wells at Valhalla, one well at Progress and one well at Wembley. Completion operations will take place during the fourth quarter of 2017. In each of these areas, ongoing industry drilling and production activity has demonstrated encouraging initial results with attractive liquid yields and gas rates. Industry drilling adjacent to our lands have targeted multiple Montney layers with results demonstrating liquids-rich gas accumulations in all layers to date. Advantage has a total of 94 net sections of Doig/Montney rights collectively from the three areas with approximately 30 contiguous sections in each area that can support scalable development.
At Glacier, drilling activity resumed with 7 of 8 wells rig released on a multi-well pad during the quarter. Year-to-date, a total of 17 wells have been drilled. Advantage plans to have the majority of its winter program at Glacier drilled by year-end and then will finish off the drilling season with two additional delineation wells at Progress.
Completions operations were completed on a 16-well pad with in-line production testing activity planned to be completed in the fourth quarter of 2017. Production from this pad is expected to begin by the end of 2017 with wells continuing to be brought on production through 2018 in support of our growth targets. Completion operations have been conducted on 26 Montney wells so far in 2017.
Advantage’s Upper, Middle and Lower Montney wells at Glacier are continuing to demonstrate strong production performance. Advantage’s current standing well inventory consists of 26 total wells of which 16 are drilled and completed and 10 remain uncompleted.
In 2017, Advantage has acquired 30 additional sections of Doig/Montney rights in the Valhalla and Progress areas proximal to our existing land holdings for an aggregate cash consideration of $7.5 million. Advantage now holds a total of 184 net sections (117,760 net acres) of Doig/Montney rights with 94 of those sections being in the Valhalla/Progress/Wembley areas that have potential for liquids-rich and multi-layer development.

Advantage Oil & Gas Ltd. ‐ 20
Sources and Uses of Funds
The following table summarizes the various funding requirements during the nine months ended September 30, 2017 and 2016 and the sources of funding to meet those requirements:
($000) 2017 2016Sources of funds
Funds from operations 139,319$ 112,251$ Net proceeds of equity financing - 95,130 Increase in bank indebtedness 3,465 - Change in non-cash working capital and other 33,088 -
175,872$ 207,381$ Uses of funds
Decrease in bank indebtedness -$ 107,483$ Net capital expenditures 175,052 97,971 Change in non-cash working capital and other - 561 Expenditures on decommissioning liability 820 1,366
175,872$ 207,381$
Nine months endedSeptember 30
Bank indebtedness increased modestly during the nine months ended September 30, 2017 as a result of planned net capital expenditures exceeding funds from operations and changes in non-cash working capital. Advantage continuously monitors the debt levels to ensure an optimal mix of financing and cost of capital.

Advantage Oil & Gas Ltd. ‐ 21
Quarterly Performance
2015($000, except as otherwise Q3 Q2 Q1 Q4 Q3 Q2 Q1 Q4
indicated)
Daily productionNatural gas (mcf/d) 219,812 225,844 230,906 215,369 207,332 203,791 164,618 154,241 Liquids (bbls/d) 1,395 1,098 1,151 949 1,205 1,083 418 179 Total (mcfe/d) 228,182 232,432 237,812 221,063 214,562 210,289 167,126 155,315
Average pricesNatural gas ($/mcf)
Excluding hedging 1.84$ 2.98$ 2.99$ 3.02$ 2.08$ 1.10$ 1.72$ 2.34$ Including hedging 2.26$ 3.09$ 3.24$ 3.35$ 2.71$ 2.18$ 2.70$ 2.96$ AECO daily 1.46$ 2.79$ 2.70$ 3.09$ 2.32$ 1.40$ 1.84$ 2.46$ AECO monthly 1.85$ 2.77$ 2.95$ 2.81$ 2.20$ 1.25$ 2.11$ 2.65$
Liquids ($/bbl)Including hedging 46.95$ 57.27$ 53.73$ 53.01$ 45.58$ 52.67$ 31.21$ 43.24$ Edmonton Light ($/bbl) 57.11$ 60.38$ 64.72$ 60.76$ 54.34$ 55.02$ 38.85$ 51.99$
Total sales including realized hedging 51,706$ 69,169$ 72,957$ 71,090$ 56,697$ 45,615$ 41,625$ 42,654$ Net income (loss) 13,026$ 18,339$ 42,249$ (8,845)$ 8,185$ (29,765)$ 14,691$ 12,408$
per share - basic 0.07$ 0.10$ 0.23$ (0.05)$ 0.04$ (0.16)$ 0.08$ 0.08$ per share - diluted 0.07$ 0.10$ 0.22$ (0.05)$ 0.04$ (0.16)$ 0.08$ 0.07$
Funds from operations 36,722$ 48,625$ 53,972$ 54,610$ 45,132$ 36,883$ 30,236$ 31,656$
2017 2016
The table above highlights the Corporation’s performance for the third quarter of 2017 and also for the preceding seven quarters. The Corporation’s production for the second half of 2015 and first quarter of 2016 was negatively impacted by TCPL unplanned firm and interruptible service restrictions in addition to Advantage’s planned outages required to install new equipment for the subsequent Glacier gas plant expansion to 250 mmcfe/d. In the second half of 2016, we attained production levels in excess of 220 mmcfe/d and continued to increase production thereby substantially filling the Glacier gas plant processing capacity in the first and second quarters of 2017, consistent with our multi-year development plan. Production for the third quarter of 2017 was slightly impacted by TCPL capacity restrictions and planned production decreases due to the ongoing expansion of the Glacier gas plant.
Sales and funds from operations did not increase as rapidly as production through 2015 and early 2016 due to an offsetting decline in natural gas prices. This decrease was partially offset by continued production growth, lower cash costs and gains realized from our commodity risk management program. Although Advantage has generally reported net income, the net losses reported in the second and fourth quarters of 2016 were primarily due to the recognition of unrealized derivative losses. Net income reported for the first three quarters of 2017 was attributable to increased production with strong funds from operations as well as the recognition of unrealized derivative gains resulting from an increase in the fair value of our outstanding derivative contracts (see “Commodity Price Risk Management and Market Diversification”). Advantage’s production growth, industry leading low cost structure, strong capital efficiencies and commodity risk management program have achieved long-term profitability despite the natural gas price volatility.

Advantage Oil & Gas Ltd. ‐ 22
Critical Accounting Estimates
The preparation of financial statements in accordance with IFRS requires Management to make certain judgments and estimates. Changes in these judgments and estimates could have a material impact on the Corporation’s financial results and financial condition.
Management relies on the estimate of reserves as prepared by the Corporation’s independent qualified reserves evaluator. The process of estimating reserves is critical to several accounting estimates. The process of estimating reserves is complex and requires significant judgments and decisions based on available geological, geophysical, engineering and economic data. These estimates may change substantially as additional data from ongoing development and production activities becomes available and as economic conditions impact natural gas and liquids prices, operating expense, royalty burden changes, and future development costs. Reserve estimates impact net income and comprehensive income through depreciation and impairment of natural gas and liquids properties. The reserve estimates are also used to assess the borrowing base for the Corporation’s Credit Facilities. Revision or changes in the reserve estimates can have either a positive or a negative impact on asset values, net income, comprehensive income and the borrowing base of the Corporation.
Management’s process of determining the provision for deferred income taxes and the provision for decommissioning liability costs and related accretion expense are based on estimates. Estimates used in the determination of deferred income taxes provisions are significant and can include expected future tax rates, expectations regarding the realization or settlement of the carrying amount of assets and liabilities and other relevant assumptions. Estimates used in the determination of decommissioning liability cost provisions and accretion expense are significant and can include proved and probable reserves, future production rates, future commodity prices, future costs, future interest rates and other relevant assumptions. Revisions or changes in any of these estimates can have either a positive or a negative impact on asset and liability values, net income and comprehensive income.
In accordance with IFRS, derivative assets and liabilities are recorded at their fair values at the reporting date, with gains and losses recognized directly into comprehensive income in the same period. The fair value of derivatives outstanding is an estimate based on pricing models, estimates, assumptions and market data available at that time. As such, the recognized amounts are non-cash items and the actual gains or losses realized on eventual cash settlement can vary materially due to subsequent fluctuations in commodity prices as compared to the valuation assumptions.
Changes in Accounting Policies
There have been no changes in accounting policies during the three months ended September 30, 2017.
Accounting Pronouncements not yet Adopted
Amendments to IFRS 2 Share-based Payment are designed to eliminate diversity in the classification and measurement of specific share-based payment transactions. Amendments to IFRS 2 are effective for annual periods beginning on or after January 1, 2018. Advantage does not anticipate any material changes or effects resulting from the adoption of IFRS 2.
IFRS 9 Financial Instruments will replace IAS 39 and introduce new classification and measurement requirements, an impairment model and a hedge accounting model. IFRS 9 is effective for annual periods beginning on or after January 1, 2018. Advantage does not anticipate any material changes or effects resulting from the adoption of the amendments to IFRS 9.
IFRS 15 Revenue from Contracts with Customers requires an entity to recognize revenue to reflect the transfer of goods and services for the amount it expects to receive, when control is transferred to the purchaser. The standard is to be adopted beginning on or after January 1, 2018, either retrospectively or using a modified retrospective approach. Advantage is currently reviewing our contractual agreements to evaluate the impact of this standard to our financial statements.
IFRS 16 Leases provides an accounting model for leases which requires the recognition of assets and liabilities for many leases. The standard also addresses the measurement, presentation and disclosure of leases. The standard applies to annual financial reports beginning on or after January 1, 2019. Advantage is currently reviewing the impact of IFRS 16 to our financial statements.
Evaluation of Disclosure Controls and Procedures
Advantage’s Chief Executive Officer and Chief Financial Officer have designed disclosure controls and procedures (“DC&P”), or caused it to be designed under their supervision, to provide reasonable assurance that material information relating to the Corporation is made known to them by others, particularly during the period in which the annual filings are being prepared, and information required to be disclosed by the Corporation in its annual filings, interim filings or other reports filed or submitted by it under securities legislation is recorded, processed, summarized and reported within the time periods specified in securities legislation. Management of Advantage, including our Chief Executive Officer and Chief Financial Officer, evaluate the effectiveness of the Corporation’s DC&P annually.
Advantage Oil & Gas Ltd. ‐ 23
Evaluation of Internal Controls over Financial Reporting
Advantage’s Chief Executive Officer and Chief Financial Officer are responsible for establishing and maintaining internal control over financial reporting (“ICFR”). They have designed ICFR, or caused it to be designed under their supervision, to provide reasonable assurance regarding the reliability of financial reporting and the preparation of financial statements for external purposes in accordance with IFRS. The control framework Advantage’s officers used to design the Corporation’s ICFR is the Internal Control – Integrated Framework (2013) issued by the Committee of Sponsoring Organizations. Management of Advantage, including our Chief Executive Officer and Chief Financial Officer, evaluate the effectiveness of the Corporation’s ICFR annually.
Advantage’s Chief Executive Officer and Chief Financial Officer are required to disclose any change in the ICFR that occurred during our most recent interim period that has materially affected, or is reasonably likely to materially affect, the Corporation’s ICFR. No material changes in the ICFR were identified during the interim period ended September 30, 2017 that have materially affected, or are reasonably likely to materially affect, our ICFR.
It should be noted that while the Chief Executive Officer and Chief Financial Officer believe that the Corporation’s design of DC&P and ICFR provide a reasonable level of assurance that they are effective, they do not expect that the control system will prevent all errors and fraud. A control system, no matter how well conceived or operated, does not provide absolute, but rather is designed to provide reasonable assurance that the objective of the control system is met. The Corporation’s ICFR may not prevent or detect all misstatements because of inherent limitations. Additionally, projections of any evaluation of effectiveness to future periods are subject to the risk that controls may become inadequate because of changes in conditions or deterioration in the degree of compliance with the Corporation’s policies and procedures.
Additional Information
Additional information relating to Advantage can be found on SEDAR at www.sedar.com and the Corporation’s website at www.advantageog.com. Such other information includes the annual information form, the management information circular, press releases, material change reports, material contracts and agreements, and other financial reports. The annual information form will be of particular interest for current and potential shareholders as it discusses a variety of subject matter including the nature of the business, description of our operations, general and recent business developments, risk factors, reserves data and other oil and gas information.
November 2, 2017

Advantage Oil & Gas Ltd. ‐ 24
CONDENSED CONSOLIDATED FINANCIAL STATEMENTS
Consolidated Statement of Financial Position
(unaudited, expressed in thousands of Canadian dollars) Notes September 30, 2017 December 31, 2016
ASSETS
Current assets
Trade and other receivables 15,550$ 26,305$
Prepaid expenses and deposits 3,065 1,681
Derivative asset 5 24,548 730
Total current assets 43,163 28,716
Non-current assets
Derivative asset 5 9,162 1,448
Exploration and evaluation assets 3 23,544 16,012
Property, plant and equipment 4 1,528,883 1,450,283
Total non-current assets 1,561,589 1,467,743
Total assets 1,604,752$ 1,496,459$
LIABILITIES
Current liabilities
Trade and other accrued liabilities 55,632$ 34,153$
Derivative liability 5 - 13,812
Total current liabilities 55,632 47,965
Non-current liabilities
Derivative liability 5 151 10,912
Bank indebtedness 6 156,351 153,102
Decommissioning liability 7 40,531 40,992
Deferred income tax liability 8 63,876 35,215
Total non-current liabilities 260,909 240,221
Total liabilities 316,541 288,186
SHAREHOLDERS' EQUITY
Share capital 9 2,340,777 2,334,199
Contributed surplus 108,061 108,315
Deficit (1,160,627) (1,234,241)
Total shareholders' equity 1,288,211 1,208,273
Total liabilities and shareholders' equity 1,604,752$ 1,496,459$
See accompanying Notes to the Condensed Consolidated Financial Statements

Advantage Oil & Gas Ltd. ‐ 25
Consolidated Statement of Comprehensive Income (Loss)
(unaudited, expressed in thousands of Canadian dollars, except for per share amounts) Notes 2017 2016 2017 2016
Natural gas and liquids sales 43,282$ 44,811$ 177,987$ 97,377$ Royalty (expense) recovery 520 (1,606) (4,812) (1,263)
Natural gas and liquids revenue 43,802 43,205 173,175 96,114
Operating expense (5,283) (4,917) (15,762) (15,868) Transportation expense (7,250) (1,025) (23,167) (1,759) General and administrative expense (3,062) (2,761) (9,983) (8,154) Depreciation expense 4 (29,256) (32,056) (88,551) (87,850) Finance expense (1,876) (2,352) (5,691) (8,046) Gains on derivatives 5 21,139 11,450 71,950 16,366 Other income 187 - 304 415 Income (loss) before taxes 18,401 11,544 102,275 (8,782)Income tax recovery (expense) 8 (5,375) (3,359) (28,661) 1,893 Net income (loss) and comprehensive income (loss) 13,026$ 8,185$ 73,614$ (6,889)$
Net income (loss) per share 10Basic 0.07$ 0.04$ 0.40$ (0.04)$ Diluted 0.07$ 0.04$ 0.39$ (0.04)$
Three months ended Nine months endedSeptember 30 September 30
See accompanying Notes to the Condensed Consolidated Financial Statements

Advantage Oil & Gas Ltd. ‐ 26
Consolidated Statement of Changes in Shareholders' Equity
(unaudited, expressed in thousands of Canadian dollars) Notes Share capitalContributed
surplus Deficit
Total shareholders'
equityBalance, December 31, 2016 2,334,199$ 108,315$ (1,234,241)$ 1,208,273$ Net income and comprehensive income - - 73,614 73,614 Share based compensation 9, 11 6,578 (254) - 6,324 Balance, September 30, 2017 2,340,777$ 108,061$ (1,160,627)$ 1,288,211$
(unaudited, expressed in thousands of Canadian dollars) Notes Share capitalContributed
surplus Deficit
Total shareholders'
equityBalance, December 31, 2015 2,236,728$ 103,726$ (1,218,507)$ 1,121,947$ Net loss and comprehensive loss - - (6,889) (6,889) Shares issued on equity financing 9(b) 96,453 - - 96,453 Share based compensation 9, 11 942 3,101 - 4,043 Balance, September 30, 2016 2,334,123$ 106,827$ (1,225,396)$ 1,215,554$
See accompanying Notes to the Condensed Consolidated Financial Statements

Advantage Oil & Gas Ltd. ‐ 27
Consolidated Statement of Cash Flows
(unaudited, expressed in thousands of Canadian dollars) Notes 2017 2016 2017 2016
Operating Activities18,401$ 11,544$ 102,275$ (8,782)$
Add (deduct) items not requiring cash:Share based compensation 9, 11 1,502 898 3,870 2,365 Depreciation expense 4 29,256 32,056 88,551 87,850 Unrealized (gains) losses on derivatives 5 (12,715) 436 (56,105) 30,194
Finance expense 1,876 2,352 5,691 8,046 Expenditures on decommissioning liability 7 (166) (620) (820) (1,366) Changes in non-cash working capital 12 18,507 1,222 13,091 (500) Cash provided by operating activities 56,661 47,888 156,553 117,807
Financing ActivitiesIncrease (decrease) in bank indebtedness 6 22,537 (14,674) 3,465 (107,483) Net proceeds of equity financing 9(b) - - - 95,130 Interest paid (1,912) (2,537) (5,179) (7,487) Cash provided by (used in) financing activities 20,625 (17,211) (1,714) (19,840)
Investing ActivitiesPayments on property, plant and equipment 4,12 (76,216) (30,514) (147,307) (92,117) Payments on exploration and evaluation assets 3 (1,070) (163) (7,532) (5,850) Cash used in investing activities (77,286) (30,677) (154,839) (97,967) Net change in cash - - - - Cash, beginning of period - - - - Cash, end of period -$ -$ -$ -$
Income (loss) before taxes
Three months ended Nine months endedSeptember 30 September 30
See accompanying Notes to the Condensed Consolidated Financial Statements

Advantage Oil & Gas Ltd. ‐ 28
NOTES TO THE CONDENSED CONSOLIDATED FINANCIAL STATEMENTS
September 30, 2017 (unaudited)
All tabular amounts are in thousands of Canadian dollars except as otherwise indicated.
1. Business and structure of Advantage Oil & Gas Ltd.
Advantage Oil & Gas Ltd. and its subsidiaries (together “Advantage” or the “Corporation”) is an intermediate natural gas and liquids development and production corporation with a significant position in the Montney resource play located in Western Canada.
Advantage is domiciled and incorporated in Canada under the Business Corporations Act (Alberta). Advantage’s head office address is 300, 440 – 2nd Avenue SW, Calgary, Alberta, Canada. The Corporation’s primary listing is on the Toronto Stock Exchange and is also traded on the New York Stock Exchange as a Foreign Private Issuer, under the symbol “AAV”.
2. Basis of preparation
(a) Statement of compliance
The Corporation prepares its interim condensed consolidated financial statements in accordance with Canadian generally accepted accounting principles (“GAAP”) as defined in the Chartered Professional Accountants Canada Handbook (the “CPA Canada Handbook”). The CPA Canada Handbook incorporates International Financial Reporting Standards (“IFRS”) as issued by the International Accounting Standards Board, including IAS 34, Interim Financial Reporting. The Corporation has consistently applied the same accounting policies as those set out in the audited consolidated financial statements for the year ended December 31, 2016. Certain disclosures included in the notes to the annual consolidated financial statements have been condensed in the following note disclosures or have been disclosed on an annual basis only. Accordingly, these interim condensed consolidated financial statements should be read in conjunction with the audited consolidated financial statements for the year ended December 31, 2016, which have been prepared in accordance with IFRS as issued by the IASB.
The accounting policies applied in these interim condensed consolidated financial statements are based on IFRS issued and outstanding as of November 2, 2017, the date the Board of Directors approved the statements.
(b) Basis of measurement
The interim consolidated financial statements have been prepared on the historical cost basis, except as detailed in the Corporation’s accounting policies in the audited consolidated financial statements for the year ended December 31, 2016.
The methods used to measure fair values of derivative instruments are discussed in note 5.
(c) Functional and presentation currency
These consolidated financial statements are presented in Canadian dollars, which is the Corporation’s functional currency.
3. Exploration and evaluation assets
Balance at December 31, 2015 10,071$ Additions 6,001 Transferred to property, plant and equipment (note 4) (60) Balance at December 31, 2016 16,012$ Additions 7,532 Balance at September 30, 2017 23,544$

Advantage Oil & Gas Ltd. - 29
4. Property, plant and equipment
CostNatural gas and
liquids properties
Furniture and
equipment TotalBalance at December 31, 2015 1,874,418$ 5,482$ 1,879,900$ Additions 121,847 166 122,013 Change in decommissioning liability (note 7) (2,641) - (2,641) Transferred from exploration and evaluation assets (note 3) 60 - 60 Balance at December 31, 2016 1,993,684$ 5,648$ 1,999,332$ Additions 167,396 123 167,519 Change in decommissioning liability (note 7) (368) - (368) Balance at September 30, 2017 2,160,712$ 5,771$ 2,166,483$
Accumulated depreciationNatural gas and
liquids properties
Furniture and
equipment TotalBalance at December 31, 2015 428,905$ 3,912$ 432,817$ Depreciation 115,885 347 116,232 Balance at December 31, 2016 544,790$ 4,259$ 549,049$ Depreciation 88,324 227 88,551 Balance at September 30, 2017 633,114$ 4,486$ 637,600$
Net book valueNatural gas and
liquids properties
Furniture and
equipment TotalAt December 31, 2016 1,448,894$ 1,389$ 1,450,283$ At September 30, 2017 1,527,598$ 1,285$ 1,528,883$
During the nine months ended September 30, 2017, Advantage capitalized general and administrative expenditures directly related to development activities of $5.5 million (year ended December 31, 2016 - $6.1 million) and included future development costs of $1.6 billion (December 31, 2016 – $1.6 billion) in property, plant and equipment costs subject to depreciation. As at September 30, 2017, the Corporation did not identify indicators of impairment with respect to its property, plant and equipment.

Advantage Oil & Gas Ltd. - 30
5. Financial risk management
Financial instruments of the Corporation include trade and other receivables, deposits, trade and other accrued liabilities, bank indebtedness, and derivative assets and liabilities.
Trade and other receivables and deposits are classified as loans and receivables and measured at amortized cost. Trade and other accrued liabilities and bank indebtedness are all classified as financial liabilities at amortized cost. As at September 30, 2017, there were no significant differences between the carrying amounts reported on the Consolidated Statement of Financial Position and the estimated fair values of these financial instruments due to the short terms to maturity and the floating interest rate on the bank indebtedness.
Fair value is determined following a three level hierarchy:
Level 1: Quoted prices in active markets for identical assets and liabilities. The Corporation does not have any financial assets or liabilities that require level 1 inputs.
Level 2: Inputs other than quoted prices included within Level 1 that are observable, either directly or indirectly. Such inputs can be corroborated with other observable inputs for substantially the complete term of the contract. Derivative assets and liabilities are measured at fair value on a recurring basis. For derivative assets and liabilities, pricing inputs include quoted forward prices for commodities, foreign exchange rates, volatility and risk-free rate discounting, all of which can be observed or corroborated in the marketplace. The actual gains and losses realized on eventual cash settlement can vary materially due to subsequent fluctuations in commodity prices as compared to the valuation assumptions.
Level 3: Under this level, fair value is determined using inputs that are not observable. Advantage has no assets or liabilities that use level 3 inputs.

Advantage Oil & Gas Ltd. - 31
5. Financial risk management (continued)
(a) Price risk
The Corporation’s derivative contracts are classified as Level 2 within the fair value hierarchy. As at September 30, 2017, the Corporation had the following derivative contracts in place:
Description of Derivative Term Volume Price
Natural gas – AECO Fixed price swap April 2017 to March 2018 4,739 mcf/d Cdn $3.27/mcfFixed price swap April 2017 to March 2018 14,217 mcf/d Cdn $3.27/mcfFixed price swap November 2017 to March 2018 18,956 mcf/d Cdn $3.22/mcfFixed price swap July 2017 to March 2018 4,739 mcf/d Cdn $3.02/mcfFixed price swap July 2017 to March 2018 14,217 mcf/d Cdn $3.01/mcfFixed price swap July 2017 to March 2018 14,217 mcf/d Cdn $3.00/mcfFixed price swap July 2017 to June 2018 14,217 mcf/d Cdn $3.00/mcfFixed price swap April 2017 to March 2018 23,695 mcf/d Cdn $3.01/mcfCall option sold April 2017 to December 2018 23,695 mcf/d Cdn $3.17/mcf (1)
Fixed price swap October 2017 to September 2018 4,739 mcf/d Cdn $3.01/mcfCall option sold October 2017 to December 2018 4,739 mcf/d Cdn $3.01/mcf (2)
Fixed price swap October 2017 to September 2018 4,739 mcf/d Cdn $3.01/mcfCall option sold October 2017 to December 2018 4,739 mcf/d Cdn $3.06/mcf (3)
Fixed price swap October 2017 to September 2018 4,739 mcf/d Cdn $3.01/mcfCall option sold October 2017 to December 2018 4,739 mcf/d Cdn $3.11/mcf (4)
Fixed price swap October 2018 to March 2019 18,956 mcf/d Cdn $3.00/mcfFixed price swap October 2018 to March 2019 18,956 mcf/d Cdn $3.00/mcfFixed price swap October 2018 to March 2019 9,478 mcf/d Cdn $3.00/mcf Natural gas – AECO/Henry Hub Basis Differential Basis swap January 2018 to December 2019 25,000 mcf/d Henry Hub less
US $0.85/mcf Basis swap January 2019 to December 2019 25,000 mcf/d Henry Hub less
US $0.90/mcf Natural gas – Dawn Fixed price swap December 2017 to March 2018 10,000 mcf/d US $3.45/mcf
(1) Call option sold is only exercisable by the counterparty if AECO exceeds Cdn $3.43/mcf. (2) Call option sold is only exercisable by the counterparty if AECO exceeds Cdn $3.32/mcf. (3) Call option sold is only exercisable by the counterparty if AECO exceeds Cdn $3.38/mcf. (4) Call option sold is only exercisable by the counterparty if AECO exceeds Cdn $3.43/mcf.

Advantage Oil & Gas Ltd. - 32
5. Financial risk management (continued)
(a) Price risk
As at September 30, 2017, the fair value of the derivatives outstanding resulted in total assets of $33.7 million (December 31, 2016 – $2.2 million) and total liabilities of $0.2 million (December 31, 2016 – $24.7 million). The fair value of the commodity risk management derivatives have been allocated to current assets and liabilities on the basis of expected timing of cash settlement.
For the three and nine months ended September 30, 2017, $21.1 million and $72.0 million were recognized in net income as derivative gains, respectively (three and nine months ended September 30, 2016: derivative gains of $11.5 million and $16.4 million, respectively). The table below summarizes the realized and unrealized gains and losses on derivatives recognized in net income.
2017 2016 2017 2016
Realized gains on derivatives 8,424$ 11,886$ 15,845$ 46,560$ Unrealized gains (losses) on derivatives 12,715 (436) 56,105 (30,194) Gains on derivatives 21,139$ 11,450$ 71,950$ 16,366$
Nine months ended Three months ended September 30 September 30
(b) Capital management
Advantage’s capital structure as at September 30, 2017 and December 31, 2016 is as follows:
Bank indebtedness (non-current) (note 6) 156,351$ 153,102$ Working capital deficit 37,017 6,167 Total debt 193,368$ 159,269$ Shares outstanding (note 9(b)) 185,962,315 184,654,333 Share closing market price ($/share) 7.82$ 9.12$ Market capitalization 1,454,225 1,684,048 Total capitalization 1,647,593$ 1,843,317$
December 31, 2016September 30, 2017

Advantage Oil & Gas Ltd. - 33
6. Bank indebtedness
September 30, 2017 December 31, 2016Revolving credit facility 157,275$ 153,811$ Discount on Bankers Acceptances and other fees (924) (709) Balance, end of period 156,351$ 153,102$
On October 20, 2017, the semi-annual redetermination of the Credit Facilities borrowing base was completed with no changes to the borrowing base of $400 million, comprised of a $20 million extendible revolving operating loan facility from one financial institution and a $380 million extendible revolving loan facility from a syndicate of financial institutions. The revolving period for the Credit Facilities will end in June 2018 unless extended at the option of the syndicate for a further 364 day period. If not extended, the credit facility will be converted at that time into a one-year term facility, with the principal payable at the end of such one-year term. The Corporation did not have any financial covenants at September 30, 2017 and December 31, 2016.
7. Decommissioning liability
The Corporation’s decommissioning liability results from net ownership interests in natural gas and liquids assets including well sites, gathering systems and processing facilities, all of which will require future costs of decommissioning under environmental legislation. These costs are expected to be incurred between 2017 and 2076. A risk-free rate of 2.49% (December 31, 2016 – 2.34%) and an inflation factor of 2.0% (December 31, 2016 – 2.0%) were used to calculate the fair value of the decommissioning liability at September 30, 2017. A reconciliation of the decommissioning liability is provided below:
Nine months ended Year endedSeptember 30, 2017 December 31, 2016
Balance, beginning of year 40,992$ 44,575$ Accretion expense 728 915 Property acquisitions 729 - Liabilities incurred 1,127 2,193 Change in estimates (1,742) (1,165) Effect of change in risk-free rate and inflation rate factor (482) (3,669) Liabilities settled (821) (1,857) Balance, end of period 40,531$ 40,992$

Advantage Oil & Gas Ltd. - 34
8. Income taxes
Income tax expense is recognized based on management’s best estimate of the weighted average annual income tax rate expected for the full financial year. No deferred tax asset has been recognized for capital losses of $158 million (December 31, 2016 – $158 million). Recognition is dependent on the realization of future taxable capital gains.
9. Share capital
(a) Authorized
The Corporation is authorized to issue an unlimited number of shares without nominal or par value.
(b) Issued
Common Shares AmountBalance at December 31, 2015 170,827,158 2,236,728$
13,427,075 96,453 Shares issued on exercise of stock options (note 11(a)) 400,100 - Contributed surplus transferred on exercise of stock options (note 11(a)) - 1,018 Balance at December 31, 2016 184,654,333 2,334,199$ Shares issued on Performance Award settlements (note 11(b)) 825,359 - Contributed surplus transferred on Performance Award settlements (note 11(b)) - 5,374 Shares issued on exercise of stock options (note 11(a)) 482,623 - Contributed surplus transferred on exercise of stock options (note 11(a)) - 1,204 Balance at September 30, 2017 185,962,315 2,340,777$
Shares issued on equity financing, net of issue costs and deferred taxes
On March 8, 2016, the Corporation closed an equity financing whereby 13,427,075 common shares were issued at $7.45 per share, for gross proceeds of $100 million, less $3.6 million related to $4.9 million of issuance costs net of $1.3 million of deferred taxes.
10. Net income per share
The calculations of basic and diluted net income per share are derived from both net income and weighted average shares outstanding, calculated as follows:
2017 2016 2017 2016
Basic and diluted 13,026$ 8,185$ 73,614$ (6,889)$
Basic 185,953,423 184,571,567 185,532,542 181,188,275 Stock Options 472,722 989,962 579,147 - Performance Awards 3,382,488 1,086,282 4,187,652 - Diluted 189,808,633 186,647,811 190,299,341 181,188,275
Three months ended
Net income (loss)
Weighted average shares outstanding
Nine months endedSeptember 30September 30

Advantage Oil & Gas Ltd. - 35
11. Share based compensation (a) Stock Option Plan
The following tables summarize information about changes in stock options outstanding at September 30, 2017:
Stock OptionsWeighted-Average
Exercise PriceBalance at December 31, 2015 4,031,302 5.49$ Exercised (921,387) 4.64 Balance at December 31, 2016 3,109,915 5.75$ Exercised (1,073,371) 4.69 Forfeited/cancelled (18,377) 6.82 Balance at September 30, 2017 2,018,167 6.30$
Number of Stock Options Outstanding
Weighted Average Remaining
Contractual Life - Years
Weighted Average Exercise
Price
Number of Stock
Options Exercisable
Weighted Average Exercise
Price $5.87 - $6.81 1,110,009 1.54 5.87$ 1,110,009 5.87$ $6.82 - $6.82 908,158 2.52 6.82 597,237 6.82 $5.87 - $6.82 2,018,167 1.98 6.30$ 1,707,246 6.20$
Stock Options ExercisableStock Options Outstanding
Range of Exercise Price
During the nine months ended September 30, 2017, 1,073,371 stock options were exercised with no cash consideration, resulting in the issuance of 482,623 common shares.
(b) Performance Incentive Plan Under the Performance Incentive Plan, service providers can be granted two types of Incentive Awards: Restricted Awards and Performance Awards. A Restricted Award is a grant denominated in a fixed number of common shares which generally vests 1/3 on the first anniversary of the grant date, 1/3 on the second anniversary, and 1/3 on the third anniversary. A Performance Award is a grant denominated in a fixed number of common shares which vests on the third anniversary of the grant date. Performance Award grants are multiplied by a Payout Multiplier, that is determined based on Corporate Performance Measures, as approved by the Board of Directors.
As at September 30, 2017, no Restricted Awards have been granted.
The following table is a continuity of Performance Awards:
Performance AwardsBalance at December 31, 2015 666,092 Granted 661,571 Balance at December 31, 2016 1,327,663 Granted 723,676 Settlements (402,582) Forfeited/cancelled (68,458) Balance at September 30, 2017 1,580,299
During April 2017, 402,582 Performance Awards matured and were settled with no cash consideration, resulting in the issuance of 825,359 common shares.

Advantage Oil & Gas Ltd. - 36
11. Share based compensation (continued)
Share based compensation recognized by plan for the three and nine months ended September 30, 2017 and 2016 are as follows:
2017 2016 2017 2016
Stock Options 53$ 199$ 301$ 581$ Performance Awards 2,402 1,336 6,023 3,461 Total share based compensation 2,455 1,535 6,324 4,042 Capitalized (953) (637) (2,454) (1,677) Net share based compensation expense 1,502$ 898$ 3,870$ 2,365$
Nine months ended Three months ended September 30 September 30
12. Supplementary cash flow information
Changes in non-cash working capital is comprised of:
2017 2016 2017 2016Source (use) of cash:
Trade and other receivables 6,628$ (3,989)$ 10,755$ (4,966)$
Prepaid expenses and deposits (940) (790) (1,384) (340) Trade and other accrued liabilities 24,379 10,327 21,479 3,133
30,067$ 5,548$ 30,850$ (2,173)$
Related to operating activities 18,507$ 1,222$ 13,091$ (500)$ Related to financing activities - - - - Related to investing activities 11,560 4,326 17,759 (1,673)
30,067$ 5,548$ 30,850$ (2,173)$
Nine months ended Three months ended September 30 September 30

Advantage Oil & Gas Ltd. ‐ 37
Directors
Jill Angevine (1)(3) Stephen E. Balog (1)(2)(3) Grant Fagerheim (2)(3)
Paul G. Haggis (1)(2)(3)
Andy J. Mah Ronald A. McIntosh (2)(3)
(1) Member of Audit Committee (2) Member of Reserve Evaluation Committee (3) Member of Human Resources, Compensation & Corporate Governance
Committee
Officers
Andy J. Mah, President and CEO Craig Blackwood, Vice President, Finance and CFO Neil Bokenfohr, Senior Vice President
Corporate Secretary
Jay P. Reid, Partner Burnet, Duckworth and Palmer LLP
Auditors
PricewaterhouseCoopers LLP
Bankers
The Bank of Nova Scotia National Bank of Canada Royal Bank of Canada Canadian Imperial Bank of Commerce Union Bank, Canada Branch Alberta Treasury Branches Wells Fargo Bank N.A., /Canada Branch
Independent Reserve Evaluators
Sproule Associates Limited
Legal Counsel
Burnet, Duckworth and Palmer LLP
Transfer Agent
Computershare Trust Company of Canada
Abbreviations
bbls - barrels bbls/d - barrels per day boe - barrels of oil equivalent (6 mcf = 1 bbl) boe/d - barrels of oil equivalent per day mcf - thousand cubic feet mcf/d - thousand cubic feet per day mmcf - million cubic feet mmcf/d - million cubic feet per day mcfe - thousand cubic feet equivalent (1 bbl = 6 mcf) mcfe/d - thousand cubic feet equivalent per day bcf - billion cubic feet gj - gigajoules NGLs - natural gas liquids WTI - West Texas Intermediate
Corporate Office
300, 440 – 2nd Avenue SW Calgary, Alberta T2P 5E9 (403) 718-8000
Contact Us
Toll free: 1-866-393-0393 Email: [email protected] Visit our website at www.advantageog.com
Stock Exchange Trading Symbol (Toronto Stock Exchange and New York Stock Exchange)
Shares: AAV