Embed Size (px)
Citation preview

Annual Report for
31 May 2017
Advantage Asia Pacificex Japan Dividend

Advantage Asia Pacific ex Japan Dividend
TRUST DIRECTORY
Manager
AmFunds Management Berhad
9th
&10th
Floor, Bangunan AmBank Group
55 Jalan Raja Chulan
50200 Kuala Lumpur
Board of Directors
Raja Teh Maimunah Raja Abdul Aziz
Mustafa Mohd Nor
Tai Terk Lin
Sum Leng Kuang
Goh Wee Peng
Investment Committee
Sum Leng Kuang
Tai Terk Lin
Mustafa Mohd Nor
Zainal Abidin Mohd Kassim
Trustee
Deutsche Trustees Malaysia Berhad
Auditors and Reporting Accountants
Ernst & Young
Taxation Adviser
Deloitte Tax Services Sdn Bhd

Advantage Asia Pacific ex Japan Dividend
CONTENTS
1 Manager’s Report
10 Independent Auditor’s Report to the Unitholders
13 Statement of Financial Position
14 Statement of Comprehensive Income
16 Statement of Changes in Equity
17 Statement of Cash Flows
18 Notes to the Financial Statements
37 Statement by the Manager
38 Trustee’s Report
39 Directory

1
MANAGER’S REPORT
Dear Unitholders,
We are pleased to present you the Manager’s report and the audited accounts of Advantage Asia
Pacific ex Japan Dividend (formerly known as AmAdvantage Asia Pacific ex Japan Dividend)
(“Fund”) for the financial year ended 31 May 2017.
Salient Information of the Fund
Name Advantage Asia Pacific ex Japan Dividend (formerly known as AmAdvantage Asia
Pacific ex Japan Dividend) (“Fund”)
Category/
Type
Feeder Fund (Equity)/Income and Growth
Name of
Target Fund
HSBC Global Investment Funds – Asia Pacific ex Japan Equity High Dividend
Objective The Fund seeks to provide income* and Long-term** capital growth by investing in
the Target Fund which has an investment focus in Asia Pacific ex Japan equities.
Note: *Income distribution (if any) will be paid via cheque or reinvested as
additional units.
** Long term means the investment horizon should at least be five (5) years.
Duration The Fund was established on 1 August 2012 and shall exist for as long as it appears
to the Manager and the Trustee that it is in the interests of the unitholders for it to
continue. In some circumstances, the unitholders can resolve at a meeting to
terminate the Fund.
Performance
Benchmark
MSCI AC Asia Pacific ex Japan Index
(obtainable from: www.aminvest.com)
Income
Distribution
Policy
Subject to availability of income, distribution is paid at least once a year.
Breakdown
of Unit
Holdings by
Size
For the financial year under review, the size of the Fund stood at 8,620,755 units.
Size of holding As at 31 May 2017 As at 31 May 2016
No of units
held
Number of
unitholders
No of units
held
Number of
unitholders
5,000 below - - - -
5,001-10,000 - - - -
10,001-50,000 - - - -
50,001-500,000 - - - -
500,001 above 8,620,755 1 11,009,221 1

2
Fund Performance Data
Portfolio
Composition
Details of portfolio composition of the Fund for the financial years as at 31 May are
as follows:
FY
2017
%
FY
2016
%
FY
2015
%
Foreign collective investment scheme 95.94 97.78 95.68
Cash and others 4.06 2.22 4.32
Total 100.00 100.00 100.00
Note: The abovementioned percentages are calculated based on total net asset
value.
Performance
Details
Performance details of the Fund for the financial years ended 31 May are as follows:
FY
2017
FY
2016
FY
2015
Net asset value (RM)* 13,184,956 13,404,958 19,523,029
Units in circulation* 8,620,755 11,009,221 14,923,729
Net asset value per unit (RM)* 1.5294 1.2176 1.3082
Highest net asset value per unit (RM)* 1.5739 1.3544 1.3871
Lowest net asset value per unit (RM)* 1.1946 1.1328 1.1540
Benchmark performance (%) 30.78 -5.04 19.34
Total return (%)(1)
28.07 -2.25 13.04
- Capital growth (%) 25.61 -6.84 8.88
- Income distribution (%) 2.46 4.59 4.16
Gross distribution (sen per unit) 3.00 6.00 5.00
Net distribution (sen per unit) 3.00 6.00 5.00
Management expenses ratio (%)(2)
0.63 0.14 0.89
Portfolio turnover ratio (times)(3)
0.78 0.21 0.38
* Above prices and net asset value per unit are shown as ex-distribution.
Note:
(1) Total return is the actual return of the Fund for the respective financial years
computed based on the net asset value per unit and net of all fees.
(2) Management expense ratio (“MER”) is calculated based on the total fees and
expenses incurred by the Fund divided by the average fund size calculated on a
daily basis. The MER increased by 0.49% as compared to 0.14% per annum for
the financial year ended 31 May 2016 mainly due to increase in expenses.
(3) Portfolio turnover ratio (“PTR”) is calculated based on the average of the total
acquisitions and total disposals of investment securities of the Fund divided by the
average fund size calculated on a daily basis. The PTR increased by 0.57 times
(>100.0%) as compared to 0.21 times for the financial year ended 31 May 2016
mainly due to increase in investing activities.

3
Average Total Return (as at 31 May 2017)
Advantage Asia Pacific
ex Japan Dividend(a)
%
MSCI AC AP
ex-Japan(b)
%
One year 28.07 30.78
Three years 12.27 14.00
Since launch (1 August 2012) 11.61 13.75
Annual Total Return
Financial Years/Period Ended
(31 May)
Advantage Asia Pacific
ex Japan Dividend(a)
%
MSCI AC AP
ex-Japan(b)
%
2017 28.07 30.78
2016 -2.25 -5.04
2015 13.04 19.34
2014 9.41 13.11
2013(c)
9.79 11.17
(a) Source: Novagni Analytics and Advisory Sdn Bhd.
(b) MSCI AC Asia Pacific ex-Japan Index (obtainable from: www.aminvest.com)
(c) Total actual return for the financial period from 1 August 2012 (date of
commencement) to 31 May 2013.
The Fund performance is calculated based on the net asset value per unit of the Fund.
Average total return of the Fund and its benchmark for a period is computed based on
the absolute return for that period annualised over one year.
Note: Past performance is not necessarily indicative of future performance and
that unit prices and investment returns may go down, as well as up.
Fund
Performance
For the financial year under review, the Fund registered a return of 28.07%
comprising of 25.61% capital growth and 2.46% income distribution.
Thus, the Fund’s return of 28.07% has underperformed the benchmark’s return of
30.78% by 2.71%.
As compared with the financial year ended 31 May 2016, the net asset value
(“NAV”) per unit of the Fund increased by 25.61% from RM1.2176 to RM1.5294,
while units in circulation have decreased by 21.70% from 11,009,221 units to
8,620,755 units.
The line chart below shows comparison between the annual performances of
Advantage Asia Pacific ex Japan Dividend and its benchmark, MSCI AC AP ex-
Japan, for the financial period/years ended 31 May.
(Forward)

4
Note: Past performance is not necessarily indicative of future performance and
that unit prices and investment returns may go down, as well as up.
Target Fund
Performance
Fund Performance Review of the Target Fund – HSBC Global Investment
Funds – Asia Pacific ex Japan Equity High Dividend (AS) (the “Target Fund”)
Period
Return in USD
as at 31 May 2017
1 month 2.56%
3 months 6.94%
6 months 15.61%
1 year 25.24%
3 years (annualized) 2.75%
5 years (annualized) 6.90%
Since Inception (annualized) 7.12%
Launch Date: 5 November 2004
Source: HSBC Global Asset Management, data as at 31 May 2017
Past performance is not indicative of future performance
Over one year, the Target Fund progressed by +25.24% in USD terms.
December 2016
The Target Fund delivered a negative absolute return but outperformed the
benchmark in December mainly due to stock selection calls in technology and
financials. Australian and Hong Kong financials were prominent among the top
positive contributors to performance in December, benefitting from a steepening in
the yield curve. The non-holding of Chinese ecommerce giant Alibaba worked well
as it fell as a US Government statement that its site offers an unacceptable level of
fake goods. On the downside, Indiabulls Housing Finance was impacted by the

5
negative effects of demonetization. Sands China fell along with other Macau casino
stocks which were hit by new lower limits on ATM withdrawals.
January 2017
The Target Fund delivered a positive absolute return and outperformed the
benchmark in January mainly due to strong stock selection calls in India, Korea,
Taiwan and Australia. Positive sentiment around Cairn India continued. Samsung
Electronics also pushed higher along with DRAM prices, as the production of higher
spec Chinese smartphones is contributing to lower than usual DRAM inventory
levels. Bank of China (“BOC”) (Hong Kong) continued to rise as it is expected to
benefit from a steepening of the yield curve. BHP Billiton, our largest position in the
materials sector, gained on rising prices for steel and other base metals. Taiwan-listed
Delta Electronics is another beneficiary of the push for higher specification
smartphones for which it supplies various components. On the down-side, the non-
holding of Alibaba hurt as the e-commerce giant released stronger than expected
quarterly results on the back of sharp improvements in online marketing revenue.
February 2017
The Target Fund delivered a positive absolute return but underperformed the
benchmark in February due to stock selection calls in Hong Kong, China, Taiwan and
Australia. IndiaBulls Housing Finance was a strong contributor as concerns over the
negative impacts of demonetization have abated. Indonesian mining services and
heavy machinery distributor United Tractor rallied on firmer coal prices, which is a
boost to its key clients. China Construction Bank rose as earnings in the banking
sector continues to improve. On the downside, BHP Billiton was subject to some
profit taking after trading at an 18-month high in January, and was also trading lower
due to the softening in iron ore prices. HSBC was also a detractor as its quarterly
results were below expectations. Sector allocation effects were negative for
benchmark-relative performance in February. The overweight to energy and telecoms
were the key detractors, while the overweight to financials was favourable.
March 2017
The Target Fund delivered a positive absolute return and outperformed the
benchmark in March mainly due to strong stock selection calls in India, Hong Kong
and Korea. Indiabulls Housing Finance outperformed due to government
announcements to support affordable housing which should lead to improvement in
the growth outlook for housing finance companies. Cairn India continued to trade
higher in March following better than expected results in February.
Samsung Electronics rose on rising DRAM (memory) and display prices. Taiwan-
listed convenience store operator President Chain Store surged in March as an
improved product mix at its stores is driving margins higher and offsetting increases
in operating expenditure. We have recently been adding to the technology selectively
on a strong outlook for internet and hardware. We have also been finding good value
in consumer staples. These purchases are being funded from profit taking mainly in
industrials and energy. Country allocation effects were negative for benchmark-
relative performance in March mainly as a result of the overweight to New Zealand,
which lagged the broader region.

6
April 2017
The Target Fund delivered a positive absolute return and underperformed the
benchmark in April as strong stock selection calls in Taiwan, Korea and consumer
staples were offset by detracting stock selection in India, China and energy. Taiwan
technology hardware supply chain names contributed positively, reinforced by the
trend towards higher spec smartphones. Convenience store operator, President Chain
Store, also fared well as it executes it strategy to higher margin fresh foods. On the
downside, the underweight to Chinese internet and gaming names like Alibaba and
Tencent detracted as these sectors have continued to achieve strong sales momentum.
The overweight to BHP Billiton also detracted on the back of the recent weakening of
the iron ore price. Sector allocation effects were negative for benchmark-relative
performance in April, mainly owing to the overweight to telecoms which was the
worst performing sector.
May 2017
The Target Fund delivered a positive absolute return and performed in line with the
benchmark in May. Strong stock selection in Hong Kong and India was offset by
detracting selection in Korea, China and Singapore. Our holdings of Australian banks
NAB and Commonwealth detracted as the sector was hit a new Government levy
announced in the new budget. Similarly, our non-holding of Westpac and ANZ was
positive for performance. Australian supermarket operator Woolworths detracted on
more intense competitive pressures. Early childhood educational game manufacturer
VTech surged on stronger than expected results and a rise in its dividend pay-out
ratio. Bank of China (“BOC”) Hong Kong also rallied after releasing solid results.
Country allocation effects were negative for benchmark-relative performance in May
mainly due to the underweight in the Chinese internet sector, which pays out a lower
than average dividend but has been rallying lately. The portfolio remains most
overweight to Taiwan, Hong Kong, telecoms, consumer staples and energy. This is
where we are finding the best opportunities when considering attractive valuation for
the profitability on offer and the prospective dividend yield.
Source: HSBC Global Asset Management (Singapore) Limited, as at 31 May 2017
Has the Fund
achieved its
objective?
For the year under review, the fund is in line with its stated objective to provide
income and long-term capital growth by investing in the Target Fund which has an
investment focus in Asia Pacific ex Japan equities.
Strategies
and Policies
Employed
Strategies and Policies of the Target Fund
The Target Fund seeks long-term capital growth and a high level of income by
investing primarily in a diversified portfolio of investments in equity and equity
equivalent securities of companies which have their registered office in and with an
official listing on a major stock exchange or other Regulated Market of any Asia
Pacific country (excluding Japan) as well as companies which carry out a
preponderant part of their economic activities in the Asia Pacific region (excluding
Japan), that offer short-term sustainable dividend yields above the market average
and/or the potential for dividend growth above the market average over the short-
term. As the sub-fund will seek to invest in companies throughout the Asia Pacific
region (excluding Japan), these can be both companies with a registered office in, and
with an official listing in developed markets, and also those in emerging Asian
countries.
7
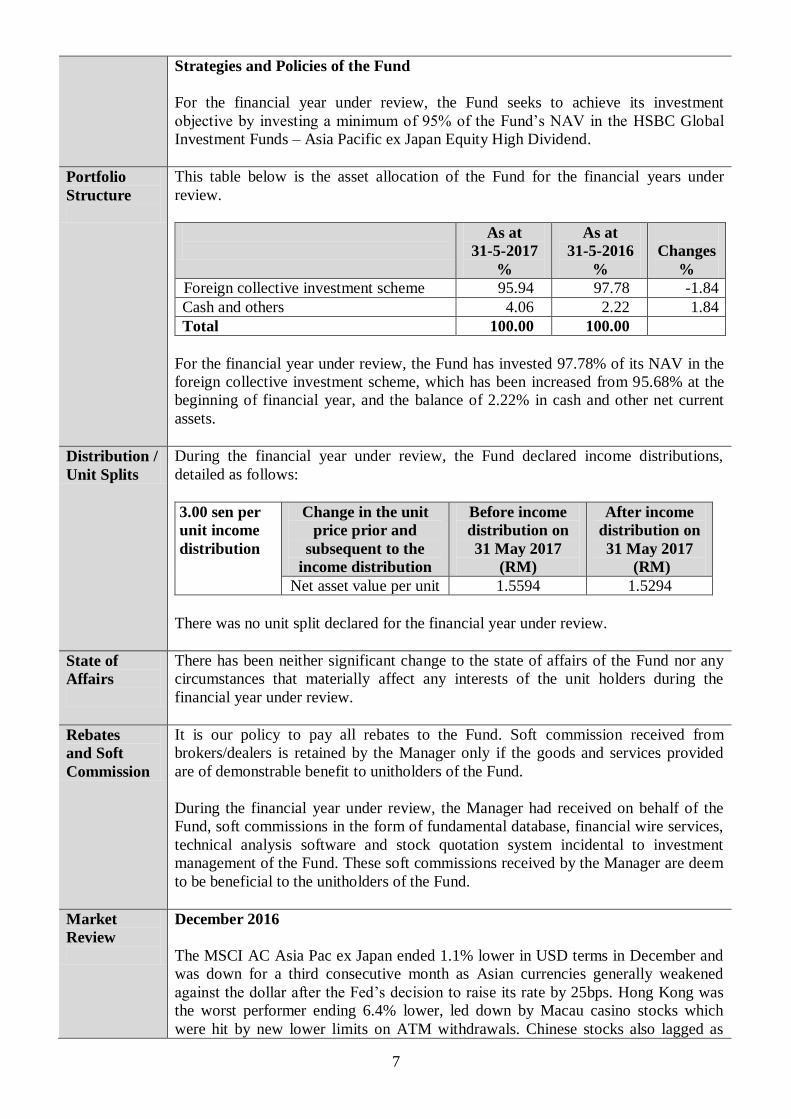
Strategies and Policies of the Fund
For the financial year under review, the Fund seeks to achieve its investment
objective by investing a minimum of 95% of the Fund’s NAV in the HSBC Global
Investment Funds – Asia Pacific ex Japan Equity High Dividend.
Portfolio
Structure
This table below is the asset allocation of the Fund for the financial years under
review.
As at
31-5-2017
%
As at
31-5-2016
%
Changes
%
Foreign collective investment scheme 95.94 97.78 -1.84
Cash and others 4.06 2.22 1.84
Total 100.00 100.00
For the financial year under review, the Fund has invested 97.78% of its NAV in the
foreign collective investment scheme, which has been increased from 95.68% at the
beginning of financial year, and the balance of 2.22% in cash and other net current
assets.
Distribution /
Unit Splits
During the financial year under review, the Fund declared income distributions,
detailed as follows:
3.00 sen per
unit income
distribution
Change in the unit
price prior and
subsequent to the
income distribution
Before income
distribution on
31 May 2017
(RM)
After income
distribution on
31 May 2017
(RM)
Net asset value per unit 1.5594 1.5294
There was no unit split declared for the financial year under review.
State of
Affairs
There has been neither significant change to the state of affairs of the Fund nor any
circumstances that materially affect any interests of the unit holders during the
financial year under review.
Rebates
and Soft
Commission
It is our policy to pay all rebates to the Fund. Soft commission received from
brokers/dealers is retained by the Manager only if the goods and services provided
are of demonstrable benefit to unitholders of the Fund.
During the financial year under review, the Manager had received on behalf of the
Fund, soft commissions in the form of fundamental database, financial wire services,
technical analysis software and stock quotation system incidental to investment
management of the Fund. These soft commissions received by the Manager are deem
to be beneficial to the unitholders of the Fund.
Market
Review
December 2016
The MSCI AC Asia Pac ex Japan ended 1.1% lower in USD terms in December and
was down for a third consecutive month as Asian currencies generally weakened
against the dollar after the Fed’s decision to raise its rate by 25bps. Hong Kong was
the worst performer ending 6.4% lower, led down by Macau casino stocks which
were hit by new lower limits on ATM withdrawals. Chinese stocks also lagged as

8
tighter liquidity conditions prevailed after a bond yields rose, while the real estate
sector fared badly on softening residential sales data. Indonesia was the best
performing market (up 5.4% in USD terms), rising sharply near month end as Fitch
revised its credit outlook to positive. Against the trend of other currencies, the Rupiah
was firmer against USD. Australia also fared well as its banks and resource stocks
have continued to rally since the US election results. India had a volatile month,
finally ending down slightly. This reflected the muddled impact of its
demonetization, where consumption and manufacturing have been hit and bank rates
have dropped on tepid loan growth. Despite the impeachment of President Park over
corruption, the Korean market still ended the month higher.
January 2017
The MSCI AC Asia Pac ex Japan started the year on a strong note, ending January
5.8% higher in USD terms, with all countries and sectors finishing in positive
territory in USD terms. Continuing the trend from H2 2016, cyclicals generally
outperformed defensive sectors indicating risk appetite was still strong. Hong Kong
and Chinese stocks were buoyed better than expected. Q4 Gross Domestic Product
(“GDP”) and a gradual easing of the liquidity squeeze that occurred in December.
Korea was also a solid performer reflecting the appreciation of the Won as foreign
investments rose following the upbeat guidance from Samsung Electronics, which
comprises 21% of the KOSPI index market cap. India added 4.3% in January with the
Goods and Services Tax scheduled to be rolled out from July following the resolution
of pending issues. Taiwan added 5.0% as the tech sector surged.
February 2017
The MSCI AC Asia Pacific ex Japan continued its strong start to the year in February
rising 3.4% in USD terms in February. All Asian markets ended the month higher,
except the Philippines. India was the best performing market gaining 6% in February
led by a credible Union Budget, corporate action by some index heavyweights, and
receding concerns about growth due to demonetization. Taiwan was 4% higher, led
by Apple supply chain names. The Philippines declined 1.3% in USD terms in part
due to a weaker Peso, rising inflation, political noise and a mixed earnings season.
March 2017
The MSCI AC Asia Pac ex Japan added another 3.1% in USD terms in March. All
Asia Pac ex Japan markets ended the month higher, except New Zealand. India was
the best performing market for a second consecutive month gaining 6% as confidence
was boosted by the success of the incumbent government Bharatiya Janata Party
(“BJP”) in the Uttar Pradesh state elections and the encouraging progress on the
passage of GST legislation. Korea shrugged off geopolitical concerns of its region
and performed strongly on the back of rises in the IT and telecom sectors. Upgrades
in semiconductor and display demand and prices helped in particular. Indonesia’s
Jakarta Composite Index reached an all-time high in March as foreign investors
became net buyers of the market after heavy outflows in the previous 6 months. The
Asian region more broadly continues to be buoyed by solid economic data from
China as well.
April 2017
The MSCI AC Asia Pac ex Japan continued its year to date surge adding another
1.6% in USD terms in April. All countries recorded positive absolute returns in USD
terms, except Australia partly due to the AUD weakening 2% vs USD. The

9
Philippines, Malaysia and Indonesia were the top performing markets. Earnings
expectations and positive sentiment around tax reforms led the rally in the
Philippines. All three markets witnessed significant positive foreign flows. China also
fared well with stronger Q1 2017 nominal GDP data, improving profitability in the
industrial sector and easing fears of capital outflow CNY depreciation. The Indian
market was buoyed by strong domestic flows and also encouraging forecasts for the
upcoming monsoon season. Sector-wise, technology was the standout largely due to a
strong showing from Chinese and Korean tech hardware names.
May 2017
The MSCI AC Asia Pac ex Japan continued its unbroken run for 2017, rising 2.7% in
USD terms (up 18% year to date). All countries except Australia recorded positive
absolute returns in USD terms, with Korea and China being the top performing
markets. In South Korea, President Moon Jae-in was elected and earnings revision
continues to be positive. China was buoyed by a few factors including reassurance
from the People’s Bank of China (“PBOC”) that efforts reduce leverage in the
economy should not destabilize it. A stronger Yuan Renminbi (“RMB”) and robust
southbound flows on the stock connect also helped. The market seemed to shrug off
Moody’s downgrade of China’s sovereign rating. Singapore was boosted by its
financials as investors are positive on higher rates benefitting the banks margins.
Philippines continued its run up led by outperformance of the property sector. India
stayed also positive due to generally positive corporate earnings and a continuation of
the reform agenda. Australian banks were hit hard after the Government introduced a
new levy on banks as part of its latest budget.
Source: HSBC Global Asset Management (Singapore) Limited, as at 31 May 2017
Market
Outlook
Asian economies stand to benefit from the synchronized pickup in global economic
growth. While there is still uncertainty around issues like potential trade barriers, we
expect earnings growth to remain strong against the backdrop of a stronger global
economy. Prospects for a continued re-rating of Asian equity markets remain
positive. Key risks are local currency volatility and a more aggressive rate hike cycle
in the US. Macro indicators suggest a stable Chinese economy which continues to
grow at a solid pace. There are potential positive catalysts on the horizon around
ongoing economic and structural reforms which should help support economic
growth. In India, the Government’s reform agenda is incrementally adding to the
country’s growth potential and attractiveness as a destination for capital. The ongoing
recovery in the economy and improving earnings growth prospects will be key
catalysts going forward. With subsiding macro concerns around Korea, we should see
capital returning to the market, while Taiwan continues to benefit from the strong
tech cycle. ASEAN’s steady growth momentum should support ongoing interest in
these markets. Valuations in Asia Pac ex Japan remain attractive on a price-to-book
basis.
Source: HSBC Global Asset Management (Singapore) Limited, as at 31 May 2017
Kuala Lumpur, Malaysia
AmFunds Management Berhad
7 July 2017

Independent auditors’ report to the unitholders of
Advantage Asia Pacific ex Japan Dividend
(formerly known as AmAdvantage Asia Pacific ex Japan Dividend)
Report on the audit of the financial statements
Opinion
Basis for opinion
Independence and other ethical responsibilities
Information other than the financial statements and auditors’ report thereon
Our opinion on the financial statements of the Fund does not cover the other information
and we do not express any form of assurance conclusion thereon.
In connection with our audit of the financial statements of the Fund, our responsibility is
to read the other information and, in doing so, consider whether the other information is
materially inconsistent with the financial statements of the Fund or our knowledge
obtained in the audit or otherwise appears to be materially misstated.
We have audited the financial statements of Advantage Asia Pacific ex Japan Dividend
(formerly known as AmAdvantage Asia Pacific ex Japan Dividend) (“the Fund”), which
comprise the statement of financial position as at 31 May 2017, the statement of
comprehensive income, statement of changes in equity and statement of cash flows for
the year ended, and notes to the financial statements, including a summary of significant
acounting policies, as set out on pages 13 to 36.
In our opinion, the accompanying financial statements give a true and fair view of the
financial position of the Fund as at 31 May 2017, and of its financial performance and its
cash flows for the year then ended in accordance with Malaysian Financial Reporting
Standards and International Financial Reporting Standards.
We conducted our audit in accordance with approved standards on auditing in Malaysia
and International Standards on Auditing. Our responsibilities under those standards are
further described in the Auditor’s Responsibilities for the Audit of the Financial
Statements section of our report. We believe that the audit evidence we have obtained is
sufficient and appropriate to provide a basis for our opinion.
We are independent of the Fund in accordance with the By-Laws (on Professional Ethics,
Conduct and Practice) of the Malaysian Institute of Accountants (“By-Laws”) and the
International Ethics Standards Board for Accountants’ Code of Ethics for Professional
Accountants (“IESBA Code”), and we have fulfilled our other ethical responsibilities in
accordance with the By-Laws and the IESBA Code.
The Manager is responsible for the other information. The other information comprises
information in the Annual Report, but does not include the financial statements of the
Fund and our auditors’ report thereon.
10

Independent auditors’ report to the unitholders of
Advantage Asia Pacific ex Japan Dividend
(formerly known as AmAdvantage Asia Pacific ex Japan Dividend) (cont’d.)
Responsibilities of the Manager and the Trustees for the financial statements
Auditor’s responsibilities for the audit of the financial statements
As part of an audit in accordance with the approved standards on auditing in Malaysia
and International Standards on Auditing, we exercise professional judgment and maintain
professional skepticism throughout the planning and performance of the audit. We also:
Identify and assess the risks of material misstatement of the financial statements
of the Fund, whether due to fraud or error, design and perform audit procedures
responsive to those risks, and obtain audit evidence that is sufficient and
appropriate to provide a basis for our opinion. The risk of not detecting a material
misstatement resulting from fraud is higher than for one resulting from error, as
fraud may involve collusion, forgery, intentional omissions, misrepresentations,
or the override of internal control.
Obtain an understanding of internal control relevant to the audit in order to design
audit procedures that are appropriate in the circumstances, but not for the purpose
of expressing an opinion on the effectiveness of the Fund’s internal control.
The Trustee is responsible for ensuring that the Manager maintains proper accounting
and other records as are necessary to enable true and fair presentation of these financial
statements.
Our objectives are to obtain reasonable assurance about whether the financial statements
of the Fund, as a whole are free from material misstatement, whether due to fraud or
error, and to issue an auditors’ report that includes our opinion. Reasonable assurance is a
high level of assurance, but is not a guarantee that an audit conducted in accordance
approved standards on auditing in Malaysia and International Standards on Auditing will
always detect a material misstatement when it exists. Misstatements can arise from fraud
or error and are considered material if, individually or in the aggregate, they could
reasonably be expected to influence the economic decisions of users taken on the basis of
these financial statements.
The Manager is responsible for the preparation of the financial statements of the Fund
that give a true and fair view in accordance with Malaysian Financial Reporting
Standards and International Financial Reporting Standards. The Manager is also
responsible for such internal control as the Manager determines is necessary to enable the
preparation of financial statements of the Fund that are free from material misstatement,
whether due to fraud or error.
If based on the work we have performed, we conclude that there is a material
misstatement of this other information, we are required to report that fact. We have
nothing to report in this regard.
11

Independent auditors’ report to the unitholders of
Advantage Asia Pacific ex Japan Dividend
(formerly known as AmAdvantage Asia Pacific ex Japan Dividend) (cont’d.)
Other matters
Ernst & Young Wan Daneena Liza Bt Wan Abdul Rahman
AF: 0039 No. 2978/03/18(J)
Chartered Accountants Chartered Accountant
Kuala Lumpur, Malaysia
7 July 2017
Evaluate the overall presentation, structure and content of the financial statements
of the Fund, including the disclosures, and whether the financial statements of the
Fund represent the underlying transactions and events in a manner that achieves
fair presentation.
We communicate with the Manager regarding, among other matters, the planned scope
and timing of the audit and significant audit findings, including any significant
deficiencies in internal control that we identify during our audit.
This report is made solely to the unitholders of the Fund, as a body, and for no other
purpose. We do not assume responsibility to any other person for the content of this
report.
Evaluate the appropriateness of accounting policies used and the reasonableness
of accounting estimates and related disclosures made by the Manager.
Conclude on the appropriateness of the Manager’s use of the going concern basis
of accounting and, based on the audit evidence obtained, whether a material
uncertainty exists related to events or conditions that may cast significant doubt
on the Fund’s ability to continue as a going concern. If we conclude that a
material uncertainty exists, we are required to draw attention in our auditors’
report to the related disclosures in the financial statements or, if such disclosures
are inadequate, to modify our opinion. Our conclusions are based on the audit
evidence obtained up to the date of our auditors’ report. However, future events or
conditions may cause the Fund to cease to continue as a going concern.
12

Advantage Asia Pacific ex Japan Dividend
(formerly known as AmAdvantage Asia Pacific ex Japan Dividend)
STATEMENT OF FINANCIAL POSITION
AS AT 31 MAY 2017
2017 2016
Note RM RM
ASSETS
Investment 4 12,649,239 13,107,221
Deposits with financial institutions 5 462,144 333,831
Amount due from Manager 6 341,541 -
Cash at banks 480,203 2,757
TOTAL ASSETS 13,933,127 13,443,809
LIABILITIES
Amount due to Manager 6 - 28,191
Amount due to Target Fund Manager 7 477,331 -
Amount due to Trustee 8 904 875
Distribution to be reinvested 258,623 -
Sundry payables and accrued expenses 11,313 9,785
TOTAL LIABILITIES 748,171 38,851
EQUITY
Unitholders’ capital 11(a) 8,659,493 11,087,246
Retained earnings 11(b)(c) 4,525,463 2,317,712
TOTAL EQUITY 11 13,184,956 13,404,958
TOTAL EQUITY AND LIABILITIES 13,933,127 13,443,809
UNITS IN CIRCULATION 11 8,620,755 11,009,221
NET ASSET VALUE PER UNIT
− EX DISTRIBUTION 152.94 sen 121.76 sen
The accompanying notes form an integral part of the financial statements.
13

Advantage Asia Pacific ex Japan Dividend
(formerly known as AmAdvantage Asia Pacific ex Japan Dividend)
STATEMENT OF COMPREHENSIVE INCOME
FOR THE FINANCIAL YEAR ENDED 31 MAY 2017
2017 2016
Note RM RM
INVESTMENT INCOME/(LOSS)
Distribution income 195,688 443,990
Interest income 7,997 16,175
Net gain/(loss) from investment:
− Financial assets at fair value through profit or
loss (“FVTPL”) 9 2,325,654 (956,589)
Other unrealised foreign exchange loss (223) -
Gross Income/(Loss) 2,529,116 (496,424)
EXPENDITURE
Manager’s fee − current financial year 6 (34,789) (56,910)
Manager’s fee − over provision in prior financial year 6 - 60,173
Trustee’s fee 8 (10,000) (10,479)
Auditors’ remuneration (6,000) (6,000)
Tax agent’s fee (3,500) (3,500)
Custodian’s fee (50) -
Other expenses 10 (8,403) (5,625)
Total Expenditure (62,742) (22,341)
NET INCOME/(LOSS) BEFORE TAX 2,466,374 (518,765)
LESS: INCOME TAX 13 - -
NET INCOME/(LOSS) AFTER TAX 2,466,374 (518,765)
OTHER COMPREHENSIVE INCOME - -
TOTAL COMPREHENSIVE INCOME/(LOSS) FOR THE
FINANCIAL YEAR 2,466,374 (518,765)
Total comprehensive income/(loss) comprises the following:
Realised income 1,695,334 1,071,271
Unrealised gain/(loss) 771,040 (1,590,036)
2,466,374 (518,765)
14

Advantage Asia Pacific ex Japan Dividend
(formerly known as AmAdvantage Asia Pacific ex Japan Dividend) (cont’d.)
STATEMENT OF COMPREHENSIVE INCOME
FOR THE FINANCIAL YEAR ENDED 31 MAY 2017
2017 2016
Note RM RM
Distributions for the financial year:
Gross/net distributions 14 258,623 630,135
Gross/net distributions per unit (sen) 14 3.00 6.00
The accompanying notes form an integral part of the financial statements.
15

Advantage Asia Pacific ex Japan Dividend
(formerly known as AmAdvantage Asia Pacific ex Japan Dividend)
STATEMENT OF CHANGES IN EQUITY
FOR THE FINANCIAL YEAR ENDED 31 MAY 2017
Unitholders’ Retained Total
capital earnings equity
Note RM RM RM
At 1 June 2015 16,056,417 3,466,612 19,523,029
Total comprehensive loss for
the financial year - (518,765) (518,765)
Creation of units 11(a) 1,817,701 - 1,817,701
Reinvestment of distribution 11(a),14 630,135 - 630,135
Cancellation of units 11(a) (7,417,007) - (7,417,007)
Distribution 14 - (630,135) (630,135)
Balance at 31 May 2016 11,087,246 2,317,712 13,404,958
At 1 June 2016 11,087,246 2,317,712 13,404,958
Total comprehensive income for
the financial year - 2,466,374 2,466,374
Creation of units 11(a) 8,006,643 - 8,006,643
Cancellation of units 11(a) (10,434,396) - (10,434,396)
Distribution 14 - (258,623) (258,623)
Balance at 31 May 2017 8,659,493 4,525,463 13,184,956
The accompanying notes form an integral part of the financial statements.
16

Advantage Asia Pacific ex Japan Dividend
(formerly known as AmAdvantage Asia Pacific ex Japan Dividend)
STATEMENT OF CASH FLOWS
FOR THE FINANCIAL YEAR ENDED 31 MAY 2017
2017 2016
Note RM RM
CASH FLOWS FROM OPERATING AND
INVESTING ACTIVITIES
Proceeds from sale of investment 9,193,392 5,697,197
Distributions received 195,688 443,990
Interest received 7,997 16,175
Manager’s fee paid (34,296) (20,559)
Trustee’s fee paid (9,971) (10,582)
Tax agent’s fee paid (3,290) (3,500)
Custodian’s fee paid (50) -
Payments for other expenses (13,084) (13,059)
Purchase of investment (5,932,649) (1,082,000)
Net cash generated from operating and
investing activities 3,403,737 5,027,662
CASH FLOWS FROM FINANCING ACTIVITIES
Proceeds from creation of units 7,660,739 1,817,701
Payments for cancellation of units (10,458,717) (7,677,744)
Net cash used in infinancing activities (2,797,978) (5,860,043)
NET INCREASE/(DECREASE) IN CASH AND
CASH EQUIVALENTS 605,759 (832,381)
CASH AND CASH EQUIVALENTS AT
BEGINNING OF FINANCIAL YEAR 336,588 1,168,969
CASH AND CASH EQUIVALENTS AT
END OF FINANCIAL YEAR 942,347 336,588
Cash and cash equivalents comprise:
Deposits with financial institutions 5 462,144 333,831
Cash at banks 480,203 2,757
942,347 336,588
The accompanying notes form an integral part of the financial statements.
17

Advantage Asia Pacific ex Japan Dividend
(formerly known as AmAdvantage Asia Pacific ex Japan Dividend)
NOTES TO THE FINANCIAL STATEMENTS
1. GENERAL INFORMATION
2. BASIS OF PREPARATION OF FINANCIAL STATEMENTS
Standards effective during the financial year
Standards issued but not yet effective
Effective for
financial periods
beginning on or after
MFRS 9: Financial Instruments
MFRS 15: Revenue From Contracts With Customers
Advantage Asia Pacific ex Japan Dividend (“the Fund”) was established pursuant to a Deed dated
16 April 2012 as amended by Deeds Supplemental thereto (“the Deed”), between AmFunds
Management Berhad as the Manager, Deutsche Trustees Malaysia Berhad as the Trustee and all
unitholders. By a supplemental Deed dated 23 October 2015, the Fund has changed its name from
AmAdvantage Asia Pacific ex Japan Dividend to Advantage Asia Pacific ex Japan Dividend.
The Fund was set up with the objective to provide income and long term capital growth by
investing in the HSBC Global Investment Funds – Asia Pacific ex Japan Equity High Dividend
(“Target Fund”) which has an investment focus on Asia Pacific ex-Japan equities. Being a feeder
fund, a minimum of 95% of the Fund’s net asset value will be invested in the Target Fund, which
is a separate unit trust fund managed by HSBC Investment Funds (Luxembourg) S.A. (“Target
Fund Manager”). As provided in the Deed, the “accrual period” or financial year shall end on 31
May and the units in the Fund were first offered for sale on 1 August 2012.
The financial statements of the Fund have been prepared in accordance with Malaysian Financial
Reporting Standards (“MFRS”) as issued by the Malaysian Accounting Standards Board
(“MASB”) and are in compliance with International Financial Reporting Standards.
The financial statements of the Fund have been prepared under the historical cost convention,
unless otherwise stated in the accounting policies.
The adoption of MFRS which have been effective during the financial year did not have any
material financial impact to the financial statements.
As at the date of authorisation of these financial statements, the following Standards, which are
relevant to the Fund, have been issued by MASB but are not yet effective and have not been
adopted by the Fund.
1 January 2018
1 January 2018
18

MFRS 9 Financial Instruments
3. SIGNIFICANT ACCOUNTING POLICIES
Income recognition
Income tax
Functional and presentation currency
Foreign currency conversion
Income is recognised to the extent that it is probable that the economic benefits will flow to the
Fund and the income can be reliably measured. Income is measured at the fair value of
consideration received or receivable.
Distribution income is recognised when the Fund’s right to receive payment is established.
Interest income on short-term deposits is recognised on an accrual basis using the effective
interest method.
Current taxes are recognised in profit or loss except to the extent that the tax relates to items
recognised outside profit or loss, either in other comprehensive income or directly in equity.
Transactions in currencies other than the Fund’s functional currency (foreign currencies) are
recorded in the functional currency using exchange rates prevailing at the transaction dates. At
each reporting date, foreign currency monetary items are translated into Ringgit Malaysia at
exchange rates ruling at the reporting date. All exchange gains or losses are recognised in profit or
loss.
Functional currency is the currency of the primary economic environment in which the Fund
operates that most faithfully represents the economic effects of the underlying transactions. The
functional currency of the Fund is Ringgit Malaysia which reflects the currency in which the Fund
competes for funds, issues and redeems units. The Fund has also adopted Ringgit Malaysia as its
presentation currency.
MFRS 9 reflects International Accounting Standards Board’s (“IASB”) work on the replacement
of MFRS 139 Financial Instruments: Recognition and Measurement (“MFRS 139”). MFRS 9 will
be effective for financial year beginning on or after 1 January 2018. The Fund is in the process of
quantifying the impact of the first adoption of MFRS 9.
The Fund plans to adopt the above pronouncements when they become effective in the respective
financial periods. These pronouncements are expected to have no significant impact to the
financial statements of the Fund upon their initial application except as described below:
Current tax assets and liabilities are measured at the amount expected to be recovered from or
paid to the tax authorities. The tax rates and tax laws used to compute the amount are those that
are enacted or substantively enacted at the reporting date.
19

Statement of cash flows
Distribution
Unitholders’ capital
Financial assets
(i) Financial assets at FVTPL
The Fund adopts the direct method in the preparation of the statement of cash flows.
Cash equivalents are short-term, highly liquid investment that is readily convertible to cash with
insignificant risk of changes in value.
Distributions are at the discretion of the Fund. A distribution to the Fund’s unitholders is
accounted for as a deduction from realised reserve. A proposed distribution is recognised as a
liability in the period in which it is approved.
Subsequent to initial recognition, financial assets at FVTPL are measured at fair value.
Changes in the fair value of those financial instruments are recorded in ‘Net gain or loss on
financial assets at fair value through profit or loss’. Distribution revenue and interest earned
elements of such instruments are recorded separately in ‘Distribution income’ and ‘Interest
income’ respectively. Exchange differences, if any, on financial assets at FVTPL are not
recognised separately in profit or loss but are included in net gains or net losses on changes in
fair value of financial assets at FVTPL.
The unitholders’ capital of the Fund meets the definition of puttable instruments and is classified
as equity instruments under MFRS 132 Financial Instruments: Presentation (“MFRS 132”).
Financial assets are classified as financial assets at FVTPL if they are held for trading or are
designated as such upon initial recognition. Financial assets held for trading by the Fund
include foreign collective investment scheme acquired principally for the purpose of selling in
the near term.
The Fund determines the classification of its financial assets at initial recognition, and the
categories applicable to the Fund include financial assets at fair value through profit or loss
(“FVTPL”) and loans and receivables.
Financial assets are recognised in the statement of financial position when, and only when, the
Fund becomes a party to the contractual provisions of the financial instrument.
When financial assets are recognised initially, they are measured at fair value, plus, in the case of
financial assets not at fair value through profit or loss, directly attributable transaction costs.
20

(ii) Loans and receivables
Impairment of financial assets
(i) Loans and receivables carried at amortised cost
Financial liabilities
For investment in foreign collective investment scheme, fair value is determined based on the
closing net asset value per unit of the foreign collective investment scheme. The difference
between the cost and fair value is treated as unrealised gain or loss and is recognised in profit
or loss. Unrealised gains or losses recognised in profit or loss are not distributable in nature.
Financial assets with fixed or determinable payments that are not quoted in an active market
are classified as loans and receivables.
The carrying amount of the financial asset is reduced through the use of an allowance
account. When loans and receivables become uncollectible, they are written off against the
allowance account.
Financial liabilities are classified according to the substance of the contractual arrangements
entered into and the definitions of a financial liability.
On disposal of investment, the net realised gain or loss on disposal is measured as the
difference between the net disposal proceeds and the carrying amount of the investment. The
net realised gain or loss is recognised in profit or loss.
If in a subsequent period, the amount of the impairment loss decreases and the decrease can
be related objectively to an event occurring after the impairment was recognised, the
previously recognised impairment loss is reversed to the extent that the carrying amount of
the asset does not exceed its amortised cost at the reversal date. The amount of reversal is
recognised in profit or loss.
The Fund assesses at each reporting date whether there is any objective evidence that a financial
asset is impaired.
To determine whether there is objective evidence that an impairment loss on financial assets
has been incurred, the Fund considers factors such as the probability of insolvency or
significant financial difficulties of the debtor and default or significant delay in payments.
Subsequent to initial recognition, loans and receivables are measured at amortised cost using
the effective interest method. Gains and losses are recognised in profit or loss when the loans
and receivables are derecognised or impaired, and through the amortisation process.
If any such evidence exists, the amount of impairment loss is measured as the difference
between the asset’s carrying amount and the present value of estimated future cash flows
discounted at the financial asset’s original effective interest rate. The impairment loss is
recognised in profit or loss.
21

Classification of realised and unrealised gains and losses
Significant accounting estimates and judgments
The Fund’s financial liabilities are recognised initially at fair value plus directly attributable
transaction costs and subsequently measured at amortised cost using the effective interest method.
Financial liabilities, within the scope of MFRS 139, are recognised in the statement of financial
position when, and only when, the Fund becomes a party to the contractual provisions of the
financial instrument.
A financial liability is derecognised when the obligation under the liability is extinguished. Gains
and losses are recognised in profit or loss when the liabilities are derecognised, and through the
amortisation process.
Unrealised gains and losses comprise changes in the fair value of financial instruments for the
period and from reversal of prior period’s unrealised gains and losses for financial instruments
which were realised (i.e. sold, redeemed or matured) during the reporting period.
Realised gains and losses on disposals of financial instruments classified at fair value through
profit or loss are calculated using the weighted average method. They represent the difference
between an instrument’s initial carrying amount and disposal amount.
The Fund classifies its investment as financial assets at FVTPL as the Fund may sell its
investment in the short-term for profit-taking or to meet unitholders’ cancellation of units.
No major judgments have been made by the Manager in applying the Fund’s accounting policies.
There are no key assumptions concerning the future and other key sources of estimation
uncertainty at the reporting date, that have a significant risk of causing a material adjustment to
the carrying amounts of assets and liabilities within the next financial year.
The preparation of the Fund’s financial statements requires the Manager to make judgments,
estimates and assumptions that affect the reported amounts of revenues, expenses, assets and
liabilities, and the disclosure of contingent liabilities at the reporting date. However, uncertainty
about these assumptions and estimates could result in outcomes that could require a material
adjustment to the carrying amount of the asset or liability in the future.
22

4. INVESTMENT
2017 2016
RM RM
Financial assets at FVTPL
At cost:
Foreign collective investment scheme 10,603,284 11,832,529
At fair value:
Foreign collective investment scheme 12,649,239 13,107,221
Details of investment as at 31 May 2017 are as follows:
Fair
value as a
percentage of
Foreign collective Number Fair Purchase net asset
investment scheme of units value cost value
RM RM %
HSBC Global Investment
Funds – Asia Pacific ex
Japan Equity High
Dividend (“Target Fund”) 163,856 12,649,239 10,603,284 95.94
Excess of fair value over cost 2,045,955
2017 2016
% of % of
By country portfolio portfolio
Australia 18.9 18.4
China 18.4 18.2
Taiwan 15.9 14.4
Hong Kong 12.7 16.3
Korea 12.6 9.3
India 9.3 6.1
Indonesia 3.6 -
Singapore 3.4 7.9
(Forward)
A minimum of 95% of its net asset value will be invested in the Target Fund. However, the asset
allocation may be reduced due to creation of units at the point of reporting date. The ratio will be
adjusted back to the minimum level after the reporting period, if need be.
The Target Fund’s investment objective and policy are to seek long-term capital growth and a
high level of income by investing primarily in a diversified portfolio of investment in equity Asia
Pacific (ex-Japan region). As at the reporting date, the investment portfolio of the Target Fund is
made up as the following:
23

2017 2016
% of % of
portfolio portfolio
New Zealand 1.6 -
Malaysia 0.8 -
Cash and others 2.8 9.4
100.0 100.0
By sector
Financials 30.4 27.5
Technology 24.7 15.1
Telecommunications 10.1 14.4
Consumer staples 9.9 12.5
Energy 7.8 4.9
Materials 7.0 -
Industrials 3.5 12.3
Consumer discretionary 2.2 -
Real estate 1.1 -
Utilities 0.8 6.0
Cash and others 2.5 7.3
100.0 100.0
5. DEPOSITS WITH FINANCIAL INSTITUTIONS
2017 2016
RM RM
At nominal value:
Short-term deposits with licensed banks 462,100 333,800
At carrying value:
Short-term deposits with licensed banks 462,144 333,831
Details of deposits with financial institutions as at 31 May 2017 are as follows:
Carrying
value as a
percentage of
Maturity Nominal Carrying Purchase net asset
date Bank value value cost value
RM RM RM %
Short-term deposit with a licensed bank
01.06.2017 Public Bank
Berhad 462,100 462,144 462,100 3.51
24
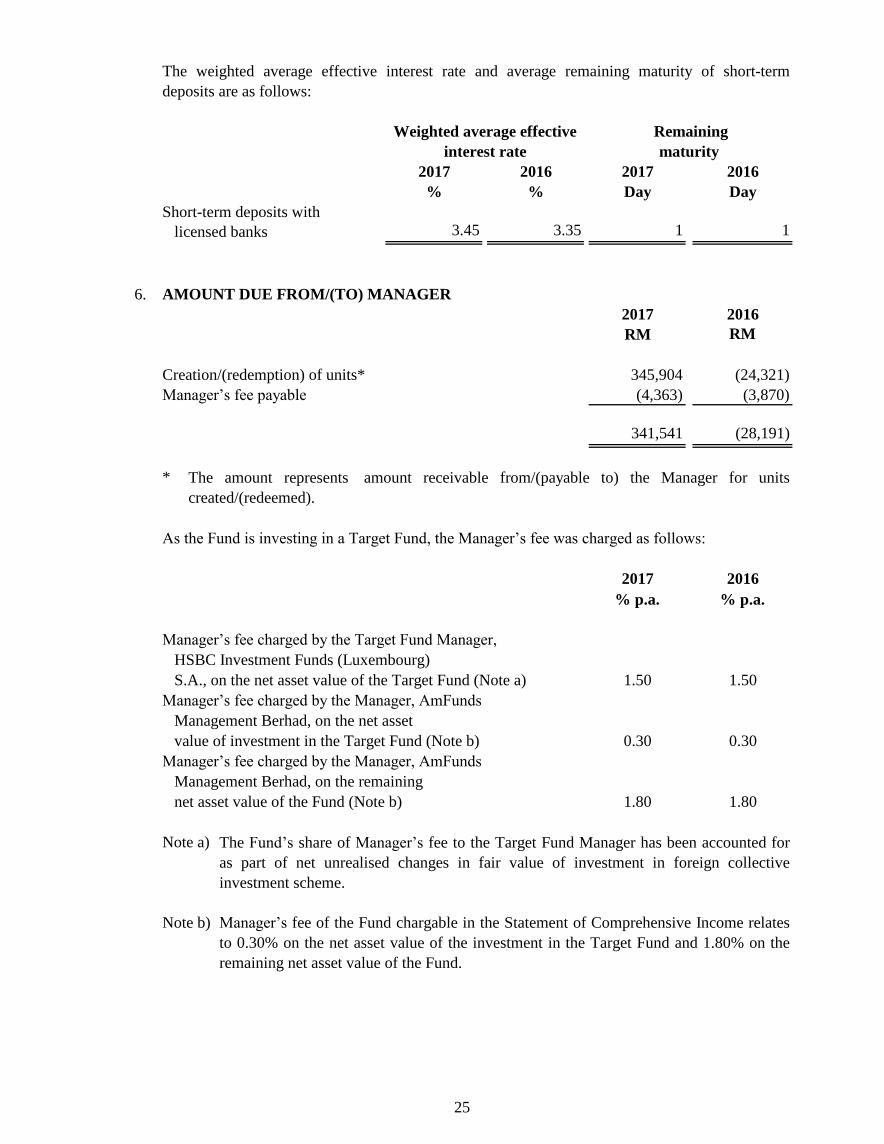
2017 2016 2017 2016
% % Day Day
Short-term deposits with
licensed banks 3.45 3.35 1 1
6. AMOUNT DUE FROM/(TO) MANAGER
2017 2016
RM RM
Creation/(redemption) of units* 345,904 (24,321)
Manager’s fee payable (4,363) (3,870)
341,541 (28,191)
*
As the Fund is investing in a Target Fund, the Manager’s fee was charged as follows:
2017 2016
% p.a. % p.a.
Manager’s fee charged by the Target Fund Manager,
HSBC Investment Funds (Luxembourg)
S.A., on the net asset value of the Target Fund (Note a) 1.50 1.50
Manager’s fee charged by the Manager, AmFunds
Management Berhad, on the net asset
value of investment in the Target Fund (Note b) 0.30 0.30
Manager’s fee charged by the Manager, AmFunds
Management Berhad, on the remaining
net asset value of the Fund (Note b) 1.80 1.80
Note a)
Note b)
The Fund’s share of Manager’s fee to the Target Fund Manager has been accounted for
as part of net unrealised changes in fair value of investment in foreign collective
investment scheme.
interest rate
Weighted average effective Remaining
maturity
The amount represents amount receivable from/(payable to) the Manager for units
created/(redeemed).
Manager’s fee of the Fund chargable in the Statement of Comprehensive Income relates
to 0.30% on the net asset value of the investment in the Target Fund and 1.80% on the
remaining net asset value of the Fund.
The weighted average effective interest rate and average remaining maturity of short-term
deposits are as follows:
25

7. AMOUNT DUE TO TARGET FUND MANAGER
The normal trade credit period is three business days.
8. AMOUNT DUE TO TRUSTEE
9. NET GAIN/(LOSS) FROM INVESTMENT
2017 2016
RM RM
Net gain/(loss) on financial assets at FVTPL comprised:
− Net realised loss on sale of investment (434,741) (594,392)
− Net realised gain on foreign currency exchange 1,989,132 1,227,839
− Net unrealised gain/(loss) on changes in fair value
of investment 2,546,136 (2,617,149)
− Net unrealised (loss)/gain on foreign currency fluctuation
of investment denominated in foreign currency (1,774,873) 1,027,113
2,325,654 (956,589)
10. OTHER EXPENSES
The Manager’s fee, inclusive of GST, was overstated by RM62,903 for the period from 13 March
2015 to 19 June 2015. No adjustment was made to the Fund’s NAV as the impact was less than
0.5% to the Fund’s NAV. The amount was refunded to the Fund in the previous financial year.
The normal credit period in the previous and current financial years for creation and redemption
of units is three business days.
The normal credit period in the previous and current financial years for Manager’s fee payable is
one month.
Trustee’s fee is at a rate of 0.06% (2016: 0.06%) per annum on the net asset value of the Fund,
calculated on a daily basis, subject to a minimum fee of RM10,000 per annum.
The normal credit period in the previous and current financial years for Trustee’s fee payable is
one month.
Included in other expenses is Goods and Services Tax incurred by the Fund during the financial
year amounting to RM3,976 (2016: RM2,018).
The amount due to the Target Fund Manager was for the purchase of investment where settlement
was not due as at the financial year end.
26

11. TOTAL EQUITY
Total equity is represented by:
2017 2016
Note RM RM
Unitholders’ capital (a) 8,659,493 11,087,246
Retained earnings
− Realised income (b) 2,479,731 1,043,020
− Unrealised gain (c) 2,045,732 1,274,692
13,184,956 13,404,958
(a) UNITHOLDERS’ CAPITAL/UNITS IN CIRCULATION
Number of Number of
units RM units RM
At beginning of the
financial year 11,009,221 11,087,246 14,923,729 16,056,417
Creation during the
financial year 5,287,993 8,006,643 1,415,470 1,817,701
Distribution reinvested
(Note 14) - - 527,266 630,135
Cancellation during the
financial year (7,676,459) (10,434,396) (5,857,244) (7,417,007)
At end of the financial year 8,620,755 8,659,493 11,009,221 11,087,246
(b) REALISED – DISTRIBUTABLE
2017 2016
RM RM
At beginning of the financial year 1,043,020 601,884
Total comprehensive income/(loss) for the financial year 2,466,374 (518,765)
Net unrealised (gain)/loss attributable to investment held
and others transferred to unrealised reserve [Note 11(c)] (771,040) 1,590,036
Distributions out of realised reserve (Note 14) (258,623) (630,135)
Net increase in realised reserve for the
financial year 1,436,711 441,136
At end of the financial year 2,479,731 1,043,020
2017 2016
27
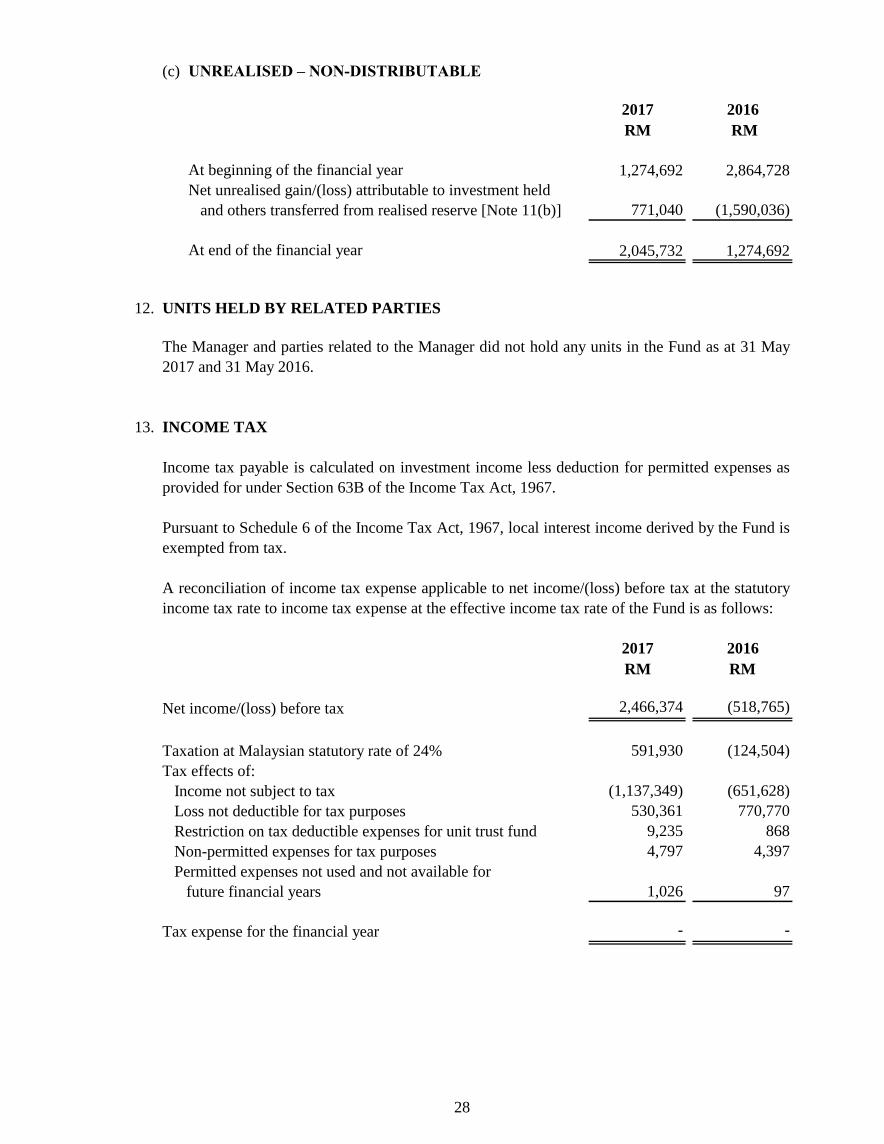
(c) UNREALISED – NON-DISTRIBUTABLE
2017 2016
RM RM
At beginning of the financial year 1,274,692 2,864,728
Net unrealised gain/(loss) attributable to investment held
and others transferred from realised reserve [Note 11(b)] 771,040 (1,590,036)
At end of the financial year 2,045,732 1,274,692
12. UNITS HELD BY RELATED PARTIES
13. INCOME TAX
2017 2016
RM RM
Net income/(loss) before tax 2,466,374 (518,765)
Taxation at Malaysian statutory rate of 24% 591,930 (124,504)
Tax effects of:
Income not subject to tax (1,137,349) (651,628)
Loss not deductible for tax purposes 530,361 770,770
Restriction on tax deductible expenses for unit trust fund 9,235 868
Non-permitted expenses for tax purposes 4,797 4,397
Permitted expenses not used and not available for
future financial years 1,026 97
Tax expense for the financial year - -
The Manager and parties related to the Manager did not hold any units in the Fund as at 31 May
2017 and 31 May 2016.
Income tax payable is calculated on investment income less deduction for permitted expenses as
provided for under Section 63B of the Income Tax Act, 1967.
Pursuant to Schedule 6 of the Income Tax Act, 1967, local interest income derived by the Fund is
exempted from tax.
A reconciliation of income tax expense applicable to net income/(loss) before tax at the statutory
income tax rate to income tax expense at the effective income tax rate of the Fund is as follows:
28

14. DISTRIBUTIONS
2017 2016
RM RM
Distribution income 67,662 171,619
Interest income 2,765 6,252
Net realised loss on sale of investment (434,741) -
Net realised gain on foreign currency exchange 685,679 474,605
321,365 652,476
Less: Expenses (62,742) (22,341)
Total amount of distributions 258,623 630,135
Gross/net distributions per unit (sen) 3.00 6.00
Distributions made out of:
− Realised reserve [Note 11(b)] 258,623 630,135
258,623 630,135
Comprising:
Distributions reinvested [Note 11(a)] - 630,135
Distributions to be reinvested 258,623 -
258,623 630,135
15. MANAGEMENT EXPENSE RATIO (“MER”)
2017 2016
% p.a. % p.a.
Manager’s fee 0.35 (0.02)
Trustee’s fee 0.10 0.06
Fund’s other expenses 0.18 0.10
Total MER 0.63 0.14
The Fund’s MER is as follows:
Distributions to unitholders declared on 31 May 2017 (declared on 25 May 2016 for the previous
financial year) are from the following sources:
29

16. PORTFOLIO TURNOVER RATIO (“PTR”)
17. SEGMENTAL REPORTING
18.
Target Fund Manager
RM %
HSBC Investment Funds (Luxembourg) S.A. 15,606,338 100.00
19. FINANCIAL INSTRUMENTS
(a) Classification of financial instruments
The above transactions were in respect of collective investment scheme. Transactions in these
investments do not involve any commission or brokerage.
The significant accounting policies in Note 3 describe how the classes of financial
instruments are measured, and how income and expenses, including fair value gains and
losses, are recognised. The following table analyses the financial assets and liabilities of the
Fund in the statement of financial position as by the class of financial instrument to which
they are assigned, and therefore by the measurement basis.
As stated in Note 1, the Fund is a feeder fund whereby a minimum of 95% of the Fund’s net asset
value will be invested in the Target Fund.
Transaction value
Details of transactions with the Target Fund Manager for the financial year ended 31 May 2017
are as follows:
The MER of the Fund is the ratio of the sum of annualised fees and expenses incurred by the
Fund to the average net asset value of the Fund calculated on a daily basis.
The PTR of the Fund, which is the ratio of average total acquisitions and disposals of investment
to the average net asset value of the Fund calculated on a daily basis, is 0.78 times (2016: 0.21
times).
As the Fund operates substantially as a feeder fund which invests primarily in the Target Fund, it
is not possible or meaningful to classify its investment by separate business or geographical
segments. A summary of the investment portfolio of the Target Fund is disclosed in Note 4.
TRANSACTIONS WITH THE TARGET FUND MANAGER
30

Loans and Financial Financial receivables liabilities at
assets at amortised amortised
at FVTPL cost cost Total
RM RM RM RM
Assets
Investment 12,649,239 - - 12,649,239
Deposit with financial
institution - 462,144 - 462,144
Amount due from Manager - 341,541 - 341,541
Cash at banks - 480,203 - 480,203
Total financial assets 12,649,239 1,283,888 - 13,933,127
Liabilities
Amount due to Target Fund
Manager - - 477,331 477,331
Amount due to Trustee - - 904 904
Distribution to be reinvested - - 258,623 258,623
Sundry payables and accrued
expenses - - 11,313 11,313
Total financial liabilities - - 748,171 748,171
Assets
Investment 13,107,221 - - 13,107,221
Deposit with financial
institution - 333,831 - 333,831
Cash at banks - 2,757 - 2,757
Total financial assets 13,107,221 336,588 - 13,443,809
Liabilities
Amount due to Manager - - 28,191 28,191
Amount due to Trustee - - 875 875
Sundry payables and accrued
expenses - - 9,785 9,785
Total financial liabilities - - 38,851 38,851
2016
2017
31

Income, expense, gains
and losses
2017 2016
RM RM
Net gain/(loss) from financial assets at FVTPL 2,325,654 (956,589)
Income, of which derived from:
- Distribution income from financial assets at FVTPL 195,688 443,990
- Interest income from loans and receivables 7,997 16,175
- Other unrealised foreign exchange loss (223) -
(b) Financial instruments that are carried at fair value
Level 1: quoted (unadjusted) prices in active markets for identical assets or liabilities;
Level 2:
Level 3:
Level 1 Level 2 Level 3 Total
RM RM RM RM
- 12,649,239 - 12,649,239
- 13,107,221 - 13,107,221
(c)
Deposits with financial institutions
Cash at banks
Amount due from/to Manager
Amount due to Target Fund Manager
other techniques for which all inputs which have a significant effect on the
recorded fair values are observable; either directly or indirectly; or
techniques which use inputs which have a significant effect on the recorded fair
value that are not based on observable market data.
The following table shows an analysis of financial instruments recorded at fair value by the
level of the fair value hierarchy:
The Fund’s financial assets and liabilities at FVTPL are carried at fair value.
2017
The Fund uses the following hierarchy for determining and disclosing the fair value of
financial instruments by valuation technique:
Financial assets at FVTPL
2016
Financial assets at FVTPL
Financial instruments that are not carried at fair value and whose carrying amounts are
reasonable approximation of fair value
The following are classes of financial instruments that are not carried at fair value and whose
carrying amounts are reasonable approximation of fair value due to their short period to
maturity or short credit period:
32

Amount due to Trustee
Distribution to be reinvested
Sundry payables and accrued expenses
20. RISK MANAGEMENT POLICIES
Market risk
(i) Price risk
Percentage movements in
price by: 2017 2016
RM RM
-5.00% (632,462) (655,361)
+5.00% 632,462 655,361
(ii) Interest rate risk
Interest rate risk will affect the value of the Fund’s investments, given the interest rate
movements, which are influenced by regional and local economic developments as well as
political developments.
Market risk, in general, is the risk that the value of a portfolio would decrease due to changes in
market risk factors such as equity prices, interest rates, foreign exchange rates and commodity
prices.
Risk management is carried out by closely monitoring, measuring and mitigating the above said
risks, careful selection of investment coupled with stringent compliance to investment restrictions
as stipulated by the Capital Market and Services Act 2007, Securities Commission’s Guidelines
on Unit Trust Funds and the Deed as the backbone of risk management of the Fund.
The Fund is exposed to a variety of risks that include market risk, credit risk, liquidity risk, single
issuer risk, regulatory risk, country risk, management risk, and non-compliance risk.
There are no financial instruments which are not carried at fair values and whose carrying
amounts are not reasonable approximation of their respective fair values.
The result below summarized the price risk sensitivity of the Fund’s NAV due to movements
of price by -5.00% and +5.00% respectively.
Sensitivity of the Fund’s NAV (RM)
Price risk refers to the uncertainty of an investment’s future prices. In the event of adverse
price movements, the Fund might endure potential loss on its investment in the Target Fund.
In managing price risk, the Manager actively monitors the performance and risk profile of the
investment portfolio.
33

Parallel shift in yield curve by:
2017 2016
RM RM
+100bps (12) (8)
-100bps 12 9
(iii) Currency risk
Currencies other than the
Fund’s functional currency: 2017 2016
RM RM
-5.00% (632,470) (655,361)
+5.00% 632,470 655,361
2017 2016
Assets/(liabilities) dominated RM % of net RM % of net
in United States Dollar equivalent asset value equivalent asset value
Investment 12,649,239 95.94 13,107,221 97.78
Cash at bank 477,499 3.62 - -
Amount due to Target
Fund Manager (477,331) (3.62) - -
12,649,407 95.94 13,107,221 97.78
The result below summarised the interest rate sensitivity of the Fund’s NAV, or theoretical
value (applicable to money market deposit) due to the parallel movement assumption of the
yield curve by +100bps and -100bps respectively:
Currency risk is associated with the Fund’s assets and liabilities that are denominated in
currencies other than the Fund’s base currency. Currency risk refers to the potential loss the
Fund might face due to unfavorable fluctuations of currencies other than the Fund’s base
currency against the Fund’s base currency.
Sensitivity of the Fund’s NAV, or theoretical value
The result below summarised the currency risk sensitivity of the Fund’s NAV due to
appreciation/depreciation of the Fund’s functional currency against currencies other than the
Fund’s functional currency.
Sensitivity of the Fund’s NAV
The net unhedged financial assets and financial liabilities of the Fund that are not
denominated in Fund’s functional currency are as follows:
Domestic interest rates on deposits and placements with licensed financial institutions are
determined based on prevailing market rates.
34

Credit risk
Liquidity risk
Single issuer risk
Regulatory risk
Country risk
Credit risk is the risk that the counterparty to a financial instrument will cause a financial loss to
the Fund by failing to discharge an obligation. Credit risk applies to short-term deposits and
distributions receivables. The issuer of such instruments may not be able to fulfill the required
interest payments or repay the principal invested or amount owing. These risks may cause the
Fund’s investment to fluctuate in value.
The Fund, as a feeder fund, invests significantly all its assets in the Target Fund. The Target Fund
manages the risk by setting internal counterparty limits and undertaking internal credit evaluation
to minimise such risk.
For deposits with financial institutions, the Fund makes placements with financial institutions
with sound rating of P1/MARC-1 and above. Cash at banks are held for liquidity purposes and are
not exposed to significant credit risk.
Liquidity risk is defined as the risk of being unable to raise funds or borrowings to meet payment
obligations as they fall due. This is also the risk of the Fund experiencing large redemptions, when
the Investment Manager could be forced to sell large volumes of its holdings at unfavorable prices
to meet redemption requirements.
The risk of price fluctuation in foreign securities may arise due to political, financial and
economic events in foreign countries. If this occurs, there is a possibility that the net asset value of
the Fund may be adversely affected.
The Fund maintains a sufficient level of liquid assets, after consultation with the Trustee, to meet
anticipated payments and cancellation of units by unitholders. Liquid assets comprise of deposits
with licensed financial institutions and other instruments, which are capable of being converted
into cash within 5 to 7 days. The Fund’s policy is to always maintain a prudent level of liquid
assets so as to reduce liquidity risk.
Any changes in national policies and regulations may have effects on the capital market and the
net asset value of the fund.
The Fund, as a feeder fund, invests significantly all its assets in the Target Fund. The Target Fund
is restricted from investing in securities issued by any issuer in excess of a certain percentage of
its net asset value. Under such restriction, the risk exposure to the securities of any single issuer is
diversified and managed by the Target Fund Manager based on internal/external ratings.
35

Management risk
Non-compliance risk
21. CAPITAL MANAGEMENT
No changes were made in the objective, policies or processes during the financial years ended 31
May 2017 and 31 May 2016.
The primary objective of the Fund’s capital management is to ensure that it maximises
unitholders’ value by expanding its fund size to benefit from economies of scale and achieving
growth in net asset value from the performance of its investment.
The Fund manages its capital structure and makes adjustments to it, in light of changes in
economic conditions. To maintain or adjust the capital structure, the Fund may issue new or bonus
units, make distribution payment, or return capital to unitholders by way of redemption of units.
The specific risks associated to the Target Fund include market risk, securities risk, emerging
market risk, settlement and credit risks, regulatory and accounting standards risks, political risk,
custody risk and liquidity risk.
This is the risk of the Manager, the Trustee or the Fund not complying with internal policies, the
Deed of the Fund, securities law or guidelines issued by the regulators. Non-compliance risk may
adversely affect the investment of the Fund when the Fund is forced to rectify the non-compliance.
Poor management of the Fund may cause considerable losses to the Fund that in turn may affect
the net asset value of the Fund.
36

Advantage Asia Pacific ex Japan Dividend
(formerly known as AmAdvantage Asia Pacific ex Japan Dividend)
STATEMENT BY THE MANAGER
Kuala Lumpur, Malaysia
I, GOH WEE PENG, for and on behalf of the Manager, AmFunds Management Berhad, for
Advantage Asia Pacific ex Japan Dividend (formerly known as AmAdvantage Asia Pacific ex
Japan Dividend) do hereby state that in the opinion of the Manager, the accompanying statement of
financial position, statement of comprehensive income, statement of changes in equity, statement of
cash flows and the accompanying notes are drawn up in accordance with Malaysian Financial
Reporting Standards and International Financial Reporting Standards so as to give a true and fair
view of the financial position of the Fund as at 31 May 2017 and the comprehensive income, the
changes in equity and cash flows of the Fund for the financial year then ended.
7 July 2017
GOH WEE PENG
For and on behalf of the Manager
AmFunds Management Berhad
37

38
TRUSTEE’S REPORT

39
DIRECTORY
Head Office 9th Floor, Bangunan Ambank Group
55, Jalan Raja Chulan, 50200 Kuala Lumpur
Tel: (03) 2032 2888 Facsimile: (03) 2031 5210
Email: [email protected]
Postal Address AmFunds Management Berhad
P.O Box 13611, 50816 Kuala Lumpur
Related Institutional Unit Trust Agent
AmBank (M) Berhad Head Office
Company No. 8515-D 31st Floor, Menara AmBank
No. 8 Jalan Yap Kwan Seng, 50450 Kuala Lumpur
AmInvestment Bank Berhad Head Office
Company No. 23742-V 22nd
Floor, Bangunan AmBank Group
55 Jalan Raja Chulan, 50200 Kuala Lumpur
For more details on the list of IUTAs, please contact the Manager.
For enquiries about this or any of the other Funds offered by AmFunds Management Berhad
Please call 2032 2888 between 8.45 a.m. to 5.45 p.m. (Monday to Thursday),
Friday (8.45 a.m. to 5.00 p.m.)

Semi-Annual Report28 February 2015
03 2132 2888 | aminvest.com | [email protected]
AmFunds Management Berhad (155432-A)