Embed Size (px)
Citation preview

Article
Mercator, Fortaleza, v.20,e20012, 2021. ISSN:1984-2201
ADVANCES IN THE APPLICATION OF DIGITALELEVATION MODELS (DEMS) FOR THEEVALUATION OF COASTAL FLOODING
https://doi.org/10.4215/rm2021.e20012 Deivid Cristian Leal Alves ᵃ* - Jair Weschenfelder ᵇ - Marlize Ferreira-Cravo ᶜ
Jean Marcel de Almeida Espinoza ᵈ - Miguel da Guia Albuquerque ᵉ
(a) PhD in Geosciences. PhD at the Federal University of Rio Grande do Sul, Rio Grande (RS), Brazil.ORCID: https://orcid.org/0000-0002-5255-123X. LATTES: http://lattes.cnpq.br/0474544570586478.(b) PhD in Geosciences. Professor at the Federal University of Rio Grande do Sul, Porto Alegre (RS), Brazil.ORCID: http://orcid.org/0000-0002-2075-4067. LATTES: http://lattes.cnpq.br/8238208232722890.(c) PhD in General Physiology. PhD at the University of São Paulo, São Paulo (SP), Brazil.ORCID: https://orcid.org/0000-0003-3319-3905. LATTES: http://lattes.cnpq.br/0923709721819367.(d) PhD in Remote Sensing. Professor at the Federal Institute of Santa Catarina, Caçador (SC), Brazil.ORCID: https://orcid.org/0000-0002-7933-2897. LATTES: http://lattes.cnpq.br/7921732083845430.(e) PhD in Geosciences. Professor at the Federal Institute of Education, Science and Technology of Rio Grande do Sul, Rio Grande (RS),Brazil.ORCID: https://orcid.org/0000-0002-2063-492X. LATTES: http://lattes.cnpq.br/8060060047535482.
(*) CORRESPONDING AUTHORAddress: UFRG. Av. Itália, s/n, km 8, Carreiro. Rio Grande (RS), Brazil. CEP:96203-900. Phone: (+55 53) 32336500. E-mail: [email protected]
Article history:Received 20 September, 2020 Accepted 30 December, 2020
Published 15 April, 2021
AbstractMeteoceanographic forces act daily, provoking rapid changes in coastal geomorphology and impacting the human infrastructure located near thesea, principally on low-lying coasts. The current ongoing rise in sea level provoked by climate change is also a major source of concern for localand regional authorities. Geospatial models of coastal flooding are evolving rapidly, together with geomorphometric tools and their applications.These initiatives may permit the implementation of medium-and long term actions to minimize the effects of flooding, although a range ofmethodological considerations must be taken into account. Digital Elevation Models (DEMs) have become increasingly more accurate due to theintegration of altimetric references and vertical data, as well as the increasing quality of the sensors used. For example, the application of thebathtub approach to coastal flooding assessment has been relatively successful. The choice of the flood model should include the careful selection ofmethods that ensure the most adequate application of the model.
Keywords: Geomorphometry, Low-Lying Coastal Areas, Coastal Surveying, Remote Sensing.
Resumo / ResumenAVANÇOS NA APLICAÇÃO DE MODELOS DIGITAIS DE ELEVAÇÃO (MDES) PARA AVALIAÇÃO DE INUNDAÇÕESCOSTEIRAS
As forçantes meteoceanográficas agem diariamente com rápidas mudanças na geomorfologia costeira e nas construções humanas localizadas pertodo mar, em especial nas áreas de baixa elevação. Atualmente, a subida do nível do mar potencialmente promovida pelas mudanças climáticas étambém uma fonte de grande preocupação para os órgãos públicos de poder local e regional. Nesse sentido, os modelos geoespaciais de inundaçãocosteira estão evoluindo juntamente com as ferramentas morfométricas e suas aplicações. Essas iniciativas permitem ações de médio e longo prazopara minimizar os efeitos das inundações. Para tanto, uma série de etapas metodológicas devem ser analisadas. Os Modelos Digitais de Elevação(MDEs) tornam-se cada vez mais precisos com relação ao emprego de referências altimétricas e de dados verticais, bem como a qualidade deaquisição dos sensores empregados. Por exemplo, o uso da abordagem bathtub tem sido aplicada na avaliação da inundação costeira com relativosucesso. A escolha do próprio modelo de inundação deve acompanhar um esforço metodológico seletivo para sua correta aplicação.
Palavras-chave: Geomorfometria, Áreas Costeiras Baixas, Levantamento Costeiro, Sensoriamento Remoto.
AVANCES EN LA APLICACIÓN DE MODELOS DIGITALES DE ELEVACIÓN (MDES) PARA LA EVALUACIÓN DEINUNDACIONES COSTERAS
Los factores de cambio meteorológicos y oceanográficos actúan diariamente con rápidas variaciones en la geomorfología costera y lasconstrucciones humanas ubicadas cerca del mar, especialmente en áreas de baja elevación. Actualmente, la subida del nivel del mar, que espotencialmente promovida por el cambio climático, también es motivo de gran preocupación para los organismos públicos del poder local yregional. Respondiendo a esa motivación, los modelos geoespaciales de inundaciones costeras están evolucionando junto con las herramientasmorfométricas y sus aplicaciones. Estas iniciativas permiten acciones de mediano y largo plazo para mermar los efectos de las inundaciones. Portanto, se deben analizar una serie de pasos metodológicos. Los Modelos Digitales de Elevación (MDE) son cada vez más precisos en cuanto al usode referencias altimétricas y datos verticales, así que a la calidad de adquisición de los sensores empleados. Por ejemplo, el uso del enfoque decuenca se ha aplicado para evaluar las inundaciones costeras con relativo éxito. La elección del propio modelo de inundación debe acompañar a unesfuerzo metodológico selectivo para su correcta aplicación.
Palabras-clave: Geomorfometría, Zonas Costeras Bajas, Estudio Costero, Teledetección.
This is an open access article under the CC BY Creative Commons licenseCopyright © 2021, Universidade Federal do Ceará. 1/19

Deivid Cristian Leal Alves - Jair Weschenfelder - Marlize Ferreira-Cravo - Jean Marcel de Almeida Espinoza
INTRODUCTION Modifications of the coastline caused by climate change are one of the principal preoc-cupations
of the 21st century, with direct repercussions for coastal zone management around the globe. Climatechange is a major driver of land loss from rising sea levels, with an estimated economic impact ofapproximately US$ 60 billion per year from coastal flooding over the next few decades(HALLEGATTE et al., 2013). Nicholls et al. (2014) concluded that an increase in sea levels resultingfrom global warming may be inevitable, although the velocity and exact con-figuration of these changesare still unclear. Despite the inherent uncertainties associated with climate modeling, most predictionsindicate a substantial rise in sea levels, and adequate tools are required to evaluate potential damage(NICHOLLS et al., 2014; KRUEL, 2016).
Coastal flooding models based on surface analysis have garnered widespread attention in theinternational scientific community. Increasing access to technology, such as Light Detection AndRanging (LiDAR) and Unmanned Aerial Vehicles (UAVs) with sensors, has enabled the gathering ofhigh-resolution topographic data rapidly, and with considerable precision (EAKINS & GROTHE, 2014;NEX & REMONDINO, 2014). Over the past decade, these technologies, combined with the GlobalSatellite Navigation Systems (GNSS), have permitted researchers to increase significantly the number ofstudies that assess the impacts of sea level modifications (ANTONIOLI et al., 2017), especially onlow-lying coasts, which have a reduced altimetric am-plitude (WONG et al., 2014).
The international literature covers a wide spectrum of computational tools for the georeferencing,forecasting, and evaluation of coastal flooding (LICHTER & FELSENSTEIN, 2012), whether the resultof temporary transgressions of the coastline or processes on a regional or even a global scale, based onpredictions of rising sea levels. In Brazil, for example, the stud-ies of Guimarães et al. (2015), Maia etal. (2016), Aguiar et al. (2018), Leal-Alves et al. (2020), and Silva et al. (2020) have demonstrated thepotential of using DEMs, combined with surface hydrological modeling, for the generation of coastalflooding scenarios based on different data acquisition methods, i.e., GNSS-RTK, aerial LiDAR systems,and UAV-mounted optical sensors. It is important to note, however, that the correct use of topographicsamples in hydro-logical models, on an appropriate scale and with adequate precision, requires a seriesof meth-odological considerations for the reliable construction of the main input: the Digital ElevationModel or DEM (POULTER & HALPIN, 2008; GESCH, 2009; CAMARASA-BELMONTE &SORIANO-GARCÍA, 2012; MURDUKHAYEVA et al., 2013; PAPROTNY & TEREFENKO, 2017).
In this context, the present study reviews the application of geomorphometric data to the analysisof coastal flooding, evaluating its primary potentialities and limitations. Based an exten-sive review ofthe literature, we focus on the basic concepts of geomorphometric analysis and the generation of DEMs,the spatial resolution of altimetric data in the raster format, the im-portance of the altimetric referencedatum, primarily when applied to low-lying coastal areas (with examples of how to adjust the verticaldatum), the bathtub approach, and the relevance of hydrological connectivity in the elevation modelsapplied to the assessment of coastal systems.
GEOMORPHOMETRIC ELEMENTS OF THEHYDROLOGICAL MODELING OF COASTAL AREAS
The DEM is the basic tool used for the extraction of the geomorphometric parameters (slopegradient, hillside orientation, ramp length, roughness, and vertical and horizontal curva-ture) typicallyemployed in hydrological modeling (POULTER & HALPIN, 2008; FLORINSKY, 2012; SEENATH etal., 2016; YUNUS et al., 2016). In computational modeling, these parame-ters compose the digitalsurfaces, traditionally associated with the delimitation and analysis of watersheds, for the identificationof flow patterns (TARBOTON, 1997; GONZALEZ & WOODS, 2002; HUNT, 2005; MENDAS, 2010;POULTER & HALPIN, 2008; PECKHAM, 2009).
Algorithms for the analysis of surface flow patterns were first introduced into hydro-graphicstudies in the 1970s and 1980s. In the 1990s, these algorithms were disseminated widely in the softwarefor Geographic Information Systems (GIS) in a number of different sets of tools for hydrologicalanalysis. The modeling of coastal watersheds has been shown to be a versatile approach, which has
Mercator, Fortaleza, v.20,e20012, 2021. ISSN:1984-2201 2/19

ADVANCES IN THE APPLICATION OF DIGITAL ELEVATION MODELS (DEMS) FOR THE EVALUATION OFCOASTAL FLOODING
contributed to the geomorphometric description of low-lying coastlines, a type of landscape that isnaturally susceptible to positive oscillations in sea level (COZANNET et al., 2006; SEENATH et al.,2016; WDOWINSKI et al., 2016; PAPROTNY & TEREFENKO, 2017).
The primary datum for the extraction of geomorphometric parameters is the discrete andcontinuous representation of the relief in the form of a DEM. The value registered at each point/grid(discrete) or pixel/raster (continuous) is equivalent to the altitude of the terrain and the format of therecords will depend on the type of sensor used to collect the data or the data conversion processes(Figure 1). Eakins & Grothe (2014) alerted that the conversion of discrete records to continuous surfacesusing interpolators is an extremely delicate step in the geomor-phometric reconstruction process, giventhat it can cause severe distortions in the topographic information through the smoothing of the features.As a practical rule, the denser the cloud cov-er of the data points, the smaller the weight of theestimation method (EAKINS & GROTHE, 2014). It is important to note here that the conversion ofrecords can also produce artifacts or edge effects that must be identified and corrected before otherparameters can be extracted from the DEM (DANIEL, 2010; EAKINS & GROTHE, 2014;DANIELSON et al., 2016).
As the spatial resolution is an important component of surface analysis, the topological propertiesderived from a DEM are normally divided into categories or scalar groups. Olaya (2009) distinguishedtwo groups of parameters: local and regional. The local group refers to all the parameters of reducedscale, with point values, such as the slope, aspect, and curvature. The regional group includes muchbroader parameters, which are dependent on a much larger num-ber of surface elements (cells) for anadequate representation, including the hypsometry, re-charge area, and channel segmentation.
Local parameters are geometrically-defined and flow-dependent attributes, such as the directionof the gravitational acceleration vectors, and are a common feature of surface runoff models (OLAYA,2009; FLORINSKY, 2012). In the case of the local geomorphometric parame-ters, we highlight theslope and aspect, which have solid mathematical functions with algorithms implemented through anumber of different types of GIS software (OLAYA, 2009; PIKE et al., 2009; LONGLEY et al., 2010).
Figure 1 - The difference between the two types of record used to compile a DEM. A) Discrete densecloud rep-resented by a point/grid system; B) A continuous surface model represented by a pixel/raster
system.
The slope is the angle of inclination of the local surface relative to the horizontal plane, and is adeterminant of flow velocity by gravity. Li et al. (2005) proposed that the slope is the primary product of
Mercator, Fortaleza, v.20,e20012, 2021. ISSN:1984-2201 3/19
Deivid Cristian Leal Alves - Jair Weschenfelder - Marlize Ferreira-Cravo - Jean Marcel de Almeida Espinoza
the DEM because it expresses a gradient and the direction of the inclination of the surface. The aspect isthe horizontal angle of the direction of the surface flow determined by gravity, which is measuredclockwise and is generally expressed in azimuthal form in relation to the geographic north(FLORINSKY, 2012).
When applying a DEM approach to coastal analyses, Martínez-Graña et al. (2016) point-ed outthat coastal environments with a shallow slope have a high potential for the displacement of seawatertoward the continent, with the withdrawal velocity being controlled by the slope, following an extremeevent (reverse-direction flow). Paprotny and Terefenko (2017) also con-cluded that long-term stormsmay flood more ample areas and reach higher levels in environ-ments with a medium slope, especiallyon low and exposed coasts. Hunt (2005) found that the synergistic association of intense precipitationepisodes and high-energy coastal events may provoke hydrological processes that are twice as intense asnormal.
It should also be noted that flat coastal environments associated with depositional sys-tems, suchas wetlands or coastal dune field swales, tend to drain excess water relatively slowly, and usually presentsecondary flooding by damming the water, for up to days after the event that caused the rise in sea level.This is due not only to morphological factors, such as the inef-ficient flow of water through ephemeralchannels but also to the subsurface hydrological dy-namics, which are related to fluctuations in the watertable (WDOWINSKI et al., 2016; PAP-ROTNY & TEREFENKO, 2017).
THE SPATIAL RESOLUTION OF DEMS IN COASTALFLOODING MODELS
The resolution of altimetric data is highly dependent on technology and the acquisition methods,as well as the data processing, in particular, the conversion of records using determin-istic orprobabilistic interpolators, which generate continuous surfaces (EAKINS & GROTHE, 2014). Asdiscussed by Antonioli et al. (2017), the use of high-resolution 3D topography has been increasingsignificantly in recent years, which has enhanced the capacity of coastal studies, which are now able todetermine the retraction of the coastline in much greater detail in compar-ison with the Sea Level Rise(SLR) scenario.
Twenty years ago, the spatial resolution of the data was only 30 meters, but in the pre-sent day,the ample availability of the global-scale DEMs produced by the National Aeronautics and SpaceAdministration (NASA) through the Shuttle Radar Topography Mission, or SRTM (PIKE et al., 2009)provide researchers and a small number of decision-makers around the globe with DEMs that have aresolution of 1 meter or less. Most of these data are obtained by aerial survey using LiDAR systemslinked to GNSS receivers in Real-Time Kinematic mode (RTK), for ground support. In the past fewyears, the use of UAVs with Structure-from-Motion (SfM) photogrammetric processing has alsoincreased considerably (WESTOBY et al., 2012; CLAPUYUT et al., 2016; JAMES et al., 2017).
Spatial resolution is the measure of the smallest angular or linear division between two objects(JENSEN, 2014), and its definition will depend on the type of record used in the DEM. In the case ofpulse-type data acquisition, as used in the LiDAR system, the initial spatial resolu-tion is determined bythe combination of the laser projection features in the field, while the sample density is represented bythe number of points collected per unit area (grid) and the in-terpolation method used to generate thecontinuous surface (HENGL & EVANS, 2009; JEN-SEN, 2014). In the case of DEMs obtained byaerial photogrammetry, by contrast, the resolution is determined by parameters such as the instantaneousfield of view (IFOV) and the height of the flight. In the raster format, spatial resolution is normallyexpressed in meters, according to the length and width of the raster on the ground (PIKE et al., 2009),which is also known as the Ground Sample Distance, or GSD (Figure 2).
Mercator, Fortaleza, v.20,e20012, 2021. ISSN:1984-2201 4/19

ADVANCES IN THE APPLICATION OF DIGITAL ELEVATION MODELS (DEMS) FOR THE EVALUATION OFCOASTAL FLOODING
Figure 2 - Digital elevation models with different spatial resolutions.
As discussed above, the geomorphometric parameters such as the slope and orientation (aspect)are functions related directly to the spatial resolution of the DEM, which defines the level of detail of thesurface of the matrix (LI et al., 2005; HENGL & EVANS, 2009) and con-sequently influences theestimated behavior of the hydrological displacement (POULTER & HALPIN, 2008; MENDAS, 2010;POPPENGA & WORSTELL, 2015; YUNUS et al., 2016). Given this, low-resolution digital models,with cell-pixel dimensions greater than 10 m x 10 m, provide matrices with highly generalized features,which are inadequate for the distinction of targets within the limited interior area of the pixel (EAKINS& GROTHE, 2014).
This means that the resolution has a direct impact on the quality of all the DEM products. Withregard to the relationship between the spatial resolution of the DEM and the slope, Hengl & Evans(2009) pointed out that if the GSD is sufficiently refined, with a resolution of a few cen-timeters, it willbe possible to detect variations in slope even on surfaces of reduced altimetric amplitude, such as adepositional coastal plain (Figure 3). At the opposite extreme, as the spatial resolution becomes coarser,the slope will become more homogeneous.
Figure 3 - Examples of the DEMs of a depositional coastal plain at different spatial resolutions. A) Thecentime-ter resolution (GSD 0.05 m) results in a topographic profile with the greatest detail of the
terrain inflections; B) By decreasing the resolution (GSD 1.0 m) the topographic profile presents a majordegree of smoothing; C) The topographic profile generated using a much a coarser resolution (GSD 5.0
m) presents a high degree of homoge-neity in the forms.
Mercator, Fortaleza, v.20,e20012, 2021. ISSN:1984-2201 5/19

Deivid Cristian Leal Alves - Jair Weschenfelder - Marlize Ferreira-Cravo - Jean Marcel de Almeida Espinoza
Jensen (2014) established one general, but practical rule to determine the resolution re-quired foran analysis, i.e., that the GSD image should be at least half the size of the target to be identified, in itssmallest dimension. However, Hengl & Evans (2009) encouraged the use of mathematical applicationsfor the more adequate determination of the cell-pixel size of the DEM, taking the density of inflectionsof the terrain into account for the digital representation, that is, the more heterogeneous the morphologyof the landscape to be reconstructed, the greater the sampling effort should be.
In the specific case of coastal flood models, Yunus et al. (2016) and Paprotny & Terefenko (2017)concluded that the geomorphometric generalization of the features will result in severe limitations of theassessment, producing major errors of estimation, which depreciate the approaches that are highlydependent on the topographic component. Given this, DEMs with either a very coarse resolution or withsevere information losses due to a strong smoothing in the register conversion stage (Eakins and Grothe,2014) are not adequate to assess sea-level rise, given that small differences in elevation may havedifferent impacts on the affected areas (GFDRR, 2015).
For surveys of coastal areas with a small altimetric range using LiDAR systems, Paprotny &Terefenko (2017) showed that a dataset with a mean density of 4 points/m² (rural areas) or 12 points/m²,in the case of urban areas, resulted in a maximum cell-pixel spatial resolution of 1 meter after theconversion of the records. Digital Elevation Models with a resolution of 1 meter were applied to theanalysis of coastal flood scenarios by Camarasa-Belmonte & Soriano-Garcia (2012); Murdukhayeva etal. (2013); Rotzoll & Fletcher (2013); Leon et al. (2014), Wadey et al. (2015), Poppenga & Worstell(2015; 2016), and Antonioli et al. (2017).
Despite their intrinsic value, DEMs with a high spatial resolution present a number of drawbacks,in particular, a substantial increase in processing time. Fine resolution surface mod-eling (centimetricGSD) requires an enormous computational capacity. In the case of flood models, assessments based onhigh-resolution DEMs are normally restricted to detailed studies of relatively small areas, with thecartographic products typically being constructed on a scale of at least 1:5000 (HENGL & EVANS,2009), while the mapping of larger areas usually involves a coarser resolution that tends to lead to ahigher level of uncertainty (SEENATH et al., 2016, YUNUS et al., 2016). As Hengl & Evans (2009)and Longley et al. (2010) pointed out, the choice of a given spatial resolution implies certain costs,associated not only with the acquisition of the data, but also for the application of the model itself.Considerations on the potentialities and limitations of high resolution DEMs are summarized in Table 1.
Table 1 - Summary of some potentialities and limitations of the use of high-resolution DEMs for thestudy of coastal flooding.
Mercator, Fortaleza, v.20,e20012, 2021. ISSN:1984-2201 6/19

ADVANCES IN THE APPLICATION OF DIGITAL ELEVATION MODELS (DEMS) FOR THE EVALUATION OFCOASTAL FLOODING
However, Gesch (2009) stated that it is not enough to simply obtain a high-resolution model, butthat it also is necessary that both the horizontal and the vertical resolutions are ap-propriate for the typeof evaluation being undertaken. The spatial characteristics of the DEM may lead to under- orover-estimates in the coastal flooding assessment, especially when the conditions of surfacedisplacement are established by friction. Gesch (2009) also pointed out that, in some cases, theuncertainty associated with the geomorphometric model may exceed the predicted SLR value itself.Leon et al. (2014) recommended incorporating the uncertainty of the DEM in the assessment of coastalflood models.
Poppenga & Worstell (2016) expressed the same concern, noting that a high-resolution elevationdataset does not necessarily produce a reliable surface flow model. Other methodolog-icalconsiderations are also necessary, including the adjustment of the vertical reference for coastal areas(GESCH, 2009; SCHIMID et al., 2014; KRUEL, 2016) and the rules of hydrologi-cal connectivity(POULTER & HALPIN, 2008; MENDAS, 2010; EAKINS & GROTHE, 2014; POPPENGA &WORSTELL, 2015; YUNUS et al., 2016).
VERTICAL REFERENCE AND METHODS FOR THEDETERMINATION OF LOCAL SEA LEVELS
Longley et al. (2010) emphasized that the understanding of the altitude of a given coastal area andits metric relationship with the relative sea level, is fundamental for predicting the effects of climatechange. A number of authors (BUSH et al., 1999, 2001; ROTZOLL & FLETCHER, 2013;MURDUKHAYEVA et al., 2013; HOOVER et al., 2016; MARTÍNEZ-GRAÑA et al., 2016;WDOWINSKI et al., 2016) have also pointed out that the altitude is the most important feature of theassessment of coastal flooding, and when DEMs are applied to hydrological modeling, it is necessary tocorrelate the altimetric accuracy obtained during the collection of the the topographic data with the localsea reference level (GESCH, 2009).
Studies of the topography of coastal areas typically adopt a vertical datum based on local tidemeasurements or tide datum. This tidal reference verifies the difference in height between successivehigh and low tides and, depending on the geographic location, these oscillations may vary from a fewcentimeters, in the case of microtidal regimes, to a number of meters, in macrotidal areas(MARTÍNEZ-GRAÑA et al., 2016). As the tide datum consists of a vertical reference that establishesthe boundary of an area subject to tidal fluctuations (GHILANI & WOLF, 2011), the understanding oflocal patterns is crucial to many types of coastal management activity (KRUEL, 2016).
The mean higher high water (MHHW) line is one of the most widely-used tide datum parametersin risk assessment, being used as the extreme vertical reference in the studies of Murdukhayeva et al.(2013), Rotzoll & Fletcher (2013), Eakins & Grothe (2014), Schimid et al. (2014), Hoover et al. (2016),Kruel et al. (2016), and Yunus et al. (2016). However, Ghilani & Wolf (2011) and Eakins & Grothe(2014) found that, worldwide, other references are also used, including the mean high water (MHW),mean low water (MLW), and the mean lower low water, or MLLW (Figure 4).
The interpretation of the tide datum may imply some degree of arbitrariness, and in many cases,represents not only the geomorphological and oceanographic characteristics of the coast, but it alsoreflects local socioeconomic activities (Ghilani & Wolf 2011). In a study of the assessment of floodingcaused by SLR and storm tides in Boston (Massachusetts, USA), Kruel (2016) identified the use of fivevertical data, each one attending specific sectors of the local community. This can become a problem forcoastal management and civil defense based on risk charts, given that it is important to use floodthresholds based on the tide datum (WDOWINSKI et al., 2016).
Mercator, Fortaleza, v.20,e20012, 2021. ISSN:1984-2201 7/19

Deivid Cristian Leal Alves - Jair Weschenfelder - Marlize Ferreira-Cravo - Jean Marcel de Almeida Espinoza
Figure 4 - Diagram of the tide datum.
Schimid et al. (2014) emphasized that many flooding models use orthometric data as a reference,that is, vertical references adjusted to geodesic systems, which are not tide data per se, and thusrepresent a zero value that is not equivalent to any actual tide level for the location. This may representan important source of error, depending on the reference used for the adjustment of the geoid model,especially if the study area has a large tidal amplitude. In an attempt to minimize problems of this type,Gesch (2009) demonstrated that topographical surveys using LiDAR systems based on ellipsoidalreferences have significantly improved the vertical accuracy of the topographic data, although thecartographic products derived from this tool should incorporate the difference in height between thelocal mean sea level and the vertical datum zero adopted for the analysis.
Concerns over the lack of vertical consistency among the different data used in coastal research inthe United States led to the National Oceanic and Atmospheric Administration (NOAA) producing anadjustment tool called VDatum. This software was designed to convert geospatial data among a range ofaltimetric references used in the United States, whether derived from tides, or orthometric (geoid) orgeometric (ellipsoidal) sources. This software, including the version for use in internet browsers, isavailable at https://vdatum.noaa.gov/.
One other limitation associated with the tide datum is the accessibility of the tide-measuringinstruments. Most ports and waterways use tide gauges, but the availability of the data depends on thedistribution network (SILVA et al., 2004; SCHIMID et al., 2014). Many of these tide gauges are alsoinstalled in sheltered locations that are influenced intensely by rivers, such as deltas and estuaries,making inferences impossible for adjacent areas that are exposed directly to meteoceanographic forces,as shown by Goulart (2014) in the case of Cassino Beach in Rio Grande do Sul state, southern Brazil.
Although a tide table (based on astronomical parameters) provides the predicted tide at a givenlatitude, it does not substitute the historical records from a tide gauge, which will normally be linkeddirectly to the reference body of water. Martínez-Graña et al. (2016) showed that the lack of tide data oreven a discontinuity in a time series may be a severe limitation for the estimation of the local sea-levelrise, generating a high level of uncertainty due to the temporal and spatial inaccuracy of the verticalreference. However, in the absence of local tide data or where the tide datum is incompatible, there areother ways of estimating the vertical reference level of the coastline.
Boak & Turner (2005) demonstrated that topographic leveling based on high-frequency beachprofiles measurements georeferenced in a planialtimetric framework can provide reliable data on theshort-term behavior of the water line. The principal limitations of this method are related to its reducedtemporal representativeness, which restricts the sample to the morphodynamic behavior of the beachsystem for any given period. Topographic surveys, regardless of the data collection mode, may representonly the seasonal or daily characteristics of the local sea level due to the high level of variability of thetransport rates and the typical sedimentation patterns of the beach environment (Figure 5).
The identification and georeferencing of tidal fluctuations can also be achieved using temporalseries of high-resolution aerophotogrammetric images (MARTÍNEZ-GRAÑA et al., 2016). Thistechnique is widely used for the delimitation of coastlines (Boak and Turner 2005), and requires both
Mercator, Fortaleza, v.20,e20012, 2021. ISSN:1984-2201 8/19

ADVANCES IN THE APPLICATION OF DIGITAL ELEVATION MODELS (DEMS) FOR THE EVALUATION OFCOASTAL FLOODING
horizontal and vertical records, but it can be a robust method for the spatial analysis of tides when usinggeometric correction, which reduces the inherent distortions of the images that represent the morphologyof the terrestrial surface and provides an image bank co-register, which ensures the spatial matching ofthe mosaic series.
It is possible to estimate the reference tide level of a beach using a series of video images. Aseafront camera system enables the high-frequency monitoring of beach dynamics, but only during thedaylight hours, due to spectral sensor limitations (BOAK & TURNER, 2005; GOULART, 2014). Avideo image database can provide statistics on the long-term patterns of the high-frequency changes inthe system (BOAK & TURNER, 2005). Goulart (2014) employed this method using an ARGUS videomonitoring system, with the application of the orthorectification technique, which consists of the use ofa set of equations and ground control points for the conversion of the oblique images into plane mosaicsof the vertical view. This permits the horizontal position of the water line to be estimated using digitalimage processing algorithms.
Figure 5 - Different approaches for the collection of coastal data. A) Aerophotogrammetric survey usinga UAV; B) Geodetic survey using GNSS equipment.
The reduction in the level of the ellipsoidal datum through the calculation of the geoid undulationis another technique used frequently in flood analysis (WEBSTER et al., 2004; LEON et al., 2014) inparticular when topo-bathymetric data are integrated (DANIELSON et al., 2016; SEENATH et al.,2016). Ellipsoidal systems consider the Earth’s surface to be a geometrically perfect ellipsoid withconstant gravimetric potential and rotation around its polar axis, whereas geodetic systems represent theterrestrial surface with its irregularities in the form of non-uniform heights. The irregularity of the geoidrepresentation is due to the variation in the distribution of the density and mass of the planet, in additionto its rotation, which results in a non-homogeneous distribution of the terrestrial gravitational field.
As it is not possible to measure the geoid directly using a pure positioning system, inferences aremade from the ellipsoid (MONICO, 2008). Using the gravimetric data in the form of a geoidal
Mercator, Fortaleza, v.20,e20012, 2021. ISSN:1984-2201 9/19

Deivid Cristian Leal Alves - Jair Weschenfelder - Marlize Ferreira-Cravo - Jean Marcel de Almeida Espinoza
undulation (N), it is possible to determine the height difference between the ellipsoidal data collectionsystem and the geodetic reference system, thus obtaining the orthometric height (H) from equation 1,following Monico (2008) and IBGE (2016):
H=h-N (equation 1)
where h is the ellipsoidal height and N is the geoid undulation, both for a given surface point. The vertical adjustment provided by the geoid undulation is fundamental to the adoption of
orthometric heights in coastal research, especially in studies that focus on the hydrological dynamics ofthe continent-ocean interface. Due to the gravimetric reference, there is a zero approximation of thegeodetic vertical datum with the Global Mean Sea Level (GMSL). While a direct relationship betweenthe zero height of the geoid surface and mean sea level is usually assumed for a coastline, it is importantto note that the geoid may differ from the mean level because of gravimetric variations around the globe(FERNANDES, 2007). Concerns on this imprecision, as highlighted above, are justified, given that, inmany cases, the vertical error may exceed the sea elevation predicted by projected scenarios of sea-levelrise (GESCH, 2009).
THE BATHTUB APPROACH AND HYDROLOGICALCONNECTIVITY RULES
The bathtub model (LEON et al,. 2014; SCHMID et al., 2014), or bathtub approach (POULTER& HALPIN, 2008; NOAA 2017), is a globally popular concept for the assessment of coastal flooding(YUNUS et al., 2016; ANTONIOLI et al., 2017). The bathtub is a geospatial approach that uses digitalelevation models to simulate water flow, and depends on the quality of the topographic input data(POULTER & HALPIN, 2008, SEENATH et al., 2016, YUNUS et al., 2016).
The bathtub approach is used primarily for the assessment of the flooding potential of coastalareas (flood inundation vulnerability) or is associated with demographic data and infor-mation oninfrastructure to determine the flood inundation risk. The calculations of the bathtub approach can beimplemented in GIS software (POPPENGA & WORSTELL, 2015, SEENATH et al., 2016, YUNUS etal., 2016, NOAA 2017, PAPROTNY & TEREFENKO, 2017), which facilitates integration with othergeoreferenced databases, or even in matrix calculation software.
The name of this approach alludes to the process of filling a bathtub (PAPROTNY &TEREFENKO, 2017), given that the procedure generates information progressively on the depth andextension of the flooding as the water fills the geomorphometric structure of the drainage basin. In themodern conception of this approach, it is assumed that the body of water will in-clude all the landlocated at altitudes below the projected water level, given that there is a direct connection with thesource of the flood or with the flooded cells. The bathtub approach is wide-ly used in the assessmentmodels of climate change impacts related to sea-level rise (SEYATH et al., 2016, YUNUS et al., 2016,ANTONIOLI et al., 2017, PAPROTNY & TEREFENKO, 2017).
Despite its ample use, the bathtub approach has a number of limitations and demands certainprecautions for its application. Both Schimid et al. (2014) and Paprotny & Terefenko (2017) alert thatmany of the applications of the bathtub approach are static, and do not consider the flow direction, thusassuming that the flood effects are instantaneous. Poppenga & Worstell (2015) emphasized that theabsence of hydrological connectivity in the elevation model may lead to the exclusion of somepotentially flood-prone interior areas, which is critical for the reli-able assessment of the risks associatedwith coastal dynamics. However, only the most tradition-al bathtub models are based exclusively on theintersection of the topographic information with the water surface (the height of the water slide)generating what is commonly known as simple bathtub or zero-way model (POUTER & HALPIN,2008; MASTERSON et al., 2014; YUNUS et al., 2016) (Figure 6).
Mercator, Fortaleza, v.20,e20012, 2021. ISSN:1984-2201 10/19

ADVANCES IN THE APPLICATION OF DIGITAL ELEVATION MODELS (DEMS) FOR THE EVALUATION OFCOASTAL FLOODING
Figure 6 - Example of a simple bathtub model obtained using GIS software for different SLR valuesapplied to a coastal DEM. A) 10 centimeter SLR simulation; B) 50 centimeter SLR simulation; C) 1
meter SLR simulation.
The simple bathtub modeling of flooding is generally used in low-resolution digital sur-facemodels, which implies a series of restrictions for the analysis of coastal flooding (YUNUS et al., 2016).This approach also tends to neglect the direction of the flow due to the zero-way rule, given that thesimpler design of this procedure does not predict displacement between cells, but rather a uniformdistribution of the water depth among the cells that are lower than the refer-ence level, with the lowerunits being filled or drowned simultaneously (POULTER & HALPIN, 2008).
In recent years, however, a number of authors have introduced a more complex ap-proach to theflood models based on the bathtub approach, which makes them more versatile. This approach is usuallyreferred to as a modified bathtub (MURDUKHAYEVA et al., 2013; YUNUS et al., 2016; KRUEL et al.,2016; NOAA, 2017). Poulter and Halpin (2008) empha-sized that the appropriate application of thebathtub approach depends on two basic aspects of the surface analysis. The first of these aspects refersto the adjacent displacement or, in hydro-logical terms, the insertion of the surface flow, which isassociated with the scale of the data (the detail of the morphological features) and the spreading rule(cell connectivity and runoff coeffi-cient) adopted in the study, which had rarely been employed incoastal flood models, but were widespread in studies of the drainage systems of hydrographic basins.
The employment of water displacement algorithms with multiple directions is well estab-lished inraster surface modeling, in particular within the scope of hydrographic basin analysis (TARBOTON,1997; GONZALEZ & WOODS, 2002; POULTER & HALPIN, 2008; MENDAS, 2010). According toLongley et al. (2010), when a digital surface imposes friction on the flow (displacement cost betweencells) that is, when the displacement velocity is not uniform, the overflow will tend to reach a greaterextension in more susceptible topographies, such as those at a low elevation or with a smoother slope(lower cost of displacement). The water displace-ment function is commonly known as a spread, andconsists of the total friction calculated for each of the possible paths established by the rules ofdisplacement (LONGLEY et al., 2010). Essentially, a displacement rule is selected for the hydrologicalmodel in which the flow priori-tizes the path with the least friction, from a given set of possible paths.The rules used most fre-quently include the zero-way, the four-way and the eight-way.
The zero-way rule, which was presented above, is applied in the simple bathtub ap-proach, inwhich there is no hydrological connectivity among the cells (no displacement). This single conditionrule states that the cell will be flooded instantaneously if its elevation is lower than the projected sea
Mercator, Fortaleza, v.20,e20012, 2021. ISSN:1984-2201 11/19

Deivid Cristian Leal Alves - Jair Weschenfelder - Marlize Ferreira-Cravo - Jean Marcel de Almeida Espinoza
level (YUNUS et al., 2016). By contrast, the four-way and eight-way rules establish paths connectingadjacent cells (Figure 7). The four-way rule is based on the con-nection of the cells located in the fourcardinal positions, evaluating paths in four possible direc-tions. The eight-way rule, adds the fourdiagonal axes, permitting the evaluation of eight possi-ble path directions.
As Longley et al. (2010) pointed out, in hydrological models based primarily on DEMs, theadoption of either the four- or the eight-way rule resolves the topological problem of the hydrologicalconnectivity. These models predict coastal flooding if two conditions are met:
●the elevation of the cell is below the projected sea level; ●the cell is connected to the flood source or to another cell that is already flooded. In the latter case, the water may flow into any of the neighboring cells, according to the
displacement rule (four-way or eight-way) moving in the direction of the lowest friction, accord-ing tothe slope (YUNUS et al., 2016). Poulter & Halpin (2008) considered the choice of a con-nectivity rule tobe decisive to the delimitation of the flooded area, although the geomorphomet-ric model would still bethe most important component of the evaluation. These authors pointed out that, while the four-way rulemay underestimate the flow connections because it presents only four possible paths, the introduction ofthe diagonal paths may overestimate connectivity in the eight-way rule. In both cases, however, thehigher connectivity tends to enrich the micro-features of the relief obtained by high-resolution DEM.Yunus et al. (2016) demonstrated that the bathtub approaches which employ the zero-way rule tend tomaximize the extension of the flood, given that all the terrains lower than the projected sea level wouldbe flooded, without exception, that is, without the definition of the costs of displacement or connectivity.
Figure 7 - Diagram of a matrix demonstrating the two displacement rules (optimal path): A) Thefour-way rule; B) The eight-way rule.
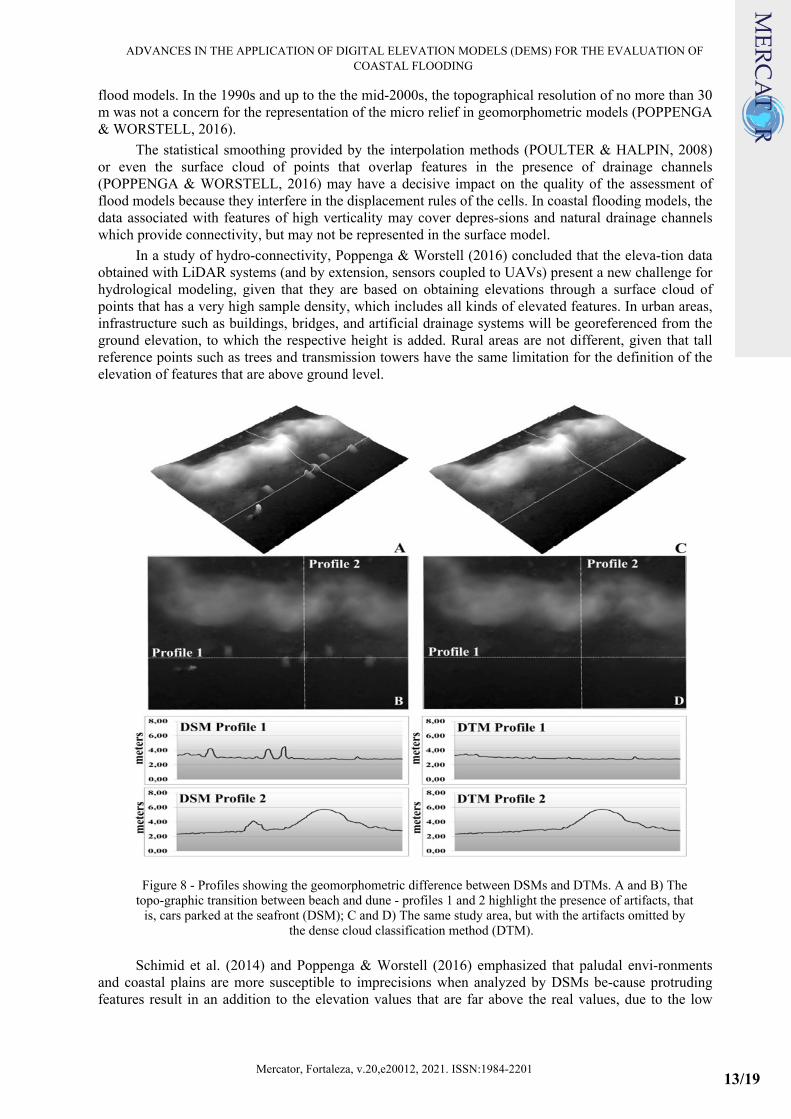
The second aspect identified by Poulter & Halpin (2008) refers to the adequate distinction of thedifferent types of digital elevation models. The DEM usually refers to a digital representation of theearth’s surface, but if it contains data on the height of targets that are above the ground, it is consideredto be a Digital Surface Model (DSM), while the Digital Terrain Mod-el (DTM) is a surface model thatincludes only the ground elevation, with minimal interference from other objects (Figure 8).
Paradoxically, the high resolution of the DEMs, provided by the modern tools of topo-graphicdata acquisition and processing, bring new concerns with regard to the hydrological connectivity in the
Mercator, Fortaleza, v.20,e20012, 2021. ISSN:1984-2201 12/19
ADVANCES IN THE APPLICATION OF DIGITAL ELEVATION MODELS (DEMS) FOR THE EVALUATION OFCOASTAL FLOODING
flood models. In the 1990s and up to the the mid-2000s, the topographical resolution of no more than 30m was not a concern for the representation of the micro relief in geomorphometric models (POPPENGA& WORSTELL, 2016).
The statistical smoothing provided by the interpolation methods (POULTER & HALPIN, 2008)or even the surface cloud of points that overlap features in the presence of drainage channels(POPPENGA & WORSTELL, 2016) may have a decisive impact on the quality of the assessment offlood models because they interfere in the displacement rules of the cells. In coastal flooding models, thedata associated with features of high verticality may cover depres-sions and natural drainage channelswhich provide connectivity, but may not be represented in the surface model.
In a study of hydro-connectivity, Poppenga & Worstell (2016) concluded that the eleva-tion dataobtained with LiDAR systems (and by extension, sensors coupled to UAVs) present a new challenge forhydrological modeling, given that they are based on obtaining elevations through a surface cloud ofpoints that has a very high sample density, which includes all kinds of elevated features. In urban areas,infrastructure such as buildings, bridges, and artificial drainage systems will be georeferenced from theground elevation, to which the respective height is added. Rural areas are not different, given that tallreference points such as trees and transmission towers have the same limitation for the definition of theelevation of features that are above ground level.
Figure 8 - Profiles showing the geomorphometric difference between DSMs and DTMs. A and B) Thetopo-graphic transition between beach and dune - profiles 1 and 2 highlight the presence of artifacts, that
is, cars parked at the seafront (DSM); C and D) The same study area, but with the artifacts omitted bythe dense cloud classification method (DTM).
Schimid et al. (2014) and Poppenga & Worstell (2016) emphasized that paludal envi-ronmentsand coastal plains are more susceptible to imprecisions when analyzed by DSMs be-cause protrudingfeatures result in an addition to the elevation values that are far above the real values, due to the low
Mercator, Fortaleza, v.20,e20012, 2021. ISSN:1984-2201 13/19

Deivid Cristian Leal Alves - Jair Weschenfelder - Marlize Ferreira-Cravo - Jean Marcel de Almeida Espinoza
geomorphometric amplitude of these landscapes. Yunus et al. (2016) showed that these additions to theelevation are intrinsic to the DSMs and result in a less exten-sive estimate of coastal floods. It isimportant to note that this effect is due not only to the verti-cal increment promoted by the features, butalso to the blocking of channels and the masking of the depressions located underneath them. Thepresence of artifacts (EAKINS & GROTHE, 2014), together with other geometric discrepancies, such asborder effects (Danielson et al. 2016), further add to these typical features of the DSM.
In this context, Poulter & Halpin (2008) considered that, to obtain a reliable representa-tion of thefloodplain, it would be necessary, in some cases, to correct the hydrological connec-tivity of the DSM,which would permit a greater displacement of the water through the removal of the impoundments(maximum friction value). Furthermore, Poppenga & Worstell (2016) pre-sented semi-automatedmethods that validate the hydro-connectivity of the surface models, es-pecially where the features of thesurface drainage are essential. These corrective techniques were expected to the approximation of thesurface (DSM) and terrain models (DTM), thus re-ducing the uncertainties associated with the falsefriction promoted by the increase in elevation increase and the obstruction of the flow channels.
One other alternative pointed out, presented by by Yunus et al. (2016), is the use of mixed modelswith records being collected both on the ground (e.g., using GNSS-RTK) and from the air (e.g., LiDARsystems). In most cases, the validation of the vertical accuracy of sur-face models is already based onthis approach, through the use of Ground Control Points, or GCPs (NEX & REMONDINO, 2014), butwith a relatively small number of ground samples relative to the total survey area (LEON et al., 2014).The objective is not only to obtain high precision control points, but also the construction of combinedgeomorphometric models using DTMs and DSMs according to the requirements of the hydrologicalmodeling.
In this case, the channel topography, depressions, and pathways would be mapped withground-based tools, which would avoid the classification of features that represent potentialimpoundments of the surface runoff. In areas of exposed ground or with minimal vertical inter-ference,the records would be collected with an aerial platform, supported by GCPs for the ad-justment of themodel and checkpoints for its validation. In this case, as Poulter & Halpin (2008) pointed out, it wouldbe important to consider the financial costs of including redundant data in the project, as well as thecomputational costs of applying this approach to a large survey area.
CONCLUSION Based on a comprehensive set of climate modeling data and methods, the projections proposed by
the IPCC indicate a marked rise in sea level over the course of the 21st century. This trend raises anumber of questions on the vulnerability of coastal zones around the world. In addition to the sea-levelrise, the intensification of storms is also anticipated as a result of climate change, acting synergisticallyon the alteration of the coastline. From this perspective, a number of studies have attempted to identifythresholds or flood quotas in urbanized coastal areas in order to provide input for eventual adaptationplanning.
Parallel to this, the international scientific literature has given increasing prominence to the use ofgeotechnology in the scope of coastal studies, given that the methods and equipment used for geomaticshave been decisive for the acquisition and analysis of data, especially for the topographic quantificationof coastal plains. Unfortunately, however, the high costs associated with the equipment, field surveys,and subsequent processing represent a major obstacle, espe-cially for public administrators, who are themost interested parties here.
Coastal flood assessment by surface analysis has proven to be a versatile and relatively simpletool to use, given that it is based on consolidated topological and computational tech-niques. Theprincipal obstacles include the difficulty of obtaining adequate data for a given scale, resolution, andprecision. The review of the specialized journals showed that the application of this approach in coastalstudies has been increasing in recent years, and that up to a little over a decade ago, surface analyses wasassociated primarily with the study of hydro-graphic basins.
We believe that the inceasing application of surface analysis to the assessment of coastal floodingscenarios, especially the bathtub approach, is due primarily to the responsiveness of the method, which
Mercator, Fortaleza, v.20,e20012, 2021. ISSN:1984-2201 14/19

ADVANCES IN THE APPLICATION OF DIGITAL ELEVATION MODELS (DEMS) FOR THE EVALUATION OFCOASTAL FLOODING
many authors have found to be effective and reliable for the assessment of the impacts of the rise in sealevel on low-lying coasts. We also believe that the increasing ro-bustness of the models and theprojections presented by the IPCC, as well as their adoption in national plans on climate change, havecontributed to the growth in this field of research and the ongoing refinement of existing methods.
We have emphasized the bathtub approach here because it is relatively versatile when run in GISor numerical computing software, but we aware of the existence of a range of other computationaloptions (the DIVA model, SMC Sistema de Modelado Costero [Coastal Modeling System], andLISFLOOD-FP) that provide similar results and are described in full in the interna-tional literature. Tocircumvent a number of the obstacles inherent to surface modeling, a num-ber of scientists havededicated their researcher to broadening and correcting the bathtub ap-proach, including an increase inthe complexity of the model to better simulate typical features of the hydrological patterns of coastalareas.
A number of recent studies have highlighted the need to integrate of other data, such as the watertable, isostatic adjustments, and detailed descriptions of land use and occupation, with the latter beingused primarily in assessments that include the socioeconomic aspects of the im-pact of coastal flooding.The effective implementation and integration of all of these elements is facilitated and enhanced by theuse of GIS software. However, data integration may also add significant computational costs, whichshould be considered carefully before adding new layers of information.
One of the limitations of the bathtub approach is that it is not adequate for the modeling ofshallow waves, as provided by other modeling systems (the Simulating WAves Nearshore [SWAN]model, for example), even when topo-bathymetric data are integrated. Similarly, mor-phodynamicprocesses and sedimentary flows cannot be predicted by surface analysis. Alt-hough the approach nowincludes the roughness of the terrain and water displacement direc-tions, based on the analysis ofoptimal flow paths, the method still uses waves height and sea-level projections as predetermined, fixedinput.
One final question that should be emphasized here is the need for care in the selection of thetopographic data for analysis. Surface analysis is highly dependent on the Digital Elevation Model(DEM) that supports it, and accurate data acquisition, proper adjustment in relation to the verticalreference datum, appropriate interpolation to the sample set, and the configuration of thehydroconductivity are decisive elements for the adequate application of the procedure. In addition to theinherent imprecision of the elevation values, the reliability of coastal flood mod-els depends on thevalidation of the topographic product, and the evaluation of the uncertainties involved.
ACKNOWLEDGMENTS We acknowledge the Brazilian National Council for Scientific and Technological Devel-opment -
CNPq (141939/2016-8), for financial support of this research. We also acknowledge the Federal Scienceand Technology Institute of Rio Grande do Sul (Instituto Federal do Rio Grande do Sul) for access to itslaboratories and geotechnological infrastructure.
REFERENCES AGUIAR, L. D. S., AMARO, V. E., VICTOR, P., LUIS, A. Geotecnologias de baixo custo aplicadas àavaliação de risco por inundação em áreas urbanas costeiras em cenários de mudanças climáticas.Anuário do Instituto de Geociências, v. 42, 1, 2018. p. 267-290.
ANTONIOLI, F.; ANZIDEI, M.; AMOROSI, A.; LO PRESTI, V.; MASTRONUZZI, G.; DEIANA, G.;DE FALCO, G.; FONTANA, A.; FONTOLAN, G.; LISCO, S.; MARSICO, A.; MORETTI, M.; ORRÙ,P.E.; SANNINO, G.M.; SERPELLONI, E.; VECCHIO, A. Sea-level rise and potential drowning of theItalian coastal plains: Flooding risk scenarios for 2100. Quaternary Science Reviews, 158, 2017. p.29-43. doi.org/10.1016/j.quascirev.2016.12.021
ARAUJO, G.H.S.; ALMEIDA, J.R.; GUERRA, A.J.T. Ambiente Urbano e Industrial. In: ARAUJO,G.H.S.; ALMEIDA, J.R.; GUERRA, A.J.T. (ed) Gestão ambiental de áreas degradadas. 4th edn.
Mercator, Fortaleza, v.20,e20012, 2021. ISSN:1984-2201 15/19
Deivid Cristian Leal Alves - Jair Weschenfelder - Marlize Ferreira-Cravo - Jean Marcel de Almeida Espinoza
Bertrand, Rio de Janeiro, 2009. p. 63-73.
BOAK, E.H.; TURNER, I. L. Shoreline Definition and Detection: A review. Journal of CoastalResearch 21 (4), 2005. p. 688–703. doi.org/10.2112/03-0071.1
CAMARASA-BELMONTE, A.M.; SORIANO-GARCIÁ, J. Flood risk assessment and mapping inperi-urban Mediterranean environments using hydrogeomorphology. Application to ephemer-al streamsin the Valencia region (eastern Spain). Landscape and Urban Planning 104 (2), 2012. p. 189–200.doi.org/10.1016/j.landurbplan.2011.10.009
CASELLA, E.; ROVERE, A.; PEDRONCINI, A.; MUCERINO, L.; CASELA, M.; CUSATI, L.A.;VACCHI, M.; FERRARI, N. & FIRPO, M. Study of wave runup using numerical models andlow-altitude aerial photogrammetry: A tool for coastal management. Estuarine, Coastal and ShelfScience, 149, 2014. p. 160-167.
CLAPUYUT, F.; VANACKER, V.; VAN OOST, K. Reproducibility of UAV-based earth topog-raphyreconstructions based on Structure-from-Motion algorithms. Geomorphology, 260, 2016. p. 4-15.doi.org/10.1016/j.geomorph.2015.05.011
COZANNET, G.L.; ROHMER, J.; CAZENAVE, A.; IDIER, D.; VAN DE WAL, R.; WINTER, R.;PEDREROS, R.; BALOUIN, Y.; VINCHON, C.; OLIVEROS, C. Evaluating uncertainties of futuremarine flooding occurrence as sea-level rises. Environmental Modelling and Software, 73, 2015. p.44-56. doi.org/10.1016/j.envsoft.2015.07.021
DANIELSON, J.J.; POPPENGA, S.K.; BROCK, J.C.; EVANS, G.A.; TYLER, D.J.; GESCH, D.B.;THATCHER, C.A.; BARRAS, J.A. Topobathymetric Elevation Model Development using a NewMethodology: Coastal National Elevation Database. Journal Coastal Research SI 76, 2016. p. 75-89.doi.org/10.2112/SI76-008
EAKINS, W.B.; GROTHE, P.R. Challenges in building coastal digital elevation models. Journal ofCoastal Research 30 (5), 2014. p. 942–953. doi.org/10.2112/JCOASTRES-D-13-00192.1
FERGUNSON, G.; GLEESON, T. Vulnerability of coastal aquifers to groundwater use and cli-matechange. Nature Climate Change 2, 2012. p. 342-345. doi:10.1038/nclimate1413
FERNANDES, C.E.M. Fundamentos de física para Geociências volume 1: campo terrestre gravítico,deformacional e hidrodinâmico. Interciência, Rio de Janeiro, 2007. p. 2–48.
FLORINSKY, I.V. Digital terrain analysis in soil science and geology. Elsevier, San Diego, 2012. p.7-16.
GESCH, D.B. Analysis of Lidar elevation data for improved identification and delineation of landsvulnerable to Sea-Level Rise. Journal of Coastal Research SI 53, 2009. p. 49–58.doi.org/10.2112/SI53-006.1
GLOBAL FACILITY FOR DISASTER AND RECOVERY – GFDRR. Digital Elevation Models: Aguidance Note on how Digital Elevation Models are created and used – includes key defini-tions, sampleTerms of reference and how best to plan a DEM-mission. World Bank Group, Washington, 2015. p.19-38.
GHILANI, C.D.; WOLF, P.R. Elementary Surveying: An Introduction to Geomatics. 13.ed. Pren-ticeHall, New Jersey, 2011.
GLOOVER, R.E. The pattern of fresh-water flow in a coastal aquifer. Journal of Geophysical Research64 (4), 1959. p. 357-359. doi.org/10.1029/JZ064i004 p00457
GONZALEZ, R.C.; WOODS, R.E. Digital Image Processing. 2nd edn. Prentice Hall, New Jersey, 2002.p. 617-625.
GOULART, E.S. Variabilidade morfodinâmica temporal e eventos de inundação em um sistema praialcom múltiplos bancos. Dissertation, Universidade Federal do Rio Grande, 2014.
Mercator, Fortaleza, v.20,e20012, 2021. ISSN:1984-2201 16/19

ADVANCES IN THE APPLICATION OF DIGITAL ELEVATION MODELS (DEMS) FOR THE EVALUATION OFCOASTAL FLOODING
GRIBBIN, J.E. Introduction to Hydraulics and Hydrology: With Applications for StormwaterManagement. 4th edn. Cengage Learning, Clifton Park, 2013. p. 175-217.
GUIMARÃES, P. V., FARINA, L., TOLDO, E., DIAZ-HERNANDEZ, G., & AKHMATSKAYA, E.Numerical simulation of extreme wave runup during storm events in Tramandaí Beach, Rio Grande doSul, Brazil. Coastal Engineering, 95, 2015. p. 171–180.
HALLEGATE, S.; GREEN, C.; NICHOLLS, R.J.; CORFEE-MORLOT, J. Future flood losses in majorcoastal cities. Nature Climate Change 3, 2013. p. 802–806. doi:10.1038/nclimate1979
HENGL, T.; EVANS, I.S. Mathematical and Digital Models of the Land Surface. In: Hengl T, ReuterHI (Eds). Geomorphometry: Concepts, Software, Applications. Elsevier, Amsterdam, 2009. p. 31-64.
HOOVER, D.J.; ODIGIE, K.O.; SWARZENSKI, P.W.; BARNARD, P. Sea-level rise and coastalgroundwater inundation and shoaling at select sites in California, USA. Journal of Hydrology: RegionalStudies 11, 2016. p. 234-249. doi.org/10.1016/j.ejrh.2015. 12.055
HUNT, J.C.R. Inland and Coastal Flooding: Developments in Prediction and Prevention. Philo-sophicalTransactions: Mathematical, Physical and Engineering Sciences 363 (1831), 2005. p. 1475-1491.doi.org/10.1098/rsta.2005.1580
INSTITUTO BRASILEIRO DE GEOGRAFIA E ESTATÍSTICA – IBGE. MAPGEO 2015documentation.https://www.ibge.gov.br/geociencias/informacoes-sobre-posicionamento-geodesico/servicos-para-posicionamento-geodesico/10855-modelo-de-ondulacao-geoidal.html. Accessed 22 july 2019.
JAMES, M.R.; ROBSON, S.; D’OLEIRE-OLTMANNS, S.; NIETHAMMER, U. Optimising UAVtopographic surveys processed with structure-from-motion: ground control quality, quantity and bundleadjustment. Geomorphology 280, 2017. p. 51-66. doi.org/10.1016/j.geomorph.2016.11.021
JENSEN, J.R. Remote Sensing of the Environment: An Earth Resource Perspective. 2th edition.Prentice Hall, Harlow, 2014. p. 1-36.
KRUEL, S. The Impacts of Sea-Level Rise on Tidal Flooding in Boston Massachusetts. Journal ofCoastal Research 32 (6), 2016. p. 1302-1309. doi.org/ 10.2112/JCOASTRES-D-15-00100.1
LEAL-ALVES, D.C.; WESCHENFELDER, J.; ALBUQUERQUE, M. G.; ESPINOZA, J. M. A.;FERREIRA_CRAVO, M.; ALMEIDA, L. P. M. Digital elevation model generation using UAV-SfMphotogrammetry techniques to map sea-level rise scenarios at Cassino Beach, Brazil. SN Appl. Sci. 2,2181, 2020. https://doi.org/10.1007/s42452-020-03936-z
LEON, J.X.; HEUVELINK, G.B.M; PHINN, S.R. Incorporating DEM Uncertainty in CoastalInundation Mapping. PLoS ONE 9 (9), 2014. doi.org/10.1371/journal.pone.0108727
LI Z, ZHU Q.; GOLD, C. Digital Terrain Modelling: Principles and Methodology. CRC Press, BocaRaton, 2005. p 267-284.
LICHTER, M.; FELSENSTEIN, D. Assessing the costs of sea-level rise and extreme flooding at thelocal level: A GIS-based approach. Ocean and Coastal Management 59, 2012. p. 47-62. doi.org/10.1016/j.ocecoaman.2011.12.020
LONGLEY, P.A.; GOODCHILD, M.F.; MAGUIRE, D.J.; RHIND, D.W. Geographic InformationSystems and Science. 3rd edn. Wiley, Danvers, 2010. p. 351-423.
MAIA, N. Z.; CALLIARI, L. J. & NICOLODI, J. L. Analytical model of sea level elevation dur-ing astorm: Support for coastal flood risk assessment associated with cyclone passage. Conti-nental ShelfResearch, 124, 2016. p. 23–34.
MARTÍNEZ-GRAÑA, A.; BOSKIB, T.; GOYA, J.L.; ZAZOC, C.; DABRIO, C.J. Coastal-flood riskmanagement in central Algarve: Vulnerability and flood risk indices (South Portugal). Eco-logicalIndicators 71, 2016. p. 302-316. doi.org/10.1016/j.ecolind.2016.07. 021
Mercator, Fortaleza, v.20,e20012, 2021. ISSN:1984-2201 17/19

Deivid Cristian Leal Alves - Jair Weschenfelder - Marlize Ferreira-Cravo - Jean Marcel de Almeida Espinoza
MASTERSON, J.P.; FIENEN, M.N.; THIELER, R.; GESCH, D.B.; GUTIERREZ, B.T.; PLANT, N.G.Effects of sea-level rise on barrier island groundwater system dynamics – ecohydrological implications.Ecohydrology 7, 2014. p. 1064-1071. doi.org/10.1002/eco. 1442
MENDAS, A. The contribution of the digital elevation models and geographic information sys-tems in awatershed hydrologic research. Applied Geomatics, 2 (1), 2010. p. 33-42. doi.org/10.1007/s12518-010-0019-8
MONICO, J.F.G. Posicionamento pelo GNSS: descrição, fundamentos e aplicações. 2nd edn. UNESP,São Paulo, 2008. p. 183-242.
MURDUKHAYEVA, A.; AUGUST, P.; BRADLEY, M.; LABASH, C.; SHAW, N. Assessment ofinundation risk from Sea Level Rise and storm surge in Northeastern Coastal National Parks. Journal ofCoastal Research 29 (6a), 2013. p. 1-16. doi.org/ 10.2112/JCOASTRES-D-12-00196.1
NATIONAL OCEANIC AND ATMOSPHERIC ADMINISTRATION – NOAA. 2017. DetailedMethod for Mapping Sea Level Rise Inundation. https://coast.noaa.gov/data/digitalcoast/pdf/slr-inundation-methods.pdf. Accessed 12 September 2017
NATIONAL OCEANIC AND ATMOSPHERIC ADMINISTRATION – NOAA. 2013. Sea LevelTrends. https://tidesandcurrents.noaa.gov/sltrends/. Accessed 25 September 2017
NEX, F.; REMONDINO, F. UAV for 3D mapping applications: a review. Applied Geomatics. 6 (1),2014. p. 1-15. doi.org/10.1007/s12518-013-0120-x
NICHOLLS, R.J.; HANSON, S.E.; LOWE, J.A.; WARRICK, R.A.; LU, X.; LONG A.J. Sea-levelscenarios for evaluating coastal impacts. WIREs Climate Change, 5, 2014. p. 129-150.doi.org/10.1002/wcc.253
OLAYA, V. Basic Land-Surface Parameters. In: Hengl, T.; Reuter, H.I. (Eds). Geomorphometry:Concepts, Software, Applications. Elsevier, Amsterdam, 2009. p. 141-170.
PAPROTNY, D.; TEREFENKO, P. New estimates of potential impacts of sea level rise and coastalfloods in Poland. Natural Hazards and Earth System Sciences 85 (2), 2017. p. 1249–1277. doi.org/10.1007/s11069-016-2619-z
PECKHAM, S.D. Geomorphometry and Spatial Hydrologic Modelling. In: Hengl, T., Reuter, H.I.(Eds). Geomorphometry: Concepts, Software, Applications. Elsevier, Amsterdam, 2009. p. 3-30.
PIKE, R.J.; EVANS, I.S.; HENGL, T. Geomorphometry: A Brief Guide. In: Hengl, T.; Reuter, H.I.(Eds). Geomorphometry: Concepts, Software, Applications. Elsevier, Amsterdam, 2009. p. 141-170.
POPPENGA, S.; WORSTELL, B. Evaluation of airborne Lidar elevation surfaces for propaga-tion ofcoastal inundation: the importance of hydrologic connectivity. Remote Sensing 7 (9), 2015. p.11695-11711. doi.org/10.3390/rs70911695
POPPENGA, S.K.; WORSTELL, B.B. Hydrologic Connectivity: Quantitative Assessments ofHydrologic-Enforced Drainage Structures in an Elevation Model. Journal of Coastal Research SI 76,2016. p. 90-106. http://doi.org/10.2112/SI76-009
POULTER, B.; HALPIN, P.N. Raster modelling of coastal flooding from sea-level rise. InternationalJournal of Geographical Information Science 22 (2), 2008. p. 167-182. doi.org/10.1080/13658810701371858
SIMÕES, R. S.; OLIVEIRA, U. R.; ESPINOZA, J. M.; ALBUQUERQUE, M. G.; LEAL-ALVES, D.C. Uso de drone de pequeno porte para análise costeira: enfoque metodológico. Revista Brasileira deGeografia Física v.12, n.02, 2019. p. 622-640.
ROTZOLL, K.; FLETCHER, C.H. Assessment of groundwater inundation as a consequence of sea-levelrise. Nature Climate Change 3, 2013. p. 477-481. doi.org/10.1038/nclimate1725
SCHIMID, K.; HADLEY, B.; WATERS, K. Mapping and Portraying Inundation Uncertainty of
Mercator, Fortaleza, v.20,e20012, 2021. ISSN:1984-2201 18/19

ADVANCES IN THE APPLICATION OF DIGITAL ELEVATION MODELS (DEMS) FOR THE EVALUATION OFCOASTAL FLOODING
Bathtub-Type Models. Journal of Coastal Research 30 (3), 2014. p. 548-561.doi.org/10.2112/JCOASTRES-D-13-00118.1
SEENATH, A., WILSON, M.; MILLER, K. Hydrodynamic versus GIS modelling for coastal floodvulnerability assessment: Which is better for guiding coastal management? Ocean and CoastalManagement 120, 2016. p. 99-109. doi.org/10.1016/ j.ocecoaman.2015.11.019
SILVA, A. F.; TOLDO JR., E. E.; ROOIJEN, A. V.; ABREU, C. F.; RODRIGUES-FILHO, J. L.;ROCHA, R.S.; AQUINO, R. S. Inundação costeira por elevação do nível do mar em Imbé e Tramandaí -RS. Revista Brasileira de Cartografia, vol. 72, n. 3, 2020. p. 541-557. doi.org/10.14393/rbcv72n3-48706
SILVA, C.G.; PATCHINEELAM, S.M.; NETO, J.A.B.; PONZI, V.R.A. Ambientes de sedimentaçãocosteira e processos morfodinâmicos atuantes na linha de costa. In: NETO, J.A.B; PONZI, V.R.A.;SICHEL, S.E. Introdução à Geologia Marinha. Interciência, Rio de Janeiro, 2004. p. 219-242.
TARBOTON, D. A new method for the determination of flow directions and upslope areas in griddigital elevation models. Water Resources Research 33 (2), 1997. p. 309-319. doi.org/10.1029/96WR03137
VALERIANO, M.M. Dados topográficos. In: FLORENZANO, T.G. (Org.). Geomorfologia: conceitos etecnologias atuais. Oficina de Textos, São Paulo, 2008. p. 73-104.
VIANNA, H. D.; CALLIARI, L. J. Variabilidade do sistema praia-dunas frontais para o litoral norte doRio Grande do Sul (Palmares do Sul a Torres, Brasil) com o auxílio do Light Detection and Ranging –Lidar. Pesquisas em Geociências, 42 (2), 2015. p. 141-158.
WADEY, M.P.; COPE, S.N.; NICHOLLS, R.J.; MCHUGH, K.; GREWCOCK, G.; MASON, T. Coastalflood analysis and visualisation for a small town. Ocean and Coastal Management 116, 2015. p.237-247. http://doi.org/10.1016/j.ocecoaman.2015.07.028
WDOWINSKI, S.; BRAY, R.; KIRTMAN, B.P.; WU, Z. Increasing flooding hazard in coastalcommunities due to rising sea level: Case study of Miami Beach, Florida. Ocean and CoastalManagement 126, 2016. p. 1-8. doi.org/10.1016/ j.ocecoaman.2016.03.002
WEBSTER, T.L.; FORBES, D.L.; DICKIE, S.; SHREENAN, R. Using topographic lidar to map floodrisk from storm-surge events for Charlottetown, Prince Edward Island, Canada. Canadian JournalRemote Sensing 30 (1), 2004. p. 64–76. http://doi.org/ 10.5589/m03-053
WESTOBY, M.J.; BRASINGTON, J.; GLASSER, N.F.; HAMBREY, M.J.; REYNOLDS, J.M.‘Structure-from-Motion’ photogrammetry: A low-cost, effective tool for geoscience applica-tions.Geomorphology 179, 2012. p. 300-314. doi.org/10.1016/j.geomorph.2012.08. 021
WONG, P.P.; LOSADA, I.J.; GATTUSO, J.P.; HINKEL, J.; KHATTABI, A.; MCINNES, K.L.;SAITO, Y.; SALLENGER, A. Coastal systems and low-lying areas. In: CLIMATE CHANGE 2014:Impacts, Adaptation, and Vulnerability. Part A: Global and Sectoral Aspects. Contribution of WorkingGroup II to the Fifth Assessment Report of the Intergovernmental Panel on Climate Change. CambridgeUniversity Press, Cambridge, United Kingdom and New York, 2014. p. 361-409.
YUNUS, A.P.; AVTAR, R.; KRAINES, S.; YAMAMURO, M.; LINDBERG, F.; GRIMMOND, C.S.B.Uncertainties in Tidally Adjusted Estimates of Sea Level Rise Flooding (Bathtub Model) for the GreaterLondon. Remote Sensing 8 (5), 366, 2016. p. 1-23. doi.org/10.3390/rs8050366
19/19