Embed Size (px)
Citation preview
TEAM:
Stanley Best (Director - computer imaging technology, Remote Sensing), Marcelino Claret (Food Safety)
Lorenzo León (Non-destructive systems and Data Mining), Rodrigo Quintana (Econometrics, statistics
monitoring), Valeska Concha (Computer Science), Faviola Flores (mathematical modeling), Francisco
Ferrada (Applied Electronics), Claudio Aliaga (Technical field and developments Workshop Manager).
Advances in Precision Agriculture Integrating Chilean Agri-Food Sector to the new millennium
INIA - PRECISION AGRICULTURE PROGRAM
Actual Projected
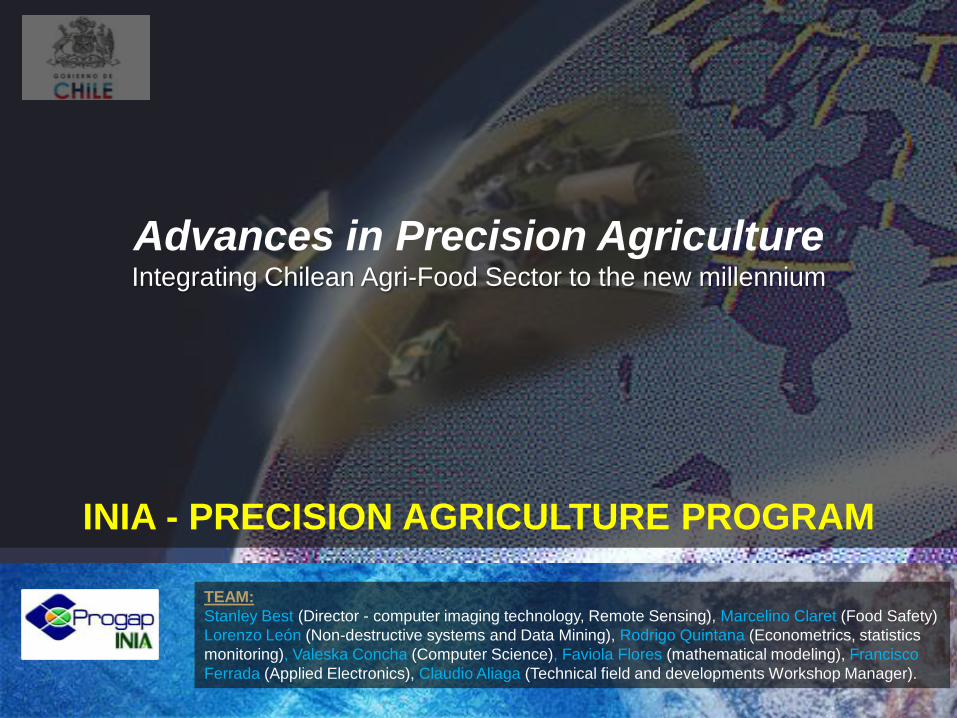
Actual Problems
William E. Halal. World Future Society. 2006

Our vision is associated with consumer requirements
Nutritious foods (functional characteristics)
High in antioxidants and other phytonutrients.
Healthy Food
Chemical waste (reduction -> Effectiveness - Efficiency).
Microbial Health
Good Taste
Taste, maturity, visual characteristics, life, etc.
The technology will influence the way of selling in the short term !!
THE ROAD AHEAD IS THE TECHNOLOGY

Whole Chain Assurance
PRE-
FARM
GATE
POST
FARM
GATE
Growers
Farmers
Food Packing and Processing
Retail
StoresConsumers
REQUIREMENTS
Key components
oPre-Farm and Post Farm Gate Standards
oISO Guide 65
oTraceability
o Risk Assessment
o Residue Monitoring

Increased costs in labor, raw materials and inputs in production
processes and energy, encourages the search for regions or field
zones of higher productivity and quality.
The necessity of increase the credibility and confidence in
national and international level in the quality of some products
Engage and retain customers now costs more!!

Challenges to Latino American Agriculture
• Global markets, Local inputs
• Labor cost & availability
• Trade policies
• Consumer demand stagnant
• Retail consolidation
• Environmental accountability (weather
changes)
• Competing uses for farmland, water
• Food safety & biosecurity

Actual Development TrendsBiotecnología
Nanotecnología
Plant health, development and production quality
Reducing the use of agrochemicals
Prediction tools
Fruit Quality and Sanity
Water Use Efficient
Fertility management
etc.
Automation and
Mechanization Sensors
and robotics, mechanical
assistance to harvesting and crop
management, automatic and
remote processing, packing, and
shipping.
Improve customer satisfaction (The technology will influence the form of selling in the short term?)
ICT´s

Homogeneous management is sustainable?
Use technology to achieve greater
efficiency and sustainability
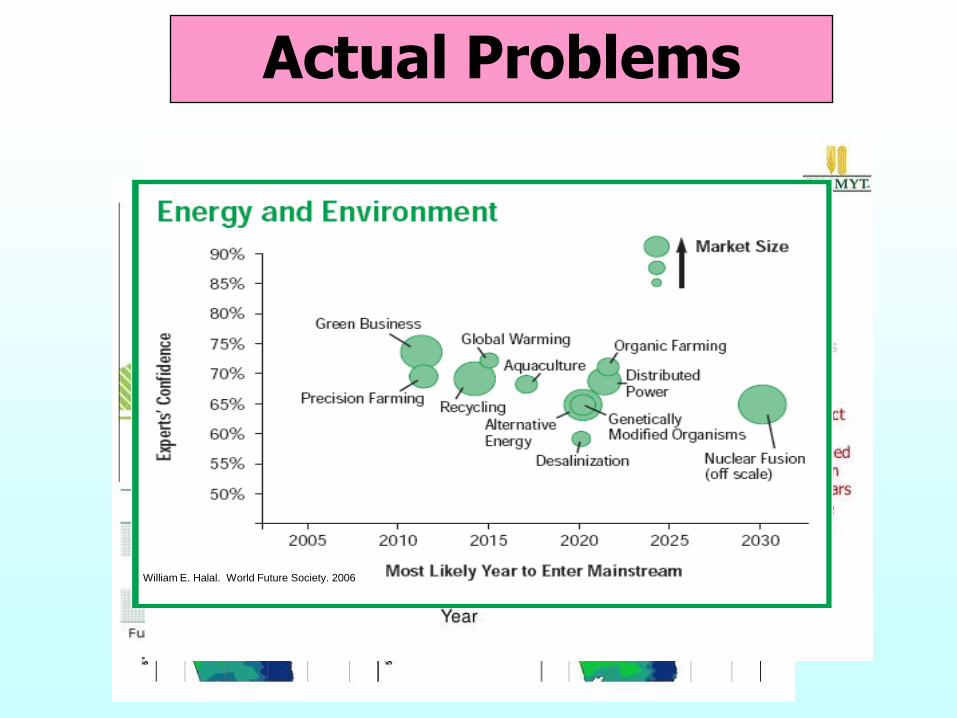
Evolution of Agricultural Technology
Desarrollando la agricultura del futuro
Agricultura de Precisión (AP)
Agricultura Sitio-Específica (ASE)

DEFINITION OF MANAGEMENT ZONES

PF FARM FAIR IN
ARGENTINA, BRASIL,
CHILE.

PF Adoption of tools in Latin America
Adoption of PF technology v/s other technologiesThe Argentinean Case
66%
25%
35%
55%59%
15%
20%
45%41%
65%
90%
99%
15%12%10%
16%
0
5
10
15
20
25
30
35
1997
1998
1999
2000
2001
2002
2003
2004
2005
2006
2007
2008
2009
2010
2011
Su
pe
rfic
ie
en
Millo
ne
s d
e h
ectá
rea
s
Superficie Agrícola Superficie Mapeada con Monitor de RindeSuperficie con Control de Siembra Superficie con Guia Satelital en PulverizadoraSuperficie con Dosificación Variable Superficie con Guia Automática

Please we needhelp !!!!

TRANSFORMING DATA INTO INFORMATION FOR FARM MANAGEMENT
DATA Information knowledge Action
Raw Sensor Data
Field DataGPS Data
Computer Vision
EC Maps and pointMonitoring definition
Integrate and Contextualizing Data
Usere IntegratesKnowledge:
Information ApplicationAssociated with the
Experience
Temporal contextGeographic context
Field Prediction
Knowing how andWhen to implement a
Recommendation.
3D Compaction and soil Maps Agronomiocal Knowledge Variable irrigation

HOW THOSE TECHNOLOGIES TOOLS HAVE BEEN USED IN OUR COUNTRIES

Monitoring Plant Vigor and their asociation with yield.
YieldNDVI –Septiember
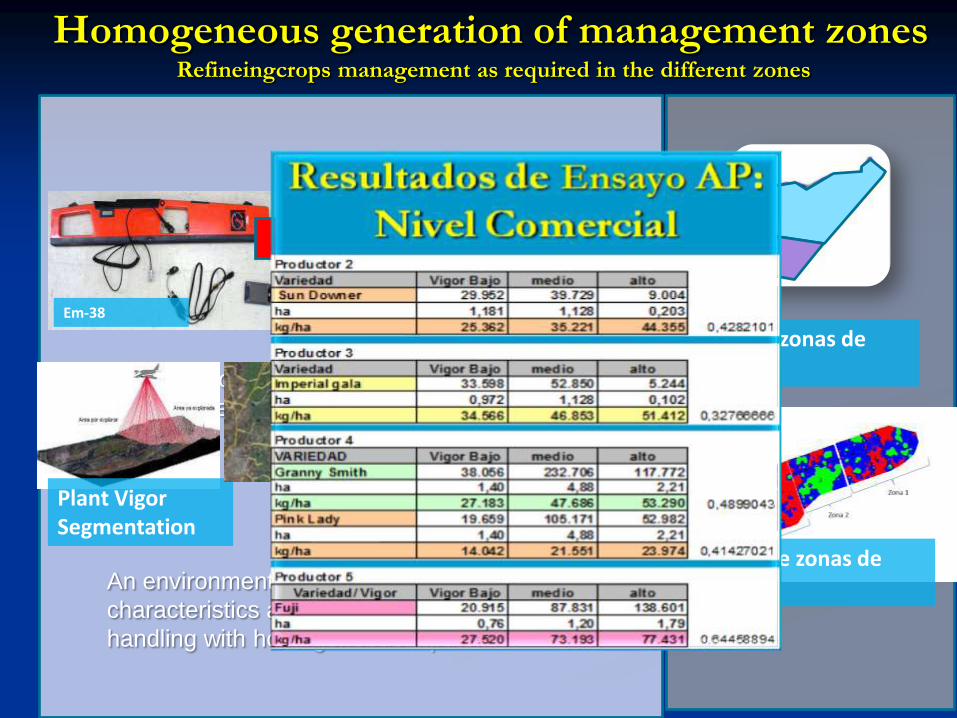
Homogeneous generation of management zonesRefineingcrops management as required in the different zones
Una zona que posee características similares y que
merece un manejo y aplicación de insumos
homogéneos.
Vigor Maps
Soil TextureEm-38
Plano de zonas de Vigor
Plant Vigor Segmentation
Soil Variability Maps
An environment is an area that has similar
characteristics and deserves to be
handling with homogeneous inputs.
Plano de zonas de Riego

Image Analysis Application and potential use (ICAS)

IDENTIFICACION DE MOSQUITA
BLANCA
IDENTIFICACION REPILO
PRODUCTO PRECIO DOSIS /HAFECHA DE
APLICACIÓN CUARTELHA
CUARTEL
HA
APLICADAS
Costo
Aplicación
US$
Hurrigane US$220/kg 250 grs
20/10/2011 101-8 9.97 5.59 307.45
5/11/2011 101-6 7.5 2.77 152.35
2/11/2011 108-1 1.75 1.75 96.25
2/11/2011 108-2 0.82 0.82 45.1
3/11/2011 108-3 3.83 3.83 210.65
3/11/2011 108-4 1.99 1.99 109.45
Total 25.86 16.75 US$ 921.25

Example of actual use of
technology associate to soil
physic
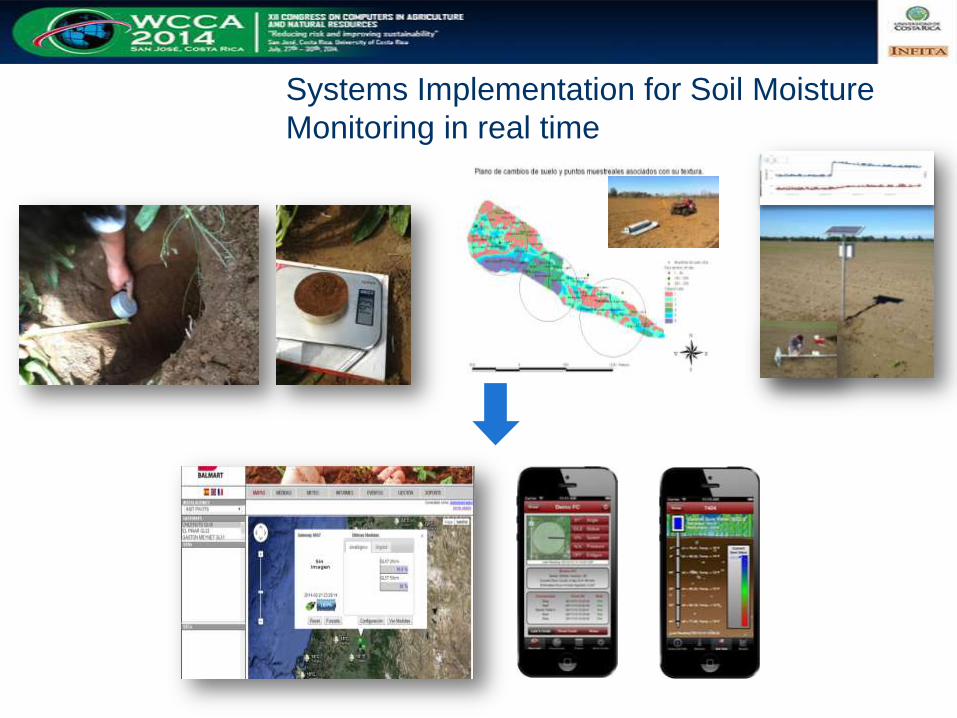
Systems Implementation for Soil Moisture
Monitoring in real time

Compaction profile (7.5, 35, and 53 cm) Field of Bio Bio Province.
Compaction curves (KPa)Field Province Bio Bio
Dep
th

Variable Rate Irrigation
Variable irrigation strategy
Soil Infiltration capacity
Compaction
Topography
Soil Texture

SPATIAL AND TEMPORAL
WATER STRESS MODEL
IRRIGATION DEFICIT MAPSInput Data
Soil Spatial
Variability
NDVI and
IAF Maps
Etr Maps
(Metrics)
Soil TAW and Soil
Moisture
Sensors Location

Evaluation of water deficit
y = 9.509x + 6.0671R² = 0.62p<0.007n= 3800
5
10
15
20
0.00 0.20 0.40 0.60 0.80 1.00 1.20
Ψ [
bar
]
CWSI 2010--11
CWSI 2010-12
CWSI 2011 CWSI 2010
CWSI 2012 Lineal (CWSI 2011)
Plane irrigation zones
More samples. Reducing the overall error estimate irrigation block
IMPORTANT:

UAV Applications

Thermal GIS Application Development
Information Analysis to obtain Space CWSI
Thermal ImagesCapture
Processing of thermal images into RAW format
image
Integration of Thermal Images for Mosaic
development
Image filtering development (only pixels of vegetation)
Maps Development of stem water potential
Cuartel 692-4 697-1B1 636-5 662-1 667-3
Pot Xil Prom Real (Bar) 11,38 12,14 9,7 9,80 12,35
Numero de Puntos en terreno 33 21 33 36 21
Pot Xil Prom Est (Bar) 11,27 12,62 10,61 10,84 13,19
Error Prom Estimación (Bar) 0,1 -0,5 -0,9 -1,0 -0,8

Irrigation
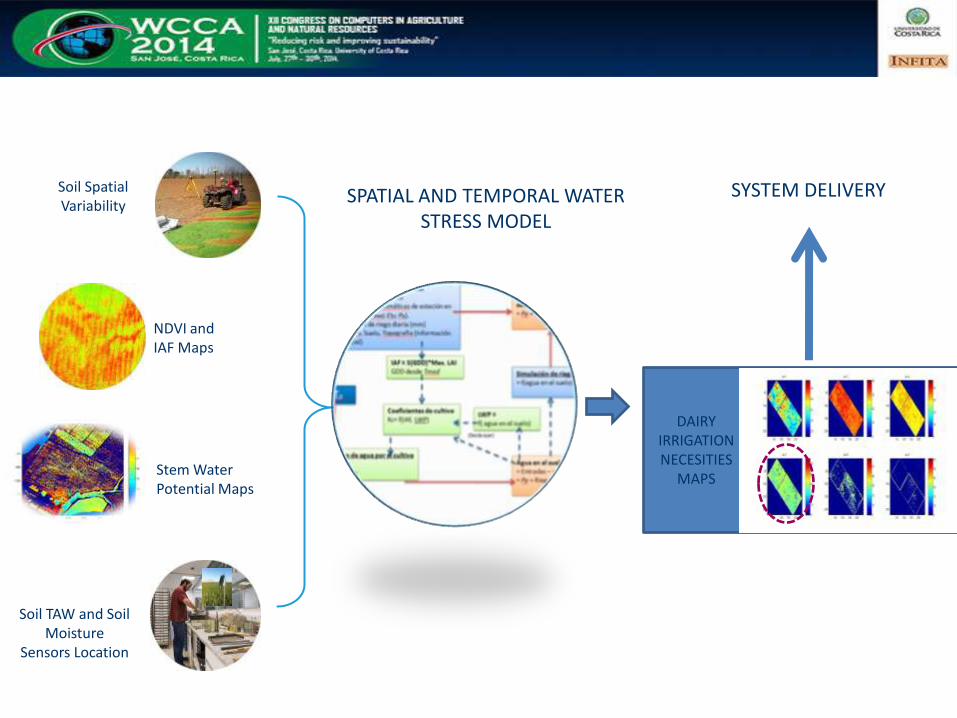
SPATIAL AND TEMPORAL WATER STRESS MODEL
Soil Spatial Variability
NDVI and IAF Maps
Stem Water Potential Maps
Soil TAW and Soil Moisture
Sensors Location
SYSTEM DELIVERY
DAIRY IRRIGATION NECESITIES
MAPS

Input and outputDesarrollando la agricultura del futuro
identificar diferenciar interactuar personalizarManejo Sitio Específico*
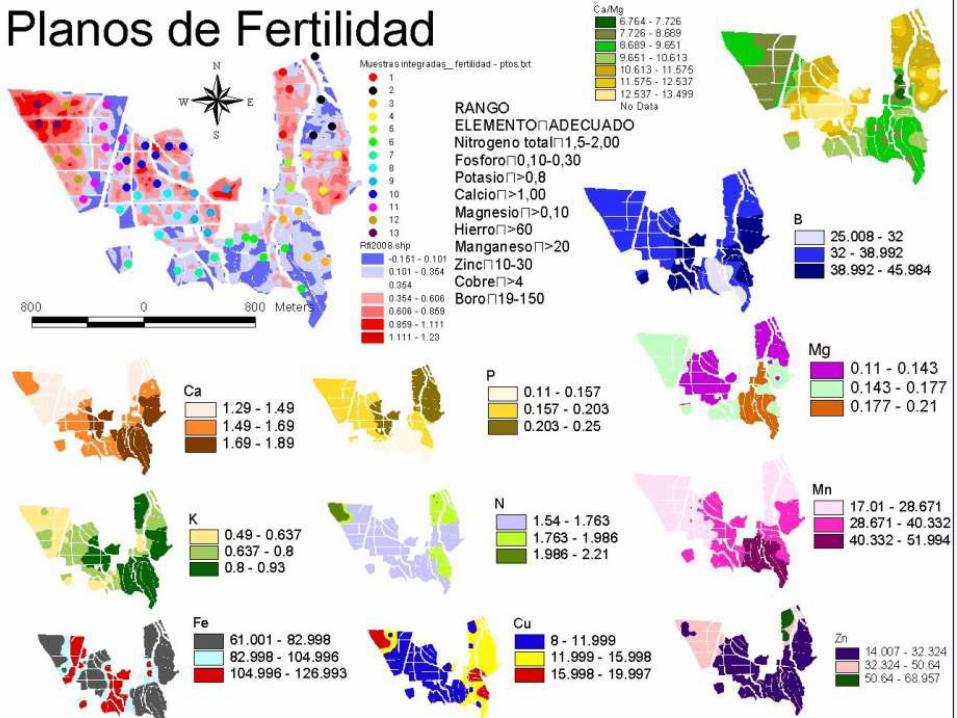
FERTILITY PROBLEMS

EFFICIENT PRODUCTION MANAGEMENT OUTLOOK
2012
2011
2013
Digital Diagnosing of "explanatory factors" and monitoring spatial-
temporal variability
Differentiation of harvest areas and assessment of land management
Predictions Climate (Dryland) prices
OPTIMIZER
Risk margin
Fertilizer dosePlant Density Irrigation management

Computer
vision
technology
|
Acquire ProcessAnalyze Understand

Apples
Harvest
Tunrover
Maps
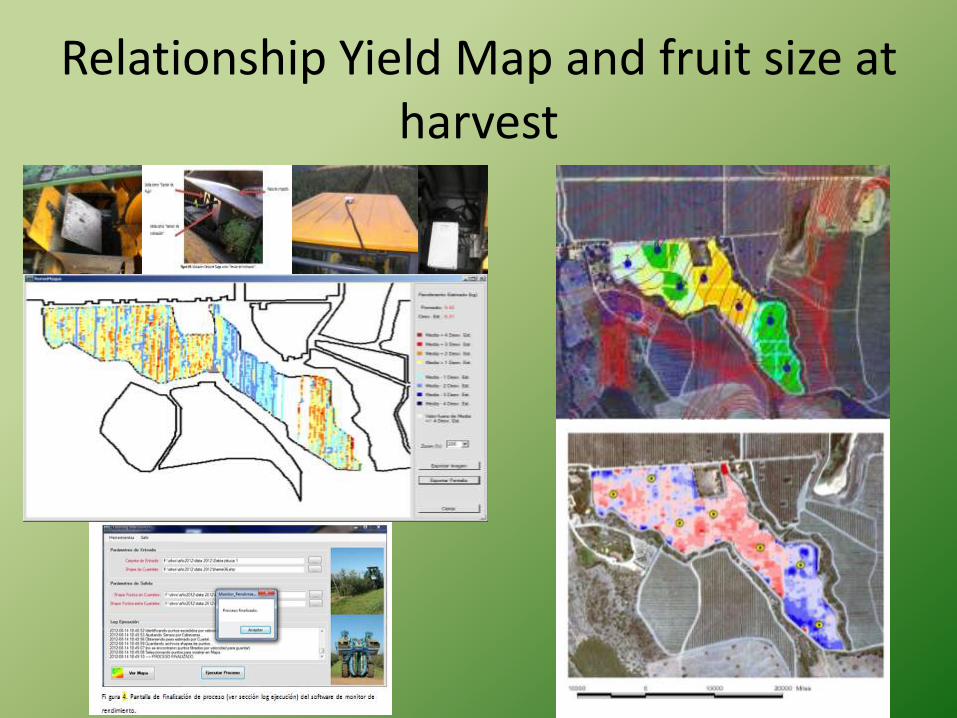
Relationship Yield Map and fruit size at harvest
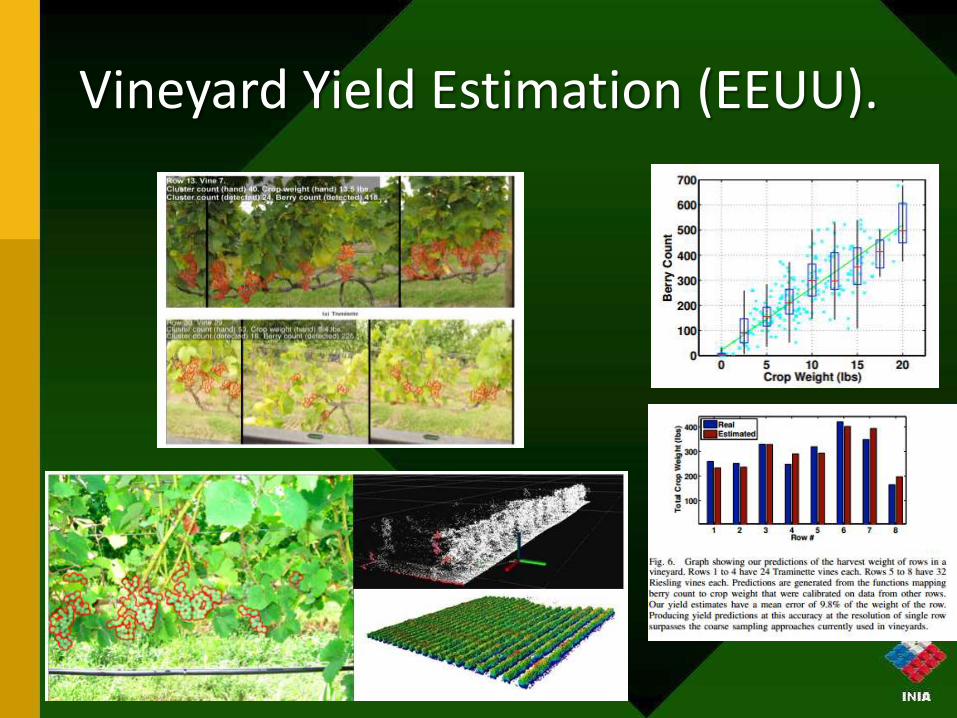
Vineyard Yield Estimation (EEUU).
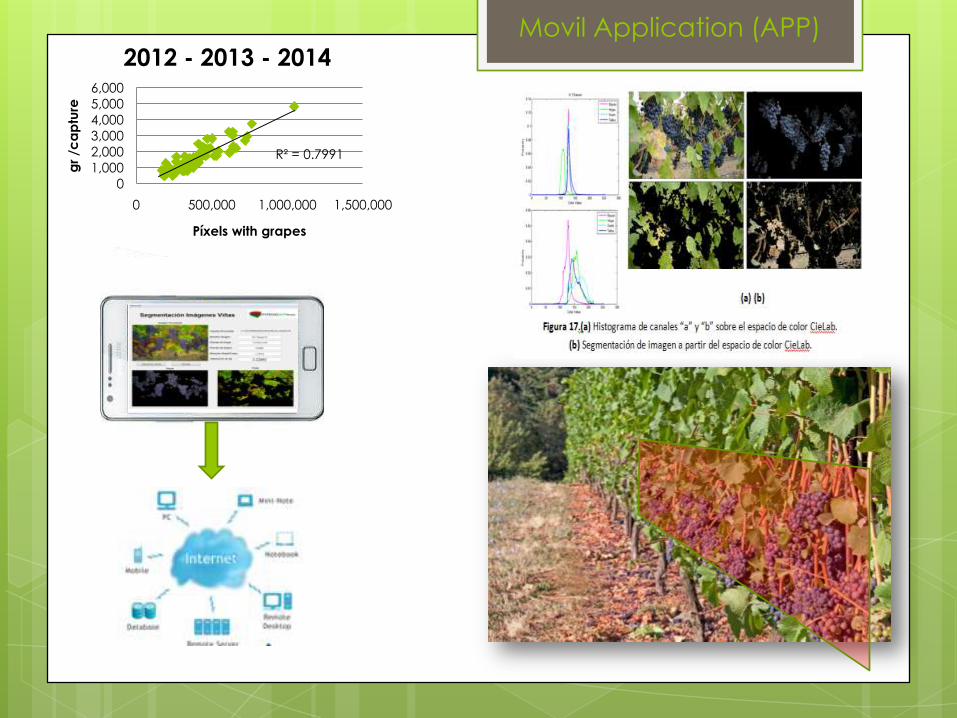
Movil Application (APP)
Kg estimados
3,5 Kg
R² = 0.7991
0
1,000
2,000
3,000
4,000
5,000
6,000
0 500,000 1,000,000 1,500,000
gr
/ca
ptu
re
Píxels with grapes
2012 - 2013 - 2014
AUTOMATIC
CAPTURES
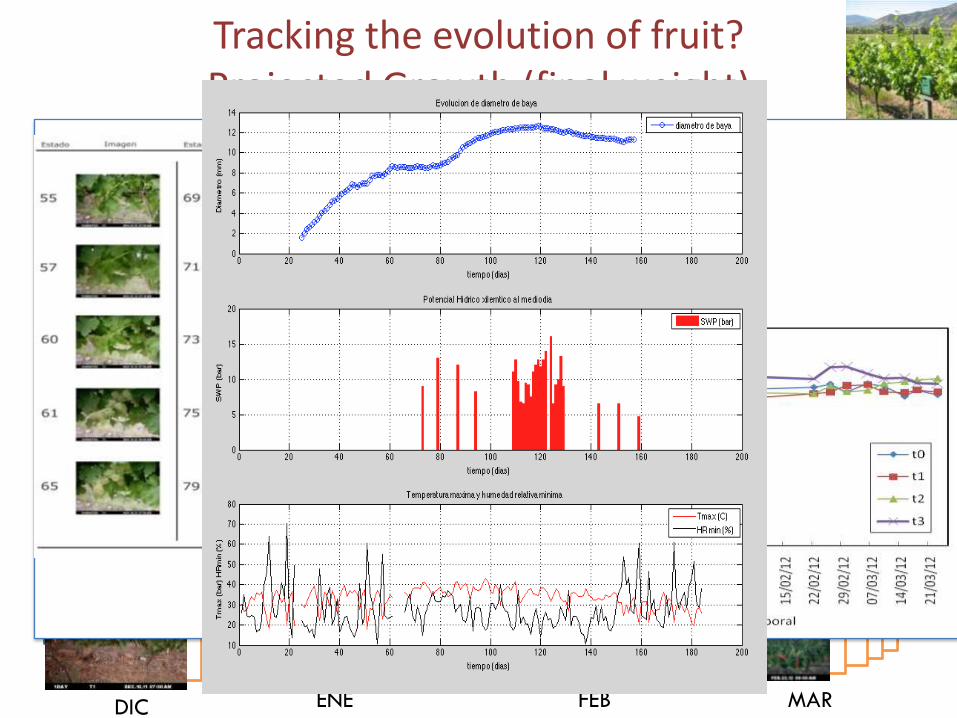
DIC ENE FEB MAR
TIME LAPSE
CAMERA
ADVANTAJES
HIGHER TEMPORARY (DIARY)
HIGHER RESOLUTION OF BIOLOGICAL CHANGES
LOG AUTOMATED time-lapse.
Tracking the evolution of fruit? Projected Growth (final weight)

AUTOMATIZATION
TIME LAPSE
CAMERA
SOIL SENSOR
WEATHER
SENSOR
MICROPROSESOR
DATALOGER
TRANSMISSION
DATA
GPRS

Quality

Calidad de uvas a vinificar
41
Mar-4-2011
Ferari Index
Winemaker evaluation
Quality Management of Fruits

“Digital Terroir”: Progress and Understanding the Problem

NDVI seasonal changes
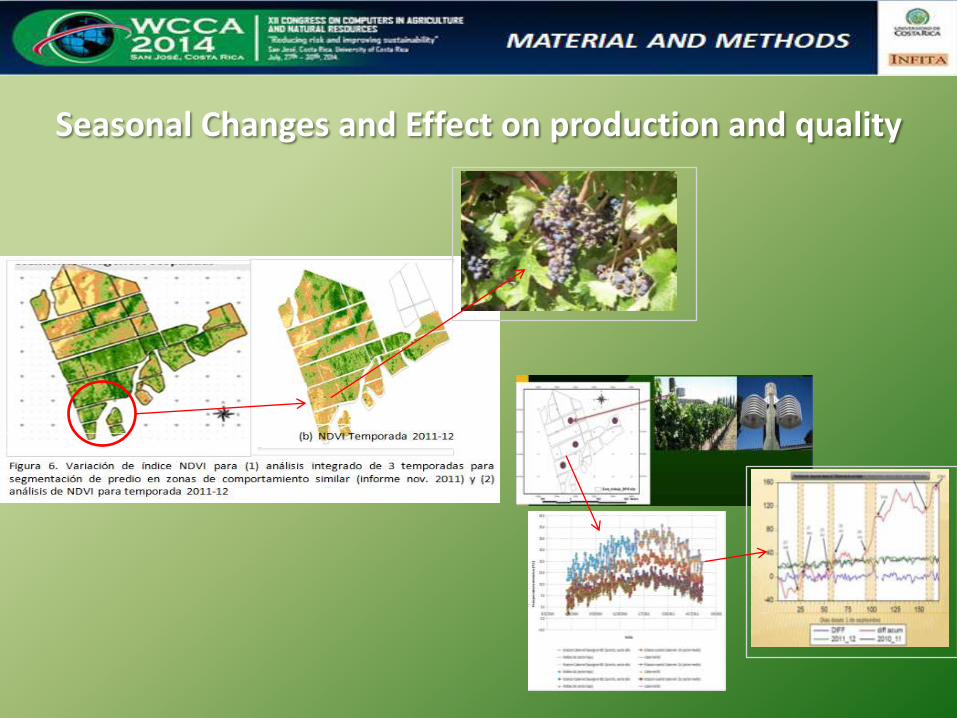
Seasonal Changes and Effect on production and quality

Comparative of Grapes Chemical Quality characteristics and NDVI map

Topography NDVI Maps Exposure Maps CE Maps (EM38)
Variety High Quality Medium Quality Low Quality
Cabernet Sauvignon 7,01% 10,81% 2,21%
Malbec 1,89% 5,63% 3,57%
Carmenere 4,97% 6,38% 1,03%
Association of soil and plant variables with grapes chemical
quality characteristics

Characterizing differential
maturity

Laboratory analyze(under controlled lighting conditions)
Rojo Verde Azul
Filtro 5 Filtro 6 Filtro 7 Filtro 8
LuminanciaRGB
R² = 0.7
4950
5000
5050
5100
5150
5200
5250
5300
5350
5400
5450
5500
1120 1140 1160 1180 1200 1220 1240 1260 1280 1300
Re
flac
tan
cia
85
0 n
m (
ND
)
Contenido Antocianos totales (mgr/lt)
Evaluación del contenido de antocianos totales y Reflactancia a 940 nm
antocianinas tot (BpH1) Lineal (antocianinas tot (BpH1))
R² = 0.81
5400
5500
5600
5700
5800
5900
6000
1120 1140 1160 1180 1200 1220 1240 1260 1280 1300
Lum
inic
en
cia
(ND
)
Contenido Antocianos totales (mgr/lt)
Evaluación del contenido de antocianos totales y Luminicencia
antocianinas tot (BpH1) Exponencial (antocianinas tot (BpH1))

Advances in Detection and Control of Weeds, Pests and Diseases

Weed Control
• Screening of weed detection
- Digital morphological characterization
(resistance)
Recognition and dimamica growth species by "image technoloy"

– Poor assessment of time and place of application
Evaluating the objectives by UAV technology in
combination with multi-and hyperspectral survey
Using UAV equipment for determination of zones of varying degrees of infestation.
Weed Control

• Screening of plant resistant
- Spectral characterization "fingerprinting"
Weed spatial discrimination by spectral information
Weed Control
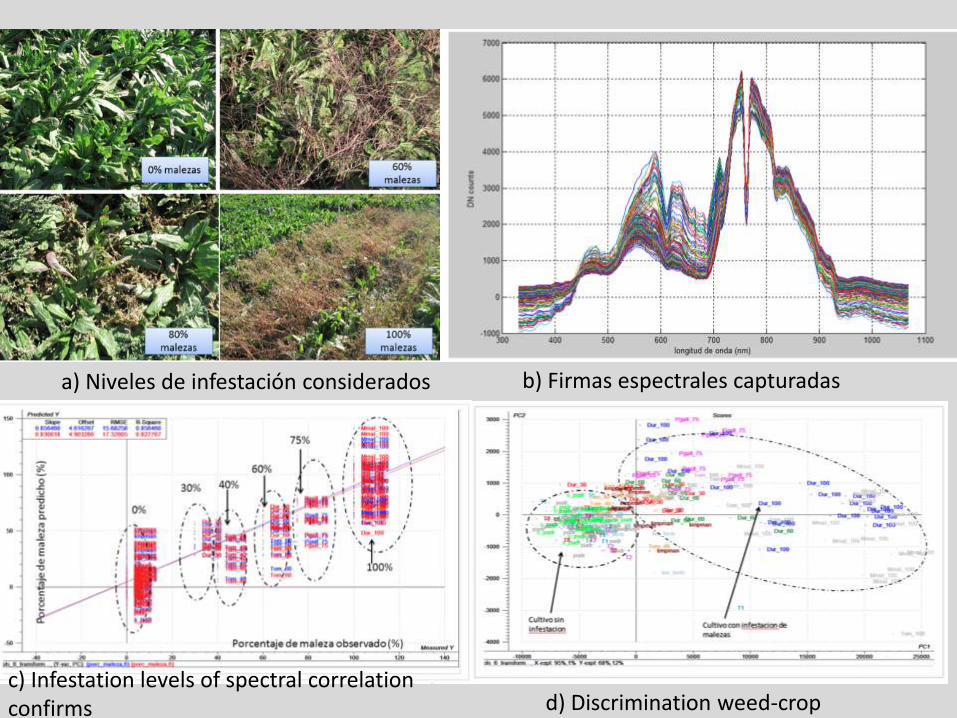
• q
a) Niveles de infestación considerados b) Firmas espectrales capturadas
c) Infestation levels of spectral correlation confirms d) Discrimination weed-crop

Detection system for diseases in field crops
54
2011 2012 2013
14 16 18 20 22 24 26 28 30 32 34 36
Example of multicamera sensing in vineyard conditions
FORCE-A, KULEUVEN, CSIC, INIA

Monitoring of Botrytis on bunches before harvest (pre-harvest)
Bunch disorders and diseases can be detected at early stages by measuring optical changes intissue and berries.
The changes in properties of juice and berry matrix (as water, sugar, acids content) can inducemodifications of reflectance-transflectance spectra and activity.
At early stages these effects are not visible to the human eye.
Botrytisinoculation and
monitoringdeveloped
He
alty
Ap
pe
aran
ceo
fB
otr
ytis
sym
pto
ms
Evid
en
tB
otr
ytis
sym
pto
ms
IN LABORATORY
Point-wise spectral reflectance in visible and NIR range
Thermal camera

• Plant Disease detection and control
a) Discrimination of susceptible plants to diseases by use hyperspectral imagines; b) Robotic pesticide application (source: crops Project INIA-EEC)
Disease control

Applications
Crop Monitoring
Quality control
Automating processes
Anomaly Detection
others
Computer vision
technology

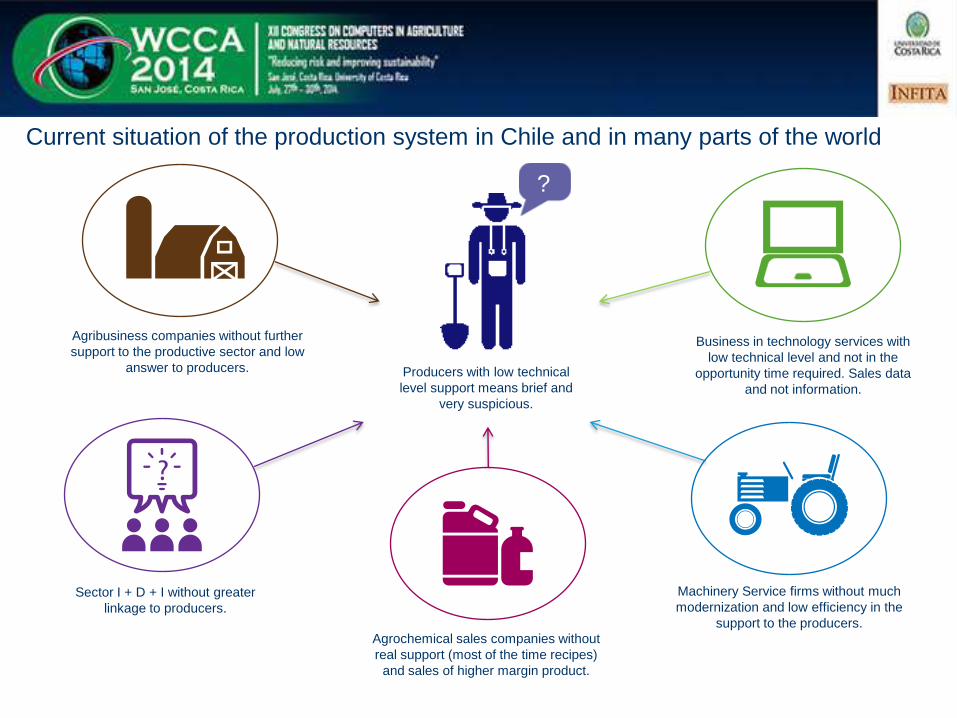
Current situation of the production system in Chile and in many parts of the world
Sector I + D + I without greater
linkage to producers.
Agribusiness companies without further
support to the productive sector and low
answer to producers.
Business in technology services with
low technical level and not in the
opportunity time required. Sales data
and not information.
Machinery Service firms without much
modernization and low efficiency in the
support to the producers.
Agrochemical sales companies without
real support (most of the time recipes)
and sales of higher margin product.
Producers with low technical
level support means brief and
very suspicious.
?
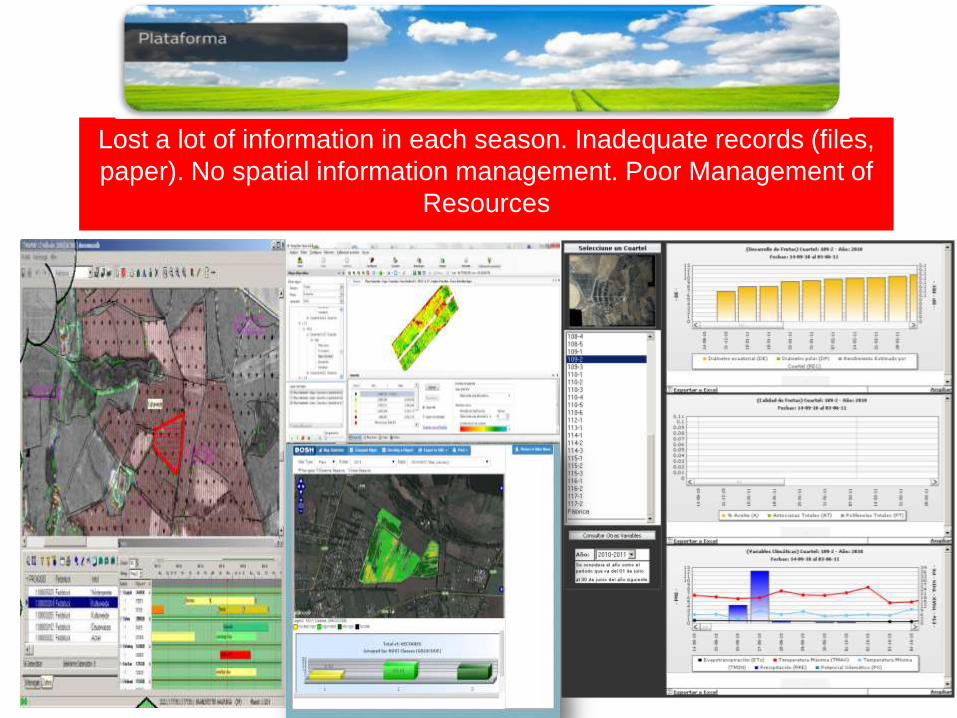
Lost a lot of information in each season. Inadequate records (files,
paper). No spatial information management. Poor Management of
Resources
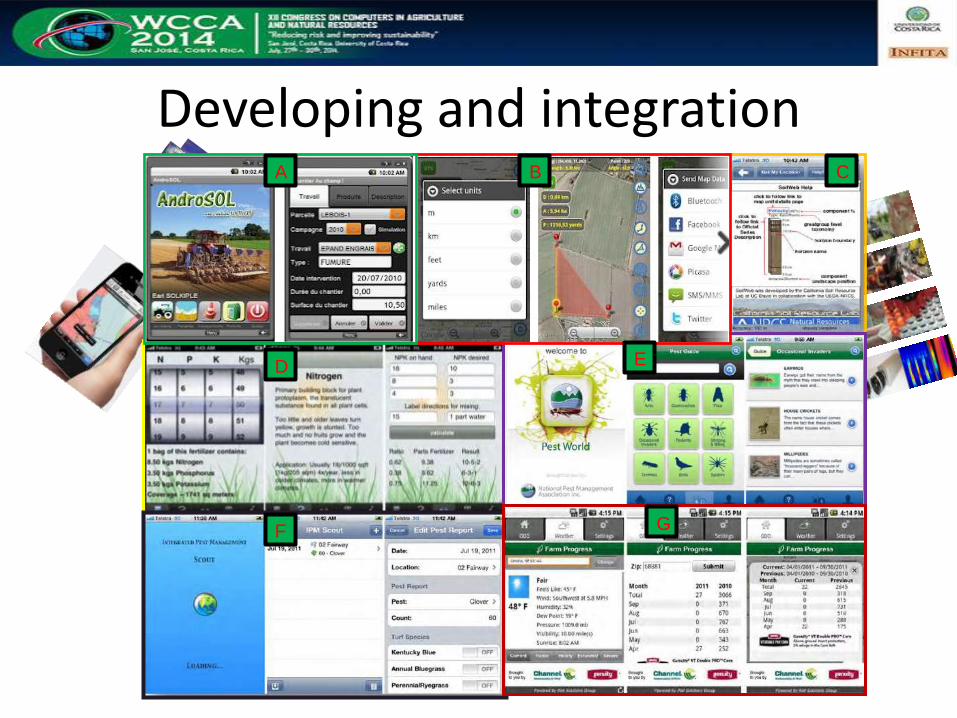
Developing and integration
ProductosBiológicos
Processes
Data Analysis and presentation of
result (maps, curves, tabular, etc..)
Automated analysis
Biostatistics Process Control,
etc..
A B C
D E
GF


Future of Crops Monitoring
and Management
(Vineyard Example)
Pre-Harvest Map Harvest MapSpatial
Predictive Models
Variation of management based
monitoring (alert)/prediction. All
in a interactive platform
Integrated Vision
Winemaking and Viticulturist
diagnosis
Irrigation
Remote Sensing
Quiality
Yield
Soil
wheater
Close Monitoring

Expected Benefit
Sustentability
Better Market Opportunities
Service quality obtained
Diferenciation
Trazability
Savings for better management and efficiency
Digital Integration Information

Eff
ect
on
labor
shor
tage
2007
Navigation system
(Deere: Pararel track, etc.)
Automatic Guidance system
(Deere: AutoTrack, etc.)
Autonomous vehicle
2014 2021
Intelligent robot
integrating with PF
Future Expectations in Agriculture Growth in Robotics
Multi-robot system
2000

Automated Orchard Systems?
Mechanical HarvesterRobotic AplicationsAut. System Monitoring
Orchard Design Automated IrrigationUAV - Remote Sensing

The age of new technological convergences The PF as a macro technological convergence
New technological, Economical and organizational paradigm :
• We need to change from homogenizer logic into diversity logic.
• Mutual empowerment. Advances in some technology drastically accelerate others.
• The different technologies must be "enabled" to work with others.
• "Synergistic combination" of two or more generic technologies in the search for common goals.
• It clear that ICT integrated into the internet cloud will be the way to pull down the different technologies in the hand of the final user but, those development must integrate a social and technology issues, in order to full fit the goal of real introduction.

ww
w.a
idic
.it/
fru
tic FRUTIC ITALY 2015
The 9th Fruit, nut and vegetable
production engineering symposium
19-22 May, 2015 - Milano, Italy
The conference will be held in Milan, during the Expo Milano2015 (www.expo2015.org) and IPACK – IMA (www.ipack-ima.it), which present for the first time FRUITECH(www.fruitech.it), an exhibition focused on processing,packaging, preservation, and transportation technologies forfruit and vegetables.
Topics
• Precision Agriculture in the orchard
• Sensors and Automation for orchards and transformation processes
• Logistics in the harvest and post-harvest
• Technologies for the pre- and post-harvest
• The measure of quality
• The equipment for packaging
• Sustainability in fruit and vegetables cultivation
http://www.aidic.it/frutic/

Thank you very much for your attention