Embed Size (px)
Citation preview
ADVANCES IN ION CHROMATOGRAPHY
FOR ENVIRONMENTAL APPLICATIONS
by
RIDA SADEK AL-HORR BS
A DISSERTATION
IN
CHEMISTRY
Submitted to the Graduate Faculty
of Texas Tech University in Partial Fulfillment of the Requirements for
the Degree of
DOCTOR OF PHILOSOPHY
Approved
Chairperson of the Committee
Accepted
Dean of the Graduate School
August 2003
ACKNOWLEDGMENTS
I would like to express my deep appreciation to my research advisor Pumendu K
Dasgupta P W Horn Professor of Chemistry It is due to his enlightened guidance and
strong support pounduid encotiragement that I was able to present this work I also would like
to thank Dr Carol Korzeniewski and Dr John N Marx for their assistance and valuable
comments throughout my graduate studies
I would like to acknowledge Jianzhong Li Gautam Samanta Charles B Boring
Genfa Zhang Rahmat S Ullah Kevin Morris and all other research group members for
their assistance in various aspects of this work
I owe a lot to my brother Hadi Al-Horr for his help and support and I am
especially thankful to my family members for their inspiration and motivation I also
thank my fiance Yasmin Soussan for her patience and understanding
TABLE OF CONTENTS
ACKNOWLEDGEMETS ii
ABSTRACT iv
LIST OF TABLES vi
LIST OF FIGURES vii
LIST OF ABBREVIATIONS xi
CHAPTER
I INTRODUCTION 1
II TWO-DIMENSIONAL CONDUCTOMETRIC DETECTION IN ION CHROMATOGRAPHY SEQUENTIAL SUPPRESSED AND SINGLE COLUMN DETECTION WITH PASSIVE HYDROXIDE INTRODUCTION 18
III FIELD MEASUREMENT OF ACID GASES SOLUBLE ANIONS IN ATMOSPHERIC PARTICULATE MATTER USING A PARALLEL PLATE WET DENUDER AND AN ALTERNATING FILTER-BASED AUTOMATED ANALYSIS SYSTEM 53
IV A CONTINUOUS ANALYZER FOR SOLUBLE ANIONIC CONSTITUENTS AND AMMONIUM IN ATMOSPHERIC PARTICULATE MATTER 97
V SEMI-CONTINUOUS MEASUREMENT OF MAJOR INORGANIC SOLUBLE GASEOUS AND PARTICULATE CONSTITUENTS IN SEVERAL MAJOR US CITIES 132
VI SUMMARY AND CONCLUSIONS 184
ni
ABSTRACT
Ion cliromatography (IC) is a widely used analytical tool for the determination of
many ionic species Applications of ion chromatography extend over a wide range of
chemical analyses Introduction of eluent suppression in the mid-1970s extended the
botmdaries of conductometric detection into trace analysis Ctirrent state-of-the-art IC
systems require only water to operate exhibit excellent reliabilities and provide the
ability of sample preconcentration and simultaneous multiple ion measurement making
them attractive for atmospheric analysis
Atmospheric particulate matter (PM) contains many inorganic and organic soluble
ions A number of those are weak acid anions that are largely undetectable in suppressed
ion chromatography An improved method that uses sequential suppressed and
unsuppressed IC for the sensitive detection of both common anions and very weak acid
anions has been investigated After suppressed conductometric detection the effluent is
passed into a membrane device where KOH is passively introduced into the eluent stream
using Donnan forbidden leakage
High temporal resolution measurement of atmospheric gases and constituents of
atmospheric particulate matter (PM) is important to understand the chemistry and sources
of atmospheric pollution New continuous collection devices coupled with IC systems for
fully automated measurement of soluble inorganic gases and soluble ionic constituents of
atmospheric PM have been developed Soluble gas collection is accomplished with a
parallel plate wet denuder (PPWD)
iv
For particle collection an automated alternating filter-based system was initially
developed This system uses two glass-fiber filters that alternate between sampling and
washing and drying More recently a continuous soluble particle collector (PC) of
simpler design has been developed this device does not use steam Preceded by a
denuder and interfaced with an ion chromatograph this compact collector permits
automated collection and continuous extraction of soluble anions and ammonium ion in
atmospheric particulate matter The systems have been deployed in a number of major
field studies held in urban and suburban locations in the United States
LIST OF TABLES
31 Fotir states of the instmment programmed chromatograph TTL outputs and outputs of Integrated Circuit Chips UI and U2 85
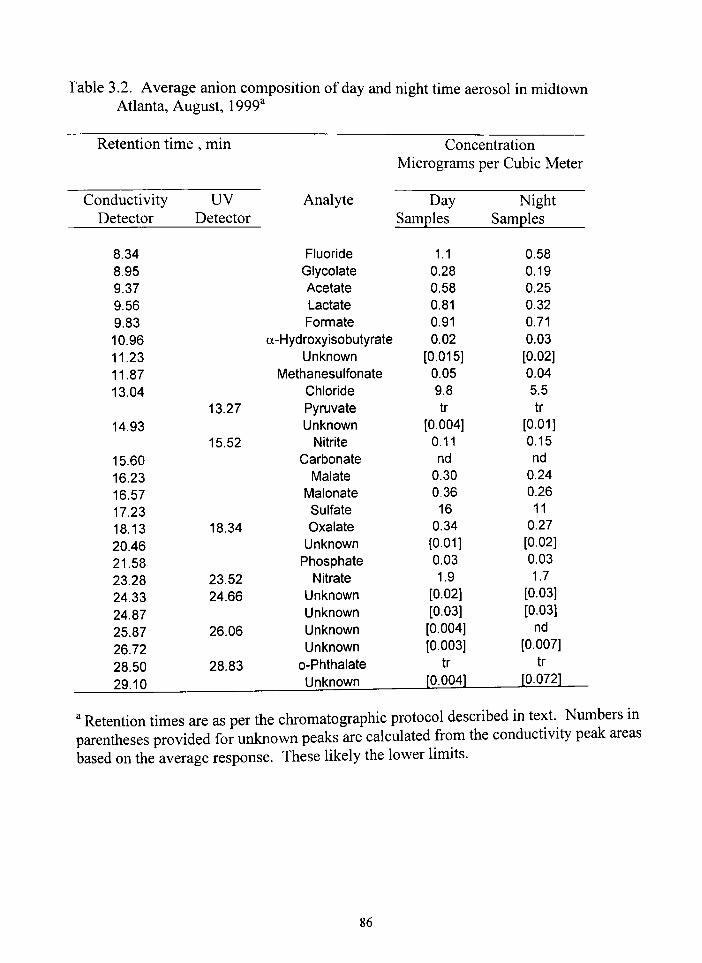
32 Average anion composition of day and night fime aerosol in midtown Atlanta August 1999 86
33 Organic anion composition of aerosol filter samples collect in Houston TX 2000 and Philadelphia PA 2001 and identified by IC-MS 87
41 Count median diameter mass median diameter and mass median aerodynamic diameter of particle generated by VOAG with
different feed (NH4)2S04 solution doped with fluorescein 121
42 Loss of aerosols in the PPWD and the air-inlet nozzle of the PC 122
51 Sampling locations and available measurements 157
52 Day and night correlafion of NO3 N02 HONO and HNO3 measured in four cities 15 8
VI
LIST OF FIGURES
11 Schemafic of electrolytic suppressor mechanism 17
21 Theoretical response plots 40
22 Cassidy plot of response sensitivity in linear axes 41
23 Experimental system 42
24 Base introduction device designs 43
25 Current efficiencies observed with electrodialytic devices with different membranes 44
26 Background noise in electrodialytic devices with different membranes 45
27 Passive Dorman leakage of KOH through various sheet membranes as a function of feed KOH concentration 46
28 Donnan leakage of different alkali hydroxides through the RAI PTFE membrane 47
29 Dependence of Donnan leakage on tubular membrane dimensions 48
210 Detection of 06 |JM borate in a sample mixture on the second detector 49
211 Second detector response to various analytes 50
212 2D ion chromatogram under standard conditions 51
213 2D ion chromatogram of an air filter sample extract 52
31 Wetted denuder shovra schematically 88
32 Particle collection system 89
33 Particle system set up 90
34 Schemafic ofelectronics governing instrument operation 91
VII
35 HN03Nitrate HONONitrite and S02Sulfate patterns at a midtown location in Atlanta GA 92
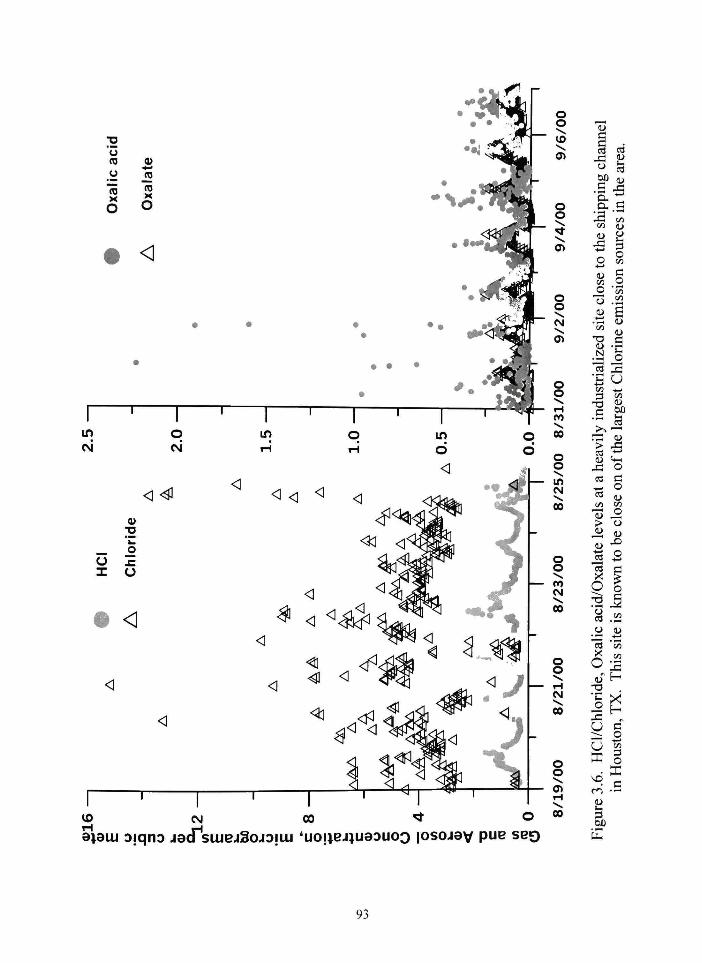
36 HClChloride Oxalic acidOxalate levels at a heavily industrialized site close to the shipping chaimel in Houston TX 93
37 Representative chromatograms 94
38 Gradient ion chromatogram of an aerosol collected during the Atlanta experiment 95
39 Log R versus log [eluent] plots 96
41 Particle collector 123
42 Field sampling and airflow schematic 124
43 Total particle collectionanalysis system 125
44 Penetration curve of standard size polystyrene beads in the particle collector with a cyclone-style inlet 126
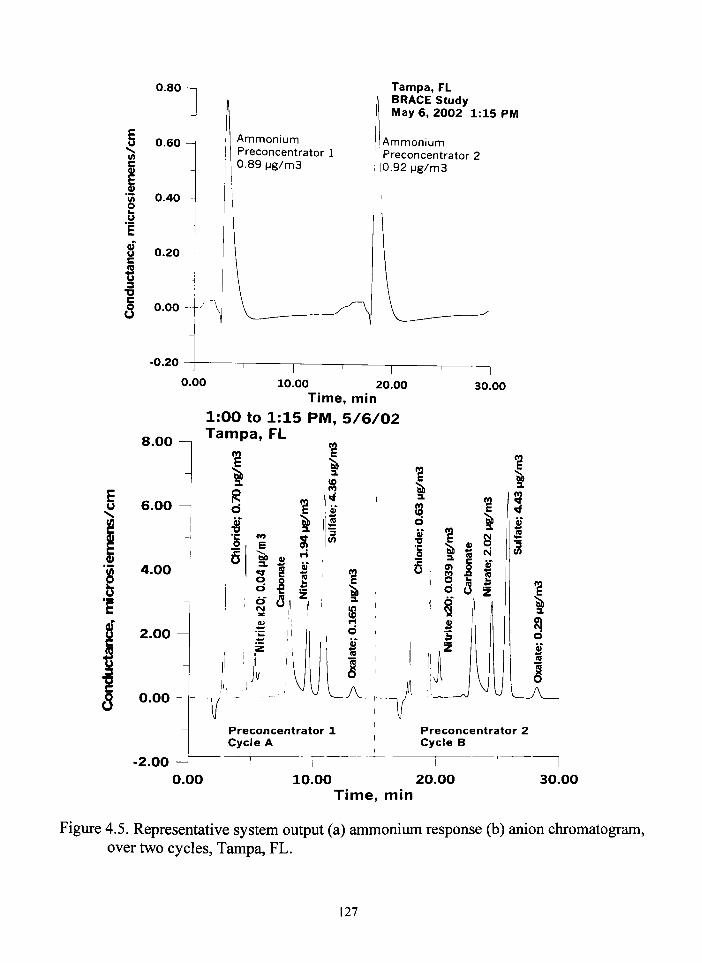
45 Representative system output 127
46 Integrated sulfate measurements versus sulfate measured by present instrtiment 128
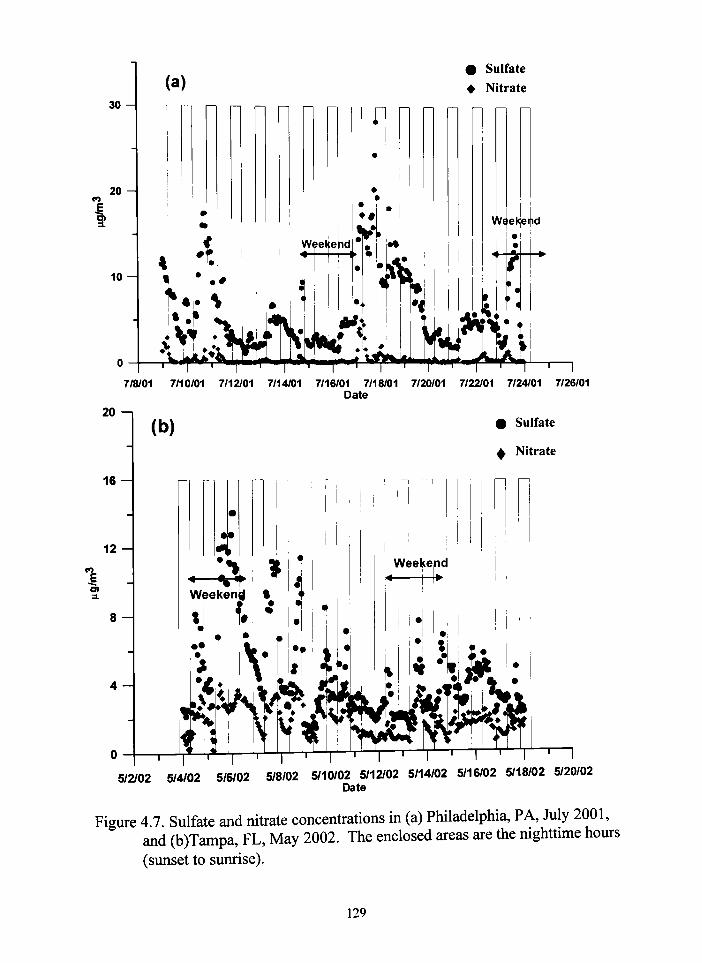
47 Sulfate and nitrate concentrations 129
48 HCI and particulate Nitrate patterns in Tampa FL 130
49 SulfateAmmonium equivalent ratio with sulfate and ammonium equivalent concentration patterns Tampa FL 131
51 Average minimum and maximum concentration of soluble ions in particulate matter measured in four studies 159
52 Average minimum and maximtim concentration of soluble acid
gases and ammonia measured in three studies 160
53 Deployment location at HRM 3 161
54 SulfateSulfur dioxide measured patterns in Philadelphia PA 162
vni
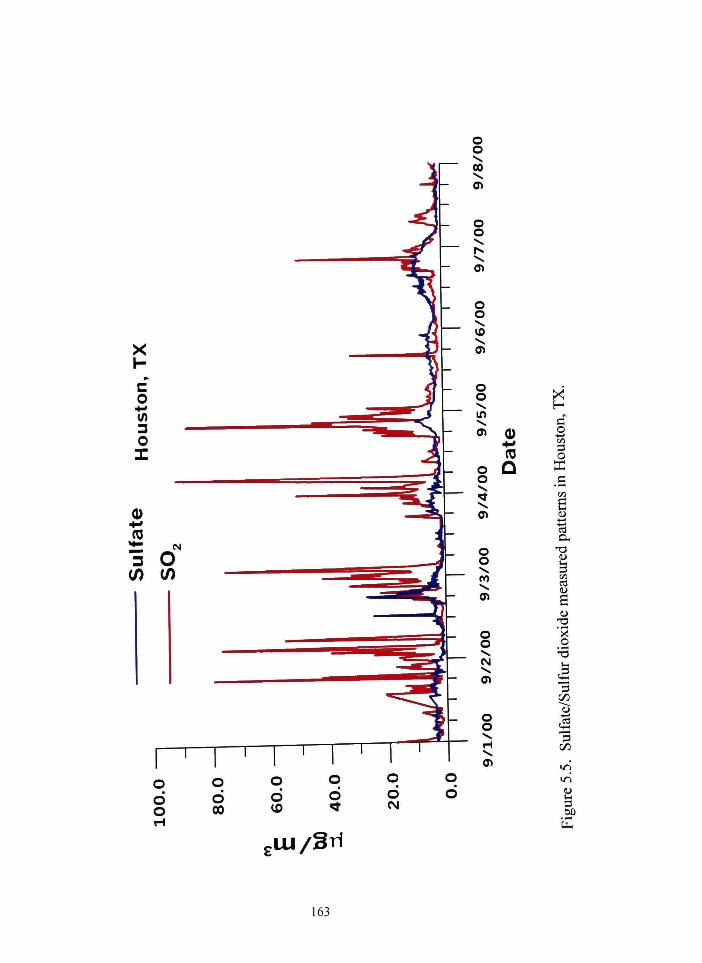
55 SulfateSulfur dioxide measured patterns in Houston TX 163
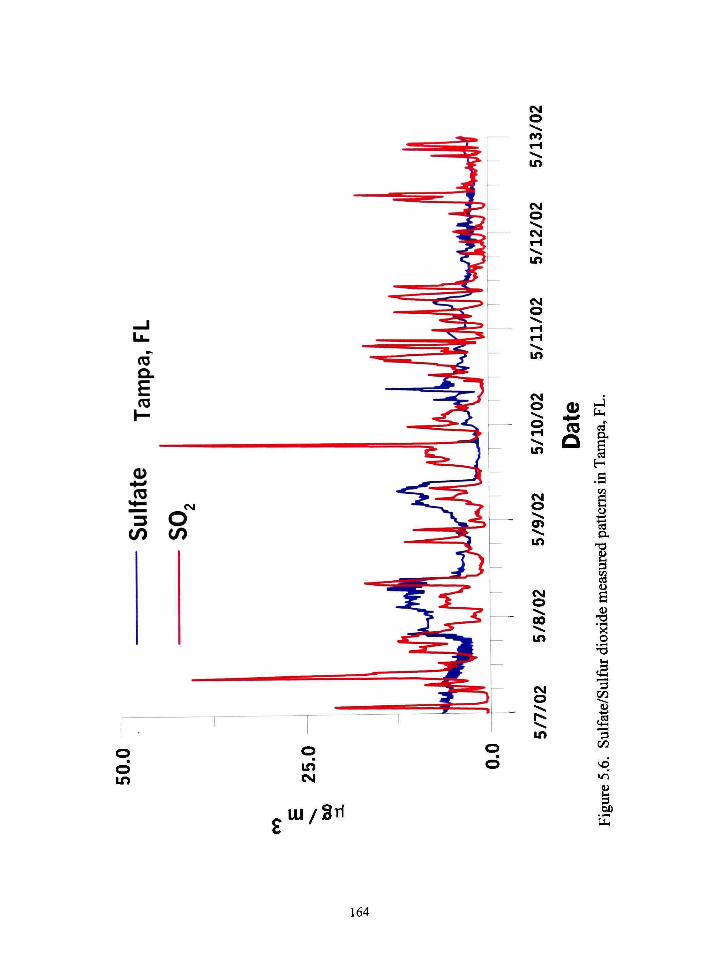
56 SulfateSulfur dioxide measured patterns in Tampa FL 164
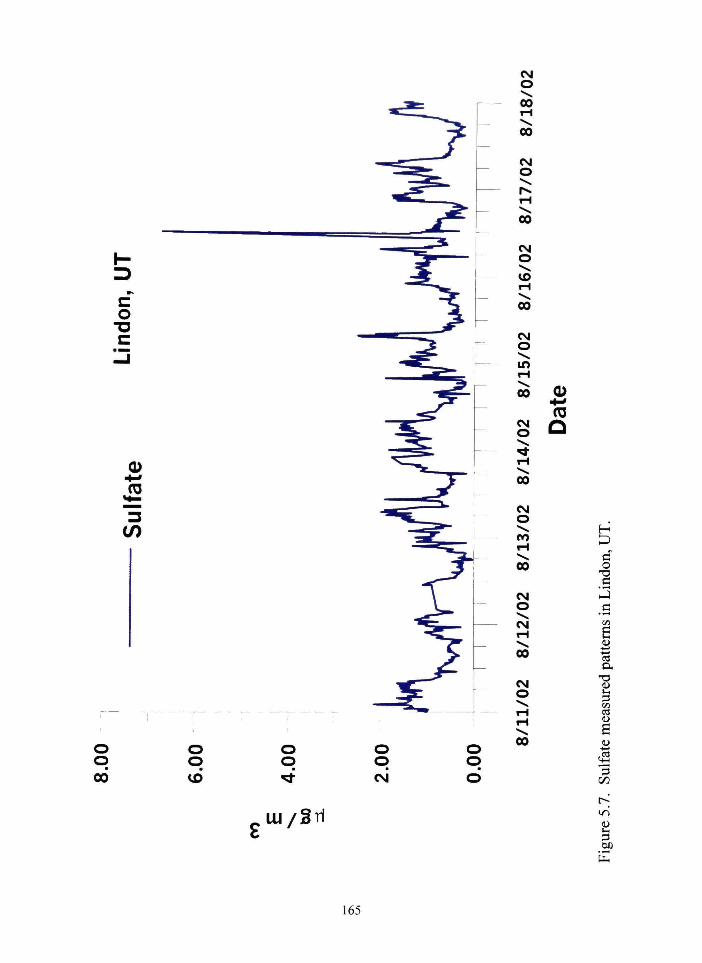
57 Sulfate measured patterns in Lindon UT 165
58 Pattern of HNO3 and HONO in Philadelphia 166
59 Pattern ofN02and NO3 in Philadelphia PA 167
510 Pattern of HONO and HNO3 in Houston TX 168
511 Pattern of NO2 and NOB in Houston TX 169
512 Pattern of HNO3 and NO3 in Tampa FL 170
513 Pattern of HONO and NO2 in Tampa FL 171
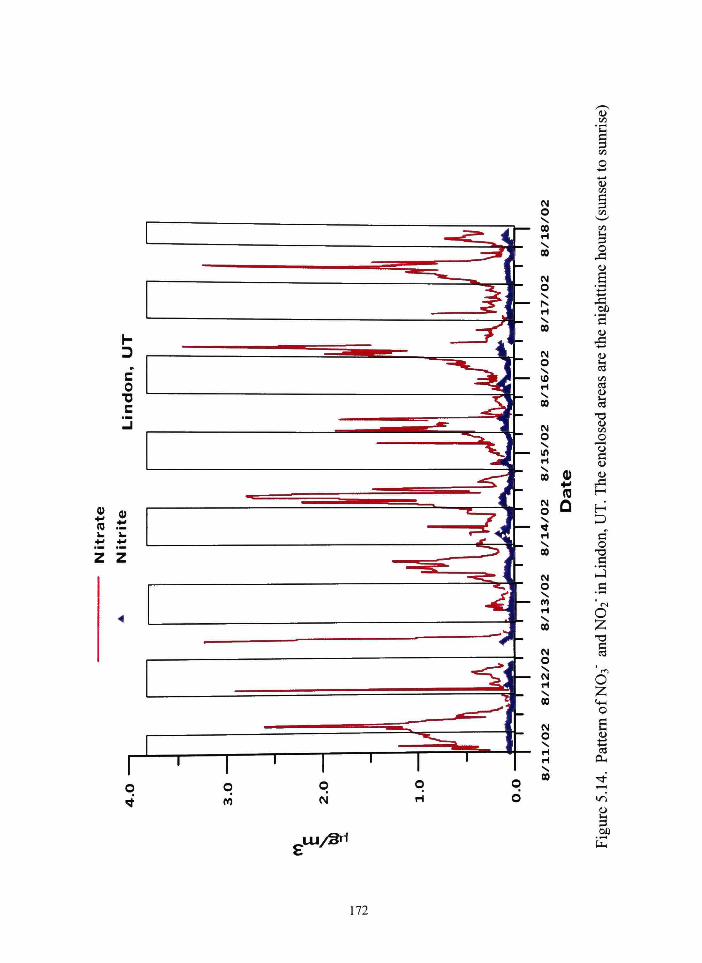
514 PattemofN03 and NO2 in Lindon UT 172
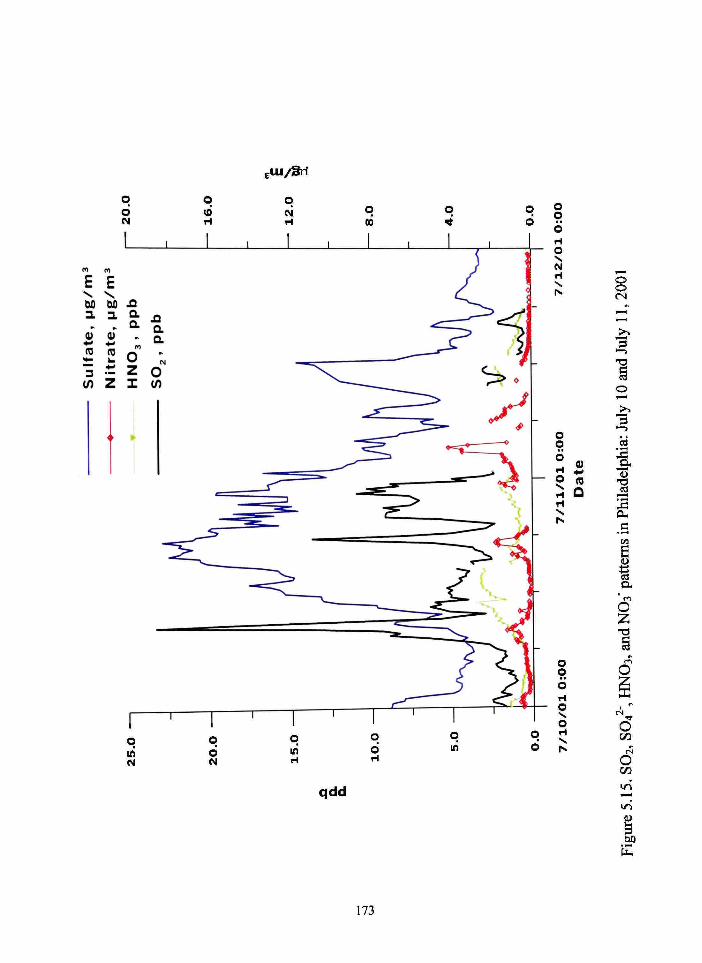
515 SO2 S04^ HNO3 and N0 patterns in Philadelphia July 10-July 112001 173
516 8O2 804^ HNO3 and NO3 patterns in Philadelphia July 17-July 182001 174
517 SO2 S04^ HNO3 and NO3 patterns in Philadelphia July 21-July 26 2001 175
518 Wind direction and solar radiation in Philadelphia during high PM
and trace gases episodes 176
519 HCI HNO3 and NOi patterns in Tampa FL 177
520 HCI CI and relafive humidity patterns in Tampa FL 178
521 Total anion equivalents equivalent NH4 and NH3 concentration in Philadelphia PA 179
522 Total anion equivalents equivalent NH4 and NH3 concentration in Houston TX 180
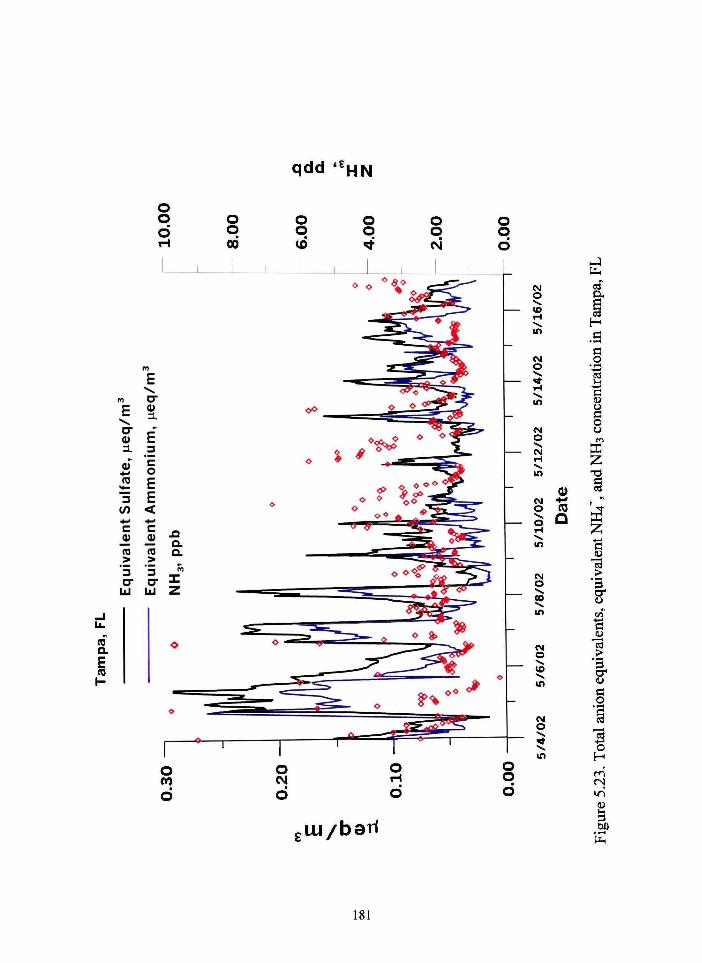
523 Total anion equivalents equivalent NH4 and NH3 concentration in Tampa FL 181
IX
524 Equivalent ammonium versus equivalent sulfate in Tampa FL 182
525 Total anion equivalents equivalent NH4 and NH3 concentration in Lindon UT 183
LIST OF ABBREVIATIONS
ac alternating current
A Ampere
cm centimeter
CC concentrator column
degc
DPM
dc
FTF
FFAH
FPD
FV
ft
GF
H
Hz
HPLC
hr
degree Celsius
digit panel meter
direct current
fiber trap filter
filament filled annular helical
flame photometric detector
flame volatilization
feet
glass fiber
height
hertz
high performance liquid chromatography
hour
in inch
id irmer diameter
IC ion chromatography
XI
Kg
L
LOD
LC
MFC
MS
m
MENG
Heq
tgm^
|jL
im
[M
^S
mA
mL
mm
mM
min
nL
nm
od
kilogram
length
limit of detection
liquid chromatography
mass flow controller
mass spectrometry
meter
microelectrodialytic NaOH generator
microequivalent
microgram pre cubic meter
microliter
micrometer
micromolar
micro Siemen
milliampere
milliliter
millimeter
millimolar
minute
nanoliter
nanometer
outer diameter
xu
PPWD
PC
PCS
ppb
ppm
ppt
Wi2
PFA
Pg
PEEK
PVC
PVDF
RE
RSD
^R
S
SN
SLPM
PTFE
TTL
2DIC
UV
parallel plate wetted denuder
particle collector
particle collection system
part per billion
part per million
part per trillion
peak half-width
perfluoroalkoxy Teflon
picogram
polyether ether ketone
polyvinyl chloride
polyvinylidine fluoride
relative humidity
relative standard deviation
retention time
second
signal-to-noise ratio
standard liters per minute
Teflon
transistor transistor logic
two-dimensional ion chromati
ultraviolet
Xlll
V volt
W watt
w width
xiv
CHAPTER I
INTRODUCTION
Chromatography has become a principal tool for the rapid separation and
characterization of many classes of compotmds Although Brunschwig a Strasbourg
stirgeon purified ethanol by a chromatographic technique (1512) and Day an American
geochemist separated crude oil on Fullers earth (1898-1903) it was the work of Mikhail
Tswett a Russian botanist who managed to separate plant pigments that marked the first
systematic study and is recognized as the beginning of chromatography These results
were first presented as a public lecture in 1903 and this year is thus being celebrated as
the centermial year for the separation sciences and for chromatography in particular
Chromatography (chromatus = color and graphein = to write) has come a long
way since it was first invented by Tswett Chromatography is a technique for separating a
multi-component sample into various purer fractions that are detected downstream with
an appropriate detector Any chromatographic process involves two mutually immiscible
phases^ These are the stationary and the mobile phase The stationary phase could be
solid or liquid attached to an inert support material The mobile phase also referred to as
the eluent or the carrier is the solvent that flows through the stationary phase The mobile
phase which could be liquid or gas mobilizes the sample through the stationary phase in
a process known as migration Separation occurs because different compounds have
different migration rates which are due to their different affinity for the stationary and
the mobile phases During the migration process each compound is present at equilibrium
between the mobile and the stationary phase The slower the migration rate of a
compoimd the higher the fraction of that compound present in the stationary phase and
vice-versa
The original chromatographic system now referred to as classical column
chromatography was a glass coltimn containing a packing of fine particles in which the
solvent or the mobile phase flowed by gravity^ Though this kind of chromatography is
extremely flexible in that many different combinations of packing and solvents can be
used it is tedious with poor reproducibility rendering it impractical for most of todays
analyses However it is still practical for large scale purification of many organic
substances especially for mixtures produced in developing organic synthetic
methodology and in purifying many biomolecules
Since then the practice of chromatography has experienced many changes and
improvements The advent of paper chromatography in the 1940s and thin-layer
chromatography (TLC) in the 1950s greatly simplified the practice of analytical liquid
chromatography Today column chromatography routinely produces faster separation and
better resolution than TLC Column chromatography can be divided into gas
chromatography (GC) liquid chromatography (LC) and supercritical fluid
chromatography (SFC) to reflect the physical state of the mobile phase
Modem liquid chromatography is typically operated at high pressure several
thousand psi^ It is refen-ed to as high-pressure liquid chromatography or high
performance liquid chromatography (HPLC) LC embraces several distinct types of
interaction between the liquid mobile phase and the various stationary phases When the
separation involves predominantiy a simple partition between two immiscible liquid
phases one stationary and one mobile the process is called liquid-liquid chromatography
(LLC) In liquid-solid chromatography (LSC) also called adsorption chromatography
the retentive ability of the stationary phase is mainly due to its physical surface forces
Ionic or charged species are usually separated in ion exchange chromatography (IC) by
selective exchange with counterions of the stationary phase Today ion exchange
chromatography is practiced in almost every field of science^
Ctirrent Technology and Svstem Requirements
Ion chromatography is the principal analytical tool used in this research The
general system components are described in this section with more focus on anion
exchange chromatography Modern IC system requirements are in many regards similar
to those of an HPLC system However there are some components that are unique to IC
The general components include a high pressure eluent pump a separator column
(usually preceded by a guard column) a suppressor and finally a detector
Ptimping and Eluent svstem
A high-pressure (up to 5000 psi) piston pump is used to pump the eluent or in
todays state-of-the-art IC systems deionized (DI) water through the chromatography
system IC pumps may have single head or dual heads^ Each head has its own piston and
two check valves to control the direction of liquid flow The pistons are connected to an
eccentric cam whose movement controls that of the pistons Usually all liquid transfer
lines and wet system components are made of polyether ether ketone (PEEK) Stainless
steel can also be used in non-corrosive environments
Modern state-of-the-art IC systems require just water to operate Eluents are
electrolytically generated^^online during the analysis The process offers substantial
benefits to the practice of IC In addition to the operational simplicity of such a system it
is effective in eliminating carbonate formation in manually prepared hydroxide eluents
Carbonate is a stronger anion eluent than hydroxide and its presence in variable
concentrations in the eluent can lead to poor separation reproducibility and detection
limits^ In suppressed conductometric detection it increases backgrotmd levels and
generates baseline shifts in gradient separations
The eluent generator unit is placed after the pump and contains a cartridge of
potassium hydroxide (KOH) or methanesulfonic acid (MSA) for anion or cation eluent
generation respectively The cathode and anode are separated by an ion exchange
membrane For anion chromatography hydroxide is generated at the cathode according to
the following reaction
2H20 + 2e- -gt 2 0H- + H2(g) (11)
while at the anode the feed solution contains KOH from the cartridge
2 0 H - - 2 e - ^ H2O +202(g) (12)
Then K is transferred across the cation exhange membrane to the cathode to form KOH
The concentration of the eluent produced is changed by simply changing the supplied DC
current
Columns of Ion Exchange Resin
The separation of cations and anions on ion exchange resin goes back many years
before IC became widely accepted as an analytical tool Ion exchange resin beads can
be made of silica but more commonly of polymers such as polystyrene or polyacrylate
The polystyrene based exchange resins are made by copolymerizing styrene with a small
amotmt of divinylbenzene (DVB) for crosslinking The amount of DVB added affects the
rigidity of the beads Microporous beads (gel type) are made with up to 25 weight of
DVB while in macroporous resins the weight of DVB can reach 55^ Ion exchangers
are made by introducing appropriate ionic functional groups into the polymer
Most common anion exchangers are made of two substrate types microporous
substrates which are mainly used as a support for latex coated microbeads or
macroporous substrates^ Anion exchangers are usually functionalized with quatemary
ammonium groups The polymeric benzene ring is first chloromethylated followed by a
reaction with tertiary amine Latex agglomerated ion exchangers have also been
successfully used for various applications of IC These ion exchangers are made by
electrostatically attaching latex microbeads with an approximate diameter of 01 im to
the surface of a relatively large core substrate (5 -30 ^m) For anion exchangers the latex
particles are fiinctionalized with quatemary ammonium groups while the surface of the
core PS-DVB substrate is sulfonated These resin are chemically and physically stable
provide moderate backpressure poundmd high chromatographic efficiency^ Dionex Corp has
made a variety of latex agglomerated resins to develop IC columns for different
applications
Most current cation exchangers are either strong or weak acid exchangers Strong
acid exchangers are functionalized with sulfonic acid groups^ Weak acid exchangers
are ftmctionalized with carboxylic acid or a mixture of carboxylic and phosphonic acid
groups^ They are basically used in applications where separation of cations of different
charge is desired Dionex Corp has made several cation exchangers by coating their latex
coated anion exchange resins described before with a second layer of sulfonated latex
particles The acidic cation exchange latex particles are attached to the aminated latex
particles underneath which are attached to the surface of a sulfonated bead
Suppression
Introduced in 1975 by Small et al^ suppression is a pre-detection step that
eliminates the background eluent conductivity contribution in addition to enhancing the
conductance of the analyte ion (for all but very weakly acidic analytes) As a result both
sensitivity and detection limits are improved After separation the column effluent passes
through a suppressor where Na or K from the eluent is exchanged with H thus
neutralizing the eluent hydroxide and changing the analyte from the Na^ or K^ salt form
to the more conducting acid form Early suppressors were simply columns of cation
exchange resins that required frequent offline regeneration and caused considerable peak
dispersion and broadening Since then the technique has passed through several
refinements In 1981 fiber suppressors were introduced followed by flat membrane
suppressors in 1985^ Basically an ion exchange membrane was used with a constant
flow of a regenerant solution Though the devices did not require offline regeneration
they consumed a relatively large voltime of the regenerant solution In 1989 Strong and
Dasgupta introduced the electrodialytic suppressor Based on the same principle in
1992 Dionex Corp introduced the Self Regenerating Suppressor (SRS)^ Figure 11
shows a schematic of the mechanism of an anion SRS suppressor Basically the SRS is
composed of a cathode and an anode separated by two cation exchange membranes thus
forming three compartments for liquid flow The column effluent containing the eluent
and eluite flows in the middle chatmel between the membranes At the anode side water
flows between the anode and the membrane generating hydrogen ion and oxygen
Anode 2H2O - 46 ^ 4H^ + 202(g) (1-3)
the hydrogen ions permeate through the membrane into the middle channel and replace
the eluent cation (example Na or K) thus neutralizing OH and changing the analyte
from the salt to the acid form which is then measured by conductivity in a neutral
medium The eluent cation (K^) permeates through the other cation exchange membrane
into the cathode Water flowing between the cathode and the membrane generates
hydrogen gas and hydroxide ion (11)
Detection
While developing ion exchange resins is important for the practice of ion
chromatography it is the development of appropriate detection techniquesthat has led to
the rapid evolution of IC Several detection techniques are currentiy used with IC most
commonly suppressed conductivity UV-Vis absorption pulsed amperometry and mass
spectrometry Suppressed conductivity is by far the most widely used detection technique
associated with IC Conductometric detection offers several characteristics that are
particularly attractive for IC analysis Conductivity is a universal characteristic of all
ions and the technique is simple and non destmctive
For a strong acid passing through a conductivity detector the signal Gis ()^Scm)
at any point in the eluite band is directly proportional to eluite concentration C (in Molar)
^ according to
Gs=1000C(^H + ^x) (14)
where AH and AH are the equivalent conductances of H and X respectively In the case
of a weak acid the conductivity signal Giw depends on the dissociation constant K of the
acid
Giw=1000C(LH + ^x) (15)
where C is the concentration of X the dissociated fraction of HX approximated by
solving the quadratic equation
Hence
K = XV(C-X) (16)
l2 C=05(-K+(K + 4KC)0 (17)
the expression for C is an approximation that does not apply at very dilute conditions or
in cases where K is very low since at these conditions the dissociation of HX is affected
by traces of acid present in the background suppressor effluent Chapter II elaborates
more on detection of weak acid anions
Research Presented in this Dissertation
The overall objective of the research presented in this dissertation is to fabricate a
fully automated system for the collection and sensitive analysis of soluble gases and
soluble ionic constituents of atmospheric particulate matter (PM) with high temporal
resolution Such meastirement is substantially powerftal in that it can provide chemical
and physical differentiation and correlate tropospheric conditions with gas particle
chemical and physical interaction^ ^ PM constitute a wide range of different kinds of
particles that vary widely in chemical composition size and toxicity Ion
chromatography provides a convenient analytical tool for measuring ionic constituents of
PM along with their soluble precursor gases However many constituents of PM are
weak acid anions that are not detectable by suppressed IC Chapter II describes an
improved method for the conductometric detection of both common anions and very
weak acid anions Then in Chapters III and IV fully automated systems for the collection
and measurement of soluble PM constituents and gases are described The resuhs of field
meastirement in several US cities are presented in Chapter V Finally Chapter VI
emphasizes the significance of this work and presents conclusions and future directions
The contents of Chapters II and III have been published ^ The contents of Chapter IV
has been submitted for publication The contents of Chapter V are being prepared for
submission to a suitable journal
Two-Dimensional Detection in Ion Chromatography Sequential Conductometry after Suppression and Passive Hydroxide Introduction
An improved method that uses sequential suppressed and non-suppressed IC for
the sensitive detection of both common anions and very weak acid anions is described
After suppressed conductometric detection of an electrolytically generated hydroxide
eluent and an electrolytic suppressor the eluent is passed into a membrane device where
potassium hydroxide (KOH) is passively introduced into the eluent stream using Donnan
forbidden leakage The conductivity of the stream is then measured by a second
conductivity detector The background conductance of the second detector is typically
maintained at a relatively low level of 20-30 i^Scm The weak acids are converted to
potassium salts that are fiilly ionized and are detected against a low KOH background as
10
negative peaks The applicability of different commercially available cation exchange
membranes was studied Device configurations investigated include a planar 2-channel
device a tubular device and a filament filled helical (FFH) device The FFH device
provides more effective mixing of the penetrated hydroxide with the eluent stream
resulting in a noise level lt 7 nScm and a band dispersion value of less than 82 |jL
Optimal design and performance data are presented
Meastirement of Acid Gases and Soluble Anions in Atmospheric Particulate Matter using a Parallel Plate Wet Denuder and an Alternating Filter-Based Automated Analysis System
Diffusion based collection of gases is currently the best method to discriminate
between the same analyte present in the gas and particle phase The smallest particle has
a diffiision coefficient several thousand times less than that of a gas molecule Several
denuders and denuder designs have been described Throughout this work a parallel
plate wet denuder (PPWD) was used to collect and remove gases^ The collection
efficiencyfor a parallel plate denuder is given by
= 1 - 091exp(-24wAs) (18)
A = 7xDLQ (19)
where w is the width of the plate s is the separation between them D is the diffusion
coefficient of the gas L is the active length of the denuder and Q is volumetric flow rate
11
A new fully automated instrument for the measurement of acid gases and soluble
anionic constituents of atmospheric particulate matter is presented in Chapter III The
instrtiment operates in two independent parallel charmels In one channel a parallel plate
wet denuder collects soluble acid gases these are analyzed by anion chromatography
(IC) In a second chaimel a cyclone removes large particles and the aerosol stream is
then processed by a second wet denuder to remove potentially interfering gases The
particles are then collected by one of two glass fiber filters which are alternately
sampled washed and dried The washings are preconcentrated and analyzed by IC
Detection limits of low to subnanogram per cubic meter concentrations of most gaseous
and particulate constituents can be readily attained The instrument has been extensively
field-tested some field data are presented Resuhs for the first attempts to decipher the
total anionic constitution of urban ambient aerosol by IC-MS analysis are also presented
A Continuous Analyzer for Soluble Anionic Constituents and Ammonium in Atmospheric Particulate Matter
A new continuous soluble particle collector (PC) is described in Chapter IV this
device does not use steam Preceded by a denuder and interfaced with an ion
chromatograph this compact collector (3 in od ~5 in total height) permits automated
collection and continuous extraction of soluble anions and ammonium ion in atmospheric
particulate matter The PC is mounted atop a parallel plate wetted denuder for removal of
soluble gases The soluble gas denuded air enters the PC through an inlet One version
of the PC contained an integral cyclone-like inlet For this device penetration of
particles as a ftinction of size was characterized In the simpler design the sampled air
12
enters the PC through a nozzle and deionized water flows through a capillary tube placed
close to the exit side of the nozzle by Venturi action or is forcibly pumped The resulting
water mist attaches to the aerosol which impacts on a hydrophobic PTFE membrane
filter that constitutes the top of the PC and the airfiow exit Water drops coalesce on the
filter and fall below into a purpose-machined cavity equipped with a liquid sensor The
water and the dissolved constituents are aspirated by a pump and pumped onto serial
cation and anion preconcentrator columns Ammonium captured by the cation
preconcentrator is eluted with NaOH and is passed across an asymmetric membrane
device which allows the ammonia from the alkaline donor stream to diffuse into a
deionized water receiver stream flowing countercurrent The conductivity of the receiver
effluent is measured and provides a measure of ammonium The anions on the anion
preconcentrator column are eluted and measured by a fully automated ion
chromatography system The total system thus provides automated semicontinuous
meastirement of soluble anions and ammonium With a 15-min analytical cycle and a
sampling rate of 5 Lmin the limit of detection (LOD) for ammonium is 8 ngm^ and
those for sulfate nitrate and oxalate are lt01 ngm^ The system has been extensively
field tested
Semi-Continuous Measurement Of Major Soluble Gaseous And ParticulateConstituents In Several Major Us Cities
The data collected in field measurement campaigns launched at or in the vicinity
of three major urban US cities and one suburban area are presented in Chapter V All of
measurements were conducted in the summertime The chapter focuses on data collected
13
during TexAQS 2000 (Texas Air Quality Study Houston TX) NEOPS 2001 (North East
Oxidant and Particle Study Philadelphia PA) BRACE 2002 Study (Bay Region
Atmospheric Chemistry Experiment Tampa FL) and a measurement campaign in
Lindon UT a suburban location in 2002 Incidents that highlight the importance of
continuous analysis in better understanding gas-particle partitioning heterogeneous
chemistry of PM formation relations between PM growth and precursor gases are
investigated An overview of the observed chemistry at the different sites is also
presented
14
References
1 Skoog D A West D M Holler F J Fundamentals of Analytical Chemistry New York 1992 Ch28 712-713
2 English translation of the lecture is available Berezkin V G Compiler Chromatographic Adsorption Analysis Selected Works ofM S Tswett New York Ellis Horwood 19909-19
3 Isaac H J Ed A century of separation Science New York Marcel- Dekker 2002
4 Centermial Symposium on Chromatography organized by Analytical Chemistry and History of Chemistry Divisions of the American Chemical Society 226 National Meeting of the American Chemical Society
5 Heftmarm E Chromatography adsorption partition ion exchange electrochromatography column slab paper gas New York Reinhold Pub Corp 1961 ChI 2 1-78
6 Poole C F Pool S K Chromatography today New York Elsevier 1995
7 Small Hamish Ion chromatography New York Plenum Press 1989
8 Fritz J S Gjerde D T Ion Chromatography 3 Ed Weinheim New York Wiley-VCH 2000
9 Strong D L Dasgupta P K Friedman L Stillian J R Analytical Chemistry 63 1991480-486
10 Strong D L Young C U Dasgupta P K Friedman L Journal of Chromatography 1991 546 159-173
11 Spedding F H Voight F H Gladrow E M Sleight N R Journal of the Am ChemSoc 1981692777-2781
12 Nair L M Kildew B R Saari-Nordhaus RJ Chromatogr A 1996 739 99
13 Weiss J Ion Chromatography T^ Ed Weinheim Germany VCH 1995 43-55
14 Stillan J R Pohl C A J Chromatogr 1990 499 249 - 266
15 FritzJ SStoryJN^laquoa Czew 1980521519
15
16 Jensen D Weiss J Rey M A Pohl C A J Chromatogr 1993 640 65
17 Small H Stevens T S Bauman W CAnal Chem 1975 47 1801 - 1809
18 Stevens T 8 Davis J C Small H Anal Chem 1981 53 1488
19 Stillan J R LC Mag 1985 3 802
20 Strong D L Dasgupta P K Anal Chem 1989 61 939 - 945
21 Henshall A Rabin S Statier J Stillian J Am Lab 1992 24 20R
22 Sjogren A Dasgupta P K Anal Chem 1995 67 2110 - 2118
23 Chow J C Watson J G Lowenthal D H Egami R T Solomon P A Thuillier R H Magiliano K Ranzeiri A Atmos Environ 1998 32 2835 - 2844
24 Tanner R L Parkhurst W J 1 Air amp Waste Manage Assoc 2000 50 1299 -1307
25 Brook J R Dann T F Burnett R l-JAir amp Waste Manage Assoc 1997 47 2-19
26 Wang H Shooter D Atmos Environ 2002 36 3519 - 3529
27 Al-Horr R Dasgupta P K Adams R L Anal Chem 2001 73 4694 - 4703
28 Boring C B Al-Horr R Genfa Z Dasgupta P K Martin M W Smith W F Anal Chem 2002 74 1256-1268
29 Dasgupta P K Sampling and Sample Preparation Techniques for Field and Laboratory 2003 Ch 5 97 -160
30 Dasgupta P K ACS Adv Chem Ser 232 1993 41 -90
31 Simon P K Dasgupta PK^i7a Chem 65 1993 1134-1139
32 De Santis F Anal Chem 66 1994 3503 - 3504
16
K OH X
Anode
+ O2 [H^
+ OH ^ H2O
K
KOH H2
Cathode
H2O
3 Cation Exchange membrane
H - bull
X ^ Cation Exchange membrane
H2O lt-
Figure 11 Schematic of electrolytic suppressor mechanism X is the analyte anion
17
CHAPTER II
TWO-DIMENSIONAL CONDUCTOMETRIC DETECTION
IN ION CHROMATOGRAPHY SEQUENTIAL
SUPPRESSED AND SINGLE COLUMN
DETECTION WITH PASSIVE HYDROXIDE
INTRODUCTION
Introduction
Ion chromatography (IC) continues to play a leading role in many areas of
analytical chemistry with applications that range from trace analysis in semiconductor
fabrication to environmental analysis Small et al pioneered the technique of suppressed
conductometry in 1975 it is still considered the key feature that distinguishes IC from the
liquid chromatographic analysis of ions The mainstay of IC is in the analysis of anionic
analytes and we will therefore confine our attention to this area with the note that
identical considerations apply to cation analysis systems
From a standpoint of detectability suppression is greatly beneficial in the
determination of strong acid anions and even for anions derived from weak acids at least
up to pKa values of 4 It is integral to the practice of modem IC detection limits that
result from removing the conductive eluent ions and converting the analyte to a highly
conducting acid are tmsurpassed by other techniques
However weak acid anions are not easily detectable by suppressed IC Anions
derived from acids with pKagt7 are virtually undetectable Hence the concept of
converting such weakly dissociated acids to more dissociated compounds was developed
Berglund and Dasgupta published a series of papers in which the weak acid HX was
converted by two sequential steps (HX^ NaX -^ NaOH) to NaOH^ or in a simultaneous
cationanion exchange step to LiF^ The best results were however achieved by
combining both suppressed and single column IC Following a conventional suppressed
IC a controlled amount of NaOH was electrically introduced into the detector effluent by
a microelectrodialytic NaOH generator (MENG) With a ~01 mM NaOH background
the noise level was 20 nScm the exact band dispersion was not measured ^ In a
subsequent more detailed paper the dispersion was measured to be 94 ^L for a device
of 15 mm active length Further developments led to planar MENG devices that
exhibited noise levels as good as 8 nScm with band dispersions in the range of 78-90
tL
Caliamanis et al have developed an altogether different approach A commercial
suppressor unit bearing cation exchange membranes and an NaOH-EDTA external
bathing solution is used to convert HX to NaXdeg Yuan et al suggested operating a
suppressor in a mode such that the eluent is just short of completely neutralized
However it is very difficult to maintain such a system with a constant low-noise
environment background
The work described in this chapter elaborates on previous studies that utilized
base introduction after a conventional suppressed IC It is the added and different
dimensionality brought about by the additional detector that makes the overall approach
attractive It differs from other work in that passive rather than electrodialytic base
19
introduction is used requiring no electronic control Further different commercially
available membranes have been studied in different physical designs and in different
thickness with different bases to determine the optimum conditions so that results as good
as the best of the previous electrodialytic base introduction efforts can be realized in a
simpler maimer The recent commercial availability of electrodialytic eluent generators^
capable of producing highly pure hydroxide eluents which lead to nearly invariant
backgrounds even with gradient elution makes two-dimensional ion chromatography
(2DIC) more attractive than ever before
Principles
Analytes elute from a suppressor as an acid HX (when we are concerned with
weak acids even if a given analyte may be multiprotic consideration of ionization
beyond the first proton is tinnecessary) The suppressed conductometric signal is related
to 05(AH+ + x-)((Ka + 4CKa)deg^ - Ka)) where C and Ka are the eluite concentration and
the dissociation constant of HX respectively under conditions where autoionization of
water can be neglected For most practical purposes the presence of frace acids in the
background whether from regenerant leakage in a chemically regenerated suppressor or
from omnipresent CO2 is a more meaningful concern than the autoprotolysis of water
Figure 21 depicts the nature of the problem All of these computations were carried out
with the following assumptions temperature 25degC monoprotic acid analytes HX (with
Xx- equal to 50 and pKa ranging from strong acid to 10) and the analyte concentrations
represented in the abscissae are those at the point of measurement in the detector
20
(injected concentrations would typically be an order of magnitude higher accounting for
typical cliromatographic dispersion) Numerical computations were carried out on the
basis of solving the complete charge balance equation for a given system using the
nonlinear curve fitting capabiHties of Microsoft Excel Solver with a numerical accuracy
of seven significant digits in the computed H^ concentration Specific analyte
concentrations solved were 01 03 1 3 10 30 and 100 |jM and the lines shovm are
spline-fits through these points Panel a shows the situation for a hypothetical pure water
backgrotmd For clarity the first three panels are in log-log scales The minimum
ordinate value is 1 nScm slightly below the current state of the art of the noise levels
encotmtered in suppressed hydroxide eluent anion chromatography Realistically 10
nScm is the level at which a peak could be detected by a current state-of-the-art system
In general at low analyte concentrations there is little difference from a strong acid
down to a pKa of about 5 Past a pKa of 7 the response begins to decrease about 1 log
unit with each log unit decrease in Ka The possibility that acids with pKa gt7 can be
detected at low concentrations is obviously remote In reality when auxiliary acids such
as CO2 (in panel b assuming 10 |aM ECO2 120 ppb total inorganic C background 076
nScm pure water saturated with atmospheric CO2 contains 13-17 |aM iC02) or H28O4
(in panel c assuming I iM H2SO4 typical minimum leakage from a chemically
regenerated suppressor resulting in a background of 086 nScm) are present the
detectability of weaker acids deteriorates considerably In panels b and c the pKa 10 case
disappears from the viewing region and in fact it is clear that there is little hope of
detecting acids weaker than pKa of 7 even at relatively high concentrations In addition
21
the detectability of a weak acid analyte in a real matrix that may contain other more
ionized constituents at higher concentrations is likely to be far worse if there is any
possibility of co-elution Even when a weak acid analyte elutes on the tail of a stronger
acid peak it may never be seen both due to the suppression of ionization of the weak
acid and due to the intrinsically lower response
The introduction of a low but constant concentration of a strong base to the
effluent from the above conventional suppressed conductometric IC system prior to
detection by a second conductivity detector has been proposed previously An analysis
of the relative response behavior is noteworthy Figtire 2 Id shows (in a linear scale) the
response behavior of analytes from a strong acid to a pKa of 10 for the 10 ^M SCO2
background as well as the responses resulting from the second detector upon
introduction of 125 ]xM NaOH (no volumetric dilution or dispersion is assumed the
backgrotmd is -25 |jScm such signals have no significant dependence on whether some
weak or strong acids such as CO2H2SO4 are present in the background) These signals
appear as negative peak responses (which they are) For a strong acid HX with Ax- of 50
the response is 37 in magnitude for the base introduction system relative to that of the
conventional suppressed system (increases to 48 for Ax- of 20) For the strong acid
case this represents a 2-3-foId loss of sensitivity and is not attractive However the base
introduction system shows the same response (within plusmn38) from a strong acid to an
analyte with a pKa of 8 a response comparable in magnitude to the response of an analyte
with a pKa of 5 in a suppressed IC system but with better linearity With analytes of pKa
gt5 the base introduction response is favored by one order of magnitude with each order
22
of magnitude decrease in Ka With analytes of acidity weaker than a pKa of 8 the pH
afforded by the introduction of 125 iM NaOH is insufficient to maintain full ionization
By the time a pKa of 10 is reached the sensitivity has decreased to 40 of that for the
corresponding case of a strong acid but it is still four orders of magnitude more sensitive
than the corresponding suppressed detection response Indeed the response in the second
detector to an analyte of pKa 10 is significantiy better than that of an analyte of pKa 6 in
the first detector with much better response linearity
1 7
The linearity of response is best examined with a Cassidy plot as shown in
Figure 22 It is interesting to note that in the absence of a strong acid in the background
theory predicts that there will be considerable nonlinearity in the response at very low
analyte concentrations in the conventional suppressed conductometric detection mode
This behavior is due to the pliant nature of the baseline which in the limit is constituted
of water a weakly ionized acid Appearance of an analyte peak on the baseline causes
decreased dissociation of the background constituents similar to the subsidence of soil
upon erecting a stmcture This was quantitatively probed for carbonate eluents by
Doury-Berthod et al^ where a large amount of carbonic acid is present as the
background but at the detection limits possible today this behavior will be expected at
low analyte concentrations even with pure water as background The fact that sufficient
strong acid may be present in a real eluent background (even one electrodialytically
generated) can constittite a blessing in disguise in so far as response linearity at low
concentrations is concerned All responses shown in Figure 22 assume a 10 ^M CO2
background which may be the least contaminated background that can be attained in
23
practice In the conventional detection mode the response per unit concentration is
initially low due to the CO2 background and also decreases at the high concentration end
for all but a strong acid analyte As a result analytes of intermediate pKa values most
notably at 4 and 5 show a peak in sensitivity as a function of concentration The general
nonlinearity of response and the drastic decrease in response at analyte pKa values gt6 is
apparent in this depiction in marked contrast to the essentially uniform response for the
base introduction detection mode at least up to a pKa value of 8 The latter also shows
usable response up to a pKa value of 10
In the present system negatively charged hydroxide ions are introduced through a
negatively charged cation exchange membrane Donnan-forbidden ion penetration^ is the
mechanism of base introduction The relevant parameters are thus (i) the concentration
gradient across the membrane (ii) the characteristics of the membrane and (iii) nature of
the cotmterion accompanying OH The penetration rate of the forbidden ion decreases
with increasing size and charge^ and introduction of OH is thus easier than most other
anions The penetration rate is also inversely related to the membrane thickness and
directly to the available surface area These parameters are optimized in this work
Experimental Section
Figure 23 represents the system used in this work The base introduction device
was placed between two conductivity detectors The system temperature was controlled
at all times by placing columns detector cells the base introduction device and all
connecting tubing in a chromatographic oven
24
Base Introduction Device
Three different devices designs were investigated (see Figure 24) Device A is
made up of two Plexiglas blocks each containing an inscribed channel (06 x 06 x 40
mm) with 10-32 threaded ports that connect them to the outside Platinum wires (03 x
15 mm) partially fill the channels and exit through additional independent 10-32 threaded
ports as shown These wires are used as electrodes connected to a constant current
source for electrodialytic introduction of base The cation exchange membrane is placed
between the blocks and separates the two fiow channels bolts hold the blocks together
Several different cation exchange membranes were investigated Donor hydroxide
solution fiows through one channel while the suppressed effluent from the first
conductivity detector Dl flows through the other side to detector cell D2
The other two designs are based on perfluorosulfonate Nafionreg membrane tubing
Terminal bores of 15 mm OD 025 mm bore PTFE tubes were enlarged by drilling
Nafion tubes the terminal ends of which are strengthened by PTFE or PEEK tubular
inserts can be put into the end-enlarged PTFE tubes and sealed by standard compression
fittings Each end terminates in a tee such that the donor base solution can be made to
flow in a jacket that connects the two tees and surrounds the Nafion tube Device B uses
a 90 mm long Nafion tube in a linear configuration Two membranes were tested with
respective dry dimensions of 035 x 0525 and 030 x 040 mm (ID x OD) Device C
represents the third design in which a 025 mm nylon monofilament filled Nafion tube
(250 X 030 ID x 040 mm OD) was coiled into a helical stmcture before incorporation
25
into an external jacket following the design of a filament-filled annular helical (FFAH)
20
suppressor
All experiments were carried out with a DX-500 ion chromatography system
consisting of a GP-40 gradient pump equipped with a degasser an LC-30
chromatography oven an EG-40 eluent generator and CD-20 and ED-40 conductivity
detectors All connections utilized 025 mm polyether ether ketone (PEEK) tubing For
chromatography Dionex AG 11 and AS 11 guard and separator columns were used Data
collection and analysis utilized PeakNettrade 51 all from Dionex Corp (Sunnyvale CA)
All experiments were carried out at 30degC with a chromatographic flow rate of 1 mLmin
All conductance values are corrected to 25 degC assuming a temperature coefficient of
17degC Except as stated the hydroxide flow rate was 05 mLmin (observed values
were affected at flow rates less than 04 mLmin) and 100 mM KOH was used as feed
Band Dispersion Measurements
Band dispersion was calculated as the square root of the difference between the
squares of the band half-widths of the first and second detector response^ Band
dispersion calculated in this way decreases with increasing band volumes Dispersion
affects sharp narrow peaks more than it affects broad peaks Therefore band dispersion
was computed on sharp early eluting peaks of 025 mM acetate (injection volume 25 ^L
5 mM KOH eluent)
26
Results and Discussion
Electrodialytic Base Introduction through Different Membranes
Most ion exchange membranes are available in sheet form Base introduction
capabilities were therefore tested with device design A (Figure 24a) which allowed both
electrodialytic and Donnan-forbidden passive penetration to be tested Baseline noise
was taken to be the standard deviation of the baseline over a 15 min period Figure 25
shows the background conductivities generated with different membranes as a function of
the current Exact Faradaic behavior and a membrane with no zero current leakage will
result in a backgrotmd conductance of 271 )aScm (100 |jM KOH) for a drive current of
160 [lA This ideal behavior is shovm as the thick solid line The behavior of most of the
membranes falls into one group and a collective best fit drawn through them is shown as
a second line This exhibits a small background bleed (ca 11 jiScm ~4 [M KOH) and
a mean slope that is 78 of theoretical One membrane a radiation grafted PTFE cation
exchange membrane falls in a class by itself and exhibits very significant zero current
penetration of 168 |LiScm (over 60 |aM KOH) and a relatively low current dependence of
KOH generation (47 of Faradaic)
The background noise levels observed with the different membranes are
obviously of interest since they control the detection limits that could ultimately be
attained Figure 26a shows the noise levels observed as a function of background
conductance It is clear that the strong cationic Teflon membrane again falls in a class by
itself by providing the lowest background noise However since this membrane also
exhibits a very high zero current background conductance it is instmctive to look at the
27
noise as a fimction of the electrodialytic drive current this is shown in Figure 26b In
this depiction the noise appears to be largely independent of the membrane Rather it is
linearly proportional to the electrodialytic drive current If microbubbles of electrolytic
gas the amount of which is expected to be proportional to the drive current is the
dominant contributor to the observed noise then this behavior is understandable
Whether or not bubbles are specifically involved the data strongly suggests that the
observed noise in the backgrotmd conductance is directly related to the drive current
more than any other factor
Passive Introduction of Base through Different Membranes
The foregoing experiments suggested that the simpler expedient of passive
Donnan-forbidden introduction of base to the desired extent (ca -100 |aM) may not only
be possible but may be desirable from a standpoint of background noise It has been
suggested in previous studies^ that when maintaining a sufficient flow rate prevents
buildup on the receiver side the Donnan penetration rate (A) of the forbidden ion is a
quadratic function of the feed concentration (m) as follows
m^ = aA^ + pA + Y (21)
where a and P are positive constants and y is a constant of either sign
Figure 27 shows the observed concentration of KOH in the receiver (as determined from
the conductance) as a ftinction of the feed concentration for several different membranes
28
The line through the points is the best fit for each case to eqn21 above The Dow
perflurosulfonate ionomer (PFSI) membrane and the thin grafted Teflon membrane both
have very high penetration rates and desired degree of Donnan leakage can be achieved
with relatively low feed concentrations The Dow PFSI was an experimental material
available in very limited quantity and further work was done with the thin Teflon
membrane only
Dependence of Penetration Rate on the Nature of the Cation
Hydroxides of the alkali metals LiOH NaOH KOH and CsOH were used
individually as feed solutions and the penetration rates were measured for the thin Teflon
membrane The penetration rates shown in Figure 28 are in the order
LiOHraquoNaOHgtKOHgtCsOH and directly reflect the order of the ion exchange affinities
of these ions for cation exchange sites Li being the most easily replaced This is logical
since one would expect that ion exchange sites on the feed side of the membrane to be
saturated with the metal ion (both because of its high concentration and high alkalinity)
such that the overall rate is likely to be controlled by the rate which the metal ion leaves
the membrane on the receiver side Note that this behavior is opposite to that expected
for diffusive transfer through a passive eg a dialysis membrane because the diffusivity
is much lower for the large solvated Li^ ion than the Cs ion
Regrettably these series of experiments were performed after most other
experiments described in this chapter It is obvious that for base introduction purposes it
should be preferable to use LiOH even though KOH was used for most of the
29
experiments in this study For detection after base introduction one is interested in
maintaining some constant concentration of base introduced Because LiOH has the
lowest equivalent conductance among the alkali hydroxides it also provides the least
background conductance at the same concentration (the conductance due to 100 |LtM
MOH is 237 249 272 and 276 ^Scm for M = Li Na K and Cs respectively) and
should therefore provide the least conductance noise at the same background base
concentration
Effects of Temperature on Penetration Rate
The effect of temperature was examined for KOH penetration through the thin
Teflon membrane from 25degC to 40degC The penetration increased from 625 xM to 684
I M essentially lineariy 039 degC
Effects of Membrane Thickness on Penetration Rate
It is intuitive that penetration rate should increase with decreasing membrane
thickness and the data in Figure 27 already provide some support towards this
However the membrane types differ in that experiment and no clear conclusions can be
drawn The two tubular membranes used for the constmction of device B were identical
in length but varied in radial dimensions (525 x 350 vs 400 x 300 [im in od x id
respectively) Compared to the first the second tube provides a 42 lower extemal
surface area but the wall thickness is also 43) lower The data presented in Figure 29
makes it clear that the wall thickness is by far the dominant factor A complete
30
understanding of the exact dependence would have required the same membrane in
different thicknesses this was not available In the above experiment the decrease in
inner diameter increases the flow velocity by 36 at the same volumetric flow rate this
may also have a small effect on increasing the penetration rate by decreasing the stagnant
botmdary layer thickness
Device Performance Noise and Dispersion
As previously noted experiments with device A showed passive penetration was
superior in terms of noise performance than electrolytic introduction of base The
conductance noise level measured directly at the exit of device A fabricated with the thin
Teflon cation exchange membrane with KOH feed concentration adjusted to produce
-100 i M KOH in the effluent was 28plusmn2 nScm It was observed also that incorporation
of lengths of connecting tubing between the base introduction device and the detector
reduces the noise This suggested that mixing within the device is incomplete
Incorporation of a 075 mm id 750 mm long mixing coil woven in the Serpentine II
design^ reduced the noise level to 7 plusmn 2 nScm However the band dispersion induced
by the device already at a significant value of 96 plusmn 8 ixL increased by a further 55 |iL
with the addition of the mixing coil
Both versions of device B exhibited noise levels similar to that of Device A
(without mixer) However dispersion in straight open tubes is the highest of all^ and
even with the narrower membrane tube the band dispersion was measured to be 110 plusmn 4
31
nL (148 plusmn 6 |nL for larger tube) Incorporation of a mixer to reduce noise will clearly
make this even worse
A logical solution seemed to be the incorporation of base introduction and mixing
functions within the same device The helical geometry is known to induce good mixing
while minimizing band dispersion due to the development of secondary flow that is
perpendicular to the axial flow This secondary flow flattens the parabolic profile of the
axial flow velocity observed in a linear tube and leads to both reduced axial dispersion
and increased radial mixing inside the tube^^^ FFAH devices albeit of somewhat larger
dimensions have previously been used as suppressors^^^^
Built along this design Device C indeed exhibited the best performance Even
though the tube itself was nearly three times as long as device B the band dispersion was
measured to be 78plusmn 4|jL Under isocratic elution conditions the noise level was
measured to be 5 plusmn 2 nScm and 10 plusmn 2 nScm under a demanding steeply changing
gradient elution condition Because of its larger surface area relative to device B a lower
concentration of feed KOH is needed to reach a -100 i M concentration in the receiver
At 30 degC a 50 mM KOH feed leads to a background conductance of 28 )iScm with an
eluent flow rate of 1 mLmin Under a given feed condition the penetration of KOH
remains constant In one experiment the flow rate of 35 mM of electrodialytically
generated KOH used as eluent was varied between 05 to 175 mLmin in 025 mLmin
increments The electrodialytically suppressed conductance always remained below 08
^Scm The suppressor effluent (essentially water) was passed through a FFAH device
with 65 mM carbonate-free KOH (electrodialytically generated by a second
32
electrodialytic generator) acting as feed The observed background conductance was
linearly related to the reciprocal of the eluent flow rate with a linear r value of 09999
The device showed excellent reproducibility Taking borate a classic weak acid
analyte the reproducibility at the 50 (xM injected level was 20 in RSD the SN= 3
limit of detection was 06 iM (65 ppb B 25 [iL injection 15 pmol) with a linear r value
of 09997 for response in the 5-100 |LIM range (7 mM KOH isocratic elution XR -63 min)
This performance is notable because boric acid has a pKa of 923 and under the above
conditions elutes as a relatively broad peak (w -40 s) Response from 06 [iM borate
(and several other ions at trace levels) is shown in Figure 210
Base Introduction versus Ion Exchange The Effect of Device Design
Different membrane devices are commercially available as suppressors The
purpose of such devices in anion chromatography is to exchange large concentrations of
eluent cations and as such requires significant ion exchange capacities As a result such
suppressor devices are often designed with ion exchange screens in between ion
exchange membranes^ these screens are particularly valuable in gradient elution
because of their ability to provide reserve ion exchange capacity While these devices
can undoubtedly be used for base introduction it is to be noted that they are capable of
ion exchange on the screens without immediate and concomitant base introduction This
process can occur in addition to the base introduction process Note that when the sole
process is introduction of the base MOH through the membrane the reaction that occurs
33
for any analyte HX (within the limits that HX does not exist as an unionized acid at a pH
of~10(-100|aMMOH))is
MOH + HX ^ MX + H2O (22)
In this case all signals are uniformly negative and the signal intensity is controlled by the
analyte concentration and the difference in equivalent conductance between the analyte
ion and OH If the analyte HX is significantiy ionized the resulting H^ can be ion
exchanged for M at the interior membrane surface
J ^ membrane bull n aq mdash^ H membrane + M aq (2 3)
Processes 22 and 23 cannot be distinguished in practice because the M that is being
exchanged at the membrane surface would have otherwise been introduced as MOH
There is the apparent difference in principle that process 22 results in a production of an
additional water molecule In practice with trace level analysis the difference in the
hydration of ions in the membrane vs free solution and the high water permeability of
all ion exchange membranes will make it impossible to differentiate processes 22 and
23 If however the same process as that in 23 occurs on the ion exchange screens the
outcome will be different
M ^ e r e e n + H ^ Hcreen + M V (24)
34
The screen ion exchange sites are regenerated on a much slower scale and process 24
will therefore lead to the production of MX in addition to the introduction of MOH For
poorly ionized analytes only process 22 can occur But for ionized analytes processes
2223 and 24 can occur in competition If the latter dominates the resuh will be a
positive MX peak atop a MOH background (The screen sites will be regenerated more
slowly basically resulting in an eventual change in baseline) The results of using a
suppressor for base introduction purposes result in the chromatograms shown in Figure
211 This behavior obviously results in an interesting and immediate differentiation
between strong and weak acid analytes and may be useful in some situations The
possibility of co-eluting peaks in opposite directions may however complicate
interpretation of the data in real samples
Illustrative Applications
Figure 212 shows a 2-D chromatogram with the two detector signals being
shown for several strong and weak acid anions Weak acid analytes such as arsenite
silicate borate and cyanide are invisible in the first detector and produce easily
measurable responses in the second detector
Previous work has elaborated on how such 2-D data can be exploited for the
diagnosis of co-elution estimation of analyte pKa values calculation of analyte
equivalent conductance (and thereby provide a means of identification) values and
perform universal calibration^^ The advent of commercial electrodialytic eluent
generators has made possible nearly pure water backgrounds which in conjunction with
35
passive base introduction devices make the practice of 2-D IC detection simpler more
sensitive and attractive than ever User-friendly software that can fully utilize the 2-D
data is needed for the complete exploitation of the technique Recent advances in the
understanding of ion exchange devices in ion chromatography may even make possible
3-D detection schemes (HX MX MOH) ^ However even the present state of
development provides a very useful tool to the interested user as detailed below
Filter samples of airborne particulate matter have been collected and analyzed by
ion chromatography for example during the supersite campaigns in Houston and
Philadelphia^^ While major components such as sulfate nitrate chloride etc are
readily identifiable and quantifiable there are numerous other analytes also present in
these samples that are often hidden by the major analyte peaks Even with IC-MS co-
elution makes identifying the occtirrence and identification of trace constituents a very
challenging task (Contrary to popular belief IC-MS provides considerably poorer
detection limits than either of the detectors in 2D IC when a total ion scan must be
conducted for a totally unknown analyte) Figure 213 shows a 2D chromatogram of an
air filter sample extract collected in Houston during the summer of 2000 Note that the
data immediately reveals that the asterisked peak is clearly an acid weaker than a
common aliphatic carboxylic acid (see response to acetate in Figure 212) This
information would have been impossible to discem by any other means Of the
numerous other nuances that are present in this chromatogram but are too difficult to see
without further magnification I focus only on the 18-21 min region The peak at -19
min is completely invisible in the suppressed chromatogram and must be due to a very
36
weak acid The peak at -20 min is seen as a perfectly clean Gaussian response in the
suppressed chromatogram while the second dimension immediately reveals that it is
actually a mixture of two partially co-eluting analytes probably in an approximate ratio
o f - l 3
In summary 2DIC in its presently developed form is simple to implement and
practice and asides from improving the detectability and response linearity characteristics
of weak to very weak acids it provides a wealth of information that is otherwise difficult
or impossible to obtain
37
References
1 Small H Stevens T S Bauman W S Anal Chem 1975 47 1801-1809
2 Dasgupta P K Anal Chem 1992 64 775A-783A
3 Strong D L Joung C U Dasgupta P K I Chromatogr 1991 546 159-173
4 Strong D L Dasgupta P K Anal Chem 1989 61 939-945
5 Berglund I Dasgupta P K Anal Chem 1991 63 2175-2183
6 Berglund 1 Dasgupta P K Anal Chem 1992 64 3007-3012
7 Berglund I Dasgupta P K Lopez J L Nara O Anal Chem 1993 65 1192-1198
8 Sjogren A Dasgupta P K Anal Chem 1995 67 2110-2118
9 Sjogren A Dasgupta P K Anal Chim Acta 1999 384 135-141
10 Caliamanis A McCormick M J Carpenter P D Anal Chem 1997 69 3272-3276
11 Caliamanis A McCormick M J Carpenter P D Anal Chem 1999 711A-1A6
12 Caliamanis A McCormick M J Carpenter P D J Chromatogr A 1999 850 85-90
13 Caliamanis A McCormick M J Carpenter P D J Chromatogr A 2000 884 75-80
14 Huang Y Mou S Liu K J Chromatogr A 1999 832 141-148
15 Liu Y Avdalovic N Pohl C Matt R Dhillon H Kiser R AmLab 1998 30(22) 48C Liu Y Kaiser E Avdalovic N Microchem J 1999 62 164-173
16 Walsh S Diamond D Talanta 1995 42 561-572
17 Cassidy R M Chen L C LCGCMag 199210 692-696
38
18 Doury-Berthod M Giampoli P Pitsch H Sella C Poitrenaud C Anal Chem 1985 57 2257-2263
19 Dasgupta P K Bligh R Q Lee J DAgostino V Anal Chem 1985 57 253-257
20 Dasgupta P K Anal Chem 1984 56 103-105
21 Waiz S Cedillo B M Jambunathan S Hohnholt S G Dasgupta P K Wolcott D K Anal Chim Acta 2001 428 163-171
22 Dasgupta P K Anal Chem 1984 56 96-103
23 Dasgupta P K US Patent 4500430 1985
24 Stillian J R LCraquoGC Mag 1985 3 802-812
25 Srinivasan K Saini S Avdalovic N Recent Advances in Continuously Regenerated Suppressor Devices Abstract 136 2001 Pittsburgh Conference New Orleans LA March 2001
26 httpwwwutexaseduresearchyceertexaqsindexhtml http wwwcgeny comNarsto
27 Samanta G Boring C B Dasgupta P K Anal Chem 200113 2034-40
39
LLOpoundp ^sajx lsa jgt^^ tUDysnesuodssu gtiestl
40
strong acid H2S04 background
040 Strong acid
pure H20 bgnd
gt Z5 u-0)
E
lt) c
CO
020
000
OOE+0 20E-5 40E-5 60E-5
Peak Concentration eqL 80E-5
-pK10
- pK9 pK8
Strong acid
10E-4
Figure 22 Cassidy plot of response sensitivity in linear axes An ideally linear response produces a flat curve of zero slope The top trace asstunes a 1 M H2SO4 background all others assume a 10 |jM CO2 background
41
EEG
r^QU Oven Enclosure
1mdash1 p
Water
Gas Pressure
KOH
Figure 23 Experimental system Key P chromatographic ptimp (1 mLmin) EEG electrodialytic eluent generator V injection valve(25 i L) GC AGl IHC (4 mm) guard SC AS 1 IHC separator EDS electrodialytic suppressor Dl first detector BID base introduction device D2 second detector R exit restrictor KOH flow into BID is 05 mLmin by nitrogen pressure
42
flow out
(A) flow In
plexiglass slab
metal win
flow channel
metal wire connected to current source
screw hole
bullmA^
KOh Out
Device B
KOMIn
n Eluite out
Device C
Eluite out
Figure 24 Base introduction device designs (a) planar sheet membrane design that can be operated electrodialytically or by Donnan leakage (b) straight tube in shell design and (c) filament-filled annular helical design
43
3000
E
(U O c CD
bullc bull D C o O
2000
1000
000
V n A o 0 o o
Fit All other Membranes
Thin PTFE RAI
Nafion 417
Dionex
Nafion 117
Asahi Glass Selemion
Sybron MC 3470
Asahi Glass CMV
Asahi Glass Flemion
000 4000 8000 12000 Current uA
1 1 1
16000 20000
Figure 25 Ctirrent efficiencies observed with electrodialytic devices with different
membranes
44
V 012 - ^ bull
A O o
Si
Thin Radiation Grafted PTFE (RAI) 007 mm
Nafion 417 043 mm
Dionex radiation grafted memrane 010 mm
Nafion 117 018 mm
Asaiii Glass Selemion 015 O ^ ^
Asahi Glass Flemion 015 mm -COOH
(a)
1 r 000 4000 8000 12000 16000
Current uA 20000
Figure 26 Backgrotmd noise in electrodialytic devices with different membranes as a function of (a) the observed conductance (01 mM KOH) 272 |iScm) and (b) the electrodialytic drive current Internal flow 1 mLmin in this and subsequent figures
45
40 -n
E
ltD o c j5 o T3 C o O o o Q
CO
30
20 mdash
10
0 mdash
+
Dow PFSI 015 mm r 2 10000
Thin Teflon 007 mm r 2 09947
RAI 010 mm r2 09996
Asahi Flemion 015 mm r 2 0995
Nafion 117 018 mm r 2 09996
Nafion 417 043 mm r 2 09986
000 020 040 060 Feed KOH Concentration M
080
Figure 27 Passive Donnan leakage of KOH through various sheet membranes as a function of feed KOH concentration
46
080 -n
c o (0
c 0) o c o o X O T3 0 CD 0 C 0 O
060 mdash
040 mdash
020
000
Eluent Flow 1 mLmin
LiOH
O NaOH
A KOH
+ CsOH
4^A
O A
A
A
O A
n ^ ^ ^ r 100 200 300 400
Feed MOH Concentration mM 500
Figure 28 Donnan leakage of different alkali hydroxides through the RAI PTFE membrane
47
025 mdash1
Device B 0525 x 035 mm od x id 90 mm long
O Device B 040 x 030 mm od x id 90 mm long
40 80 120 Feed KOH mM
160 200
Figure 29 Dependence of Donnan leakage on tubular membrane dimensions Nafion membrane tubes are used
48
020 mdash1
000 mdash
E o
o ca
c o
O
-020 mdash
-040 mdash
-060
400 800 1200 Time min
Figure 210 Detection of 06 j M borate in a sample mixture on the second detector This presentation used a moving average routine to reduce baseline noise The SN= 3 LOD will be 06 |4M based on the baseline noise observed in the raw detector signal
49
E o w iL (D O c as o
bullD c o O
3500
3400 mdash
3300
3200 mdash
3100 mdash
3000
Sulfate
Phosphate
J o bulllt S) 3 a o
n - C
ar
cr o 3
figt
o
20 0 Time min
10 20
Figure 211 Second detector response to various analytes using a commercial membrane suppressor (containing an ion exchange screen) as the base introduction device
50
E ^
lt) O c
o 3 bull a c o O
800 mdash
400 mdash
000 mdash
_
-400 mdash
OC
625 nmol nitrate borate acetate sulfate 125 nmol all others
9gt re
4- 0) o lt AS11HC Column Ramp
^ J
0-30 mM KOH 0-10 min Hold at 30 mM till 15 min Ramp to 10 mM 15-20 min Ramp to 20 mM 20-30 min Ramp to 30 mM 30-40 min
ogt bull o g 3 (0
^ - T--- - - - ^ - - ^ r r m i ^ r r
1ft i ^^ il lt W i O raquo
ide
rate
licate enite
I I I
0 1000 2000
^^ _agt re u w
]S re u
ffs
i t o o M
a p^laquo 1 D)
M
o O) -
bull2 pound re i -^
Z 0)
3 laquo j
1 i
_ - - ^ mdash -
i i i
figt lt rbo nate
I
3000 4000
Figure 212 2D ion chromatogram tmder standard conditions using gradient elution 25-|iL injection volume
51
AS11HC 1 mLmin
E u
8 c 3 bullo C
8
400
000
000 2000 4000 Time min
6000
Figure 213 2D ion chromatogram of an air filter sample extract (Houston TX July 2000) The inset shows the 18-21-min region magnified
52
CHAPTER III
FIELD MEASUREMENT OF ACID GASES SOLUBLE
ANIONS IN ATMOSPHERIC PARTICULATE MATTER
USING A PARALLEL PLATE WET DENUDER
AND AN ALTERNATING FILTER-BASED
AUTOMATED ANALYSIS SYSTEM
Introduction
Many instruments exist for the rapid automated determination of gaseous
constituents of ambient air This includes for example all the gaseous criteria pollutants
Diffusion based collecfion and analysis of atmospheric gases have been reviewed In
regard to suspended particulate matter physical parameters such as optical or
aerodynamic size distribution and mass concentration can be relatively readily
determined by a ntunber of available commercial instruments This is not the case for the
(near) real-time determination of chemical composition of the atmospheric aerosol The
quest for instrumentation that can accomplish this objective began some three decades
ago and continues today
Crider^ first demonstrated real time determination of aerosol sulfur with a flame
photometric detector (FPD) by switching a filter that removes SO2 in and out of line In
many early methods potentially interfering gases were first removed and the aerosol
stream was then thermally decomposed under controlled temperature conditions to
characteristic gases that were collected by a diffusion denuder and then measured
53
periodically Much of the effort was directed to the specific measurement of sulfuric acid
and the various ammonium sulfates^ Similar methods were also developed for
ammonium nitrate One ingenious method for measuring aerosol acidity involved gas
phase titration of the aerosol with ammonia^ The flash volafilization (FV) technique of
rapid thermal decomposition of a collected analyte^ became widely used for the
measurement of aerosol sulfate in conjunction with a FPD^ Although determinafion of
nitrates by thermal decomposition was originally considered questionable^ FV- NOx
detection based meastirement of nitrate has been shown not only to be viable^ recent
innovations and adaptations by Stolzenbug and Hering have made it routine This
technique is also promising for the simultaneous measurement of aerosol S by an FPD
and aerosol C by a CO monitor Thermally speciated elemental vs organic carbon
measurements have been demonstrated
Direct introduction of an air sample into an air plasma has been shown to be viable
for the direct measurement of metallic constituents^ More recently Duan et al^ have
described a field-portable low-power argon plasma that tolerates up to 20 air Coupled
to an inertial particle concentrator such an approach may be practical although the
limits of detection (LCDs) are not as yet good enough for use in ambient air For a given
analyte uniquely simple and sensitive solutions may exist Clark et al^ reported that a
single 100 nm diameter NaCl particle can be detected free from matrix interferences
with an FPD
The application of mass spectrometry (MS) to aerosol analysis has had a long and
illustrious history^ Electron and optical microscopic techniques were once believed to
54
be the best route to the analysis of individual particles^ Single particle MS can do this
today and do so in real time^ MS can provide information on not just specific
components such as sulfates and nitrates but on all material present in the particle
While MS may hold the key to the future the cost bulk operator sophistication and the
extensions needed to produce reliable quantitative data presently leave room for other
more affordable techniques
Since much of the aerosol constituents of interest are ionic typical present day
practice of aerosol analysis involves gas removal with a denuder filter collection with
subsequent extraction of the filter by an aqueous extractant and analysis by ion
chromatography (IC) In this chapter a fully automated IC-based approach to near real
time aerosol analysis is described Continuous impaction is one of the most
straightforward approaches to accomplish aerosol collection but it is difficult to collect
very small particles by impaction This problem was solved by introducing steam into the
aerosol flow and allowing the aerosol to grow This general theme has been adapted
and refined by others^deg as well as by this research group and introduced in parallel by a
Dutch group^^ Although other approaches to collecting atmospheric aerosols into a
liquid receiver coupled to IC analysis have been investigated generally these could not
exceed the efficiency of the vapor condensation aerosol collection approach across a
large particle size range
The steam introduction approach is however not without its shortcomings A
small but measurable artifact is caused by the hydrolytic reaction of NO2 which is not
appreciably removed by most denuder systems now in use The resulting product is
55
measured erroneously as particulate nitrite (and to a much smaller extent nitrate) Steam
introduction requires a condensation chamber that increases the size of the instrument
Filter collection also potentially permits differential analysis via sequential extraction
with different solvents not possible with direct collection in a liquidThis chapter
describes a new instrument that is a fully automated analog of manual filter collection
extraction and analysis
Experimental
The instrtunent was constructed using a full tower size personal computer (PC)
case as the housing Various components were anchored or attached directly to the PC
chassis Fully assembled the particle collection and extraction instrument had
dimensions of 55 cm x 76 cm x 76 cm (L x W x H including instrument components
placed outside the computer case)
Gas Removal and Analysis
Soluble gas collection is accomplished with a parallel plate wet denuder (PPWD) The
current PPWD differs from previous designs as follows The denuder is composed of Plexiglas
plates with Teflon spacers Non-glass construction eUminates fragility problems The desired
area of each Plexiglas plate is microstructured to render it wettable The denuder is bolted to a
stand consisting of a support base to which threaded pipe flanges are secured by screws The
threaded ends ofg in id steel piping used as the support stands are secured thereto
56
For the measurement of gases and aerosols with the highest temporal resolution possible
it is necessary to dedicate individual IC units to the gas system and the aerosol system There are
two potential arrangements (a) a PPWD supplying its liquid effluent to an IC dedicated to gas
analysis and a second independent PPWD the gas phase effluent of which is directed to the
particle collection system (PCS) which is coupled to its own IC and (b) a single PPWD
connected to the PCS the liquid effluent from the PPWD and the PCS each going to separate IC
units Even though the latter arrangement may at first seem to be the simpler in all field
experiments the first option has been chosen Among others HNO3 and HCI are two gases
that are of interest and both are known to be sticky the very minimum of an inlet line must be
used On the other hand it is generally desired to measure the aerosol composition in the lt 25
Ijm size fraction necessitating both a cyclone and a gas removal denuder prior to the aerosol
collector The cyclone cannot be placed after a wet denuder because of the growth in size of
hygroscopic aerosols during passage through the denuder Placing the cyclone before the
denuder would entail loss andor undesirable integration of the sticky gases
The general suggested arrangement thus involves the deployment of the gas analysis
denuder in open air (typically immediately on the roof of the shelter where the analytical
instruments are located) without a cyclone and with a very short inlet (lt 5 cm of a
perfluoroalkoxy (PFA) Teflon tubing) The air sample enters the denuder at the bottom A
peristaltic pump located in the instrument shelter pumps the liquid to and from the denuder The
transit time in typical deployment is about 2 min and temporal gas analysis data are corrected for
this transit delay The denuder stand is sufificientiy tall to allow the inlet to be -60 cm off the
support base To minimize interaction of the inlet air sample with the stand components
57
especially in still air the iron support stand from the base to the bottom of the denuder is wrapped
with Teflon tape
The denuder is shown schematically in Figure 31 Each denuder plate is 100 x
55 cm (Vg thick) with the active wettable area of 65 x 42 cm starting 75 cm from the
top and 175 cm from each edge The denuder liquid is forced through a fritted PVDF
barrier to allow even flow down the plate and is aspirated from the apex of the V-groove
45 cm from the bottom edge The two plates are spaced by a 3 mm thick PTFE spacer
The air inletoutlet holes circular at the termini are machined with a contour that
becomes elliptical as they approach the interior of the denuder to allow for a smooth
entranceexit of the airflow PFA Teflon tubing (I ga 83 mm od 75 mm id) fit
tightly into these apertures
The overall airflow arrangement and gas system liquid flow arrangement is shown
in Figure 32a Typically the air sampling rate is 5 Standard Liters per Minute (SLPM)
controlled by a mass flow controller (MFC-D Aalborg instruments AFC 2600D
Orangeburg NJ) A diaphragm pump (PI Gast DOA-PI20-FB) provides the sample
flow the same pump is used for flow aspiration on a filter FC (vide infra) Hydrogen
peroxide (05 mM) is used as the denuder liquid at -05 mLmin on each plate each
stream pumped through disposable mixed bed ion exchange resin columns MB (067 cm
id X 15 cm PTFE column filled with Dowex MR-3 resin) located immediately before
the PPWD liquid entrance ports The effluent streams are aspirated at -1 mLmin from
each plate (using same peristaltic pump but larger tubing 089 mm vs 129 mm id
Pharmedreg tubes are used for input vs aspiration peristaltic pump speed fixed at 6 rpm)
58
to ensure all liquid is aspirated from the bottom of the PPWD The aspirated flow
streams are combined and sent to the IC analysis system consisting of alternating TAC-
LPl anion preconcentrator columns AGl IHC guard and AS 1 IHC separation columns
and an electiodialytically regenerated suppressor (ASRS operated at 50 mA) The
chromatographic system itself consisted of a DX-100 pump and detector with 225 mM
NaOH eluent flowing at 1 mLmin In more recent work an IS-25 chromatographic
pump coupled to an EG-40 electrodialytic eluent generator (155 mM KOH 15 mLmin
LC-30 oven at 29degC) and an ED40 detector used as a conductivity detector (CD) have
been used Chromatography is conducted either on a 10-min or a I5-min cycle A 4-
chaimel peristaltic pump (Rainin Dynamax) is used for all liquid pumping All
chromatographic equipment and columns above and in the following were from Dionex
Corp
Particle Collection Svstem
A Teflon-coated aluminum cyclone (10 Lmin University Research Glassware
URG Chapel Hill NC) is used as the first element of the inlet system to remove particles
larger than 25 i m The cyclone exhibits the desired size cut point only at the design
flow rate Referring to the overall airflow arrangement in Figure 32a the air sample
passes through the cyclone 10 SLPM and is divided by an Y-connector into two flow
streams of 5 SLPM each One is drawn through a 47 mm glass fiber filter Fl (Whatman
type GFB filters were changed either at 12 h intervals or corresponding to daylight and
nighttime hours and were used for archival purposes and IC-CD-UV-MS analysis of the
59
filter extract in home laboratory) via mass flow controller MFC-C (Aalborg AFC2600D)
The cyclone and the filter holder are mounted on a modified camera tripod The feet of
tiie tiipod are bolted to the roof of the instrument shelter the air inlet is maintained -2m
above the roofline The second flow stream from the cyclone exit proceeds through a
copper conduit or aluminized PFA Teflon tube to a PPWD located within the instrument
shelter The metal is electrically grounded to minimize aerosol loss The PPWD is fed
with -1 mLmin streams of 10 mM Na2HP04 (adjusted to pH 7) containing 05 mM
H2O2 on each plate that serves to remove both acidic and basic gases the denuder
effluent (aspirated at~l 5 mLmin) is sent to waste The gaseous effluent from the
denuder bearing the aerosol proceeds to the PCS
The first element of the PCS is a specially constructed rotary valve VI that directs
the ambient air stream to either filter A or filter B This valve must provide a straight
passageway for the sample stream to one of the two sample filters without aerosol loss
The valve is shown in functional detail in Figure 32b The stator plate has three holes
the central port is connected to the sample air stream (from the PPWD) while the two
other ports are connected in common through a Y-connector to a sequential trap
containing a particle filter (F2) acid-washed silica gel (Tl 6-8 mesh which removes
NH3) followed by a soda-lime trap (T2 4-8 mesh that removes acid gases) and a heater
(H) that thus provides a hot dry clean air source (Figure 32a) The rotor plate has two
holes connected to filter A (FA) and filter B (FB) respectively and is rotated by a
spring-return rotary solenoid (TRWLedex Vandalia OH 30deg rotation angle) The air
transmission tubes to the valve are 75 mm id 875 mm od PFA tubing push fit into
60
the stator and rotor plates of the valve With the solenoid unenergized ambient air is
sampled on filter A and with the solenoid energized ambient air is sampled on filter B
flow is thus switched without aerosol loss Other air valves V2-V4 are 2-NPT large-
orifice low power on-off type solenoid valves (Skinner A10 ParkerHannifin 12 VDC)
that govern airflow in the PCS
Plexiglas filter holders were machined to hold 25 mm diameter filters Atop a
stainless steel screen are placed a paper filter (Whatman grade 5) and a glass fiber filter
(Whatman GFB) Two 10-32 threaded ports on opposite sides of the top half of the filter
holder provide entiy of wash liquids The bottom half of the filter holder is designed as a
shallow cone with the air outlet at the center The liquid exit port is a 10-32 threaded
aperture located equidistant from the inlet apertures such that the inletoutiet apertures
constitute an equilateral triangle in top view
Airliquid separators constructed using 3-inch transparent polyvinyl chloride
(PVC) pipe with PVC caps cemented to each end constituting 500mL capacity
reservoirs were incorporated below each filter holder in the air exit path These
contained air in and exit ports as well as a port to remove accumulated water
(periodically eg every 24 h) using a syringe These separators serve to keep any wash
liquid from entering the respective mass flow controllers (MFC-A B O-IO LPM UFC-
1500A Unit Instruments Inc Chaska MN) The diaphragm pump (P2 same as PI)
used for sampling is capable of aspirating at gt8 Lmin through each filter holder
simultaneously
61
Standard wall PFA Teflon tubes (ISW Zeus Industrial Products) were used for
connecting PCS components upstream of the filter holders This tubing was externally
wrapped with electiically grounded Al tape and then with bare Cu wire This served the
dual purpose of improving its structural strength and reducing electrostatically induced
aerosol loss Instrument components were machined to provide a leak-free push-fit with
this size tubing Flexible PVC tubing (Vg in id) was used for component connections
downstieam of the filter holders
Filter Extraction System
A 6-channel peristaltic pump (Dynamax RP-1 Rainin) provides liquid pumping
Valves V5-V8 are low power miniature liquid solenoid valves Valves V5 and V6 are
subminiature all-PTFE wetted part valves (161T031 Neptune Research W Caldwell
NJ) that direct the flow of deionized water to the filter holders Prior to the filter holders
the pumped water (I mLmin total flow) is split into two flow streams A 2 cm length of
PEEK tubing (0010 inch id Upchtirch Scientific Oak Harbor WA) was placed
immediately prior to the filter holder at each water entrance to provide flow resistance
This served to evenly distribute the flow from both inlets evenly on to the filters Valves
V7 and V8 (161P091 Neptune Research) handle filter extract in which stray glass fibers
may be present Therefore these valves are pinch type valves that can tolerate such
fibers without valve malfunction A low volume fiber-trap-filter (FTF Acrodisc CR 5
^m 25 mm) placed prior to the injection valve prevents glass fiber intrusion to the
preconcentration columns Such intrusion can result in high-pressure drops resulting in
62
decreased sample loading on the columns Injection valve IV is a 10 port electrically
actuated valve (Rheodyne) that contains two low-pressure drop anion preconcentration
columns (TAC-LPI)
PEEK peristaltic pump tubing adapters (PF-S VICI) terminating in ^4-28 fittings
were used Male nuts (14-28 threaded) and ferrules were used to connect tubing to the
pump adapters Pharmed tubing (129 mm and 152 mm id respectively) was used for
pumping water to and from the filter holders (-1 and 15 mLmin) larger aspiration flow
is used to prevent water backup at the filters Similarly 129 and 152 mm id Pharmedreg
ptimp tubes were used for pumping and aspirating liquid to and from each wall of the
PPWD All liquid transfer lines were 20 gauge standard wall PTFE tubing (20 SW Zeus
Industrial Products Orangeburg SC) For connections PTFE tubes were butt-joined
with Pharmedreg pump tubing as sleeves
The chromatographic columns and suppressor were identical to that for the gas
analysis system The chromatographic system itself used either a DX-120 Ion
Chromatograph and detector with a 225 mM NaOH eluent at 10 mLmin or a DX-600
system with an electrodialytically generated (EG 40) 1475 mM KOH eluent flowing at
15 mLmin with columns thermostated at 31 degC and a CD 20 conductivity detector
Under either operating conditions chloride nifrite nitrate sulfate and oxalate were
analyzed in less than 15 min Occasionally the system was operated with 30min sample
collection and 30min gradient elution rtms
63
Instrtiment Operation
Table 31 shows the air and liquid valves and their respective onoff status
Figures 33a and 33b illustrate the four states of the instrument cycle The first state
depicted in Figure 33a is 85 min in duration In the particle collection system the
soluble gas denuded aerosol flow stream is directed to filter A by valve VI Air passes
through filter A though mass flow controller A (MFC-A) which regulates the airflow to
5 SLPM and finally through valve V4 which is on during state 1 Valves V2 and V3 are
off and filter holder B (FB) is under airlock
In the liquid extraction portion of the instrument deionized water is contained in a
2 L bottle (WB) The air entrance to the water bottle is equipped with a soda-lime trap to
minimize acid gas intrusion into the bottle Water from WB is aspirated and then
pumped at 1 mLmin by the peristaltic pump (PP) through a mixed bed ion exchange
column (MBl packed with Dowex MR-3 resin Sigma) to remove any trace impurities
present in the deionized water Valve V5 directs flow to valve V6 which in turn directs
the water to filter FB The water enters FB through the two ports in the top of the holder
and is simuhaneously aspirated from the bottom of FB through valves V7 and V8 by the
peristaltic pump Since FB is under airlock water does not enter the air outiet tubing at
the bottom of the filter holder The extracted material from the filter is pumped through
the fiber trap filter (FTF) to remove glass fibers from the fiow stream before passing to
the appropriate preconcentration column Valve IV is configured such that while one
preconcentiation column is chromatographed the other preconcentration column is
64
loaded with sample or washed with water In the present case preconcentiation column
PCI is loaded with sample Following 85 minutes state 2 begins (Figure 33b)
During state 2 in the PCS ambient air continues to be sampled on FA just as in
state 1 Valves V2 and V3 are activated in state 2 allowing clean hot air to pass through
filter FB for the duration of this state Clean (ammoniaacid gas and particle free) air
produced by passing ambient air through F Tl and T2 is heated to -75degC by passing it
over a siliconized resistance heater (Watlow St Louis MO) contained in a PVC cylinder
housing that is powered by 110 VAC power (-20 W) via a DC relay that is switched in
parallel with valve V2 This clean hot air is aspirated through the previously extracted
filter FB to dry it prior to state 3 Within the PVC cylinder housing the heater a thermal
cutout device is located in close proximity to the heater and is connected in series with
the heater such that the heater shuts off in the event of overheating (t gt I43degC)
Note that at the time the instrument enters state 2 from state I although all the
analyte has been extracted from filter FB and preconcentrated the last portion of the
wash water is still contained in the filter housing This water is aspirated into the trap
bottle ahead of MFC-B Water that enters into the trap bottle is generally of the order of
ImLcycle This volume may be used to monitor the filter extraction process excessive
water accumulation in the water trap bottle indicates fiow problems through the filter or
through the relevant preconcentration column
In the liquid extraction system valves V5 and V8 are activated Valve V5 now
directs water used to wash filter FB in state 1 back into the water bottle This recycling
procedure helps maintain the purity of the water in WB As a resuh of liquid being
65
aspirated faster from the filter housing than it is pumped in air bubbles inevitably enter
into the preconcentration column To remove the air bubbles before the sample is
injected valve V8 is activated and water is aspirated by the pump through a mixed bed
ion exchange coltimn (MB2) through V8 and piunped through the preconcentration
column PCI The dtiration of state 2 is 65 minutes
After state 2 ends state 3 (85 min) and state 4 (65 min) follows States 3 and 4
are identical to states 1 and 2 respectively except that the roles of filters A and B are
interchanged relative to those in states 1 and 2 States 1-4 constitute an instrument cycle
state I starts at the end of state 4 and this continues until deliberately shut down
The chromatographic system is calibrated by a valve-loop combination in which
each side of the valve is separately calibrated volumetrically by filling the loop with an
alkaline solution of bromothymol blue of known absorbance injecting collecting all the
effluent into a 5 mL volumetric flask making up to volume and measuring the
absorbance Such a calibration takes into account the internal volumes of the valve ports
etc Standards containing chloride nitiite nitiate sulfate and oxalate are then injected
using the loop keeping the concentrator column ahead of the guard column to match
actual experimental dispersion Multipoint calibration curves are constructed in terms of
absolute amount injected in ng versus peak area
Electrical
The main ac power to the instrument goes to a PC-style power supply (that comes
with the PC chassis) providing +5 and +-12 V power of which only the +12 V supply is
66
used (rated at 8A lt2A used at any time) A separate power supply board (+- 15 and +5
V) is used for the mass flow controllers
Even the lowest rung IC (DX-120) used with the PCS provides 2 TTL outputs
from the ion chromatograph These can be temporally programmed in the DX-120
operating method Table 31 shows the temporal state of these outputs The schematic
shown in Figure 34a is then used to control the instrument The two TTL outputs are fed
into a demultiplexer chip Normally the output from this demultiplexer is high low
output signals are generated at distinct pin numbers based on the DX 120 TTL signals
input to it Outputs from the demultiplexer chip are inverted and then used to address the
logic level N-Channel MOSFET switches (RFM8N18L Harris) to control the valves
The power supply grotmd is connected in common to all the source pins of the MOSFET
switches while the valves are connected between the positive supply and individual drain
pins of the MOSFET switches with an intervening diode (rated 3A) to provide diode
logic control All valves operate from the 12 V power supply except VI for which a
separate power supply (18VDC 25 A) was constructed
Figure 34b shows the electronics associated with the mass flow controllers The
schematic governing MFC-A is shown (that for MFC-B is identical) The MFCs can be
manually controlled by 3-position center-off toggle switch SWIA Grounding terminal
D or terminal J results in fully opening or fially shutting dovra the control valve
respectively In the center-off position (normal) a 0-5 V contiol signal provided to
terminal A of the controller governs the flow rate This signal is provided by the 10 K
10-tum potentiometer RIA (numeric dial readout) and is normally set to provide 25 V so
67
that airflow is controlled at 5 SLPM on these 10 SLPM flow controllers The output
signal from the MFC (5 VFS) is divided 501 using a simple voltage divider network
(R2A R3A) and displayed on a 200 mV FS 32-digit panel meter (DPM-A) that displays
the air flow rate in SLPM Two DPDT relays (R4 and R5) are used for controls that
affect the filter drying airflow The two relay coils are in parallel with valves V2 and VI
respectively One half of relay R4 is used to apply AC power to the air heater during the
filter drying cycle (only V2 is on at this time) The common pin of the other half of R4 is
grotmded and the corresponding NO pin is connected to one of the common pins in relay
R5 The corresponding NO and NC pins are connected to D-pins of MFC-A and MFC-B
respectively Referring to Table 31 the net resuh is that when V2 is on and VI is off
MFC-A is opened fully to allow maximtim flow through filter A to dry it conversely
when V2 and VI are both on MFC-B is opened fiilly to allow maximum flow through
filter B When V2 is off both MFCs remain under front panel control Total power
consumed by the instrument not including the IC was measured to be 09-11 A
117VAC under 150 W total
IC-CD-UV-MS Analysis of Filter Extracts
Filter extraction and analysis were done at Kodak Research Laboratories
(Rochester New York) Sampled 47 mm filters were individually folded and placed in
Centricon centrifiigal filter devices (YM-IO 10000 MWCO Millipore) Filters were
handled with Nitrile gloves and plastic forceps To each Centiicon was added 20 mL of
water as extractant Two centrifugations were done on the same day with the filtrate
68
was
in
passed back through the device for re-extraction After the second pass the filtrate
again tiansferred to the upper chamber and the devices were capped and placed in a
refrigerator for 28 h Finally it was centriftiged for the third and final time (this was
done to soak the filters to provide better analyte recovery) Two blanks were extracted
the same fashion and the average was subtiacted from the sample data (this correction
was insignificant for most analytes) Chromatography was conducted on a GP-40
gradient pump an ATC-2 cleanup column to clean the NaOH eluent a 2 mm AS-15
column an ASRS-Ultia suppressor in the extemal water mode (20 mLmin) an ED-40
conductivity detector a PD-40 photodiode array UV detector (all from Dionex the UV
detector was scanned from 195-350 nm essentially only the 205 nm response was used)
Chromatography was conducted with a 5-85 mM linear gradient in hydroxide
concentration over 25 min and a final hold of 5 min with a constant concentration of 5
methanol in the eluent and with a total flow rate of 025 mLmin The injected sample
volume was 100 |aL Ion exclusion was also used to help differentiate between malic and
succinic acids (the latter was not eventually detected) which co-elute in anion exchange
with hydroxide gradients An ICE-AS6 column with an AMMS-ICE suppressor was
used for this work The mass spectrometer was a SCIEX API 365 in electrospray mode
with negative ion detection
69
Chemicals
All chemicals were analytical reagent grade Nanopure water gt18 MQlaquocm was
used throughout Hydrogen peroxide (30) Na2HP04 and 50 NaOH were obtained
from JT Baker
Aerosol and Gas Generation
A vibrating orifice aerosol generator (Model 3450 TSI Inc St Paul MN) was
used to generate monodisperse aerosols containing (NH4)2S04 and put through a Kr-85
neutralizer (TSI 3054) A Venturi-type nebulizer was used to generate polydisperse
aerosols A laser-based optical particle counter (Model A2212-01-115-1 Met-One
Grants Pass OR) was used for size characterization Other details of the aerosol
generation and characterization system have been published Clean air was supplied by
a zero air generator (model 737-14 AADCO Clearwater FL 100 SLPM) Gas
standards were generated as previously described
Field Deployability
The instrtiment is designed to be used in the field and is readily transportable (32
Kg) Airliquid separators and fiUer holders were placed outside the instrument for ease
of maintenance PVC airliquid separator holders are mounted with thumbscrews on each
side of the instrument console and readily disassembled A Plexiglas plate held on the
front panel of the instrument by similar thumbscrews accommodates filter holders A and
70
B in recessed housing All user settable items including mass flow controller readout and
controls are easily accessed from the front panel The peristaltic pump body was affixed
within tiie top of the computer case with the case cut out in the front and the top such that
the pump head exits through the top (tubes are readily changed) and the pump panel is
accessible through the front
Resuhs and Discussion
Instrument Performance
Filter Collection Efficiency Recovery and Carryover
Glass fiber filters are known to display essentially zero breakthrough for particles
over a large size range In the present work breakthrough through these filters was
studied using a polydisperse KBr aerosol (Mass median aerodynamic diameter 057 |xm
Gg 147) at concentrations of 21 and 25 |Jgm Breakthrough was determined by
allowing the system to sample through FA and FB for 4 hours each and installing a
separate pre-washed 47 mm quartz fiber filter downstream from each of these The latter
were manually extracted and analyzed Bromide was chosen as the test aerosol because
tiie filter blank for this analyte was below the limit of detection (LOD) Bromide
remained below LOD after 4h sampling (n=6) The capture of the aerosol by the filters is
thus deemed to be quantitative Recovery of the bromide collected on FA and FB
following the standard wash and preconcentiation period of the instrument was 971 plusmn
34 (n=6) compared to parallel sampling on a 47 mm filter manual extraction and
analysis System carryover was determined by spiking the sampling filter with 100 ig
71
aliquots of bromide continuously washing the filter thereafter and preconcentrating every
successive wash for 85 min and analyzing the same The first wash recovered 986
plusmn03 and every successive wash contained exponentially decreasing amounts such that
following four wash cycles the signal was below the LOD
Limits of Detection Filter Blanks and Filter Pretreatment
Instiiimental LODs (SN=3 ) for chloride nitiite nitrate sulfate and oxalate with
electiodialytically generated electrodialytically suppressed eluents are very low under
current experimental elution condhions these are typically in the 5-25 pg range for a
properly operating system using current state-of-the-art commercial hardware (It would
be even lower for the fast eluting fiuoride formate methanesulfonate etc but citing
these LODs may not be relevant because under the current standard elution conditions
these are not resolved) For a 75 L air sample these would translate into LODs that are
of the order of 01 ngm^ for the above anions were it not for the filter blanks Glass fiber
(GF) filters contain high levels of some ions most notably chloride and sulfate If used
as such they must go through cycled instrument operation for several hours before the
chloride and sulfate values still leaching from the filter become insignificant in
comparison to typical urban background levels All of the following strategies can be
successfully used (a) use high purity prewashed quartz fiber fitters (b) pre wash several
GF filters on a Biichner funnel with copious amounts of DI water store refrigerated
singly in pre washed plastic containers (NOTE Do not ultrasonicate or apply any other
similarly energetic measures to wash GF filters they will disintegrate) (c) soak 10-12
72
filters at a time in a beaker of deionized water Decant and replace with fresh water at
least four times at 15 min intervals After the last disposal cover tightiy with Parafilmreg
and store refrigerated Strategy a is convenient but expensive strategy c involves least
labor and is what has generally been used discarding the first three cycles of data when
the filter is first replaced Under these conditions typically filter blanks (or more
accurately variations in filter blanks) are sufficiently reduced such that LODs for all of
the above ions equate to lt10 ngm^ and after a few hours of operation approach I ngm^
Blank issues do not constitute a significant consideration for the gas analysis
system (except for analytes eluting very close to the carbonate (CO2) peak) LODs in the
01 -1 ngm are routinely obtained for the target gases
Choice of Filter Filter Replacement Frequency
Glass fiber (GF) filters have the drawback that during the washing cycle fibers
are shed Fouling of the preconcentration column by the fibers is prevented by the paper
filter underneath the GF filter and by the fiber trap filter (FTF see Figure 33) Current
manufacturers specifications on the preconcentrator columns used are such that the
pressure drops at the desired preconcentration fiow rate are at the limits of performance
for many peristaltic pumps When fouled the pressure drop increases and in the worst
case liquid can back up on the filter housing In the first field deployment in Atlanta in
1999 The system was operated without the paper backup filter for several days and one
preconcentration column was marginally fouled decreasing die flow rate and consistently
producing lower results on that channel The work of Buhr et al has already
73
demonstrated that fritted glass filters may not result in efficient capture of small particles
No filter media other than glassquartz fiber has been found that offer the combined
advantages of (a) high flow rates with minimal pressure drop (b) quantitative retention of
particles across the size range (c) efficient extractability with minimum volume of a
purely aqueous extractant and (d) high flow rate in wet condition to permit rapid drying
The frequency with which the filter needs to be replaced seems to depend on
particle loading Note that water-insoluble substances remain on the filter and gradually
accumulate increasing the pressure drop In at least one location the filter surface was
accumulating substances that were rendering it hydrophobic Once this happens to a
significant extent washing ceases to be uniform and the filter must be replaced regardless
of pressure drop issues In various field sampling locations it has been found that the
necessary filter replacement frequency vary between 1 to 3 days In this context it is
interesting to note that carbonaceous (soot-like) compounds are not water soluble and
accumulate on the filter In urban sampling much as k happens on hi-volume samplers
the filter surface becomes dark as it is used It would be relatively simple to
accommodate LED(s) and detector photodiodes within the filter housing to measure this
discoloration and thus obtain a crude soot index
Denuder Liquid Considerations for IC Coupling
A Dedicated Denuder for the Particle System
With an IC as the analyzer of focus water-soluble ionogenic gases are the analytes of
interest Acid gases include SO2 HCI HF HONO HNO3 CH3SO3H and various
74
organic acids primarily CH3COOH HCOOH and (C00H)2 Ammonia is the only basic
gas of importance under most condhions
If water is used as a collector sulfur dioxide is collected as sulfurous acid
Henrys law solubility of SO2 is limited and quantitative collection may not occur under
these conditions Additionally some of the bisulfite formed undergoes oxidation to
sulfate either in the denuder andor the IC system leading to both sulfite and sulfate
peaks This unnecessarily complicates quantitation Recent evidence^^ indicates that
when a denuder is cooled very little oxidation to sulfate occurs - this suggests that the
oxidation within the IC system may be limited However this is likely a function of the
degree of trace metal fouling of the chromatographic systemcolumn Addition of a small
amoimt of an oxidant like H2O2 to the denuder liquid eliminates this problem and results
in virtually instantaneous oxidation of the collected SO2 to sulfate For the gas analysis
denuder the recommended denuder liquid is thus 05 mM H2O2 All other collected
analytes including nitrite (originating from HONO) is completely unaffected by the
H2O2 Dilute H2O2 is also easily cleansed of ionic impurities by passing it through a
mixed bed ion exchanger
Recently Zellweger et al pointed out a potential problem with collection of the
weaker acids in high SO2 environments It is easily computed that in an atmosphere
containing 100 ppbv SO2 quantitative collection at an air flow rate of 5 LPM and a total
liquid effluent flow rate of 1 mLmin will lead to 20 [iM H2SO4 (pH -44) in the liquid
effluent Many weak acid gases may have solubility limitations in such a solution
Particular concern was expressed about HONO (pKa 31-32) although the sitiiation is
75
obviously worse with gases like acetic acid (pKa 475) Zellweger et al proposed a dilute
solution of their chromatographic eluent ~ 50 i M NaHC03 as the PPWD feed
Unfortunately this may not provide a generally applicable solution In the
presence of large amounts of SO2 the low concentration of influent NaHC03 used
solution may be overwhelmed The following arguments can be made in favor of not
adding any alkaline modifier (a) weak acids dissolve in aqueous solution both by their
ionization and through their Henrys law partition (intrinsic solubility) If the latter is
high (HCN a very weak acid has a very high intrinsic solubility for example^^) then
good collection is maintained (b) levels of SO2 -gt 100 ppbv are found sporadically as a
plume impacts a sampling location but such levels on a sustained hdisxs are not common
at least in the US the suggested approach may be meritorious in an exceptional case but
generates problems for other more common situations (c) a large amount of carbonate in
the sample is incompatible with hydroxide eluent based anion chromatography presently
the preferred practice Use of a carbonate containing PPWD liquid generates a
substantial amount of carbonate in the effluent a broad tailing carbonate peak can
obscure smaller analyte peaks in that region (d) an alkaline denuder liquid will inhibit
uptake of ammonia if ammonia is to be analyzed in the same sample
Although it has not been explicitiy so stated the different composhions tried for
the denuder liquid by the ECN group^ makes it clear that they too have grappled with
this problem A complete solution is not yet available Note that gases that are not
collected by a denuder preceding the PCS will generally be collected by a PCS
(especially a steam condensation based PCS) causing positive error While
76
subquantitative collection of gases by the gas analysis denuder cannot be easily corrected
for errors in the particle composition measurement can be prevented by simply using a
separate gas removal denuder for the PCS This denuder uses a denuder liquid buffered
at pH -7 with sufficient buffer capacity and at enhanced liquid flow rate that allows
complete removal of both acid gases and ammonia
In principle a similar approach can be practiced with the gas analysis denuder if
the buffer material used is removed completely by suppression or is invisible to a
conductivity detector Ito et al ^ used a zwitterionic buffer to remove high levels of
acidic gases (as may be present in indoor environments when a kerosene-fiieled heater is
operated) or high levels of ammonia (which have been encountered in homes with live-in
pets) before aerosol analysis While these approaches have not been demonstrated when
the denuder effluent is to be preconcentrated and analyzed zwitterionic buffering may
still be useful Glycine for example has an appropriate pKa to be useful as a buffer and
is suppressible Morpholinoethanesulfonic acid and Bis-tris should be among other
potentially useful suppressible zwitterionic buffers which will provide a low
conductivity background Initial experiments with such materials appear promising and
future investigation of an optimum choice is required Meanwhile the conflicting needs
of incorporating a cyclone of an appropriate cut point before the PCS and of having no
inlet system for analyzing sticky gases in a gas analysis system still suggests that the PCS
has its own gas removal denuder regardless of denuder liquid considerations
77
Illustrative Field Data
The instiument has been deployed in several summertime field studies each with
4-6 week duration Atlanta Supersite (1999 during which an imtial version of the
instrument was used) Houston Supersite (2000 during which the presently described
version of the instrument was used) and Philadelphia (2001 during which the gas phase
portion of tiie instrument was used) Figure 35 shows the concentrations of nitric
acidparticulate nitrate nitrous acidparticulate nitrite (the latter is nearly zero -
establishing that this type of filter based measurement do eliminate artifact nitrite
formation) and sulftir dioxideparticulate sulfate for a few days from the Atlanta site
Figure 36 shows the concentrations of hydrochloric acidparticulate chloride oxalic
acidparticulate oxalate for a few days from the Houston site Typical chromatograms for
the gas and particle analysis systems are shown in Figure 37
When carefully examined for minor components the chromatograms especially
those for the aerosol samples reveal a far greater degree of complexity A gradient
chromatogram of a 30 min sample collected in Atianta is Shown in Figure 38 with
overlays representing lOx and lOOx magnifications of the base chromatogram
Considering that the baseline is essentially completely flat for a blank run even at the
lOOx magnification the number of real components present in such a sample becomes
readily apparent Not surprisingly a majority of these peaks are organic acids While
MS is uhimately the only completely unambiguous means of identification when
confirmed by a matching standard in many cases the charge on the analyte ion can be
estimated by determining void voltime corrected retention times (^R) under isocratic
78
elution conditions at 3 or more different eluent concentrations Under these conditions it
is well known that the slope of a log R VS log [eluent] plot is equal to the ratio of the
charge on the analyte ion to that on the eluent ion (unity for hydroxide)^ This is shown
in Figure 39 With this information and the nature of UV response of the analyte h is
often possible to determine the identity of the analyte At the very least it provides clues
for selecting confirmation standards for MS
Table 32 lists average daytime and nighttime aerosol composition for a relatively
polluted period during the Atlanta measurement campaign The analysis was conducted
by IC-CD-UV-MS by Drs Martin and Smith at Kodak with identification confirmed by
MS and conductivity providing quantitation Several peaks remain imidentified numbers
in parentheses provided for these are calculated from the conductivity peak areas based
on the average response These should be taken as lower limits because the average
response per imit weight is dominated by strong acid anions and these unidentified
species are almost certainly organic acids for which response per unh weight is likely to
be smaller I have also performed qualitative IC-MS analysis of fiher extracts The filters
were collected in two field studies in Philadelphia and Houston and archived for lab
analysis The resuhs are shown in Table 33 Oxalate Succinate Methylmalonate
Malonate Malate Maleate and Oxalate were present in almost every sample Lactate
Phthalate and Butyrate have been identified in some samples however in others they
were either below the LOD of the instrument or unpresent To the authors knowledge
this is the first attempt to decipher the total anionic composition of ambient urban
aerosol In a global context it is most remarkable that the list of the organic acids
79
identified here overlaps in a major fashion with the list of aliphatic organic acids that are
used as metabolic pathway markers in the human physiological system^^
Conclusion
An automated particle collection and extraction system has been presented When
coupled to an IC for analysis the system mimics the standard procedure for the
determination of the anion composition of atmospheric aerosols The instrument
provides high sensitivity and allows analysis of anions in aerosol in only a fraction of the
time and cost of conventional techniques A wide range of aerosol constituents can be
determined by simply changing the analytical technique used to analyze the filter extract
The instrument is field worthy In the Houston field experiment of a total of continuous
deployment over 872 hours the particle (gas) analyzer instruments respectively produced
meaningfiil data 85 (90)) of the time was being calibrated 5 (5) of the time and was
being equilibrated (fitter wash) in maintenance or down 10 (5) of the time
Acknowledgments
I would like to thank Charles Bradley Boring who gave his time and effort to put
this instrument together and Zhang Genfa who operated the instrument in Atlanta in 1999
before I was able to use it in Houston in 20001 also would like to thank Michael W
Martin and William F Smith at Kodak Research Laboratories for analyzing the filter
samples by IC-CD-UV-MS
80
References
1 Dasgupta P K ACS ADV Chem Ser 1993 232 41-90 idem In Sampling and Sample Preparation Techniques for Field and Laboratory Pawliszyn J Ed New York Wiley NY (in press)
2 Crider W LAnal Chem 1965 37 1770-1773
3 Huntzicker J J Hoffman R S Gary R A Atmos Environ 197812 83-88 Coburn J Husar R B Husar J D Atmos Environ 197812 89-98 Tanner R L DOttavio T Garber R Newman L Atmos Environ 198014 121-127 DOttavio T Garber R L Tanner R L Newman L Atmos Environ 1981 75 197-203 Slanina J Lamoen-Dormenbal L V Lingera W A Meilof W Klockow D Niessner R Int J Environ Anal Chem 1981 9 59-70 Garber R W Daum P H Doering R F DOttavio T Tanner R L Atmos Environ 198317 1381-1385 Slanina J Schoonebeek C A M Klockow D Niessner R Anal Chem 1985 57 1955-1960 Lindqvist F Atmos Environ 198519 I67I-I680 Huntzicker J J Anal Chem 1986 58 653-654 Appel B R Tanner R L Adams D F Dasgupta P K Knapp K T Kok G L Pierson W R Reiszner K D In Methods of Air Sampling and Analysis Lodge J P Ed 3rd ed Lewis Chelsea MI 1988 Method 713 pp 523-532
4 Klockow D Niessner R Malejczyk M Kiendl H vom Berg B Keuken M P Wayers-Ypellan A Slanina J Atmos Environ9S9 23 1131-1138
5 Dzubay T G Rook H L Stevens R K Abstract WATR-045 165th National Meting of the American Chemical Society 1973
6 Roberts P T Friedlander S K Proc Conf Hlth Consequences Environ Controls Durham NC 1974 Roberts P T PhD Dissertation California Institute of Technology 1975 Roberts P T Friedlander S K Atmos Environ 197610 403-408
7 Husar J D Husar R B Stubits P K Anal Chem 1975 47 2062-2064 Husar J D Husar R B Mascias E Wilson W E Durham J L Shepherd W K Anderson J A Atmos Environ 197610 591-595 Hering S V Friedlander S K Atmos Environ 1982 7(52647-2656
8 Sturges W T Harrison R M Environ Sci Technol 1988 22 1305-1311
9 Yamamoto M Kosaka H Anal Chem 1994 66 362-367
10 Hering S V Stolzenburg M R US Patent 5983732 Stolzenburg M R Hering S V Environ Sci Technol 2000 34 907-914 Liu D Y Prather K A Hering S W Aerosol Sci Technol 2000 33 71-86
11 Turpin B J Gary R A Huntzicker J J Aerosol Sci Technol 1990 72 161-171
12 Bacri J Gomes A M Fieni J M Thouzeau F Birolleau J C Spectrochim Acta 1989 44B 887-895 Nore D Gomes A M Bacri J Cabe J Spectrochim Acta 1993 48B 1411-1419 Gomes A M Sarrette J-P Madon L Almi A Spectrochim Acta 1996575 I695-I705
13 Duan Y Su Y Jin Z Abein S Anal Chem 2000 72 1672-1679 idem AIP 200071 I557-I563
14 Sioutas C Koutrakis P Olson B A Aerosol Sci Technol 1994 27 223-235 Sioutas C Koutrakis P Burton R M J Aerosol Sci 1994 25 1321-1330 idem Particul Sci Technol 199412 207-22 idem Environmental Health Perspectives 1995103 172-177
15 Clark C D Campuzano-Jost P Covert D S Richter R C Maring H Hynes A J Saltzman E S J Aerosol Sci 2001 32 765-778
16 Myers R L Fite W L Environ Sci Technol 1975 9 334-336 Sinha M P Giffin C E Norris D D Estes T J Vilker V L Friedlander S K I Colloid Interface Sci 1982 87 140- 153 Marijinissen J C M Scarlett B Verheijen P J T J Aerosol Sci 198819 1307-I3I0 McKeown P J Johnson M V Murphy D M Anal Chem 1991 63 2069-2073 Kievit O Marijinissen J C M Verheijen P J T Scarlett B J Aerosol Sci 1992 23 S30I-S304 Hinz K P Kaufinann R Spengler B Anal Chem 1994 66 2071-2076 Mansoori B A Johnston M V Wexler A S Anal Chem 1994 66 3681-3687 Prather K A Nordmeyer T Salt K Anal Chem 1994 66 3540-3542 Carson P G Neubauer K R Johnson M V Wexler A S J Aerosol Sci 1995 26 535-545 Murphy D M Thomson D S Aerosol Sci Technol 1995 22 237-249 Reents W D J Mujsce A M Muller A J Siconolfi D J Swanson A G J Aerosol Sci 1995 23263-270 Hinz K P Kaufmann R Spengler B Aerosol Sci Technol 1996 24 233-242 Lui D Rutherford D Kinsey M Prather K A Anal Chem 1997 69 1808-1814 Card E Mayer J E Morrical B D Dienes T Fergenson D P Prather K A Anal Chem 1997 69 4083 -4091 Kolb C E Jayne J T Worsnop D R Shi Q Jimenez J L Davidovits P Morris J Yourshaw I Zhang X F Abstract ENVR 100 219 National Meeting of the American Chemical Society March 2000 Song X-H Hopke P K Fergenson D P Prather K A Anal
82
Chem 1999 71 860 -865 Gross D S Galli M E Silva P J Prather K A Anal Chem 2000 72 416-422
17 Lodge J P Ferguson J Havlik B R Anal Chem 1960 32 I206-I207- Lodge J P Pate J B Science 1966 755 408-410 Lodge J P Frank E R J Microscopic 1967 6 449-455 Bigg E K Ono A Williams J A Atmos Environ 1974 8 1-13
18 Suess D T Prather K A Chem Rev 1999 99 3007-3035
19 Blatter A Neftel A Dasgupta P K Simon P K In Physico-Chemical Behavior of Atinospheric Pollutants Angletti G Restelli G eds Proc 6th European Symposium Report EUR 156092 EN Luxembourg 1994 pp 767-772
20 Loflund M Kasper-Giebl A Tscherwenka W Schmid M Giebl H Hitzenberger R Reischl G Puxbaum H Atmos Environ 2001 35 2861-2869 Weber R J Orsini D J Daun Y Lee Y-N Klotz P J Brechtel F Okuyama K Aerosol Sci Technol 2001 (in press) Zellweger C Ammann M Hofer P Baltensperger U Atmos Environ 1999 55 1131-1140
21 Simon P K Dasgupta P K Environ Sci Technol 1995 29 1534-1541 Simon P K Dasgupta P K Anal Chem 1995 67 71-78 Poruthoor S K Dasgupta P K Genfa Z Environ Sci Technol 1998 32 1147-1152 Poruthoor S K Dasgupta P K Anal Chim Acta 1998 361 151-159 Ito K Chasteen C C Chung H-K Poruthoor S K Genfa Z Dasgupta P K Anal Chem 1998 70 2839-2847
22 Slanina J ten Brink H M Otjes R P Even A Jongejan P Khlystov A Waijers-Ijpelaan A Hu M Atmos Environ 2001 35 2319-2330 Khlystov A Wyers G P Slanina J Atmos Environ 1995 29 2229-2234
23 Buhr S M Buhr M P Fehsenfeld F C Holloway J S Karst U Norton R B Parrish D D Sievers R E Atmos Environ 1995 29 2609-2624 Liu S Dasgupta P K Talanta 1996 43 I68I-1688 ibid Anal Chem 1996 68 3638-3644 Karlsson A Irgum K Hansson H J Aerosol Sci 1997 28 1539-1551 Liu S Dasgupta P K Microchem J 1999 62 50-57
24 Atlanta 1999 httpwrvyw-wlceasgatechedusupersite Houston 2000 httpvywwutexaseduresearchceertexaqs Philadelphia 2001 httpwwwcgenvcomNarsto
83
25 Appel B R ACS Adv Chem Ser 1993 232 1-40 Koch T G Fenter F F Rossi M J Chem Phys Lett 1997 275 253-260 Neumann J A Huey L G Ryerson T B Fahey D W Environ Sci Technol 1999 33 1133-1136 Komazaki Y Hashimoto S Inoue T Tanaka S Atmos Environ 2002 (in press)
26 Samanta G Boring B Dasgupta P K Anal Chem 2001 73 2034-2040
27 Chang I H Choi N H Lee B K Lee D S Bull Kor Chem Soc 1999 20 329-332 Chang I H PhD Dissertation Yonsei University Korea August 2001
28 Kuban V Dasgupta P K Anal Chem 1992 64 1106-1112
29 Keuken M Schoonebeek C A M Wensveen-Louter A Slanina J Atmos Environ 1988 22 2541-2548 Wyers G P Otjes R P Slanina J Atmos Environ 1993 27A 2085- 2090 Slanina J Wyers G P Fres J Anal Chem 1994 350 467-473 0ms M T Jongejan P A C Veltkamp A C Wyers G P Slanina J Int J Environ Anal Chem 1996 lt52207-2I8 Jongejan P A C Bai Y Veltkamp A C Wyers G P Slanina J Int J Environ Anal Chem 1997 66 241-251
30 Ivey J P J Chromatogr 1984 257128-132
31 Small H Ion Chromatography New York Plenum 1989 68-69
32 httpoxmedinfoir2oxacukPathwavMiscell24028htm
84
X
O I
o o o
o o
00
gt
o
b
O
O
z o b O o
gt o o o b b o
gt
b b O
b b O o
b b O
gt b b O sect
b b O
z o
gt z o o
b b
o z o
gt
b b O
Z o
2 O sect
gt
b b O z o
b b O sect
b b O
b b O z
o
z o
pound5
H
O CO
o fa
^3
00
3
u
I
(N
u b
OX)
c 2 tft C8 ^ t iS or)
lt
go
nF
c
mpl
i gi
nsa
D CQ
m b
and
pa b J3 OX)
p ^ T3
spir
ate
cd OX)
g X)
td ^
rt
u
on
toP
aded
ig
lo
5 Hi 03
(N
u b
03 b
hing
W
as
^
on F
A
gsti
l pl
in
E
ltu ^ amp E o o
^r t
U (11
r Pu
rg(
ltLgt
Wat
FB
D
ry
u b
03 b o -raquo OX)
_g n 6 ta tA
Si
gt
dry
CQ b
4) T3 O E o o u ^ s O b P
b
lt b 00
S tfi CQ
gin
lto 03
U b
lt b 00
S ampgt Q g ob ltu CQ
03 b C o ^ w 00 _g H E
(N
u b C o (U 00 ^ 3 b
s ^
85
Table 32 Average anion composition of day and night time aerosol in midtown Atlanta August 1999
Retention time
Conductivity Detector
834 895 937 956 983 1096 1123 1187 1304
1493
1560 1623 1657 1723 1813 2046 2158 2328 2433 2487 2587 2672 2850 2910
min
UV Detector
1327
1552
1834
2352 2466
2606
2883
Analyte
Fluoride Glycolate Acetate Lactate Formate
a-Hydroxyisobutyrate Unknown
Methanesulfonate Chloride Pyruvate Unknown
Nitrite Carbonate
Malate Malonate Sulfate Oxalate
Unknown Phosphate
Nitrate Unknown Unknown Unknown Unknown
o-Phthalate Unknown
Concentration Micrograms
Day Samples
11 028 058 081 091 002
[0015] 005 98 tr
[0004] 011 nd
030 036 16
034 [001] 003 19
[002] [003] [0004] [0003]
tr [0004]
per Cubic Meter
Night Samples
058 019 025 032 071 003 [002] 004 55 tr
[001] 015 nd
024 026 11
027 [002] 003 17
[003] [003]
nd [0007]
tr [0072]
Retention times are as per the chromatographic protocol described in text Numbers in parentheses provided for unknown peaks are calculated from the conductivity peak areas based on the average response These likely the lower limits
86
Table 33 Organic anion composition of aerosol filter samples collected in Houston TX 2000 and Philadelphia PA 2001 and identified by IC-MS
Study
Boston TX August 12 -September 25 2000
Period of collection
Aug 22 830 p m -Aug 23 840 am
Aug 23 840 am -Aug 23 750 pm
Aug 28 830 a m -Aug 28 900 pm
Sep 7 830 pm -Sep 8 930 am
Sep 10830 a m -Sep 10830 pm
Sep 12830 a m -Sep 12800 pm
Sep 16830 p m -Sep 17 845 am
Analyte
Succinate Malate Lactate Maleate Oxalate Phthalate
Succinate Methylmalonate Malonate Malate Lactate Maleate Oxalate Phthalate Butyrate
Succinate Methylmalonate Malonate Malate Lactate Maleate Oxalate Phthalate
Succinate Methylmalonate Malonate Malate Maleate Oxalate
Succinate Methylmalonate Malonate Malate Maleate Oxalate Phthalate
Succinate Methylmalonate Malonate Malate lactate Maleate Oxalate Phthalate
Succinate Malonate Lactate Maleate Oxalate Phthalate
Philadelphia PA July 1-July30 2001
July 6 740 am -July 6 800 pm
July 10830 a m -July 10840 pm
July 16 1000 pm-July 17830 am
July 16830 a m -July 16 1000 pm
July 21 900 a m -July 21 900 pm
July 21 900 p m -July 22 840 am
Succinate Methylmalonate Malonate Malate Lactate Maleate Oxalate Phthalate
Succinate Methylmalonate Malonate Malate Lactate Oxalate Phthalate
Succinate Methylmalonate Malonate Malate Oxalate
Succinate Methylmalonate Malonate Malate Lactate Maleate Oxalate
Succinate Methylmalonate Malonate Malate Lactate Maleate Oxalate Phthalate
Succinate Methylmalonate Malonate Oxalate
87
LI o
o
o
A O
o lt
o
LR
W A
Figure 31 Wetted denuder shovra schematically AIAO Air inout aperttires LILO Liquid inout apertures LR Porous polyvinylidene fluoride element acting as a liquid flow restrictor WA wetted area S PTFE spacer SH Screw holes for affixing two denuder plates together
PPWD
MB
MB
[if Ambient
Air I r n
MFC-C
IC1 PP
FC MFC-D
H202 i P2
=Kiir^ Ambient
Air In F P H R l
FA
T
(a)
MFC-B MFC-A P1
Q-
V1
(b)
ON OFF
Figure 32 Particle collection system (a) Total system airflow and gas analyzer liquid flow schematic PPWD Gas system wet denuder MB mixed bed resin deionizer columns IC Gas analysis system ion chromatograph (uses 10-port dual concentrator column injector as in PCS IC in Figure 3 FAFB Glass fiber filters T Trap bottles MFC-ABCD Mass flow controllers C Cyclone FC 47 mm filter for MS analysis PI2 Air sampling pumps PP Peristaltic pump F Filter P Purifer H Heater The dotted section including the denuder is on the roof while the air pumps are either below the instrument shelter or in a modified doghouse with forced air ventilation VI aerosol switching valve shown in detail in (b)
89
OJ
N
P dl o
h
o gt
I
D
(U lgt
re bullcopy
^ s b o b Sa laquor o
00 o
Q ox
J o c
oo r- O
gt U 13
X)
uT u T3 3 C ltu
T3 CA
a 00
U b Q ^ b o b 5=
en
^ s 00 ^ b -3 = cr b mdash gt- 5 i
(C u bullg ^ 3 c D - -u gtgt
bull5
1) D ^ ^-raquo cl
u b T3 S B3
u b i ^ p i
5 o ltN o 5i bull U
to
^ g
- 8 u
^
c o
00 ^ S E
o o
bullO X) S -a ^ S bullmdashbull TO
o u E ^
T H ta
u C bullS o
(U
claquo gt
0) 2 tn o
^ t r c b A ^ - S
E lt 3
90
raquo5 Vdc -
QND-
TTL2ln
MF9-
QNO-
U1
- bull 6 Vdc
-ONO
-QND
- n L 1 In
U22
D13 mdash
OND mdash
U24
D71012
mdashETH U28 mdash mdashID I 04811 mdash
DmdashIsM
1 4
2 13
9 12
4 U2 5 10
C
7
MF3A
U 2 4 mdash ( a
DI9
QND
U2lt mdash 0
bull laquo = D9 4- D
I ONDmdashS
(a)
R I A 1 0 K 5 V 10 -Turn
r Fuse 025 A
(b)
bullmdash^t^rreg~^ LB
LA - SAMPLING ON AT FILTER A
LB - SAMPLING ON AT FILTER B
Figure 34 Schematic ofelectronics governing instrument operation (a) Ul (ECG74155AN) demultiplexer takes chromatograph TTL signals and produces demultiplexed outputs at pins4-7 these are inverted by hex inverter U2 (ECG 7404) and addresses gates of logic level N-Channel MOSFET switches (RFM8N18L) to turn onoff various valves via diode logic (b) Air heater and hot air flow control
91
o E u Q 3 U 0)
a (0 E S O) S u E
c 0) u c o o
i lt
c flgt (0
o
Nitric Acid
Nitrate
Sulfur Dioxide
A Sulfate
81699 81899 82099
Figure 35 HNOsNitrate HONONitrite and S02Sulfate patterns at a Midtown location in Atlanta GA Note nocturnal maxima in the middle panel and opposite behavior in others
92
o
re gtlt
O X
O
1 T CO (Vj 00 ^
9BKu ojqno jacTsujejSojDjUJ uouBJjuaDuoo |OSOjav pue seg
o o (0 ^ agt
o
94
0 2
00
v 0)
o o ^ l - l CO
oo
o o tn CM X CO
o o ^
823
00
H
82
o o 0) H V 00
13 S 3 CO
2P (u S ^
S H as ^ en
O deg ^ J
M O o -s
ite
cl
emis
D V 15 a O 2 XI bullfiu C3 - )
ily i
ndi
e la
rge
^ ^ agt ^
Si o a c
C5 CO
13 S gt o
Ji ltu ogt -^
la pound3 X sect
O S ac
id
isk
n
U (U - Rj V3
rgt ci
e0
Thi
-o
hlor
i T
X
^ S s reg u g
3 CiO
b
93
o H X
fuiSntrOO iraquogtBllaquoxo
in H
pounduijSn sff araquoJins
5
Sis
g = jiu^nj-sapuona
O sect s
stis pilt nntSiio inii[3 -|s laipo 8iiiuoj8iB)83yapuaij
o
CO to
^ mdash f mdash
CM
o c
E
c o
U9l in u
qddfi TZOS
o o 00 f
fo DC 00 a o 5
(U IT) s
00 X
qtW|79ioeoMH
zoo
qddrroosDH qddaocw
(3 l | ltX0qjB30U0Ul )
HOCOH t)VCraquoIdH
1 M 00 ^ H
UJ3su3UJ3soJ3UJ 33uepnpuo3
o d q cvi
OE 00 E
oT E
c o
o d
C o V3
O
K S (U +-raquo a i gt- M
Ji 13
13
o bulls
I o
gt
CO
Pt
rn d)
op
94
bulla ogt o 0 re
re pound re c bullB 0
c u 4-gt
re u
nifi
O) re E X 0 T -
c 0 re u C
gni
re E X 0 0 ^
luosn aouepnpuoQ
0 fO
50
(M
00
cgtlaquo
0 10
^
0 0
50
0 0
c E 0)
t-1-c 0
Elut
u
read
ily
(6)
sulf
at
Onl
y itr
ate
xp
erim
ent
onat
e (
5) n
B J3 a 0
5 (U R
^bulls ^ C
rH -s
B ^ T3 bdquo (11 T j
1 co
llect
2)
chl
ori
0 ^ ^ laquo3 (U
m o
f an
aer
nate
ac
etat
on
chr
omat
ogra
i (I
) fl
uori
de
fon
ient
ak
s
-0 ltu c5 ft
0 1 - 0
u t l S 0 0
( i j tTi (U
oxa
[ ^
b
95
150 - 1
100-
E 0)
050
Cd
S 000 o ltu o O ogt o
-050 -
bull100
Unk4 slope -2061
Unk7 slope-18
Unk3 slope -26 ^ Unk6 slope-11 Nitrate Slope-117
Sulfate Slope-180
arbonate slope-162
Nitrite slope-110 Chloride slope 90
Unk9 slope-11 UnkS slope-101
Unki slope -1
110 120 130 140 log [Hydroxide Eluent Concentration mlVl]
150
Figure 39 Log tRversus log [eluent] plots reveal charge on analytes aiding search for a
confirmatory standard
96
CHAPTER IV
CONTINUOUS ANALYZER FOR SOLUBLE ANIONIC
CONSTITUENTS AND AMMONIUM IN ATMOSPHERIC
PARTICULATE MATTER
Introduction
The health effects of particulate matter (PM) has been a subject of intense and
growing discussion For the most part the available evidence is epidemiological
rather than direct and hence creates a controversy^ PM is an umbrella term that includes
different species that vary widely in chemical composition size and toxicity It is
particularly important to have high temporal resolution PM monitors that provide
chemical composition information along with simultaneous information on gaseous
species and meteorological data to better understand the chemistry of aerosol formation
and transport thermodynamic equilibrium or lack thereof Such information is also
invaluable in performing source apportionment
Several approaches are available towards automated near continuous
measurement of chemical composition of particulate matter Mass spectrometry (MS)
7 0
has been effectively used for online real time analysis of particulate matter Presently
MS is capable of single particle analysis down to nm size particles and provide
information about particle size morphology and compositiondeg However response is
strongly matrix dependent and the results tend to be qualitative and limited by cost and
the complexity
97
More conventional chemical analysis must automate and reasonably integrate the
steps of collection and analysis Very small particles are hard to collect by impaction
The concept of growing particles with steam prior to impaction followed by ion
chromatography (IC) analysis was introduced by Dasgupta et al^^ and almost
simultaneously by Khlystov et al^^ Kalberer et al^ and especially Loflund et al have
described sophisticated systems that are largely modeled after the first design Weber et
al presented a particle-into-Iiquid system that is based on the particle size magnifier
design of Okuyama et al that also uses steam The sample is analyzed by a dual IC
system with a reported LOD of 10-50 ngm and time resolution of 35-4 min Steam
introduction has proven to be one of the most efficient means to grow and collect
particles Yet available denuders do not remove NO and NO2 effectively The reaction of
steam with these gases produces nitrite and to a lesser extent nitrate On a continuously
wetted glass frit Buhr et al found higher levels of nitrate than observed on a
conventional filter based instrument The steam introduction technique involves
generation injection and condensation this also adds to instrument complexity and size
Attempts to obviate the use of steam have recently been underway Boring et al recently
described a filter based automated system^^ coupled with IC for measurement of anions in
PM The system uses a parallel plate wetted denuder (PPWD) and two glass-fiber filters
that alternate between sampling and washingdrying The filter wash is preconcentrated
for analysis The filter based system has its own merits but leaching of fibers from
presently used fibrous fdters leads to fouling of dovmstream components and presents
problems In addition the filter system intrinsically operates on a batch mode To
98
accommodate the needs of future continuous analysis systems a truly continuous analysis
system is desirable
Of PM constituents sulfate and nitrate are of the greatest interest Monitors that
specifically monitor particulate sulfate and nitrate have been introduced Hering and
Stolzenburg^^-^^ described a system that samples air at 1 standard Lmin (SLPM) through
a 25 pm cut cyclone inlet followed by a carbon impregnated denuder to remove the
gases The particles then pass through a Nafion humidifier and are collected by
impaction on a metal sfa-ip For analysis the strip is directly heated electrically and the
liberated gases (SO2 from sulfate NOx from nitrate) are measured by gaseous SOaNOx
monitors^^ A nitrate analyzer that removes NOx collects nitrate on a quartz fiber filter
thermally decomposes the nib-ate and measures the NOx has been described by Allen et
al These researchers have also tested a system in which a sulfur gas free sulfate
aerosol stream is thermally decomposed to SO2 prior to measurement by a modified
gaseous SO2 analyzer ^
The above instruments operate on cylinder gases as the only consumable and are
therefore attractive IC analysis is attractive for a different reason it can provide
simultaneous analysis of multiple constituents Present day ICs can also operate on pure
water as the only consumable In this vein a simple robust device for semi-continuous
collection of soluble ions in particulate matter is developed The collector is inspired by
the designs of Cofer and Edahl^^^ who developed a device to collect and concentrate
trace soluble atmospheric gases from large volumes of air into small volumes of liquid
with high efficiency by a nebulization-reflux techniques Janak and Vecera used the
99
same principle of nebulizationreflux shortly thereafter again for gas collecfion A
similar principle to collect particles after prior removal of soluble gases is used here
The present device can be designed with an optional inlet that can provide a particular
size cut This PC has been extensively characterized in the laboratory and deployed in a
number of major field studies
Experimental Section
Particle Collector Extractor
Figure 41a and 41b show the two designs of the PC investigated in this work
The PC is essentially a sealed cylindrical chamber (3 in od 25 in id 375 in tall)
made of Plexiglas to which the sample airflow is introduced through a constricted nozzle
The simpler version shovm in Figure 41a does not provide any size cut In this design
the soluble gas denuded air stream flows straight into the PC through a Plexiglas orifice
The nozzle bearing the orifice is machined to have a smooth inner surface and a gradual
taper (-75 deg) without an abrupt edge It fits snugly over a perfluoroalkoxy (PFA) Teflon
inlet tube (875 mm od 75 mm id 1 SW Zeus Industrial Products) that serves as the
exit tube of the PPWD and connects it to the PC The PPWD is identical to that used in
chapter III DI Water is pumped peristaltically (PP5) at 1 mLmin into the PC chamber
through a stainless steel capillary (056 mm od 030 mm id type 304 stainless steel B-
HTX-24 Small parts Inc Miami Lakes FL) that delivers the water to the air stream just
exiting the nozzle The water is aerosolized by the high velocity air creating a fine mist
The mist attaches to the particulate matter in the sampled air
100
A hydrophobic microporous PTFE membrane filter (Fluoropore FHLP 05 pm
pores 47 mm dia Millipore) constitutes the top exh of the PC The filter rests between
the cylindrical PC body and the inverted funnel shaped air suction outlet affixed together
by six 4-40 threaded z long stainless steel screws evenly positioned around the
perimeter To assure an airtight seal around the filter an 0-ring put in an appropriately
machined groove on the top perimeter of the cylindrical section of the PC provides
sealing A mesh machined in a Plexiglas disk provides back support for the filter The
water mist coalesces on the hydrophobic filter surface as large droplets These eventually
fall to the bottom of the particle collector chamber The pressure drop needed to aspirate
liquid water through the highly hydrophobic filter is large As such liquid water is not
aspirated through the filter The system thus behaves as a reflux condenser where the
liquid refluxes from the filter
The bottom of the PC is not flat but slopes to a slightly off-center low point much
like a shower drain such that water runs to this point An aspiration aperture is provided
at this point Two stainless steel rods (0064 mm dia) placed radially across the aperture
serve as a conductivity sensors Using the conductivity probes as a simple logic sensor
the presence of water across the electrodes (high conductivity) causes appropriate
electronics to turn on a dedicated one channel peristaltic pump P2 (FIA 8410 BIFOK
Sweden) to aspirate the liquid for analysis
As shown in Figure 41b in lieu of using a separate cyclone the air inlet of the
PC can be designed similar to a cyclone to provide a particular size cut The gas-denuded
air sample enters the interior cylindrical chamber of the PC through a tangential inlet with
101
the interior cylinder serving as the cyclone The cylinder ends in a 1 mm orifice at the
top of a cone A 360 im od 250 ^m id capillary tube serving as the DI water inlet
comes through the bottom of the PC (affixed at the bottom plate with a compression
fitting) and just protrudes through the nozzle orifice
Tvpical Field Installation
The entire instrument was located inside an air-conditioned trailer The general
layout is shown in Figure 42 The preferred sampling arrangement involved a 6 in PVC
pipe vertically traversing the shelter extending I m above the rooftop with a U-joint on
top to prevent precipitation ingress Underneath the shelter a blower fan BF was
attached to the PVC pipe to aspirate air 100-150 Lmin below turbulent conditions but
with a sufficiently fast flow rate to minimize wall losses If a wet denuder is installed
before the PC it can change the original particle size distribution due to aerosol
hydration For this reason the PC with a built-in cyclone was not used in the field
studies with the PPWD units A stainless steel tube SI (lOO mm id 124 mm od 26
cm long) fashioned into an approximately semicircularU shape breaches the PVC tube
at a convenient height within the shelter such that one end of the steel tube is located at
the precise center of the PVC tube pointing upward in the direction of the incoming
airflow In experiments where total particle composition was measured no cyclone was
used and the stainless steel tube directly terminated in the bottom air inlet of the PPWD
which in turn had the PC connected in top The PPWD was strapped to the PVC conduit
as shown in Figure 43 In experiments using this arrangement the gas composition was
102
also measured and tube SI was lined inside with a tightly fitting PFA tube In other
experiments where PM2 5 composition was measured a Teflon-coated Aluminum
cyclone (URG-2000-30EN University Research Glassware Chapel Hill NC) C was
interposed between the stainless tube inlet and the PPWD (The principal flow stream of
interest through the PP WDPC is 5 Lmin the cyclone is designed for 10 Lmin For
simplicity the Y-joint between C and the PPWD and the auxiliary exhaust system that
aspirates the balance 5 Lmin has not been shown in Figure 43) In this configuration
gas sampling was conducted with a different train altogether using a second denuder
This is because the loss of certain gases notably HNO3 in the cyclone was deemed
inevitable A water trap T and a minicapsule filter MF were placed after the PC This
prevents any water condensation downstream of the PC entering the mass flow controller
(MFC model AFC 2600 Aalborg Orangeburg NY O-IO SLPM) Aspiration is
provided by an air pump (model DOA-P120-FB Gast Manufacturing Corp Benton
Harbor MI) All air ptrnips were typically located below the shelter to reduce noise in
the work environment
Liquid Phase Analytical Svstem
Referring to Figure 43 aside from pump P2 the dedicated liquid aspiration pump
for the particle system liquid was pumped using a variable speed 8-channel peristahic
pump (Dynamax RP-I Rainin PPI-7) at a fixed pump speed of 45 RPM Some of the
operational details of the denuder and chromatographic systems are similar to those
reported by Boring et al^ Pharmedreg pump tubing was used throughout 74-28 threaded
103
PEEK tubing adapters (PF-S VICI) Pump lines 1-2 (129 mm id PN 95709-32 Cole-
Parmer) feed the denuder with liquid one on each side ~1 mLmin In most of our
work we used 05 mM H2O2 This nonionic liquid is compatible with the effluent being
subjected to analysis by IC for determining gas composition Questions have been
raised however about the ability of such a liquid to remove weak acid gases notably
HONO and HO Ac particularly in the presence of large SO2 concentrations^^ However
as shown in Figtire 43 the PPWD effluent in the particle sampling train is simply
discarded whenever separate dedicated denuders are used in the gas and particle
sampling trains Any liquid can therefore be used in the particle system denuder A 005
M phosphate buffer in the pH 6-7 range is applicable as the scrubber liquid and is
particularly effective in removing soluble basicacidic gases ranging from NH3 through
HONO to SO2 to strong acids Pump channels 3-4 (152 mm pump tubing PN 95709-
36 Cole-Parmer to ensure that the input liquid is completely removed) takes the denuder
effluent to waste
For cases where the PPWD effluent is used for gas analysis the considerations
have been outlined in chapter III In essence the liquid flow rate into the denuder must
be large enough under all operating conditions to keep the denuder wet at all times
however any flow in excess of this should be avoided because of the need to pump the
effluent through preconcentration columns and the upper pressure limitation of peristaltic
pumping
Channel PP5 pumps house-deionized water through a mixed bed deionization
column (67 mm id 20 cm long filled with Dowex MR-3) MB into the particle collector
104
at 1 mLmin (1 29 mm tubing) Pump P2 actuated by the conductivity sensor aspirates
the water containing the dissolved aerosol and any undissolved solid and pumps h
through a filter F (02 fxm 25 mm dia membrane filter PN 6809-4022 Whatman) and
through cation preconcentrator columns CC1CC2 (contained in valve VI) and anion
preconcentrator colunms ACIAC2 (contained in V2) in sequence P2 aspiration rate
must be equal to or higher than that of PP5 (1 mLmin) and is typically between 12 - 18
mLmin a significantly larger flow rate is avoided because of backpressure caused by the
preconcentrator columns CCl and CC2 are 5 x 35 mm columns (Dionex) filled with a
11 mixture of Dowex-50Wx8 H -form 200^00 mesh strong acid resin with a diluent
(chloromethylated polystyrene-divinylbenzene Bio-Beads S-Xl 200^00 mesh Bio-
Rad Inc) ACl and AC2 are Dionex anion preconcentrator columns that were originally
custom-made for this instrument but are now commercially available (PN TAC-ULP 5 x
23 mm Dionex Corp) VI and V2 are both 10-port electrically actuated valves
respectively of the low- and high-pressure types (C22Z-3180EH VICI EV750-I02
Rheodyne)
Pump channel PP6 (129 mm id tube 1 mLmin) pumps either water or 10 mM
NaOH as selected by 12-V all-PTFE solenoid valve V3 (161T031 NResearch Caldwell
NJ) through CCICC2 through one side of the membrane device PMD to waste The
final pump channel PP7 (051 mm id 03 mLmin Cole-Parmer 95709-18) pumps
water freshly deionized through mixed bed resin column MB (identical to that before the
PC) through the other side of the membrane device PMD in a countercurrent fashion to a
standalone conductivity detector CD25 a restrictor tubing R (0125 x 60 mm) to waste
105
Except as stated all liquid transfer lines are 20 gauge standard wall PTFE tubing
(086 mm id 20 SW Zeus Industrial products)
Operation and Analysis Protocol
Valve V4 is a 6-port low-pressure manually operated loop injector (C22Z-31EH
VICI) that is used for calibrating the system The injection volume of the loop in this
valve was carefully determined (by filling with a dye solution injection making up the
injected material to volume measuring absorbance and comparing with the absorbance
obtained for the same solution after a known dilution) to be 35 pL An equimolar
mixttire of (NH4)2S04 and NH4NO3 at different concentrations was used to calibrate the
system During this calibration air sampling is shut off When V4 is filled with the
calibrant and switched to the inject position P2 pumps the injected sample downstream
where the ammonium is captured by CCICC2 (CCl is in position in Figure 43 as
drawn) The anions pass through the cation exchanger and are captured by AC1AC2
Placing the cation exchange preconcentrator ahead of the anion preconcentrator is
important because these anion preconcentrators contain agglomerated anion exchange
latex on cation exchange beads and cation exchange sites are still accessible If the
sequence is reversed ammonium will be captured by the anion exchange column
NaN02 and Na2C204 solutions were similarly used to calibrate for nitrite and oxalate
VI V3 PP6-7 PMD CD25 and associated components constitute the ammonia
analysis system In principle a second IC can provide complete soluble cation analysis
in lieu of the arrangement chosen here (although it may be necessary to have respective
106
preconcentrators in parallel rather than series to avoid eluent counterion contamination
between systems) However ammonium is often the dominant cation of interest in
atmospheric fine particles and can be determined in a simpler fashion as in this work
The measurement of ammonitun in a sample by basification and diffusion of the resulting
gaseous ammonia into a receptor stream across a membrane was originally introduced by
Carlson ^ and subsequently used in many arenas including the measurement of aerosol
ammonium The present work differs from extant reports in cation exchanger
preconcentration and elution by a strong base The latter elution technique is uniquely
practiced for a weak base cation and is vital for preventing anion contamination in a
serially connected anion chromatography system
The typical operational sequence involves two 15-min halves of a 30 min cycle
As an example dtiring t = 0-15 min the PC effluent is preconcentrated sequentially on
CCl and ACl At 15 min VI-V3 all switch CC2 and AC2 now take the positions of
CCl and ACl to perform preconcentration 10 mM NaOH pumped by PP6 elutes NH4
from CCl as NH3 which flows through the donor side of porous membrane device PMD
The PMD is made of two Plexiglas blocks each containing a flow channel (600
pm deep 5 mm wide 98 mm long) accessed with 10-32 threaded ports that serve as
liquid inlet and outlet A porous membrane (Metricel polypropylene 01pm pores Pall
Corp PN XE20163) separates the two flow channels a number of screws hold the
blocks together (Note that this membrane is asymmetiic and the transfer extent does
differ on which side of the membrane is made the donor) The difftised ammonia is
received by the DI water flowing countercurrent on the receiver side and is carried to the
107
conductivity detector CD25 Restrictor tubing R prevents any bubbles in the detector
All indicated components as well as connecting tubing are placed inside the
chromatography oven maintained at 29-30 degC V3 switches back to water at t = 23 min to
wash CCl with water such that residual NaOH is removed from it before VI and V2 are
switched back at t = 30 min for CClACl to begin preconcentration again
At t = 15 min as V2 switches chromatography begins on ACl with a 1475 mM
KOH eluent generated by an electrodialytic eluent generator EG40 the chromatographic
unh (Dionex DX 600) consisting of an GS50 pump an AGl 1-HC guard (4 x 50 mm) and
ASl I-HC (4 X 250 mm) separation columns A thermally stabilized conductivity cell
(DS-3) is used in conjimction with a CD25 detector The DS-3 conductivity cell like the
identical cell used for the ammonia system is maintained inside an LC 30 oven Both
conductivity detector signals are acquired on an IBM laptop computer interfaced with the
system through a LAN card (Linksys Etherfast 10100 integrated PC card) via aNetGear
EN308 network hub with Dionex PeakNet 62 software
The cycle repeats every 30 min until deliberately shut off or until a
preprogrammed number of cycles have run System automation and valve control is
achieved via PeakNet software via the TTL and Relay outputs in the chromatographic
hardware
108
Chemicals
All chemicals were analytical reagent grade Nanopure water (Barnstead 18
MQ cm) was used to prepare all standards and eluent H2O2 (30) and NaOH (50)
(NH4)2S04 NaN03 NaN02 and Na2C204 were obtained from standard sources
Particle Generation
Fluorescein-doped particles of different sizes were generated using a vibrating
orifice aerosol generator (VOAG model 3450 TSI Inc St Paul MN) The VOAG
generates nearly monodisperse aerosols The charge on the generated particles were
brought to Boltzmann charge by a Kr-85 discharger and characterized by a laser-based
optical particle counter (model A22I2-0I-115-1 Met-One Grants Pass OR) The
general experimental arrangement and details of VOAG operation have been previously
described^^ The aerosol generator feed solution was (NH4)2S04 doped with fluorescein
all related measurements were made using a spectrofluorometer (model RF 540
Shimadzu) using excitation and emission settings appropriate for fluorescein The
fluorescein content was negligible relative to the (NH4)2S04 except for the smallest size
particles generated in this manner
After inttial design experiments were completed particle size-cutoff
characterization of the final version of the PC of Figure 41b was conducted with
standard polystyrene microspheres (Bangs Laboratories Fisher IN) These spheres
(density 105) were dyed (where the dye was not extractable by water but acetone-
extiactable) by equilibrating a stirred suspension of the polystyrene beads with a
109
Rhodamine-B solution The beads were centriftiged resuspended in water recovered by
filtration through a membrane filter and washed several times with water
To generate aerosols containing these beads a diluted suspension of the dyed
beads were used in the VOAG The 20 pm orifice disk was replaced with a larger orifice
and the liquid filter in the VOAG was removed
Particle Characterization
In a VOAG the eventual equivalent spherical diameter of the dry particle is equal
to the cube root of the feed solution concentration multiplied by the primary droplet
volume and divided by the dry particle density^^ Under otherwise fixed experimental
conditions the particle size can be varied by varying the (NH4)2S04 feed solution
concentration The size of the particles computed from the VOAG operating conditions
was cross checked by the laser-based particle counter data consisting of number counts
of particles in discrete size ranges of 01-02 pm 02-03 pm 03-05pm 05-10pm 10-
30pm and gt30 pm The geometric mean diameter was taken to be equal to the count
median diameter (CMD) The mass median diameter (MMD) and mass median
aerodynamic diameter (MMAD) were then calculated from the geometric standard
deviation of the log normal size distribution of the aerosol the density of anhydrous
(NH4)2S04 (177) and including slip correction The relevant data are reported in Table
41
110
Results and Discussion
PC Cyclone Inlet Design
The horizontal and vertical position of the air inlet relative to the cylindrical
cyclone body as well as its angle of entrance affects the removal efficiency and the
sharpness of the size cut All experiments were conducted at a flow rate of 6 standard
liters per minute Predictably the sharpness of the size cut and the coarse particle
removal efficiency were better with a tangential entry than straight entry of the sampled
air all further work was carried out with the tangential entry design
With the cylindrical portion of the cyclone having a height of-35 mm and an
inner bore of 185 mm the tangential inlet of 4 mm bore was placed at a height of 4 18
and 31 mm from the bottom (bottom middle and top positions) Placing the entry at the
top of the cyclone body allows more room for cyclone action and the 50 cut point
observed changed from 78 to 61 to 49 pm from the bottom to the middle to the top
position An increase in the sharpness of the cut-off behavior was also observed in
moving the entry to the top To obtain a 50 size cutpoint (D50) in the desired 20 to 25
pm range further changes were however clearly needed
Reducing the inner diameter of the cyclone cylinder and reducing the air entry
ttibe diameter are both effective in reducing Dso- The chosen values for these two
parameters in the final design were 12 and 25 mm respectively The penefration of size
standard polystyrene particles in this device is shown in Figure 44 At 6 Lmin D50 for
this device was 215 The sharpness of the cyclone defined as (D^efD^f^ where D16
111
and D84 are the aerodynamic diameter of the particles at 16 percent and 84 percent
penetration efficiency respectively^^ is estimated from Figure 44 to be 160
The PC with a size cut inlet eliminates the need for a separate device to provide
the desired cut This is attractive in systems where particles are of primary interest and
dry denuders can be used to remove potentially interfering gases
Particle Losses in the Inlet Svstem
With a wet denuder and the PC of Figure 41a following h minimal particle
losses prior to the PC are desired Losses for fluorescein-doped (NH4)2S04 aerosol
within the nozzle inlet of the PC alone (without the PPWD ahead of it) was found to be
021 096 129 162 262 and 525 for particles of MMAD values 021 055 099
26 48 and 78 pm respectively (mean of two experiments) The PC hself thus exhibits
very little loss of particles up to 25 pm size This and the following experiment were
conducted at a flow rate of 5 SLPM this was also the sampling rate used in all field
experiments With the PPWD ahead of the PC the particle size specification pertains
merely to that entering the PPWD the aerosol size doubtless grows upon passage through
the PPWD Indeed as Table 42 shows substantially higher losses were observed when
the aerosol was first passed through the PPWD(two separate experimental runs were
made) At 25 pm 11-12 total loss was observed the large bulk of the loss occurring in
the PC nozzle The nozzle was redesigned using a much more gradual 75deg taper instead
of the original 45deg taper and the nozzle diameter was increased from 0397 mm to 0500
mm The loss in the PC nozzle decreased to 36+02 with a total loss in the system in
112
the 5-6 range The growth of less hygroscopic particles will be less and total losses are
likely to be lower than that observed with the (NH4)2S04 test aerosol
Testing for breakthrough of a fluorescein-doped (NH4)2S04 aerosol in the size
ranges stated through the PC was accomplished by putting a quartz fiber filter after the
PC at sampling rates up to 6 SLPM In the worst case lt05 of the total fluorescein was
present in the backup filter extract The PC would thus appear to be a neariy quantitative
collector
Response Time and Carryover
The PC operates under continuous air and liquid flow The liquid sample
coalescing on the inner walls of the PC or the filter is continuously collected and sent on
for analysis At a liquid input rate of 1 mLmin each sampling cycle involves 15 mL of
the liquid sample in and out of the PC To evaluate the response time generated
fluorescein particles were sampled and the liquid sample was directly sent into a
fluorescence detector for continuous detection The system was allowed to sample clean
air for 7 min then the fluorescein aerosol sample was sampled for 15 min followed by
clean air again The fluorescence signal rose to half the plateau value in 3 min and the
10-90 rise time was 55 min The 90-10 fall time was slightiy longer at 68 min
Both were adequate for a 15 min sampling cycle
113
Performance and Detection Limits
Using electrodialytic generation and suppression of the eluent current state of the
art in IC technology the LOD (SN = 3) for chloride nitrite nitrate sulfate and oxalate
were each lt OI ngm^ for a 75-L total sample volume (15 min at 5 Lmin) This is
adequate to make measurements of not just polluted urban air but of a pristine
background environment Ammonium is measured as ammonium hydroxide the latter is
a weak base and a quadratic (or higher polynomial) based calibration equation must be
used for quantitation The SN =3 LOD for ammonium in our system was 8 ngm^
Typical instrument outputs are shovm in Figure 45 for (a) ammonium and (b)
anions in particulate matter using data from Tampa FL Note that very low levels of
particulate nitrite are being measured even though it is a relatively high NOx
envirorunent While some of the nitrite being measured may still be an artifact from the
reaction between water and NOx (not removed by the PPWD) the level of artifact nitrite
produced from a comparable instrument using steam is significantly higher
System Maintenance
For continuous prolonged operation periodic attention to the following items is
necessary Adsorption of organics causes the filter eventually to lose its hydrophobic
character causing water leakage through the pores Insoluble particles slowly block the
filter pores increasing the pressure drop to an unacceptable level In urban sampling the
first generally precedes the latter requiring replacement in 2-3 weeks While the system
has been operated as long as 5 weeks without problems the current practice is to replace
114
the filters as a routine procedure every two weeks Replacement requires less than 5 min
and the data from the next two cycles are discarded because of potential contamination
Peristaltic pump tubes are replaced after three weeks of continuous operation
The anion preconcentrator column (5x 23 mm) provides for low pressure and cannot be
replaced witii the more common 4 x 35 mm type this results in more frequent pump tube
replacements and can cause other problems due to higher pressure drop The membrane
filter after the PC (F Figure 3) is replaced every 4 weeks Despite the presence of F the
inlet frh of columns CCICC2 can get clogged with very fine insoluble PM that passes
through F generating backpressure These are inspected for soiling every two weeks and
replaced as needed
Illustrative Field Data
The system has been deployed in a number of field studies Although comparison
between conventional integrated filter measurement techniques and high time resolution
meastirements such as that provided by the present instrument have the intrinsic flaw that
the high temporal resolution data will have to be averaged back over a much longer
period one is always interested in these comparisons with established methods In that
vein Figure 46 shows a comparison of integrated sulfate concentrations (3- 6- or 9-h
samples) measured independently by Brigham Young University researchers by their PC-
BOSS system^^ with data from the present instrument during a study in Lindon UT in
the summer of 2002 Considering that the sulfate data are all lt2 pgm^ and the problems
115
of getting good filter based measurements at low levels the observed agreement is very
good
Figure 47 shows two-week segments of data for nitrate and sulfate collected in
Tampa FL and Philadelphia PA In Philadelphia sulfate levels are generally much
higher than the nitrate levels It will be further noted that the experimental site is
probably impacted by at least two sources one in which the sulfate and nitrate peaks are
coincident in time and another in which they are not correlated In both Tampa and
Philadelphia the levels are predictably much lower during the weekend In Tampa
nitrate levels are substantially higher than in Philadelphia and peaks in nitrate and sulfate
are much better correlated
Gas concentrations were also measured in most of the field studies In Tampa the
average HCI concentration (071 ppb) was found to be nearly twice that measured in
Houston TX and four times that measured in Philadelphia Both Houston and Tampa
have elevated particulate chloride concentrations relative to more inland sites like
Philadelphia or Lindon UT In Tampa the pattern of HCI and particulate nitrate
concentrations (Figure 48) strongly suggests that at least in part HCI formation is related
to nitrate formation The particle collector data shovm in this case was from an
instrument without any cyclone inlets (The nitrate levels were very much lower when a
25 pm cut point cyclone was put in the line suggesting that nitiate was in a coarse
particle fraction) These observations can be reconciled if at least in part the genesis of
particulate NO3 involves the reaction of NO2 or HNO3 on moist sea-salt
116
The acidity of the particles in particular the ammonium to sulfate ratio on an
equivalents basis is often of interest Figure 49 shows the sulfate and ammonium
concentrations for a two-week-segment of the Tampa measurements The
sulfateammonium ratio in equivalents is almost always greater than unity (corresponding
to (NH4)2S04) and frequently greater than 2 (more acidic than NH4HSO4) The latter
events are mainly associated with day time Note that the relative high acidity events are
short-lived and will not be detected by integrated measurements In Tampa ammonium
and sulfate are all in the fine particle phase where as nitrate is predominantly found in a
size greater than 25 pm Thus no major errors are made in assessing relative acidity
when looking at the ammonium to sulfate ratio rather than ammonium to total anions It
is also interesting to note that dtuing the May 11-12 weekend except for a few hours on
Sunday morning (perhaps due to religious reasons) the ratio persists at tmity
characteristic of an aged aerosol In this context it is also worthwhile noting that we
have encotmtered situations in other campaigns where the aerosol is distinctiy alkaline
ie the total measured ammonium equivalents exceeds the total measured anion
equivalents In agriculturally intensive areas there are significant concentrations office
ammonia measured in the gas phase At high humidity the aerosol has significant
amounts of liquid water and ammonia is taken up therein The present systems (or
comparable steam-based collection systems) see this excess ammonia but in integrated
filter samples most of this excess ammonia evaporates
117
References
1 Pope C A Thun M J Namboodiri M M Dockery D W Evans J S Speizer FE Heatii C W Am J Resp Crit Care 1995 151 669 - 674
2 Schwartz J Environ Res 1994 64 68 -85
3 Schlesinger RB Inhal Toxicol 1995 7 99 - 110
4 Wang H Shooter D Atmos Environ 2002 36 3519 - 3529
5 Kitto A M N Harrison R M Atmos Environ 1992 26A 235 - 241
6 Air quality criteria for particulate matter National Center for Environmental Assessment Office of Research and Development US EPA Research Triangle Park NC EPA600-AP-95-I00IA 1996
7 Suess D T Prather K A Chem Rev 1999 99 3007 - 3035
8 Johnston M V J Mass Spectrom 2000 35 585 - 595
9 Noble C A Prather K A Mass Spectrom Rev 2000 19 248 - 274
10 Maynard A D Philos Trans Roy Soc A 2000 358 2593 - 2609
11 Blatter A Neftel A Dasgupta P K Simon P K in Angletti and G Restelli (Eds) Physico-Chemical Behavior of Atmospheric Pollutants Proc6 European Symposium Report EURI56092 EN Luxembourg 1994 pp 161-111
12 Simon P K Dasgupta P K Anal Chem 1995 67 71 -78
13 Simon P K Dasgupta P K Environ Sci Technol 1995 29 1534 - 1541
14 Khlystov A Wyers G P Slanina J Atmos Environ 1995 29 2229 - 2234
15 Slanina J ten Brink H M Otjes R P Even A Jongejan P Khlystov A Waijers-Ypellan A Hu M Lu Y Atmos Environ 2001 35 2319 - 2330
16 Kalberer M Ammann M Gaggeler H W Baltensperger U Atmos Environ 1999332815-2822
17 Loflund M Kasper-Giebl A Tscherwenka W Schmid M GeibI H Hitzenberger R Reischl G Puxbaum H Atmos Environ 2001 35 2861 - 2869
118
18 Weber R J Orsini D Daun Y Lee Y N Klotz P J Brechtel F Aerosol Sci Technol 2001 35 718-727
19 Orsini D A Ma Y Sullivan A Sierau B BaumannK Weber R J Atmos Environ 2003 37 1243-1259
20 Okuyama K Kousaka Y Motouchi T Aerosol Sci Technol 1984 3 353 -366
21 Dasgupta P K Poruthoor S K Pawliszyn J Ed Wilson and Wilsons Comprehensive Analytical Chemistry Series Vol XXXVII Elsevier 2002 161-276
22 Buhr S M Buhr M P Fehsenfeld F C Holloway J S Karst U Norton R B Parrish D P Sievers R E Atmos Environ 1995 26 2609-2624
23 Samanta G Boring C B Dasgupta P K Anal Chem 2001 73 2034-2040
24 Boring C B AI-Horr R Genfa Z Dasgupta P K M W Martin and W F Smith Anal Chem 2002 74 1256-1268
25 Stolzenburg M R Hering S V Environ Sci Technol 2000 34 907 - 914
26 S Hering MR Stolzenburg Integrated collection and vaporization particle chemistry monitoring US Patent 5983732 November 1999
27 httpvywwrpcocomproductsambprodbrochuresbrochtue8400n pagespdf httpwwwrpcocomproductsambprodbrochuresbrochure8400s pagespdf
28 Allen G A Koutrakis P Ding Y US Patent 6503758 January 7 2003
29 Allen G A Personal Communication April 2003
30 Cofer W R Collins V G Talbot R W Environ Sci Technol 1985 19 557
31 CoferW R Edahl R A Environ ScL Technol 1986 20 979
32 JanakL Vecera Z Anal Chem 1987 59 1494 - 1498
33 Zellweger C Ammann M Hofer P Baltensperger U Atmos Environ 1999 33 II3I-II40
34 Carlson R MAnal Cheml9n 50 1528-1531
35 Carlson R M US Patent 4206299 June 24 1980
119
36 Hinds W C Aerosol Technology New York Wiley 1982 p 381
37 Kenny L C Gussman R Meyer M Aerosol Sci Technol 2000 32 338 - 358
38 Eatough DJ Obeidi F Pang Y Ding Y Eatough NL Wilson WE Atmos Environ 1999 33 2835-2844
120
Table 41 Cotmt median diameter mass median diameter and mass median aerodynamic diameter of particle generated by VOAG with different feed (NH4)2S04 solution doped with fluorescein
(NH4)2S04 + Fluorescein
lX10mM+500ngL
01mM + 500|igL
10mM+500ngL
40 mM +800 ^gL
80 mM+1000 ngL
Count Median Diameter CMD nm
020
093
199
316
398
Mass Median Diameter MMD nm
0411
0869
2695
4168
5241
Mass Median Aerodynamic Diameter MMAD ^m
0547
1155
3584
5544
6969
121
Table 42 Loss of aerosols in the PPWD and the air-inlet nozzle of the PC^
Loss Mass Median Aerodynamic Diameter (pm)
MMAD pm 021 055 099 255 479 778
Dry Denuder Inlet and Outlet
Wet Denuder Plates
PC Nozzle Inlet
^Two separate experimental runs are shovm
09 14
0 0
05 0
12 26
126 205
11 32
026 06
152 08
436 501
104 11
229 217
885 782
21 43
37 475
975 969
26 14
909 946
991 1005
122
Air Suction
025 in
Water Out
Air Suction
Air Inlet
Air Inlet Water Inlet Water Inlet
(b)
Figure 41 Particle collector with (a) straight Air Inlet (b) with cyclone-like size cut Inlet
123
PVC Ambient Air In
C 0 M F SI
Ambient Air In
Trailer Roof
MFC
Trailer Floor
Ambient Air Out
Figure 42 Field sampling and airflow schematic PC particle collector PPWD parallel plate wet denuder C cyclone SI stainless steel ttibe inlet PVC 6 PVC pipe 1 water trap MF minicapsule filter MFC mass flow controller P air sampling pump BF blower fan
124
I ]
p
H2C
P5 -^M^-^^-D^ PC w
Figure 43 Total particle collectionanalysis system air and liquid flow schematic C cyclone PPWD parallel plate wet denuder PC particle collector T liquid trap MF minicapsule filter MFC mass flow controller P air pump PPl-7 peristaltic pump lines P2 one channel peristaltic pump MB mixed bed resin deionizer F filter CCl and CC2 cation preconcentration columns ACl and AC2 anion preconcenfrator columns GS50 chromatography pump EG40 eluent generator SRS self regenerating suppressor GC guard column SC separation column VI low presstire 10 port injection valve V2 high pressure 10 port injection valve V3 3way solenoid valve V4 6 port injection valve S Injection Syringe PMD porous membrane device CD25 conductivity detector R restrictor W waste
125
100mdash1
80 mdash
o c 2 60 o It HI c I 40 0)
0)
20 mdash
n ^ 1 r 2 4 6
Aerodynamic diameter jum 8
Figure 44 Penetration curve of standard size polystyrene beads in the particle collector with a cyclone-style inlet
126
E u (A C
1 8
3 bullo C
8
080
060 -
040
020
000
Ammonium Preconcentrator 1 089 Mgm3
Tampa FL BRACE Study May 6 2002 115 PM
Ammonium Preconcentrator 2 092 Mgm3
E u () c
I I 1 c
3 D C
6
-020
800
600
400
200
000
000 1000 2000 Time min
100 to 115 PM 5 6 0 2 Tampa FL
(VJ
R d
a
iT ( I
5
-200
E
o I o
I
o SI
Y u
a
Preconcentrator 1 Cycle A
3
(S d bullo
SI
3000
1 0)
d
1
(vi I bullS 2
Q I
1
s 3 tn
u
1 a
d S (0
Preconcentrator 2 Cycle B
000 1000 2000 Time min
3000
Figure 45 Representative system output (a) ammonium response (b) anion chromatogram over two cycles Tampa FL
127
3 mdashI
CO
E o) IS
o
3 (0 (fi (A O
QQ I
O Q
2 mdash
1 -
11 Correspondence Line^
9-h sample D D D 6-h sample O O O 3-h sample
1 r 1 2
Present Instrument Sulfate |agm^
Figure 46 Integrated sulfate measurements versus sulfate measured by the present instrument The line shown is the 11 correspondence line not the best-fit line
128
Sulfate
bull Nitrate 30 -
CO
1 20 -
10 -
7a01 71001 71201 71401 71601 71801 72001 72201 72401 72601 Date
20 - I
16 -
12 -
bull Sulfate
^ Nitrate
oi
5202 5402 5602 5802 51002 51202 51402 51602 51802 52002 Date
Figure 4 7 Sulfate and nitrate concentrations in (a) Philadelphia PA July 2001 and (b)Tampa FL May 2002 The enclosed areas are the mghttime hours (stmset to sunrise)
129
6 - 1
4 mdash C 2
bullS
2 lt-gt c agt u c o o 2 -
HCI ppbv
NOj ngm
T I I I I I I I I I I
43002 5202 5402 5602 5802 51002 51202 51402 51602 51802 52002 Date
Figure 48 HCI and particulate nitrate patterns in Tampa FL May 1 2002-May 18 2002
130
(aeqm^ sulfate
neqm^ ammonium
sulfateammonium ratio r- 03
mdash 02
E agt
01
- 0
5402 5602 5802 51002 51202 51402 51602 51802 Date
Figure 49 SulfateAmmonium equivalent ratio with sulfate and ammonium equivalent concentration patterns Tampa FL
131
CHAPTER V
SEMI-CONTINUOUS MEASUREMENT OF
MAJOR SOLUBLE GASEOUS AND PARTICULATE
CONSTITUENTS IN SEVERAL MAJOR US CITIES
Introduction
Exposure to high levels of fine particles is believed to be responsible for tens of
thousands of deaths each year in the US Fine particles have been associated with
hospital admissions from cardiopulmonary diseases and mortality^ While fine particles
come fi-om myriad sources and contain hundreds of inorganic and thousands of organic
components fossil fiiel combustion is typically the single most important source
Secondary aerosols are formed via atmospheric reactions In terms of mass fine particles
are composed of primarily sulfate nitrate and ammonium ions organics and mineral dust
make up most of the rest The complex interaction of gases namely that of sulfur
dioxide nitrogen oxides nitric acid nitrous acid and ammonia with each other wdth
other oxidants and with photochemically generated intermediates underlies the genesis of
ionic inorganic constituents in Particulate Matter (PM) Formation and transport are both
subject to meteorological variables
Sulftir dioxide is predominantly oxidized through homogeneous oxidation by OH
radical^ and heterogeneous oxidation by H2O2 and O3 ^ to form sulfate as an end product
The hydroxyl radical is the only significant gas phase oxidant It reacts with SO2 to form
an adduct free radical (HOSO2) which reacts with O2 to form SO3 Sulftir trioxide then
132
reacts readily v^th water forming sulfuric acid Aqueous phase oxidation proceeds by
dissolution of SO2 in water followed by oxidation with H2O2 The overall reaction rate
depends on relative humidity sunlight intensity and concentrations of oxidants Sulfate
generated as H2SO4 reacts with gaseous ammonia to form ammonium sulfate and
ammonium bisulfate^ These secondary sulfate aerosols exist almost exclusively in the
fine aerosol fraction (lt 25 pm) and are also associated with reduced visibility problems
due to their hygroscopic nature^
Nitric acid HNO3 is formed primarily through the homogeneous reaction of NO2
with OH radical hydrogen abstraction by NO3 from aldehydes or reactive hydrocarbons
or hydrolysis of N2O5 The NO2-OH radical reaction is the major source of HNO3 this
takes place during daytime whereas hydrolysis of N2O5 is the dominant nighttime
source Gaseous HNO3 reacts with gaseous NH3 to form solid NH4NO3 in an
equilibrium however the precise value of the equilibrium constant is greatly affected by
temperature and relative humidity^ bull While sulfate and ammonium exist mainly in the
fine mode nitrate exhibits a bimodal size distribution The nitrate size distribution
depends on location and meteorology In coastal areas coarse nitrate is typically present
as NaNOs formed by the reaction of HNO3 and NOx with NaCl sea salt aerosol This
also resuhs in significant amoimts of gaseous HCI
Nitrous acid is formed by the heterogeneous reaction of gaseous NO2 with water
adsorbed on surfaces ^ ^ this reaction may also be mediated by black carbon In
daylight HONO photolyzes to NO and the OH radical^ Nitrite in the aerosol phase can
be oxidized to nitrate by oxidants^deg including the hydroxyl radical
133
Several measurements of soluble ionogenic gases and their corresponding aerosol
phase components have been conducted in order to establish a comprehensive database to
enhance the understanding of tropospheric chemistry and gas-particle chemical and
physical interactions^ in different environments ^ High temporal resolution gas
composition measurement and meteorological data acquisition has long been possible
aerosol composition meastirement with good time resolution has been difficult
Simultaneous coordinated particle and gas composition and meteorological data with
good time resolution can provide an altogether different dimension of understanding of
atmospheric processes
In this chapter data collected in field measurement campaigns latmched at or in
the vicinity of fotu- major urban US cities and one suburban area are presented All of the
measurements were conducted in the summertime This chapter focuses on data
collected during TexAQS 2000 (Texas Air Quality Study Houston TX) NEOPS 2001
(North East Oxidant and Particle Study Philadelphia PA) BRACE 2002 Study (Bay
Region Atmospheric Chemistry Experiment Tampa FL) and a measurement campaign
in Lindon UT a suburban location in 2002 The focus is on incidents that highlight the
importance of continuous analysis in better understanding gas-particle partitioning
heterogeneous chemistry of PM formation relations between PM growth and the
precursor gases An overview of the observed chemistry at the different sites is also
presented
134
Sampling Sites
The Texas Air Oualitv Study (TEXAOS 20001
The Texas Air Quality study ^^ took place during July and August 2000 Houston
has been cited as having numerous air quality problems it is presently in violation of
some of the national ambient air quality standards ^ The study was conducted to better
plan for how the Houston-Galveston regional area and the state can better meet the air
quality objectives The 2000 population of greater Houston (Houston -Galveston-
Brazoria) was 47 million ranking lO in the US The combination of heavy emissions
with the coastal weather patterns adds to the complexity of Houstons air quality
problems Southeast Texas has the largest petrochemical manufacturing industry in the
US It is estimated that around 25 million people in Houston area are exposed to PM
concentrations that exceed 15 pgm^ (annual average)^^ Many different groups
participated in TexAQS 2000 Experimenters were distributed among a significant
ntimber of experimental sites The data discussed here was obtained at Houston Regional
Monitoring Site 3 (HRM3 EPA site number 48-201-0803) located dovrawind from the
heavy industrial area of the Houston ship channel The site itself is located next to a
petrochemical and a chemical manufacturing complex where contributions from primary
emissions can be occasionally significant The land-sea and land-bay breezes are
Oft
responsible for diurnal flow reversal and alternating periods of clean and polluted air
As in most other southern cities the most severe pollution episodes occur during the
summer when generation of secondary PM peaks
135
The Philadelphia Study
The study she in Philadelphia PA was one among a network of sites in the North
East Ozone and Particle Study NEOPS^^ The study was conducted thorough the month
of July 2001 The site was located 13 km northeast the city center of Philadelphia at the
Baxter Water Treatment Facility on the banks of the Delaware River Philadelphia lies
along the northeast corridor between New York and Baltimore (-120 km Southwest of
New York-180 km Northeast of Baltimore) yet more inland (- 200 km offshore) than
both land-sea breeze patterns here has much less effect than Houston Philadelphia-
WilmingtonmdashAtlantic City metropolitan area has a 2000 population of 62 million
ranking 6 in the US
The BRACE sftidv
BRACE^^ was held in Tampa Florida in April and May 2002 There were a
ntimber of experimental sites the principal site where our instilment was located was
located in Hillsborough County near the Valrico Waste Water Treatment Plant (Valrico
WWTP Valrico FL) 20 km West of Tampa city center and 16 km northeast of the bay
The site was in an open agricultiiral area along the predominant northeasterly wind
trajectory h is subject to local traffic emissions and occasionally to plumes from tiie
Tampa Electric Company coal-fired power plants (Gannon and Big Bend plants) The
Tampa-St Petersburg-Clearwater metropolitan area has a 2000 population of 24 million
136
The Lindon Study
In Lindon UT the sampling site was located at the Lindon Elementary School
where a State of Utah air quality sampling site is also located Lindon is 13 km west
nortitwest of Provo UT and 53 km south southeast of Salt Lake City UT The Provo-
Orem area has a 2000 metropolitan population of 037 million (rank no I l l ) and the Salt
Lake City - Ogden area has a 2000 metropolitan population of 13 million (rank no 35)
The sampling site is expected to be impacted predominately by emissions from mobile
sotirces There were no significant point sources that were expected to impact the site
during the study dates in August 2002
Experimental
Table 51 shows the different sampling locations associated sampling periods
measured species and the techniques by which they were measured All the listed gases
(HCI HONO HNO3 SO2 H2C2O4 and NH3) were collected using a high efficiency
parallel plate difftision denuder with 05 mM H2O2 as denuder liquid described in chapter
III Air sampling rate was 5 standard Lmin (SLPM) throughout The denuder liquid
effluent is preconcentrated on sequential cation and anion preconcentrators Using a 10
or 15 min cycle time the collected ions were eluted and analyzed Ammonium captured
by the cation preconcentrator is eluted with NaOH and is passed across an asymmetric
porous membrane device which allows the ammonia from the alkaline donor stream to
difftise into a deionized water receiver stieam flowing countercurrently The
conductivity of the receiver effluent was measured and provides a measure of the
137
collected ammonium The anions were measured by a ftilly automated ion
chromatography system
With tiie exception of the measurements made at Tampa the gas and aerosol
sampling trains were separate In principle it is possible to take the wet denuder effluent
and send it to one analysis system for the measurement of the collected gases and send
tiie effluent from tiie particle collector following it This is precisely the configuration
tiiat was used in Tampa where prior available evidence indicated that nitrate may have
significant presence in a coarse size fraction and no size cut inlet was implemented
Implementing a size cut eg to measure PM25 is difficult in a single train where both
gases and particles are to be measured Implementing a device like a cyclone upstream of
the denuder can lead to large losses of reactive gases especially HN03^^ On the other
hand incorporating the cyclone after the wet denuder does not impose a size cut on the
aerosol that is relevant to the original aerosol population as the aerosol grows
significantly in size dtiring passage through the wet denuder As such two independent
trains (PPWD for gas Cyclone-PPWD-Particle collector for PM25) were used whenever
both gas and PM25 compositions were of interest
For the particle collector in Houston the automated alternating filter-based
system^^ described in Chapter III was used This system uses two glass-fiber filters that
alternate between sampling and washing and drying The frequent washing and drying
does however cause leaching of fibers from these filters that can lead to fouling of
downstream components and thus requires significant maintenance In all subsequent
studies a more robust and compact mist reflux system^^ that is described in Chapter IV
138
was used Briefly the denuder effluent airflow enters a compact Plexiglas chamber
through an inlet nozzle DI water is delivered through a capillary into the center of the
airflow The generated water mist attaches to the aerosol which impacts on a
hydrophobic PTFE membrane filter that constitutes the top of the PC and the airflow exit
Water drops coalesce on the filter and fall into a cavity equipped with a liquid sensor
The solution containing the dissolved constituents is aspirated by a pump and pumped
onto serial cation and anion preconcentrator columns With a 15 min analytical cycle and
a sampling rate of 5 Lmin the limit of detection (LOD) for ammonium is 8 ngm^ and
for sulfate nifrate and oxalate is OI ngm^
Results and Discussions
Overview
The average concentrations of PM components and gases are shown plotted in
Figures 51 and Figure 52 The minimum (usually zero) and maximtim excursions are
numerically shown on each bar The median rather than average particulate Cl values in
Houston is shown because even after washing filter blanks in newly put in filters may
contribute significantly to the measured chloride content and maximum chloride content
information may also not be meaningful
Not surprisingly sulfate nitiate and ammonium constitute the majority of the
soluble inorganic mass of the PM The sum of the average concentiations of all soluble
anions in PM was the highest in Houston followed by Philadelphia and Tampa
Conversely total soluble anions was the lowest in Lindon this follows closely tiie extent
139
of urbanization The fraction of sulfate that constitutes the total measured anions (on an
equivalents basis) was the lower in Houston (036) than at the other sites Particulate
chloride content was by far tiie highest in Houston (median 38 pgm^) followed by
Tampa which averaged about a third of that in Houston and all other chloride
concentrations were lower still by factors of 2-4 On the average the aerosol was most
acidic in Tampa and Lindon in Houston and Philadelphia the measured ammonium
equivalents exceeded tiie measured anion equivalents The Houston aerosol contained
the largest amotmt of NRt compared to any other sites
Some caveats may be in order regarding the data in Houston There were other
adjacent industrial sources on other sides It is possible that because of the very close
proximity of the sampling location to industrial sources the resuhs for some of the
species are not representative of the typical regional air quality However at the same
time it is also true that many other parameters measured at this location have been
indicative of highly polluted air in the region For example concentrations of HCHO a
secondary product formed through photochemical reactions exceeded 25 ppbv on
numerous afternoons and the maximum measured concentration exceeded 47 ppbv 2-3
times the maximtim concentration measured in urban Los Angeles in the late 80s
Particulate Chloride and HCI Concentrations
The high chloride concentration in Houston substantially higher than that
observed in Tampa is all the more remarkable because not only is Houston a more inland
location PM25 measurements were made in Houston and TSP measurements were made
140
in Tampa (actual sampling inlet geometiy probably resulted in a size cut of-20 pm)
The size cut in the particulate sampling protocol imposed in Houston would have
excluded tiie majority of the sea-salt aerosol that typically will be at a larger size fraction
tiian PM25 especially at relative humidity typical of summertime Houston Despite the
particulate chloride concentration being much higher in Houston than in Tampa the
gaseous HCI concentrations were significantly higher in Tampa than in Houston At both
sites there is no correlation between particulate chloride and HCI (r values were both
well below 001) This is to be expected because even if the genesis of HCI is connected
to particulate chloride eg by reactions with NO2 HNO3 or H2SO4 it is the availability
of these reactants rather than the availability of particulate chloride that is likely to be the
limiting factor
The close correspondence of Na with Cl as a fimction of particle size in the
Tampa aerosol ^ leaves little doubt about the sea-salt origin of the chloride in this sample
Sodium was not directly meastu-ed in the Houston aerosol However the cation-anion
equivalent balance in this case does not indicate that an amotmt of Na corresponding to
the large amount of chloride fotmd is likely Rather h appears likely that local sources in
the immediate neighborhood of the sampling site are responsible h is knovm tiiat one of
the nearby plants is among the largest emission sources of chlorine-containing-
compounds in the region and another deals with polyvinyl chloride Some appreciation
of the potential impact of local sources impacting the HRM-3 site can be gleaned from
the photograph of the site in Figure 53 While industrial operations on the back of the
141
site are visible not visible are indusfrial operations to the left of the photograph and on
the back of the camera location
Sulfur Dioxide and Sulfate
The rate of conversion of SO2 to S04^ is a function of multiple factors most
importantly the concentration of oxidants sunlight intensity and relative humidity The
relative ratio of sulfate aerosol to SO2 in a pitune is indicative of the age of the plume
Air masses that impact a sampling site come from different sources have had different
processing histories and are of different age For most of the data in the present chapter
meteorological data are available It is in principle possible to calculate back trajectories
of the air masses and discuss each significant case individually This is however beyond
the scope of the present chapter Nevertheless any significant degree of correlation
between SO2 and sulfate shows the genesis relationship between the species this
correlation will increase as the air mass arrives with a mean transport time close to the
mean half-life for the conversion of SO2 to sulfate A positive correlation (p) between the
gas and particle phase exists in all sites (pTampa= 021 pHouston = 028 pphiiadeiphia = 046)
Tampa has distinct episodes where the air mass originates from the open ocean or
elsewhere eg from further south in the State Philadelphia had tiie highest average mass
of sulfate among the four cities The average sulfate concentration in Philadelphia is 157
and 139 times that in Houston and Tampa respectively This is not directiy associated
with the precursor SO2 levels measured in these locations In fact the SO2 level is
slightly higher in Houston and only intermediate in Philadelphia This lack of direct
142
association between SO2 and S04^ levels in different locations in addition to the their
significant correlation tiiat exists in Philadelphia may be due to the location of
Philadelphia in tiie Nortiieast corridor and being subject to a photochemically more
developed air mass
Figures 54 55 and 56 show a representative one-week plot of SO2 and S04^
concentiations in each tirban location It can be clearly seen from the figures that the best
correlation between SO2 and S04^ exists in Philadelphia Figure 54 shows a clear
diurnal pattern for both SO2 and S04^ in Philadelphia with the daily sulfate maxima
lagging that of sulfur dioxide SO2 levels start increasing between 600 and 800 am
reaching their maximum levels at around 930 am while sulfate levels reach maximtim at
around 300 pm The observed sharp increase and decrease in SO2 concentration seems
associated with the rush in traffic expected each morning In accordance with either gas
phase or aqueous phase SO2 oxidation by OH radical or H2O2 respectively smoother and
more gradual increase and decrease is observed for sulfate levels than for SO2 Gaseous
SO2 supplied to the atmosphere is removed principally by three processes direct
scavenging in precipitation oxidation to aerosol sulfate with subsequent deposition by
vertical and horizontal precipitation and dry deposition The rates of these removal
processes which vary with environmental conditions along with the transport velocity
must be known in order to understand the fate of SO2 In a typical summer day tiie
-5
estimated lifetime for SO2 in the atmosphere is about 15 days
In Houston however the maximum SO2 concentration occurs at night while the
sulfate maximum precedes it by few hours (Figure 55) This seems in accordance with
143
tiie argument presented before that the site is located in an industrial area with heavy
local nighttime SO2 emissions from nearby sources (flaring in petrochemical industries is
notoriously carried out late at night and nocturnal inversion may also help trap the
plvune) In Tampa sulfate and SO2 exhibit patterns with muhiple spikes observed during
the day (Figtire 56) The site is predominantly affected by local traffic however
occasionally plumes from coal power plants passed directly over the site and were
detected by the instrument as can be observed by the fact that the maximum measured
concentiation of SO2 SO4 and HNO3 were measured in Tampa (Figure 52 and Figure
51) The pattern of sulfate in Lindon is similar to that of sulfate in Philadelphia (Figure
57) Despite the much lower concentration a relatively clear diurnal pattern is observed
Nitious Acid Nitrite Nitiic Acid and Nitrate
Table 52 shows the day and night correlation values among N03 N02 HONO
and HNO3 The mean NO2 and HONO concentrations are higher tiian the respective
mean NO3 and HNO3 concentrations in Philadelphia The ratio of the average N02 to
NO3 concentrations and HONO to HNO3 concentrations are 127 and 132 respectively
This close ratio in the particle and gas phase associated with the relatively high
concentiations of both HONO and N02 is not observed in the other tiiree locations Also
a far more significant positive correlation exits between N03 and HONO in Philadelphia
than in Houston or Tampa Due to the expected nighttime abundance and rapid daytime
photolysis of HONO such a correlation with HONO suggests tiiat the concentration of
nitiate is higher during nighttime than daytime Indeed the ratio nightday concentration
144
of nitiate in Philadelphia is 257 while that of nitric acid is 033 At nighttime the
formation of NO3 has been reported to occur due to hydrolysis of gaseous N2O5 on wet
surfaces and aerosol particles to form aqueous HNO3 ^ N2O5 is formed at night by the
reaction of nitiate radical NO3 with NO2 In turn NO3 radical is formed by the
oxidation of NO2 with ozone Thus the formation of nitrate aerosols in Philadelphia is
dominated by nighttime formation^ While in Tampa Houston and Lindon the nitrate
seems to be dominantly formed dtiring daylight via OH radical
Figure 58 and Figure 59 show the pattern for gaseous HONO and HNO3 and
particulate NO3 and NO2 in Philadelphia respectively Nitrate does exhibit a nocttimal
maximum associated with that of HONO in Philadelphia This can be seen very clearly
dtiring the night of July 1617 when the concentrations are higher than those of previous
days Furthermore the diurnal variation of both gases and particles are well resolved but
unlike NO3 NO2 and HONO HNO3 shows a daytime maximtim typically occurring
between 100 and 300 PM The pattern of NO2 NO3 and HONO are broadly similar
but HONO shows the most variation The significant nighttime correlation between
HONO N02 NO3 may suggest that gaseous NO2 is high and more liquid water is
available due to condensation Indeed the heterogeneous reaction of NO2 with H2O
adsorbed on surfaces or aerosols produces HONO(g) and aqueous HN03^^ Also both
HONO and NO2 can be oxidized in aqueous particles to form NO3 However it is more
likely that the nighttime formation of N03 is due to the hydrolysis of N2O5
Unlike in Philadelphia NO3 has an insignificant nighttime correlation and
daytime correlation with HONO in Houston The diurnal pattern appears more clearly for
145
tiie gases than tiie particles however an increase in daytime nitrate can still be clearly
seen in Houston
The lowest measured average concentration of HNO3 is in Tampa The average
concentiation of nitiic acid in Tampa is less than half that measured in Philadelphia or
(Figure 52) Houston however the average concentration of nitrate is more than double
that in Houston and three times higher than that in Philadelphia or Lindon (Figure 51)
In Tampa a significant correlation exists between overall (day and night) HNO3 and total
NO3 (p=044) Since overall NOx concentrations are not that disparate this strongly
suggests that HNO3 is being converted to particulate nitrate in Tampa Indeed the high
average concentiation of total NOs is due to the formation of lutrate on coarse sea salt
particles by the reaction of HNO3 (and possibly NO2) with NaCl This is discussed in
greater detail in a later section The coordinated variation between nitrate and nitric acid
is obvious in their pattern The close diurnal pattern can be clearly seen in Figure 512
between May 7 and May 112002 as well as on the afternoon of May 13 2002 Notice
also the simultaneously low levels of nitiate and nitric acid on the days between May 7
and May 13 Figure 513 shows nitrite and nitrous acid levels in Tampa Both nitrite and
nitious acid levels are relatively low but HONO shows strong interesting variations
between day and night Notice the gradual increase in nitrous acid concentration as the
night progresses and the relatively sharp drop in the morning Nitrate and Nitrite levels
like otiier PM levels are low in Lindon however a stronger variation and clearer diurnal
pattern is seen for nitrate than for nitrite (Figure 514)
146
Observation of High PM pnH Tr^ce Gases FpinHes in Philadelphia
During tiie NEOPS study three major events of high PM and trace gases were
observed The first and second episodes occurred on July lO Vd July I7^ respectively
and were relatively brief lasting for only one day However the third episode started on
July 22 and lasted till tiie 26 During this episode strong diurnal pattern for both PM
and gases were observed and the highest levels were measured on the 25 Figure 515
Figure 516 and Figure 517 show tiie variations of N03 S04^ SO2 and HONO3 during
tiie first second and tiiird episode respectively The wind direction and solar radiation for
tiiese episodes are shown in Figure 518 All those episodes were strongly correlated with
a south southwest wind which brings the air mass from the city center to the study site
The second episode which took place between July 17 and July 18 serves as a good
representation of the other two episodes
July 17 started with a northern wind associated with low levels of pollution Just
after midiught the wind became southeast blowing a different air mass over the site A
sharp increase in SO2 S04^ and NO3 levels was observed that lasted until early morning
hotirs The close similarity in the concentration profiles of SO2 S04^ and NO3 in the
early part of the night suggests that these species have originated from the same sotirces
andor has been simultaneously photochemically processed during the previous day By
morning hours the wind direction became from the southwest The correlation between
gas and particle concentrations specifically between SO2 and SO4 immediately
deteriorated While sulfate maintained its high nighttime level of-15 pgm^ SO2 levels
increased sharply exceeding 30 ppb at 900 am before dropping sharply at noon This is
147
probably associated witii tiie local morning emissions of SO2 especially since the wind
was blowing from tiie city center to the site S04^ and HNO3 are associated with
photochemical activity thus increased rapidly during daytime and reaching their
maximum levels in the afternoon The next day was dominated by a northeriy wind
associated with substantially lower levels of gases and particles
This relation between wind direction and elevated levels of PM and gases can be
seen on an extended scale in the last episode The episode was longer lasting 4 days and
associated with a rectirring ditimal pattern with incremental levels
NitrateChloride Replacement on Sea Salt Particles in Tampa FL
Recent studies of size resolved particle analysis in Tampa Bay has revealed the
predominant existence of nitrate in the coarse PM size fraction and sulfate in fine PM
size fraction^ The average PM25 nitrate composhion measured in Tampa from May I to
May 9 2002 is 029 pgm^ while the average TSP nitrate composition is 209 pgm^ for
the same period However the average fine and total sulfate for the same period are 518
pgm^ and 558 pgm^ respectively The PM25 were measured by different instrument
tiiat has been developed by URG Corp The instioiment uses steam to grow and collect
particles The large difference between the average total and fine nitrate fraction is
attributed to the reaction of gaseous HNO3 or other NOxNOy species with particle
surfaces and compounds thereon The most significant of these reactions is tiiat between
HNO3 and NaCI(s aq) in sea salt particles which resuhs in the production of HCI(g)
Indeed the highest average HCI concentration was measured in Tampa In addition the
148
correlation between HNO3 and HCI is significant (p- 0734) reflecting the direct
relationship between reaction of HNO3 and liberation of HCI gas The correlation
between NO3 and HCI is 035 Despite being significant it is smaller than that between
HCI and HNO3 This may be atfributed to formation of coarse nitrate through other
documented reaction patiiways such as the reaction of NO2 with NaCl^ Figure 519
shows representative one -week patterns of HCI HNO3 and N03 in Tampa The close
correlation in the pattern of HCI and HNO3 can be cleariy noted in the figure
The relative concentration of fine and coarse nitrate and the scarcity of fine nitrate
in Tampa are related to the different nature of nitrate in the fine and coarse PM fraction
Fine NO3 is predominantly NH4NO3 formed by the reaction of NH3 and HNO3 and
requires a certain partial presstire product of NH3 and HNO3 to exist The reaction is
reversible thus relating the existence of fine nitrate to sufficient abundance of ammonia
which in turn is related to the acidity of fine particles and the level of sulfate
neutralization In Tampa the ratio of sulfate equivalents to those of ammonium is more
than unity ie the aerosol is acidic at the level between NH4HSO4 and (NH4)2S04
Under these conditions if nitrate were present as NH4NO3 HNO3 would form and be
driven into the gas phase and in turn will react with sea salt aerosol to form coarse
NaNOs Thus the lack of sufficient ammonia for complete neutralization of sulfate in
addhion to the abundance of sea salt NaCI may be behind the almost exclusive presence
of nitrate in the coarse PM fraction
Figure 520 shows the patterns of HCI Cf and relative humidity (RH) in
Tampa An inverse variation between HCI and relative humidity is clearly observed in the
149
figure witii HCI maximum occurring at RH minimum The degassing of formed HCI
from sea salt particles depends on relative humidity Thermodynamic calculations
predicted that 90 of the initial HCI concentiation is lost from droplets at relative
humidity less than 97 but under extremely humid conditions HCI will not be depleted
from large droplets^ The abundance of HCI gas suggests that relative humidity was not
sufficiently high to prevent the degassing of HCI from the particle phase
Ammonia Ammonium and PM Neutralization
Semi-continuous measurement of NH3 and NH4 has a particular advantage in
eliminating significant errors associated with long term collection Underestimation of
NH3 and overestimation of NILt can be caused by absorption of NH3 to the collection
medium itself or the already collected particulate matter Absorption of NH3 to acidic
aerosols has been reported in the determination of H2S04 The opposite can happen as
well A presstire drop over the collection medium as well as changes in humidity
temperature and pressure during sampling might change equilibrium condhions for
NH4NO3 aerosols and cause evaporation of NH3^ Such errors are significantly reduced
by reducing the residence time of particles and gases on the collection medium
The ratios of the total measured anion equivalents to ammonitim equivalent are
077 and 061 in Houston and Philadelphia respectively Figure 521 and Figure 522
show a plot of the meastu-ed ammonium equivalent total measured anion equivalents
and measured NH3 levels in Philadelphia and Houston respectively In Philadelphia the
ratio of the total measured anion equivalents to ammonium equivalent is biased by tiie
150
values of tiie last few days of the study specifically from July 18 till July 30 During tiiis
period the measured equivalent ammonium is significantiy higher than that of total
measured anion equivalents and this can be observed in Figure 521 as well In fact the
ratio of the total measured anion equivalents to ammonium equivalent is 123 and 037
for tiie periods from Julyl to July 18 and from July 18 to July 30 respectively In the
latter period the excess ammonium may be due to the uptake of anmionia by aerosols
having significant amounts of liquid water in a high humidity environment The present
system can see tiiis excess ammonia but in integrated filter samples most of this excess
ammonia evaporates Or it may be due to association of ammonium with organic anions
in particulate matter which may be significant during that period In Houston ammonia
from petiochemical sources may be significant and it is very likely that it is being taken
by water containing aerosols Figure 521 and Figure 522 reveal the close association
between the equivalent concentrations of ammonium and total meastired anions The
correlation between the total anion equivalents and that of NIL are 049 and 030 in
Philadelphia and Houston respectively Furthermore consistent with previous
indications that the air mass meastired in Philadelphia is relatively more aged than that in
Houston the correlation between gaseous NH3 and UlU is higher in Philadelphia than in
H o u s t o n (pHouston= 0 1 4 4 pPhiladelphia= 0 34 )
In Tampa both nitrate and chloride are associated with sea salt particles rather
than being neutralized by ammonium Thus sulfate remains the only predominant anion
to be neutralized by ammonia The equivalent ratio of sulfate to ammonitim in Tampa is
109 Though total sulfate was measured sulfate is almost entirely present in fine
151
in particles and seems to be associated mainly with NH4^ rather than Na or Mg present i
coarse sea salt particles Figure 523 shows the equivalent sulfate and ammonium and
ammonia levels measured in Tampa Notice the coordinated variation in the levels of
ammonium and sulfate A ftirther indication of the strong association between sulfate and
ammonium is their high correlation (p= 082) Figure 524 shows a plot of equivalent
ammonium versus equivalent sulfate in Tampa The majority of the points lie in the
region between NH4HSO4 and (NH4)2S04 suggesting that sulfate is only partially
neutialized by ammonium
In Lindon the correlation between equivalent ammonitim and total anion
equivalents is (p == 062) but when only equivalent sulfate and nitrate are correlated with
eqtuvalent ammonium the correlation increases (p = 071) The equivalent ratio of the
total measured anions to ammonium is 179 suggesting that among all locations the most
acidic particles are measured in Lindon However the equivalent ratio of only nitrate and
sulfate to ammonitim is 119 The difference is largely due to the significant equivalent
contribution of chloride relative to sulfate nitrate and ammonium Chloride constitutes
11 of the equivalent anionic composition of PM in Lindon and may be associated with
other cations rather than ammonitim Figure 525 shows the equivalents of sulfate +
nitrate vs the equivalents of ammonitim in Lindon The close time-coordinated variation
of anions and ammonium can be clearly observed especially at the higher concentrations
152
Conclusion
Fifteen minute measurements of inorganic soluble gaseous and particulate
constituents in 3 urban and 1 suburban locations in the United States are presented The
data among different locations and among gases and PM constituents were compared and
correlated Among all locations the concentration of PM was highest in Philadelphia
and lowest in Lindon S04^ levels were compared to precursor SO2 levels in each
location and the correlation between the two was measured in each site In Houston
localized pltunes with significant concentrations of SO2 observed during nighttime
impacted the site location The predominant formation of coarse nitrate on sea-salt NaCl
particles in Tampa was specifically investigated and the levels of HNO3 were correlated
with the production of HCI gas The acidity of particles and extent of neutralization by
ammonium was also studied In Houston and Philadelphia the ammonium equivalents
exceed those of sulfate nitrate chloride and oxalate Particles are slightly acidic in Tampa
and Lindon
153
References
1 Kaiser J Science 2000 289 22-23
2 Pope C A Thun M J Namboodiri M M Dockery D W Evans J S Speizer FE Heath C W Am J Resp Crit Care 1995 151 669 - 674
3 Wang H Shooter D Atmos Environ 2002 36 3519 - 3529
4 Saxena P Hildemann L M J Atmos Chem 1996 24 57 - 109
5 John W Wall S M Ondo J L Winklmayr W Atmos Environ 1990 24A 2349 -2359
6 Matsumoto K Naggo I Tanaka H Miyaji H lida K Ikebe Y Atmos Environ
1998321931-1946
7 Sander S P Seinfeld J H Environ Sci Technol 1976 10 1114 - 1123
8 Monn C Schaeppi G Environ Technol 1993 14 869 - 875
9 Kasper A Puxbaum H Atmos Environ 1998 32 3925 - 3939 10 Hering S V Stolzenburg M R Hand J L Kreidenweis S M Lee T Collett J
L Jr Dietrich D Tigges M Atmos Environ 2003 37 1175 - 1183
11 Russell A G Cass GR Seinfeld J H Environ Sci Technol 1986 20 1167 -1172
12 Hildemann L M RusseU A G Cass G R Atmos Environ 1984 18 1737 -1750
13 Mozurkewich M Atmos Environ 1993 27A 261 - 270
14 Laskin A ledema M J Cowin J P Environ Sci Technol 2002 36 4948 -4955
15 Lammel G Atmos Environ 1996 30 4101 -4103
16 Ten Brink H M Spoelstra H Atmos Environ 1998 32 247 - 251
17 Ammann M Kalberer M Jost DT Tobler L Rossler E Piguet D Gaggeler HW Baltensperger U Nature 1998 395 157-160
154
18 Zellweger C Ammann M Hofer P Baltensperger U Atmos Environ 1999 33
19 Koutrakis P Wolfson J M Bunyaviroch A Froehlich SE Hirano K Mulik J D Anal Chem 1993 65 209-214
20 Geyh AS Wolfson JM Koutrakis P Mulik JD Avol EL Environ Sci Technol 1997 312326-2330
21 Chow J C Watson J G Lowenthal D H Egami R T Solomon P A Thuillier R H Magiliano K Ranzeiri A Atmos Environ 1998 32 2835 - 2844
22 Tanner R L Parkhurst W J J Air amp Waste Manage Assoc 2000 50 1299 -1307
23 Brook J R Dann T F Burnett R T J Air amp Waste Manage Assoc 1997 47 2-19
24 httpvvfv^fwutexaseduresearchceertexaqs
25 Cooke G A Federal Register 67 (148) (2002) 49895-49897 August I 2002
26 httputsccutexasedu-gcarchHoustonSuperSite
27 httpwwwcgenvcomNarsto
28 httpwwwhscusf edupublichealthEOHBRACEBracelinkhtml
29 Li-Jones X Savoie DL Prospero JM Atmos Environ 2001 35 985-993
30 Boring C B Al-Horr R Genfa Z Dasgupta P K M W Martin and W F Smith Anal Chem 2002 74 1256-1268
31 Samanta G Boring C B Dasgupta P K Anal Chem 2001 73 2034-2040
32 A Continuous Analyzer for Soluble Anionic Constituents and Ammonium in Atmospheric Particulate Matter R Al-Horr G Samanta P K Dasgupta
33 P K Dasgupta S Dong and H Hwang Aerosol Sci Technol 1990 12 98-104
34 Lawson D R Biermann H W Tuazon E C Winer A M G I Mackay Schiff H I Kok G L Dasgupta P K Fung K Aerosol Sci Technol 1990 12 64-76
155
35 Campbell S W Evans M C Poor N D Atmos Environ 2002 36 4299^307
36 Finlayson-Pitts B J Pitts Jr J N Chemistry of The Upper and Lower Atmosphere Theory Experiments and Applications San Deigo Academic Press 2000 Ch 8 296 -297
37 Detener N M Crutzen P J J Jeophys Res 1993 98 7149 - 7163
38 Wayne R P Barnes I Biggs J P Burrows C E Canosa-Mas C E Hjorth J Le Bras G Moortgat G K Pemer D Poulet G Restelli G Sidebottom H Atmos Environ 1991 25A 1-203
39 Lammel G Cape J N Chem Soc Rev 1996 25 361 -369
40 De Bock L A Van Malderen H Van Grieken R E Environ Sci Technol 1994 281513-1520
41 Ro C Oh K Kim H Kim Y P Lee C B Kim K Kang C H Osan J Hoog J D Worobiec A Grieken R V Environ Sci Technol 2001 354487-4494
42 Weis D D Ewing GE J of Phys Chem A 1999 25 103 4865-4873
43 Clegg S L Brimblecombe P Atmos Environ 1985 19 46 5-470
44 Koutrakis P Thompson K M Wolfson J M Spengler J D Keeler G J Salter J L Atmos Environ 1992 26 A 987-995
45 Forrest J Tanner R L Spandau D J D Ottavio T Newman L Atmos Environ 1980 14 137- 144
156
Table 51 Sampling locations and available measurements
Location
Houston TX TexAQS 2000
Philadelphia PA NEOPS
Tampa FL BRACE 2002
Lindon UT
Sampling Period
August 12 -September 25 2000
July 1-302001
April 26-May 302002
August 1-30 2002
Gases^
HCI HONO HNO3 SO2
H2C2O4 NH3
HCI HONO HNO3 SO2
H2C2O4 NH3
HNO3 H O N O SO2 HCI NH3
C2O4H2
PM
PM2 5 (N03 N02- S04^
euro204^ NH4^)
PM25 (NO3- N 0 2 S04^
euro204^ NH4)
TSP (NO3 NO2 S04^-
euro204^ NH4)
PM25 ( N 0 3 -
N02 S04^ C204^ NH4 Cl)
System
PPWD + PPWD-altemating filterautomated IC PPWD + PPWD-Mist Reflux Automated-IC PPWD-Mist Reflux Automated-IC
PPWD-Mist Reflux Automated-IC
157
Table 52 Day and night correlation of NO3 NO2 HONO and HNO3 measured in fotir cities
Correlation HNO3 NO3 Correlation HONO NO2
Correlation HONO HNO3 Correlation NO2 NO3
Correlation NO HNO3
Correlation NO3 HONO
Houston TX
Day Night
016 021
041 0044
-0061 -0095
0042 014
-019 -014
0045 -0012
Philadelphia PA
Day
018
032
033
017
056
063
Night
025
0041
029
-0044
038
044
Tampa FL
Day
011
-0040
0057
-012
014
035
Night
021
0084
019
009
-039
0026
Lindon UT
Day Night
0012 -005
158
c 0 E E lt
ZIP 9 6 U - 9 Z 0
900 I see - ZOO
901^- ZOO
0)
X
0
980-frOO L 9 9 9 - 0 C
C8C-300 I 8 9 3 - 0
frZ-9-ZOO
oe-frzoQ 0) 4-)
3 0)
9-8C-990 (_
9Seuro - lpound 0 C
0
5
ZZ 8 - UOO
39Z-C10 I ^ 90Z - UOO
19-9-ZWO E
c 0
3 0 I
E a 3 T5 (0
0)
t ^ o - uoo C96- 9 0 0
Cl-C- 3 0 0 tZP - ZOO
J h Q X
- I h Q X
-J h Q X
J h Q X
c 0 bullp (0 0 0 - I o c c 0
a (A 0) k u 0 o c
(0
Q (0 c
_0
0) z 3 0 (0
jUiyen uoBBJiuaouoo
bull3 3
2
CO
B
s
a S ii c
_o u
I o o a o
o u
a
a bulla a u
00
159
X z
bdquo 303-^10 [ 6S^-0 [
6 C 6 - Seuroi 0 [
O o e^o - 0 [
600-o[
0 o
CM
X
SSO-0 [
etc-zoo [ 8 8 9 - 300 [
0 z X
I66 - kOO
C9Z - 3 0 0 I
si-e-coo I VPL - WO
3frC- 0
CO pound
X D I-I
X Q I-
0 z 0 X
SO-fr -900 [ 3C - ZOO L
I Z I -300 [
h
X
h
Q
z
(0 c 0 n u 0
0) c bullo c 0 a tn
0)
0
o bull0 c n bull0 0) 3 (A (0 0 (0 0) 0) n 0
O X
9 k - 0
1 I
Aqdd uojiampi^uaouoo
d) 9^
a (53
S O
cd 00
I o
o Cl
o I u u c o u
h
Q
X
a bulla a
u gt lt
gtri (Lgt
ap
160
bull gt
a o
o
00
c
o
XI u
o gt 13
ii
C3
-a 1 T3
ca c
CJ
o
_o (Lgt
Q
S 00
161
H O (0 (M
o in
o CM
o CO
0)
M CM
H
o
o H
lt PL
1 3
OH
a CM
H O ^ o CM
bullT3
ure
^ u a u
T3
oxi
UJ3ri
3 00
3
1 00
162
o o
X I-c o () 3 o X
(0 N
3 O
o o o
00
o to
ujsectn
X H d o
O
(U
i U
ca (Lgt
o
3
I 3 iri in u
00 P I
163
CM O
00
ugt
o CM
m
ltM
o
in
CM
o o 1-1 gt irgt
CM o gtgt a gtlaquo m
CM o gt 00
m
CM
o
in
agt S (0
lUSrl
cf
H c
e a u
a u
O
3
I C+H
3 C3
op
164
o bullo
5
CM O
00
00
CM
o
00
CM
o
00
CM
o in
00
CM
o
00
O (0
O
o o od
o q to
o q o q o q d
iu3ri
CM O ^ rH ^ 00
CM o ^ CM i H ^ 00
CM o ^ i H i H ^ 00
H t^ c o bullT3 C
K J
c C1
u
i OH
sur
ca (U
a u +-bull
3 CD
t-j i n u I i 3 00
b
165
lt Q
Q
bullo (0
m 0 0 z Z 0 1 I
o q (M H
0)
C3
o u
a I op
S
ca
i u V3
c u
bulla CL
o sect
gUiSn
o
00 i n (U
gt - op
166
80 - 1 -^ Nitrate -^ Nitrite Philadelphia PA
40
00
71201 71301 71401 71501 71601 71701 71801 71901
Date
Figure 59 Pattern of NO2 and NO3 in Philadelphia PA The enclosed areas are the nighttime hours (sunset to sunrise)
167
0)
O
o
a I 00
u ca ii ca
T3 ii Vi
13 s=i ii a H gtlt H o c3
O
O
g o e i PL
op
168
i 7^rr^lt t
mdashCnV9 ^ ^
o
reg 0) bull bull ^Vraquo
_raquo bull
bull ^ Z A raquo gt
o o Oi V
o o 00
0)
o o
o o to
o o m Oi
o o
o o
0)
o
o o CM
0gt
q CO (M
o a
O UJSrI
claquo
C3
o
CO
O
a
a 00
ii bull ^ - raquo
CO
13 u u
H
gtlt H C o ^-raquo CO 3 O
3
o
o z C t -
o
PL
m u -( 3 00
169
CO o z X
(U
a E (0 1-agt
rat
z
CM O
H N in
CVJ
o bulls
ri
in CM
o CM rH
in
CM
o
in 0)
V O H in
CM
o
in
CM
o 00
in
CM
o rs in
O 00
o o o (NJ
o
o uiSri
o X I ii
a 00
ii bull3 a CO ca a
T3 ii Vi
3 u ii
PL
ca
O
o
ii
i PL CM
in a u 3 00
170
(0 a E I-
Z -
z z
UJSrl
o XI ii
a I 00
bulla -3 a ca CO ca ii ii Vi
O
1 ii X H J
H
rs
o
o z o C-(
o E u
i
a
in
i 00
PH
171
(M O
OO
CO
(M o ^ H X 00
N O
10 H s 00
N o s in H
00
N O N
^
Q) 4^ (0 0
eh
o
a tti
X 00 3
1 u u ^
dar
e
a Vi O
end
a X H H D
00
CM o s m H oo
o (M H N OO
O
00
UJ3rl
3 O bulla
3
3 o
o z o ii
PL
op
172
giuSri
qdd
o o CN
3
3 bull - gt
cd X
1 3 1 X a
e ltu
O H
o z
o
o in
in
i op
173
elUSrt
o o
o 0) H s rs
o o
o o
o IS H bulls fs
O o CN
oo o 12
3
3 gtmdashgt 2
X _amp 13
o V
718
at
e
Q
X OH
3
patte
o z -o
qdd
O V3
o
Vi
in Si 3 op
174
gUiSrl
175
36000 mdash1
bull Wind Direction
Solar Radiation
mdash 50000
mdash 000
100000
I IS
100000
^
5 0 0 0 0 O
(0
amp
000 j5
1 1 1 1 1 1 1 1 1 7 1 7 0 1 7 18 01 7 19 01
^ Wind Direction
laquo 36000 mdashI
270 00 mdash
c S 18000 mdash
Q 9000 mdash bullo c S 0 00
Solar Radiation
V
Y gt^iW4WrrTy
^ laquo f^ -| 1 raquo mdash 1 1 1 1 1 1 1 1 1 1 1 I I I I I I I I T
c o
000 I (B
72101 72201 72301 72401 72501 72601 72701 Date
Figure 518 Wind direction and solar radiation in Philadelphia during high PM and tiace gases episodes
176
)
o X
a E (tj 1-
0) m t
o SJ z t X z
CM O
CO
in CM
o CM
in CM
o
in
CM
o o H in
d) 3 V A (0
CM
o OO
in
CM
o rs laquos in CM
o CO
in
CM o Ss
m in
PL
ca
H 3 Vi
B ii
i I
O
z
o o o cvi
o d
u j 3 n
o OS
gtn
i op
177
A)PUjnH aAUcpd
0)
_ o Z U pound GC Z O
0) fl]
PL
ca O H
H 3 13
e 3
gt
B 13
Uisectn
o o X o CN gtn
S op
Pu
178
qdd ^HN
lt Q
0) bullo fl]
uibaT^
lt PL
d
13 B X PH
3
3 O
ta
u o 3 o o
X
z
z
3 gt 3 u 3
3 gt
3 O
B o H
CN in a 3 00
179
qdd ^HN
o 00
d
o (0 d
o d
o CM
O O d
o o CO
0gt
o o CO s 0gt
o o
s 0gt
o o CM
0gt
o o
H
00
o o (3) CM
CO
o o rs CM
CO
0)
(0
X H d o ^ - raquo CO
3 o
X
3 o
o 3 o o
X
z
z ^ - raquo 3
3 gt 3 cy ii
3 u 3 gt 3 a a 3 O
ca o
H CN CN
ltn
i op
ujbaTl
180
qdd ^HN
(Q Q
fl)
ujbarl
pL
ca
H 3 3 O
bull ^
0) CJ 3 O o
X
z
z
3 gt 3 3 3 gt 3 ii 3 O
3 o H (^ CN i n u i-i 3 op
181
Tampa FL
0 8 0 mdashI Ammonium Bisulfate
060 mdash E O 0)
(0 lt ^ 3
V)
040 mdash
020 mdash
000
Ammonium Sulfate
000 020 040 060 080
Ammonium jxeqm^
Figure 524 Equivalent anmionitmi versus equivalent stilfate in Tampa FL
182
CM O
o eg s 00
CM
o oo H oo
M O
(0 H
00
CM
o H
CO
CM
o CM H
CO
CM
o o H
00
0)
(0
Q
d o 3 3 _S
3 O
ta
o 3 o o m
z
-uibarl
3
3 gt 3 a 3
3 gt (Lgt
3 O
cd -raquo o
H gtn CN i n u 3 op
183
CHAPTER VI
SUMMARY AND CONCLUSIONS
Environmental policies and regulations have always spurred hot debates for their
enormous socioeconomic implications When the Environmental Protection Agency
(EPA) set standards for fine PM in 1997 the agency acknowledged that the uncertainties
associated with setting standards for particles relative to other gaseous pollutants are
significantly higher Despite a major increase in PM related research over the past few
years these major uncertainties remain Atmospheric modeling is helpful in explaining or
predicting atmospheric events but often it does so with a wide range of uncertainty and
large number of asstunptions
The context of this research was to provide tools that scientists as well as
practitioners of atmospheric analysis can use to measure species contributing to
atmospheric pollution There is no argtiment about the need for systems that can
automatically measure chemical composition of PM and of the precursor gases with high
temporal resolution Beside providing a better understanding of the chemistry of gas and
aerosol formation and transport such measurement is also cost effective and does not
suffer from problems associated with long term collection such as particle evaporation
gas-particle interaction and particle-particle interaction on the collection media
184
Two Dimensional Detection in Ion Chromatographv
The recent commercial availability of electrodialytic eluent generators capable of
producing highly pure hydroxide eluents which lead to nearly invariant backgrounds
even with gradient elution makes two-dimensional ion chromatography (2DIC) more
attiactive tiian ever before The work described in chapter II elaborates on previous
studies that utilized base introduction after a conventional suppressed IC It differs from
other work in that passive rather tiian electrodialytic base introduction is used requiring
no electronic control After suppressed conductometric detection of an electrolytically
generated hydroxide eluent and an electrolytic suppressor the eluent is passed into a
membrane device where potassium hydroxide (KOH) is passively introduced into the
eluent stieam using Dorman forbidden leakage The background conductance measured
by a second downstream detector is typically maintained at a relatively low level of 20 -
30 pScm Weak acids are converted to potassium salts that are fully ionized and are
detected against a low KOH background as negative peaks Further different
commercially available membranes have been studied in different physical designs and in
different thickness with different bases to determine the optimtmi conditions so that
resuhs as good as the best of the previous electrodialytic base introduction efforts can be
realized in a simpler maimer Device configurations investigated include a planar 2-
channel device a tubular device and a filament filled helical (FFH) device The FFH
device provides more effective mixing of the penetrated hydroxide with the eluent stream
resuhing in a noise level lt 7 nScm and a band dispersion value of less than 82 pL
185
In conclusion 2-D IC in hs presentiy developed form is simple to implement and
practice Aside from improving the detectability and response linearity characteristics of
weak to very weak acids it provides a wealth of information that is otherwise difficult or
impossible to obtain 2-D data can be exploited for diagnosis of co-elution and
performing universal calibration It can be used for the estimation of analyte pKa values
and the calculation of analyte equivalent conductance both as means of identification
However user-friendly software that can fiilly utilize the 2-D data is needed for the
complete exploitation of the technique Recent advances in the understanding of ion
exchange devices in ion chromatography may even make possible 3-D detection schemes
(HX MX MOH) However even the present state of development provides a very useful
tool to the interested user
Measurement of Acid Gases and Soluble Anions in Atmospheric Particulate Matter Using a Parallel Plate Wet Denuder and an
Alternating Filter-Based Automated Analysis Svstem
Chapter III describes a fitlly automated instrument for the meastirement of acid
gases and soluble anionic constituents of atmospheric particulate matter Soluble gas
collection is accomplished with a parallel plate wet denuder (PPWD) The denuder liquid
effluent is then preconcentrated on anion exchange preconcentrator colunms and then analyzed
by IC In a second independent chatmel a new instrument collects particles in a fully
automated procedure The system mimics the standard procedure for the determination of
anion composition of atmospheric aerosols A cyclone removes large particles and the
aerosol stream is then processed by a second wet denuder to remove potentially
186
interfering gases The particles are then collected by one of two glass fiber filters which
are alternately sampled washed and dried The washings are preconcentrated and
analyzed by IC The instrument provides high sensitivity and allows analysis of anions in
aerosol in only a fraction of the time and cost of conventional techniques A wide range
of aerosol constituents can be determined by simply changing the analytical technique
used to analyze the filter extract Detection limits of low to subnanogram per cubic meter
concentrations of most gaseous and particulate constituents can be readily attained
Ftuther an attempt to decipher the total anionic composhion of urban particulate
matter by IC with on-line confirmation by MS revealed the complexity of particles
compositions Several organic anions were identified and quantitated most commonly
formate acetate oxalate lactate glycolate malate and malonate
A Continuous Analvzer for Soluble Anionic Constituents and Ammonitmi in Atmospheric Particulate Matter
The filter based instrument described in chapter III is field worthy and has been
extensively field-tested However leaching of fibers from presently used fibrous filters
has led to fouling of downstream components of the analytical system In addition the
filter system intrinsically operates on a batch mode To accommodate the needs of future
continuous analysis systems a truly continuous analysis system is desirable Thus A new
continuous soluble particle collector (PC) has been developed Described in Chapter IV
this device does not use steam and avoids the problems associated with fibrous filter
leaching The PC is essentially a sealed cylindrical chamber (3 in od 25 in id 375
in taII)This compact collector permits automated collection and continuous extraction of
187
soluble anions and ammonium in atmospheric particulate matter The PC is mounted
atop a parallel plate wetted denuder for removal of soluble gases The soluble gas
denuded air enters the PC through an inlet One version of the PC contained an integral
cyclone-like inlet For this device penetration of particles as a fimction of size was
characterized In the simpler design the sampled air enters the PC through a nozzle and
deionized water is pumped peristaltically at 1 mLmin into the PC chamber through a
stainless steel capillary that delivers the water to the air stream just exiting the nozzle
The water is aerosolized by the high velocity air creating a fine mist The resulting water
mist attaches to the aerosol which impacts on a hydrophobic PTFE membrane filter that
constitutes the top of the PC and the airflow exit Water drops coalesce on the filter and
fall below into a purpose-machined cavity equipped witii a liquid sensor The water and
the dissolved constituents are aspirated by a pump and pumped onto serial cation and
anion preconcentrator columns Ammonium captured by the cation preconcentrator is
eluted with NaOH and is passed across an asymmetric membrane device which allows
the ammonia from the alkaline donor stream to difftise into a deionized water receiver
stream flowing countercurrently The conductivity of the receiver effluent is measured
and provides a measure of ammonium The anions on the anion preconcentrator column
are eluted and measured by a fiilly automated ion chromatography system The total
system thus provides automated semicontinuous measurement of soluble anions and
ammonium With a 15-min analytical cycle and a sampling rate of 5 Lmin the limit of
detection (LOD) for ammonitim is 8 ngm and those for sulfate nitrate and oxalate are
lt0I ngm^ The system has been extensively field tested The system has been
extensively operated in several field studies averaging 94 data capttire (not including
calibration or maintenance) which indicates instrument robustness and reliability
Although only the ammonium among soluble cations has been measured the
system can be configured with an additional ion chromatograph to measure other major
soluble cations In principle a second IC can provide complete soluble cation analysis
however it may be necessary to have respective preconcentrators in parallel rather than
in series to avoid eluent counterion contamination between systems
Semi-Continuous Measurement Of Maior Soluble Gaseous And Particulate Constituents In Several Maior US Cities
The data collected in four field studies held in Houston TX Philadelphia PA
Lindon UT and Tampa FL using the above described systems is presented in chapter
V Sulfate nitrate and ammonium constitute the majority of the soluble inorganic mass of
the PM Among all locations the concentration of PM was highest in Philadelphia and
lowest in Lindon Concentrations of different gases and ionic constituents of PM were
compared and correlated The correlation between S04^ and SO2 levels was also highest
in Philadelphia In Houston the site location was impacted by a fresh air mass with
significant concentrations of SO2 observed during nighttime Particulate chloride
concentrations were highest in Houston but gaseous HCI concentrations were highest in
Tampa This in addition to the large difference between the average total and fine nitrate
fraction measured in Tampa was attributed to the reaction of gaseous HNO3 or
alternatively NO2 NO3 or N2O5 with coarse sea salt particles A significant correlation
between total measured equivalent anion PM composition and equivalent ammonium
189
exits in all location However The ratios of the total measured anion equivalents to
ammonium equivalent varied significantly among locations
The data collected provide a wealth of information that is of tremendous value
For most of the data presented meteorological data are also available from other
participants in the studies In principle it is possible to calculate back tiajectories of the
air masses and discuss each significant case individually
Conclusion
The systems described in this research were fully automated and possessed a
degree of robustness adequate for field deployment The measurement was based on a 15-
min cycle for collection and analysis The current temporal resolution was mainly limited
by the chromatographic separation Future effort directly involved with these systems
will be focused on developing significantly faster analysis allowing for even higher
temporal resolution while maintaining adequate sensitivity and limits of detection
While the scope of this research constitutes an important contribution to
atmospheric measurement of gases and particles it was mainly limited to the
measurement of soluble inorganic gases and inorganic ionic composition of particulate
matter Measurement of organic gases and organic species present in PM is another even
more challenging and interesting dimension of atmospheric analysis Organic compounds
constitute a large fraction of the total chemical composhion of atmospheric particles
Present available methodologies and instrumentation are unqualified for such a task In
recent years mass spectrometers that have the ability to provide real time measurement
190
of tiie chemical composition of a single particle has been developed However these
instruments are fairly expensive and currently not suitable for reliable quantitative
analysis The development of less expensive alternative instrumentation that can provide
more reliable quantitative real-time analysis of organic gases and organic composition of
PM will be among the future projects that I would like to research
There is significant interest in developing systems with a capacity to detect bio-
agents for early detection of airborne bacterial and viral contamination This year the US
government is proposing 6 billion dollars for a bioshield program A significant portion
of it will tmdoubtedly be spent on developing necessary early detection technology
Again The cost and complexity of mass spectrometry provide an opportunity for
developing less expensive and more specific technology
The tmcertainty of any ambient air analysis is largely affected by problems
associated with the instrument inlet Losses of gases and particles in the system prior to
collection are among the most common problems Uncertainties remain even if the
instrument was carefiilly characterized and calibrated with the appropriate gases or
particles This is because inlet losses depend on factors like humidity temperature in
addhion to the relative concentration of gases and density and composhion of particles
measured which are often variable and hard to predict Therefore my fiiture work will
certainly involve developing gas and particle system inlets that will have a high degree of
flexibility but will eliminate or at least decrease the level of gas or particle loss within
191
Finally In the past few years miniaturization has been the trend of many chemical
applications It would be particularly interesting to develop miniattirized systems that
can provide similar analysis
192

ACKNOWLEDGMENTS
I would like to express my deep appreciation to my research advisor Pumendu K
Dasgupta P W Horn Professor of Chemistry It is due to his enlightened guidance and
strong support pounduid encotiragement that I was able to present this work I also would like
to thank Dr Carol Korzeniewski and Dr John N Marx for their assistance and valuable
comments throughout my graduate studies
I would like to acknowledge Jianzhong Li Gautam Samanta Charles B Boring
Genfa Zhang Rahmat S Ullah Kevin Morris and all other research group members for
their assistance in various aspects of this work
I owe a lot to my brother Hadi Al-Horr for his help and support and I am
especially thankful to my family members for their inspiration and motivation I also
thank my fiance Yasmin Soussan for her patience and understanding
TABLE OF CONTENTS
ACKNOWLEDGEMETS ii
ABSTRACT iv
LIST OF TABLES vi
LIST OF FIGURES vii
LIST OF ABBREVIATIONS xi
CHAPTER
I INTRODUCTION 1
II TWO-DIMENSIONAL CONDUCTOMETRIC DETECTION IN ION CHROMATOGRAPHY SEQUENTIAL SUPPRESSED AND SINGLE COLUMN DETECTION WITH PASSIVE HYDROXIDE INTRODUCTION 18
III FIELD MEASUREMENT OF ACID GASES SOLUBLE ANIONS IN ATMOSPHERIC PARTICULATE MATTER USING A PARALLEL PLATE WET DENUDER AND AN ALTERNATING FILTER-BASED AUTOMATED ANALYSIS SYSTEM 53
IV A CONTINUOUS ANALYZER FOR SOLUBLE ANIONIC CONSTITUENTS AND AMMONIUM IN ATMOSPHERIC PARTICULATE MATTER 97
V SEMI-CONTINUOUS MEASUREMENT OF MAJOR INORGANIC SOLUBLE GASEOUS AND PARTICULATE CONSTITUENTS IN SEVERAL MAJOR US CITIES 132
VI SUMMARY AND CONCLUSIONS 184
ni
ABSTRACT
Ion cliromatography (IC) is a widely used analytical tool for the determination of
many ionic species Applications of ion chromatography extend over a wide range of
chemical analyses Introduction of eluent suppression in the mid-1970s extended the
botmdaries of conductometric detection into trace analysis Ctirrent state-of-the-art IC
systems require only water to operate exhibit excellent reliabilities and provide the
ability of sample preconcentration and simultaneous multiple ion measurement making
them attractive for atmospheric analysis
Atmospheric particulate matter (PM) contains many inorganic and organic soluble
ions A number of those are weak acid anions that are largely undetectable in suppressed
ion chromatography An improved method that uses sequential suppressed and
unsuppressed IC for the sensitive detection of both common anions and very weak acid
anions has been investigated After suppressed conductometric detection the effluent is
passed into a membrane device where KOH is passively introduced into the eluent stream
using Donnan forbidden leakage
High temporal resolution measurement of atmospheric gases and constituents of
atmospheric particulate matter (PM) is important to understand the chemistry and sources
of atmospheric pollution New continuous collection devices coupled with IC systems for
fully automated measurement of soluble inorganic gases and soluble ionic constituents of
atmospheric PM have been developed Soluble gas collection is accomplished with a
parallel plate wet denuder (PPWD)
iv
For particle collection an automated alternating filter-based system was initially
developed This system uses two glass-fiber filters that alternate between sampling and
washing and drying More recently a continuous soluble particle collector (PC) of
simpler design has been developed this device does not use steam Preceded by a
denuder and interfaced with an ion chromatograph this compact collector permits
automated collection and continuous extraction of soluble anions and ammonium ion in
atmospheric particulate matter The systems have been deployed in a number of major
field studies held in urban and suburban locations in the United States
LIST OF TABLES
31 Fotir states of the instmment programmed chromatograph TTL outputs and outputs of Integrated Circuit Chips UI and U2 85
32 Average anion composition of day and night fime aerosol in midtown Atlanta August 1999 86
33 Organic anion composition of aerosol filter samples collect in Houston TX 2000 and Philadelphia PA 2001 and identified by IC-MS 87
41 Count median diameter mass median diameter and mass median aerodynamic diameter of particle generated by VOAG with
different feed (NH4)2S04 solution doped with fluorescein 121
42 Loss of aerosols in the PPWD and the air-inlet nozzle of the PC 122
51 Sampling locations and available measurements 157
52 Day and night correlafion of NO3 N02 HONO and HNO3 measured in four cities 15 8
VI
LIST OF FIGURES
11 Schemafic of electrolytic suppressor mechanism 17
21 Theoretical response plots 40
22 Cassidy plot of response sensitivity in linear axes 41
23 Experimental system 42
24 Base introduction device designs 43
25 Current efficiencies observed with electrodialytic devices with different membranes 44
26 Background noise in electrodialytic devices with different membranes 45
27 Passive Dorman leakage of KOH through various sheet membranes as a function of feed KOH concentration 46
28 Donnan leakage of different alkali hydroxides through the RAI PTFE membrane 47
29 Dependence of Donnan leakage on tubular membrane dimensions 48
210 Detection of 06 |JM borate in a sample mixture on the second detector 49
211 Second detector response to various analytes 50
212 2D ion chromatogram under standard conditions 51
213 2D ion chromatogram of an air filter sample extract 52
31 Wetted denuder shovra schematically 88
32 Particle collection system 89
33 Particle system set up 90
34 Schemafic ofelectronics governing instrument operation 91
VII
35 HN03Nitrate HONONitrite and S02Sulfate patterns at a midtown location in Atlanta GA 92
36 HClChloride Oxalic acidOxalate levels at a heavily industrialized site close to the shipping chaimel in Houston TX 93
37 Representative chromatograms 94
38 Gradient ion chromatogram of an aerosol collected during the Atlanta experiment 95
39 Log R versus log [eluent] plots 96
41 Particle collector 123
42 Field sampling and airflow schematic 124
43 Total particle collectionanalysis system 125
44 Penetration curve of standard size polystyrene beads in the particle collector with a cyclone-style inlet 126
45 Representative system output 127
46 Integrated sulfate measurements versus sulfate measured by present instrtiment 128
47 Sulfate and nitrate concentrations 129
48 HCI and particulate Nitrate patterns in Tampa FL 130
49 SulfateAmmonium equivalent ratio with sulfate and ammonium equivalent concentration patterns Tampa FL 131
51 Average minimum and maximum concentration of soluble ions in particulate matter measured in four studies 159
52 Average minimum and maximtim concentration of soluble acid
gases and ammonia measured in three studies 160
53 Deployment location at HRM 3 161
54 SulfateSulfur dioxide measured patterns in Philadelphia PA 162
vni
55 SulfateSulfur dioxide measured patterns in Houston TX 163
56 SulfateSulfur dioxide measured patterns in Tampa FL 164
57 Sulfate measured patterns in Lindon UT 165
58 Pattern of HNO3 and HONO in Philadelphia 166
59 Pattern ofN02and NO3 in Philadelphia PA 167
510 Pattern of HONO and HNO3 in Houston TX 168
511 Pattern of NO2 and NOB in Houston TX 169
512 Pattern of HNO3 and NO3 in Tampa FL 170
513 Pattern of HONO and NO2 in Tampa FL 171
514 PattemofN03 and NO2 in Lindon UT 172
515 SO2 S04^ HNO3 and N0 patterns in Philadelphia July 10-July 112001 173
516 8O2 804^ HNO3 and NO3 patterns in Philadelphia July 17-July 182001 174
517 SO2 S04^ HNO3 and NO3 patterns in Philadelphia July 21-July 26 2001 175
518 Wind direction and solar radiation in Philadelphia during high PM
and trace gases episodes 176
519 HCI HNO3 and NOi patterns in Tampa FL 177
520 HCI CI and relafive humidity patterns in Tampa FL 178
521 Total anion equivalents equivalent NH4 and NH3 concentration in Philadelphia PA 179
522 Total anion equivalents equivalent NH4 and NH3 concentration in Houston TX 180
523 Total anion equivalents equivalent NH4 and NH3 concentration in Tampa FL 181
IX
524 Equivalent ammonium versus equivalent sulfate in Tampa FL 182
525 Total anion equivalents equivalent NH4 and NH3 concentration in Lindon UT 183
LIST OF ABBREVIATIONS
ac alternating current
A Ampere
cm centimeter
CC concentrator column
degc
DPM
dc
FTF
FFAH
FPD
FV
ft
GF
H
Hz
HPLC
hr
degree Celsius
digit panel meter
direct current
fiber trap filter
filament filled annular helical
flame photometric detector
flame volatilization
feet
glass fiber
height
hertz
high performance liquid chromatography
hour
in inch
id irmer diameter
IC ion chromatography
XI
Kg
L
LOD
LC
MFC
MS
m
MENG
Heq
tgm^
|jL
im
[M
^S
mA
mL
mm
mM
min
nL
nm
od
kilogram
length
limit of detection
liquid chromatography
mass flow controller
mass spectrometry
meter
microelectrodialytic NaOH generator
microequivalent
microgram pre cubic meter
microliter
micrometer
micromolar
micro Siemen
milliampere
milliliter
millimeter
millimolar
minute
nanoliter
nanometer
outer diameter
xu
PPWD
PC
PCS
ppb
ppm
ppt
Wi2
PFA
Pg
PEEK
PVC
PVDF
RE
RSD
^R
S
SN
SLPM
PTFE
TTL
2DIC
UV
parallel plate wetted denuder
particle collector
particle collection system
part per billion
part per million
part per trillion
peak half-width
perfluoroalkoxy Teflon
picogram
polyether ether ketone
polyvinyl chloride
polyvinylidine fluoride
relative humidity
relative standard deviation
retention time
second
signal-to-noise ratio
standard liters per minute
Teflon
transistor transistor logic
two-dimensional ion chromati
ultraviolet
Xlll
V volt
W watt
w width
xiv
CHAPTER I
INTRODUCTION
Chromatography has become a principal tool for the rapid separation and
characterization of many classes of compotmds Although Brunschwig a Strasbourg
stirgeon purified ethanol by a chromatographic technique (1512) and Day an American
geochemist separated crude oil on Fullers earth (1898-1903) it was the work of Mikhail
Tswett a Russian botanist who managed to separate plant pigments that marked the first
systematic study and is recognized as the beginning of chromatography These results
were first presented as a public lecture in 1903 and this year is thus being celebrated as
the centermial year for the separation sciences and for chromatography in particular
Chromatography (chromatus = color and graphein = to write) has come a long
way since it was first invented by Tswett Chromatography is a technique for separating a
multi-component sample into various purer fractions that are detected downstream with
an appropriate detector Any chromatographic process involves two mutually immiscible
phases^ These are the stationary and the mobile phase The stationary phase could be
solid or liquid attached to an inert support material The mobile phase also referred to as
the eluent or the carrier is the solvent that flows through the stationary phase The mobile
phase which could be liquid or gas mobilizes the sample through the stationary phase in
a process known as migration Separation occurs because different compounds have
different migration rates which are due to their different affinity for the stationary and
the mobile phases During the migration process each compound is present at equilibrium
between the mobile and the stationary phase The slower the migration rate of a
compoimd the higher the fraction of that compound present in the stationary phase and
vice-versa
The original chromatographic system now referred to as classical column
chromatography was a glass coltimn containing a packing of fine particles in which the
solvent or the mobile phase flowed by gravity^ Though this kind of chromatography is
extremely flexible in that many different combinations of packing and solvents can be
used it is tedious with poor reproducibility rendering it impractical for most of todays
analyses However it is still practical for large scale purification of many organic
substances especially for mixtures produced in developing organic synthetic
methodology and in purifying many biomolecules
Since then the practice of chromatography has experienced many changes and
improvements The advent of paper chromatography in the 1940s and thin-layer
chromatography (TLC) in the 1950s greatly simplified the practice of analytical liquid
chromatography Today column chromatography routinely produces faster separation and
better resolution than TLC Column chromatography can be divided into gas
chromatography (GC) liquid chromatography (LC) and supercritical fluid
chromatography (SFC) to reflect the physical state of the mobile phase
Modem liquid chromatography is typically operated at high pressure several
thousand psi^ It is refen-ed to as high-pressure liquid chromatography or high
performance liquid chromatography (HPLC) LC embraces several distinct types of
interaction between the liquid mobile phase and the various stationary phases When the
separation involves predominantiy a simple partition between two immiscible liquid
phases one stationary and one mobile the process is called liquid-liquid chromatography
(LLC) In liquid-solid chromatography (LSC) also called adsorption chromatography
the retentive ability of the stationary phase is mainly due to its physical surface forces
Ionic or charged species are usually separated in ion exchange chromatography (IC) by
selective exchange with counterions of the stationary phase Today ion exchange
chromatography is practiced in almost every field of science^
Ctirrent Technology and Svstem Requirements
Ion chromatography is the principal analytical tool used in this research The
general system components are described in this section with more focus on anion
exchange chromatography Modern IC system requirements are in many regards similar
to those of an HPLC system However there are some components that are unique to IC
The general components include a high pressure eluent pump a separator column
(usually preceded by a guard column) a suppressor and finally a detector
Ptimping and Eluent svstem
A high-pressure (up to 5000 psi) piston pump is used to pump the eluent or in
todays state-of-the-art IC systems deionized (DI) water through the chromatography
system IC pumps may have single head or dual heads^ Each head has its own piston and
two check valves to control the direction of liquid flow The pistons are connected to an
eccentric cam whose movement controls that of the pistons Usually all liquid transfer
lines and wet system components are made of polyether ether ketone (PEEK) Stainless
steel can also be used in non-corrosive environments
Modern state-of-the-art IC systems require just water to operate Eluents are
electrolytically generated^^online during the analysis The process offers substantial
benefits to the practice of IC In addition to the operational simplicity of such a system it
is effective in eliminating carbonate formation in manually prepared hydroxide eluents
Carbonate is a stronger anion eluent than hydroxide and its presence in variable
concentrations in the eluent can lead to poor separation reproducibility and detection
limits^ In suppressed conductometric detection it increases backgrotmd levels and
generates baseline shifts in gradient separations
The eluent generator unit is placed after the pump and contains a cartridge of
potassium hydroxide (KOH) or methanesulfonic acid (MSA) for anion or cation eluent
generation respectively The cathode and anode are separated by an ion exchange
membrane For anion chromatography hydroxide is generated at the cathode according to
the following reaction
2H20 + 2e- -gt 2 0H- + H2(g) (11)
while at the anode the feed solution contains KOH from the cartridge
2 0 H - - 2 e - ^ H2O +202(g) (12)
Then K is transferred across the cation exhange membrane to the cathode to form KOH
The concentration of the eluent produced is changed by simply changing the supplied DC
current
Columns of Ion Exchange Resin
The separation of cations and anions on ion exchange resin goes back many years
before IC became widely accepted as an analytical tool Ion exchange resin beads can
be made of silica but more commonly of polymers such as polystyrene or polyacrylate
The polystyrene based exchange resins are made by copolymerizing styrene with a small
amotmt of divinylbenzene (DVB) for crosslinking The amount of DVB added affects the
rigidity of the beads Microporous beads (gel type) are made with up to 25 weight of
DVB while in macroporous resins the weight of DVB can reach 55^ Ion exchangers
are made by introducing appropriate ionic functional groups into the polymer
Most common anion exchangers are made of two substrate types microporous
substrates which are mainly used as a support for latex coated microbeads or
macroporous substrates^ Anion exchangers are usually functionalized with quatemary
ammonium groups The polymeric benzene ring is first chloromethylated followed by a
reaction with tertiary amine Latex agglomerated ion exchangers have also been
successfully used for various applications of IC These ion exchangers are made by
electrostatically attaching latex microbeads with an approximate diameter of 01 im to
the surface of a relatively large core substrate (5 -30 ^m) For anion exchangers the latex
particles are fiinctionalized with quatemary ammonium groups while the surface of the
core PS-DVB substrate is sulfonated These resin are chemically and physically stable
provide moderate backpressure poundmd high chromatographic efficiency^ Dionex Corp has
made a variety of latex agglomerated resins to develop IC columns for different
applications
Most current cation exchangers are either strong or weak acid exchangers Strong
acid exchangers are functionalized with sulfonic acid groups^ Weak acid exchangers
are ftmctionalized with carboxylic acid or a mixture of carboxylic and phosphonic acid
groups^ They are basically used in applications where separation of cations of different
charge is desired Dionex Corp has made several cation exchangers by coating their latex
coated anion exchange resins described before with a second layer of sulfonated latex
particles The acidic cation exchange latex particles are attached to the aminated latex
particles underneath which are attached to the surface of a sulfonated bead
Suppression
Introduced in 1975 by Small et al^ suppression is a pre-detection step that
eliminates the background eluent conductivity contribution in addition to enhancing the
conductance of the analyte ion (for all but very weakly acidic analytes) As a result both
sensitivity and detection limits are improved After separation the column effluent passes
through a suppressor where Na or K from the eluent is exchanged with H thus
neutralizing the eluent hydroxide and changing the analyte from the Na^ or K^ salt form
to the more conducting acid form Early suppressors were simply columns of cation
exchange resins that required frequent offline regeneration and caused considerable peak
dispersion and broadening Since then the technique has passed through several
refinements In 1981 fiber suppressors were introduced followed by flat membrane
suppressors in 1985^ Basically an ion exchange membrane was used with a constant
flow of a regenerant solution Though the devices did not require offline regeneration
they consumed a relatively large voltime of the regenerant solution In 1989 Strong and
Dasgupta introduced the electrodialytic suppressor Based on the same principle in
1992 Dionex Corp introduced the Self Regenerating Suppressor (SRS)^ Figure 11
shows a schematic of the mechanism of an anion SRS suppressor Basically the SRS is
composed of a cathode and an anode separated by two cation exchange membranes thus
forming three compartments for liquid flow The column effluent containing the eluent
and eluite flows in the middle chatmel between the membranes At the anode side water
flows between the anode and the membrane generating hydrogen ion and oxygen
Anode 2H2O - 46 ^ 4H^ + 202(g) (1-3)
the hydrogen ions permeate through the membrane into the middle channel and replace
the eluent cation (example Na or K) thus neutralizing OH and changing the analyte
from the salt to the acid form which is then measured by conductivity in a neutral
medium The eluent cation (K^) permeates through the other cation exchange membrane
into the cathode Water flowing between the cathode and the membrane generates
hydrogen gas and hydroxide ion (11)
Detection
While developing ion exchange resins is important for the practice of ion
chromatography it is the development of appropriate detection techniquesthat has led to
the rapid evolution of IC Several detection techniques are currentiy used with IC most
commonly suppressed conductivity UV-Vis absorption pulsed amperometry and mass
spectrometry Suppressed conductivity is by far the most widely used detection technique
associated with IC Conductometric detection offers several characteristics that are
particularly attractive for IC analysis Conductivity is a universal characteristic of all
ions and the technique is simple and non destmctive
For a strong acid passing through a conductivity detector the signal Gis ()^Scm)
at any point in the eluite band is directly proportional to eluite concentration C (in Molar)
^ according to
Gs=1000C(^H + ^x) (14)
where AH and AH are the equivalent conductances of H and X respectively In the case
of a weak acid the conductivity signal Giw depends on the dissociation constant K of the
acid
Giw=1000C(LH + ^x) (15)
where C is the concentration of X the dissociated fraction of HX approximated by
solving the quadratic equation
Hence
K = XV(C-X) (16)
l2 C=05(-K+(K + 4KC)0 (17)
the expression for C is an approximation that does not apply at very dilute conditions or
in cases where K is very low since at these conditions the dissociation of HX is affected
by traces of acid present in the background suppressor effluent Chapter II elaborates
more on detection of weak acid anions
Research Presented in this Dissertation
The overall objective of the research presented in this dissertation is to fabricate a
fully automated system for the collection and sensitive analysis of soluble gases and
soluble ionic constituents of atmospheric particulate matter (PM) with high temporal
resolution Such meastirement is substantially powerftal in that it can provide chemical
and physical differentiation and correlate tropospheric conditions with gas particle
chemical and physical interaction^ ^ PM constitute a wide range of different kinds of
particles that vary widely in chemical composition size and toxicity Ion
chromatography provides a convenient analytical tool for measuring ionic constituents of
PM along with their soluble precursor gases However many constituents of PM are
weak acid anions that are not detectable by suppressed IC Chapter II describes an
improved method for the conductometric detection of both common anions and very
weak acid anions Then in Chapters III and IV fully automated systems for the collection
and measurement of soluble PM constituents and gases are described The resuhs of field
meastirement in several US cities are presented in Chapter V Finally Chapter VI
emphasizes the significance of this work and presents conclusions and future directions
The contents of Chapters II and III have been published ^ The contents of Chapter IV
has been submitted for publication The contents of Chapter V are being prepared for
submission to a suitable journal
Two-Dimensional Detection in Ion Chromatography Sequential Conductometry after Suppression and Passive Hydroxide Introduction
An improved method that uses sequential suppressed and non-suppressed IC for
the sensitive detection of both common anions and very weak acid anions is described
After suppressed conductometric detection of an electrolytically generated hydroxide
eluent and an electrolytic suppressor the eluent is passed into a membrane device where
potassium hydroxide (KOH) is passively introduced into the eluent stream using Donnan
forbidden leakage The conductivity of the stream is then measured by a second
conductivity detector The background conductance of the second detector is typically
maintained at a relatively low level of 20-30 i^Scm The weak acids are converted to
potassium salts that are fiilly ionized and are detected against a low KOH background as
10
negative peaks The applicability of different commercially available cation exchange
membranes was studied Device configurations investigated include a planar 2-channel
device a tubular device and a filament filled helical (FFH) device The FFH device
provides more effective mixing of the penetrated hydroxide with the eluent stream
resulting in a noise level lt 7 nScm and a band dispersion value of less than 82 |jL
Optimal design and performance data are presented
Meastirement of Acid Gases and Soluble Anions in Atmospheric Particulate Matter using a Parallel Plate Wet Denuder and an Alternating Filter-Based Automated Analysis System
Diffusion based collection of gases is currently the best method to discriminate
between the same analyte present in the gas and particle phase The smallest particle has
a diffiision coefficient several thousand times less than that of a gas molecule Several
denuders and denuder designs have been described Throughout this work a parallel
plate wet denuder (PPWD) was used to collect and remove gases^ The collection
efficiencyfor a parallel plate denuder is given by
= 1 - 091exp(-24wAs) (18)
A = 7xDLQ (19)
where w is the width of the plate s is the separation between them D is the diffusion
coefficient of the gas L is the active length of the denuder and Q is volumetric flow rate
11
A new fully automated instrument for the measurement of acid gases and soluble
anionic constituents of atmospheric particulate matter is presented in Chapter III The
instrtiment operates in two independent parallel charmels In one channel a parallel plate
wet denuder collects soluble acid gases these are analyzed by anion chromatography
(IC) In a second chaimel a cyclone removes large particles and the aerosol stream is
then processed by a second wet denuder to remove potentially interfering gases The
particles are then collected by one of two glass fiber filters which are alternately
sampled washed and dried The washings are preconcentrated and analyzed by IC
Detection limits of low to subnanogram per cubic meter concentrations of most gaseous
and particulate constituents can be readily attained The instrument has been extensively
field-tested some field data are presented Resuhs for the first attempts to decipher the
total anionic constitution of urban ambient aerosol by IC-MS analysis are also presented
A Continuous Analyzer for Soluble Anionic Constituents and Ammonium in Atmospheric Particulate Matter
A new continuous soluble particle collector (PC) is described in Chapter IV this
device does not use steam Preceded by a denuder and interfaced with an ion
chromatograph this compact collector (3 in od ~5 in total height) permits automated
collection and continuous extraction of soluble anions and ammonium ion in atmospheric
particulate matter The PC is mounted atop a parallel plate wetted denuder for removal of
soluble gases The soluble gas denuded air enters the PC through an inlet One version
of the PC contained an integral cyclone-like inlet For this device penetration of
particles as a ftinction of size was characterized In the simpler design the sampled air
12
enters the PC through a nozzle and deionized water flows through a capillary tube placed
close to the exit side of the nozzle by Venturi action or is forcibly pumped The resulting
water mist attaches to the aerosol which impacts on a hydrophobic PTFE membrane
filter that constitutes the top of the PC and the airfiow exit Water drops coalesce on the
filter and fall below into a purpose-machined cavity equipped with a liquid sensor The
water and the dissolved constituents are aspirated by a pump and pumped onto serial
cation and anion preconcentrator columns Ammonium captured by the cation
preconcentrator is eluted with NaOH and is passed across an asymmetric membrane
device which allows the ammonia from the alkaline donor stream to diffuse into a
deionized water receiver stream flowing countercurrent The conductivity of the receiver
effluent is measured and provides a measure of ammonium The anions on the anion
preconcentrator column are eluted and measured by a fully automated ion
chromatography system The total system thus provides automated semicontinuous
meastirement of soluble anions and ammonium With a 15-min analytical cycle and a
sampling rate of 5 Lmin the limit of detection (LOD) for ammonium is 8 ngm^ and
those for sulfate nitrate and oxalate are lt01 ngm^ The system has been extensively
field tested
Semi-Continuous Measurement Of Major Soluble Gaseous And ParticulateConstituents In Several Major Us Cities
The data collected in field measurement campaigns launched at or in the vicinity
of three major urban US cities and one suburban area are presented in Chapter V All of
measurements were conducted in the summertime The chapter focuses on data collected
13
during TexAQS 2000 (Texas Air Quality Study Houston TX) NEOPS 2001 (North East
Oxidant and Particle Study Philadelphia PA) BRACE 2002 Study (Bay Region
Atmospheric Chemistry Experiment Tampa FL) and a measurement campaign in
Lindon UT a suburban location in 2002 Incidents that highlight the importance of
continuous analysis in better understanding gas-particle partitioning heterogeneous
chemistry of PM formation relations between PM growth and precursor gases are
investigated An overview of the observed chemistry at the different sites is also
presented
14
References
1 Skoog D A West D M Holler F J Fundamentals of Analytical Chemistry New York 1992 Ch28 712-713
2 English translation of the lecture is available Berezkin V G Compiler Chromatographic Adsorption Analysis Selected Works ofM S Tswett New York Ellis Horwood 19909-19
3 Isaac H J Ed A century of separation Science New York Marcel- Dekker 2002
4 Centermial Symposium on Chromatography organized by Analytical Chemistry and History of Chemistry Divisions of the American Chemical Society 226 National Meeting of the American Chemical Society
5 Heftmarm E Chromatography adsorption partition ion exchange electrochromatography column slab paper gas New York Reinhold Pub Corp 1961 ChI 2 1-78
6 Poole C F Pool S K Chromatography today New York Elsevier 1995
7 Small Hamish Ion chromatography New York Plenum Press 1989
8 Fritz J S Gjerde D T Ion Chromatography 3 Ed Weinheim New York Wiley-VCH 2000
9 Strong D L Dasgupta P K Friedman L Stillian J R Analytical Chemistry 63 1991480-486
10 Strong D L Young C U Dasgupta P K Friedman L Journal of Chromatography 1991 546 159-173
11 Spedding F H Voight F H Gladrow E M Sleight N R Journal of the Am ChemSoc 1981692777-2781
12 Nair L M Kildew B R Saari-Nordhaus RJ Chromatogr A 1996 739 99
13 Weiss J Ion Chromatography T^ Ed Weinheim Germany VCH 1995 43-55
14 Stillan J R Pohl C A J Chromatogr 1990 499 249 - 266
15 FritzJ SStoryJN^laquoa Czew 1980521519
15
16 Jensen D Weiss J Rey M A Pohl C A J Chromatogr 1993 640 65
17 Small H Stevens T S Bauman W CAnal Chem 1975 47 1801 - 1809
18 Stevens T 8 Davis J C Small H Anal Chem 1981 53 1488
19 Stillan J R LC Mag 1985 3 802
20 Strong D L Dasgupta P K Anal Chem 1989 61 939 - 945
21 Henshall A Rabin S Statier J Stillian J Am Lab 1992 24 20R
22 Sjogren A Dasgupta P K Anal Chem 1995 67 2110 - 2118
23 Chow J C Watson J G Lowenthal D H Egami R T Solomon P A Thuillier R H Magiliano K Ranzeiri A Atmos Environ 1998 32 2835 - 2844
24 Tanner R L Parkhurst W J 1 Air amp Waste Manage Assoc 2000 50 1299 -1307
25 Brook J R Dann T F Burnett R l-JAir amp Waste Manage Assoc 1997 47 2-19
26 Wang H Shooter D Atmos Environ 2002 36 3519 - 3529
27 Al-Horr R Dasgupta P K Adams R L Anal Chem 2001 73 4694 - 4703
28 Boring C B Al-Horr R Genfa Z Dasgupta P K Martin M W Smith W F Anal Chem 2002 74 1256-1268
29 Dasgupta P K Sampling and Sample Preparation Techniques for Field and Laboratory 2003 Ch 5 97 -160
30 Dasgupta P K ACS Adv Chem Ser 232 1993 41 -90
31 Simon P K Dasgupta PK^i7a Chem 65 1993 1134-1139
32 De Santis F Anal Chem 66 1994 3503 - 3504
16
K OH X
Anode
+ O2 [H^
+ OH ^ H2O
K
KOH H2
Cathode
H2O
3 Cation Exchange membrane
H - bull
X ^ Cation Exchange membrane
H2O lt-
Figure 11 Schematic of electrolytic suppressor mechanism X is the analyte anion
17
CHAPTER II
TWO-DIMENSIONAL CONDUCTOMETRIC DETECTION
IN ION CHROMATOGRAPHY SEQUENTIAL
SUPPRESSED AND SINGLE COLUMN
DETECTION WITH PASSIVE HYDROXIDE
INTRODUCTION
Introduction
Ion chromatography (IC) continues to play a leading role in many areas of
analytical chemistry with applications that range from trace analysis in semiconductor
fabrication to environmental analysis Small et al pioneered the technique of suppressed
conductometry in 1975 it is still considered the key feature that distinguishes IC from the
liquid chromatographic analysis of ions The mainstay of IC is in the analysis of anionic
analytes and we will therefore confine our attention to this area with the note that
identical considerations apply to cation analysis systems
From a standpoint of detectability suppression is greatly beneficial in the
determination of strong acid anions and even for anions derived from weak acids at least
up to pKa values of 4 It is integral to the practice of modem IC detection limits that
result from removing the conductive eluent ions and converting the analyte to a highly
conducting acid are tmsurpassed by other techniques
However weak acid anions are not easily detectable by suppressed IC Anions
derived from acids with pKagt7 are virtually undetectable Hence the concept of
converting such weakly dissociated acids to more dissociated compounds was developed
Berglund and Dasgupta published a series of papers in which the weak acid HX was
converted by two sequential steps (HX^ NaX -^ NaOH) to NaOH^ or in a simultaneous
cationanion exchange step to LiF^ The best results were however achieved by
combining both suppressed and single column IC Following a conventional suppressed
IC a controlled amount of NaOH was electrically introduced into the detector effluent by
a microelectrodialytic NaOH generator (MENG) With a ~01 mM NaOH background
the noise level was 20 nScm the exact band dispersion was not measured ^ In a
subsequent more detailed paper the dispersion was measured to be 94 ^L for a device
of 15 mm active length Further developments led to planar MENG devices that
exhibited noise levels as good as 8 nScm with band dispersions in the range of 78-90
tL
Caliamanis et al have developed an altogether different approach A commercial
suppressor unit bearing cation exchange membranes and an NaOH-EDTA external
bathing solution is used to convert HX to NaXdeg Yuan et al suggested operating a
suppressor in a mode such that the eluent is just short of completely neutralized
However it is very difficult to maintain such a system with a constant low-noise
environment background
The work described in this chapter elaborates on previous studies that utilized
base introduction after a conventional suppressed IC It is the added and different
dimensionality brought about by the additional detector that makes the overall approach
attractive It differs from other work in that passive rather than electrodialytic base
19
introduction is used requiring no electronic control Further different commercially
available membranes have been studied in different physical designs and in different
thickness with different bases to determine the optimum conditions so that results as good
as the best of the previous electrodialytic base introduction efforts can be realized in a
simpler maimer The recent commercial availability of electrodialytic eluent generators^
capable of producing highly pure hydroxide eluents which lead to nearly invariant
backgrounds even with gradient elution makes two-dimensional ion chromatography
(2DIC) more attractive than ever before
Principles
Analytes elute from a suppressor as an acid HX (when we are concerned with
weak acids even if a given analyte may be multiprotic consideration of ionization
beyond the first proton is tinnecessary) The suppressed conductometric signal is related
to 05(AH+ + x-)((Ka + 4CKa)deg^ - Ka)) where C and Ka are the eluite concentration and
the dissociation constant of HX respectively under conditions where autoionization of
water can be neglected For most practical purposes the presence of frace acids in the
background whether from regenerant leakage in a chemically regenerated suppressor or
from omnipresent CO2 is a more meaningful concern than the autoprotolysis of water
Figure 21 depicts the nature of the problem All of these computations were carried out
with the following assumptions temperature 25degC monoprotic acid analytes HX (with
Xx- equal to 50 and pKa ranging from strong acid to 10) and the analyte concentrations
represented in the abscissae are those at the point of measurement in the detector
20
(injected concentrations would typically be an order of magnitude higher accounting for
typical cliromatographic dispersion) Numerical computations were carried out on the
basis of solving the complete charge balance equation for a given system using the
nonlinear curve fitting capabiHties of Microsoft Excel Solver with a numerical accuracy
of seven significant digits in the computed H^ concentration Specific analyte
concentrations solved were 01 03 1 3 10 30 and 100 |jM and the lines shovm are
spline-fits through these points Panel a shows the situation for a hypothetical pure water
backgrotmd For clarity the first three panels are in log-log scales The minimum
ordinate value is 1 nScm slightly below the current state of the art of the noise levels
encotmtered in suppressed hydroxide eluent anion chromatography Realistically 10
nScm is the level at which a peak could be detected by a current state-of-the-art system
In general at low analyte concentrations there is little difference from a strong acid
down to a pKa of about 5 Past a pKa of 7 the response begins to decrease about 1 log
unit with each log unit decrease in Ka The possibility that acids with pKa gt7 can be
detected at low concentrations is obviously remote In reality when auxiliary acids such
as CO2 (in panel b assuming 10 |aM ECO2 120 ppb total inorganic C background 076
nScm pure water saturated with atmospheric CO2 contains 13-17 |aM iC02) or H28O4
(in panel c assuming I iM H2SO4 typical minimum leakage from a chemically
regenerated suppressor resulting in a background of 086 nScm) are present the
detectability of weaker acids deteriorates considerably In panels b and c the pKa 10 case
disappears from the viewing region and in fact it is clear that there is little hope of
detecting acids weaker than pKa of 7 even at relatively high concentrations In addition
21
the detectability of a weak acid analyte in a real matrix that may contain other more
ionized constituents at higher concentrations is likely to be far worse if there is any
possibility of co-elution Even when a weak acid analyte elutes on the tail of a stronger
acid peak it may never be seen both due to the suppression of ionization of the weak
acid and due to the intrinsically lower response
The introduction of a low but constant concentration of a strong base to the
effluent from the above conventional suppressed conductometric IC system prior to
detection by a second conductivity detector has been proposed previously An analysis
of the relative response behavior is noteworthy Figtire 2 Id shows (in a linear scale) the
response behavior of analytes from a strong acid to a pKa of 10 for the 10 ^M SCO2
background as well as the responses resulting from the second detector upon
introduction of 125 ]xM NaOH (no volumetric dilution or dispersion is assumed the
backgrotmd is -25 |jScm such signals have no significant dependence on whether some
weak or strong acids such as CO2H2SO4 are present in the background) These signals
appear as negative peak responses (which they are) For a strong acid HX with Ax- of 50
the response is 37 in magnitude for the base introduction system relative to that of the
conventional suppressed system (increases to 48 for Ax- of 20) For the strong acid
case this represents a 2-3-foId loss of sensitivity and is not attractive However the base
introduction system shows the same response (within plusmn38) from a strong acid to an
analyte with a pKa of 8 a response comparable in magnitude to the response of an analyte
with a pKa of 5 in a suppressed IC system but with better linearity With analytes of pKa
gt5 the base introduction response is favored by one order of magnitude with each order
22
of magnitude decrease in Ka With analytes of acidity weaker than a pKa of 8 the pH
afforded by the introduction of 125 iM NaOH is insufficient to maintain full ionization
By the time a pKa of 10 is reached the sensitivity has decreased to 40 of that for the
corresponding case of a strong acid but it is still four orders of magnitude more sensitive
than the corresponding suppressed detection response Indeed the response in the second
detector to an analyte of pKa 10 is significantiy better than that of an analyte of pKa 6 in
the first detector with much better response linearity
1 7
The linearity of response is best examined with a Cassidy plot as shown in
Figure 22 It is interesting to note that in the absence of a strong acid in the background
theory predicts that there will be considerable nonlinearity in the response at very low
analyte concentrations in the conventional suppressed conductometric detection mode
This behavior is due to the pliant nature of the baseline which in the limit is constituted
of water a weakly ionized acid Appearance of an analyte peak on the baseline causes
decreased dissociation of the background constituents similar to the subsidence of soil
upon erecting a stmcture This was quantitatively probed for carbonate eluents by
Doury-Berthod et al^ where a large amount of carbonic acid is present as the
background but at the detection limits possible today this behavior will be expected at
low analyte concentrations even with pure water as background The fact that sufficient
strong acid may be present in a real eluent background (even one electrodialytically
generated) can constittite a blessing in disguise in so far as response linearity at low
concentrations is concerned All responses shown in Figure 22 assume a 10 ^M CO2
background which may be the least contaminated background that can be attained in
23
practice In the conventional detection mode the response per unit concentration is
initially low due to the CO2 background and also decreases at the high concentration end
for all but a strong acid analyte As a result analytes of intermediate pKa values most
notably at 4 and 5 show a peak in sensitivity as a function of concentration The general
nonlinearity of response and the drastic decrease in response at analyte pKa values gt6 is
apparent in this depiction in marked contrast to the essentially uniform response for the
base introduction detection mode at least up to a pKa value of 8 The latter also shows
usable response up to a pKa value of 10
In the present system negatively charged hydroxide ions are introduced through a
negatively charged cation exchange membrane Donnan-forbidden ion penetration^ is the
mechanism of base introduction The relevant parameters are thus (i) the concentration
gradient across the membrane (ii) the characteristics of the membrane and (iii) nature of
the cotmterion accompanying OH The penetration rate of the forbidden ion decreases
with increasing size and charge^ and introduction of OH is thus easier than most other
anions The penetration rate is also inversely related to the membrane thickness and
directly to the available surface area These parameters are optimized in this work
Experimental Section
Figure 23 represents the system used in this work The base introduction device
was placed between two conductivity detectors The system temperature was controlled
at all times by placing columns detector cells the base introduction device and all
connecting tubing in a chromatographic oven
24
Base Introduction Device
Three different devices designs were investigated (see Figure 24) Device A is
made up of two Plexiglas blocks each containing an inscribed channel (06 x 06 x 40
mm) with 10-32 threaded ports that connect them to the outside Platinum wires (03 x
15 mm) partially fill the channels and exit through additional independent 10-32 threaded
ports as shown These wires are used as electrodes connected to a constant current
source for electrodialytic introduction of base The cation exchange membrane is placed
between the blocks and separates the two fiow channels bolts hold the blocks together
Several different cation exchange membranes were investigated Donor hydroxide
solution fiows through one channel while the suppressed effluent from the first
conductivity detector Dl flows through the other side to detector cell D2
The other two designs are based on perfluorosulfonate Nafionreg membrane tubing
Terminal bores of 15 mm OD 025 mm bore PTFE tubes were enlarged by drilling
Nafion tubes the terminal ends of which are strengthened by PTFE or PEEK tubular
inserts can be put into the end-enlarged PTFE tubes and sealed by standard compression
fittings Each end terminates in a tee such that the donor base solution can be made to
flow in a jacket that connects the two tees and surrounds the Nafion tube Device B uses
a 90 mm long Nafion tube in a linear configuration Two membranes were tested with
respective dry dimensions of 035 x 0525 and 030 x 040 mm (ID x OD) Device C
represents the third design in which a 025 mm nylon monofilament filled Nafion tube
(250 X 030 ID x 040 mm OD) was coiled into a helical stmcture before incorporation
25
into an external jacket following the design of a filament-filled annular helical (FFAH)
20
suppressor
All experiments were carried out with a DX-500 ion chromatography system
consisting of a GP-40 gradient pump equipped with a degasser an LC-30
chromatography oven an EG-40 eluent generator and CD-20 and ED-40 conductivity
detectors All connections utilized 025 mm polyether ether ketone (PEEK) tubing For
chromatography Dionex AG 11 and AS 11 guard and separator columns were used Data
collection and analysis utilized PeakNettrade 51 all from Dionex Corp (Sunnyvale CA)
All experiments were carried out at 30degC with a chromatographic flow rate of 1 mLmin
All conductance values are corrected to 25 degC assuming a temperature coefficient of
17degC Except as stated the hydroxide flow rate was 05 mLmin (observed values
were affected at flow rates less than 04 mLmin) and 100 mM KOH was used as feed
Band Dispersion Measurements
Band dispersion was calculated as the square root of the difference between the
squares of the band half-widths of the first and second detector response^ Band
dispersion calculated in this way decreases with increasing band volumes Dispersion
affects sharp narrow peaks more than it affects broad peaks Therefore band dispersion
was computed on sharp early eluting peaks of 025 mM acetate (injection volume 25 ^L
5 mM KOH eluent)
26
Results and Discussion
Electrodialytic Base Introduction through Different Membranes
Most ion exchange membranes are available in sheet form Base introduction
capabilities were therefore tested with device design A (Figure 24a) which allowed both
electrodialytic and Donnan-forbidden passive penetration to be tested Baseline noise
was taken to be the standard deviation of the baseline over a 15 min period Figure 25
shows the background conductivities generated with different membranes as a function of
the current Exact Faradaic behavior and a membrane with no zero current leakage will
result in a backgrotmd conductance of 271 )aScm (100 |jM KOH) for a drive current of
160 [lA This ideal behavior is shovm as the thick solid line The behavior of most of the
membranes falls into one group and a collective best fit drawn through them is shown as
a second line This exhibits a small background bleed (ca 11 jiScm ~4 [M KOH) and
a mean slope that is 78 of theoretical One membrane a radiation grafted PTFE cation
exchange membrane falls in a class by itself and exhibits very significant zero current
penetration of 168 |LiScm (over 60 |aM KOH) and a relatively low current dependence of
KOH generation (47 of Faradaic)
The background noise levels observed with the different membranes are
obviously of interest since they control the detection limits that could ultimately be
attained Figure 26a shows the noise levels observed as a function of background
conductance It is clear that the strong cationic Teflon membrane again falls in a class by
itself by providing the lowest background noise However since this membrane also
exhibits a very high zero current background conductance it is instmctive to look at the
27
noise as a fimction of the electrodialytic drive current this is shown in Figure 26b In
this depiction the noise appears to be largely independent of the membrane Rather it is
linearly proportional to the electrodialytic drive current If microbubbles of electrolytic
gas the amount of which is expected to be proportional to the drive current is the
dominant contributor to the observed noise then this behavior is understandable
Whether or not bubbles are specifically involved the data strongly suggests that the
observed noise in the backgrotmd conductance is directly related to the drive current
more than any other factor
Passive Introduction of Base through Different Membranes
The foregoing experiments suggested that the simpler expedient of passive
Donnan-forbidden introduction of base to the desired extent (ca -100 |aM) may not only
be possible but may be desirable from a standpoint of background noise It has been
suggested in previous studies^ that when maintaining a sufficient flow rate prevents
buildup on the receiver side the Donnan penetration rate (A) of the forbidden ion is a
quadratic function of the feed concentration (m) as follows
m^ = aA^ + pA + Y (21)
where a and P are positive constants and y is a constant of either sign
Figure 27 shows the observed concentration of KOH in the receiver (as determined from
the conductance) as a ftinction of the feed concentration for several different membranes
28
The line through the points is the best fit for each case to eqn21 above The Dow
perflurosulfonate ionomer (PFSI) membrane and the thin grafted Teflon membrane both
have very high penetration rates and desired degree of Donnan leakage can be achieved
with relatively low feed concentrations The Dow PFSI was an experimental material
available in very limited quantity and further work was done with the thin Teflon
membrane only
Dependence of Penetration Rate on the Nature of the Cation
Hydroxides of the alkali metals LiOH NaOH KOH and CsOH were used
individually as feed solutions and the penetration rates were measured for the thin Teflon
membrane The penetration rates shown in Figure 28 are in the order
LiOHraquoNaOHgtKOHgtCsOH and directly reflect the order of the ion exchange affinities
of these ions for cation exchange sites Li being the most easily replaced This is logical
since one would expect that ion exchange sites on the feed side of the membrane to be
saturated with the metal ion (both because of its high concentration and high alkalinity)
such that the overall rate is likely to be controlled by the rate which the metal ion leaves
the membrane on the receiver side Note that this behavior is opposite to that expected
for diffusive transfer through a passive eg a dialysis membrane because the diffusivity
is much lower for the large solvated Li^ ion than the Cs ion
Regrettably these series of experiments were performed after most other
experiments described in this chapter It is obvious that for base introduction purposes it
should be preferable to use LiOH even though KOH was used for most of the
29
experiments in this study For detection after base introduction one is interested in
maintaining some constant concentration of base introduced Because LiOH has the
lowest equivalent conductance among the alkali hydroxides it also provides the least
background conductance at the same concentration (the conductance due to 100 |LtM
MOH is 237 249 272 and 276 ^Scm for M = Li Na K and Cs respectively) and
should therefore provide the least conductance noise at the same background base
concentration
Effects of Temperature on Penetration Rate
The effect of temperature was examined for KOH penetration through the thin
Teflon membrane from 25degC to 40degC The penetration increased from 625 xM to 684
I M essentially lineariy 039 degC
Effects of Membrane Thickness on Penetration Rate
It is intuitive that penetration rate should increase with decreasing membrane
thickness and the data in Figure 27 already provide some support towards this
However the membrane types differ in that experiment and no clear conclusions can be
drawn The two tubular membranes used for the constmction of device B were identical
in length but varied in radial dimensions (525 x 350 vs 400 x 300 [im in od x id
respectively) Compared to the first the second tube provides a 42 lower extemal
surface area but the wall thickness is also 43) lower The data presented in Figure 29
makes it clear that the wall thickness is by far the dominant factor A complete
30
understanding of the exact dependence would have required the same membrane in
different thicknesses this was not available In the above experiment the decrease in
inner diameter increases the flow velocity by 36 at the same volumetric flow rate this
may also have a small effect on increasing the penetration rate by decreasing the stagnant
botmdary layer thickness
Device Performance Noise and Dispersion
As previously noted experiments with device A showed passive penetration was
superior in terms of noise performance than electrolytic introduction of base The
conductance noise level measured directly at the exit of device A fabricated with the thin
Teflon cation exchange membrane with KOH feed concentration adjusted to produce
-100 i M KOH in the effluent was 28plusmn2 nScm It was observed also that incorporation
of lengths of connecting tubing between the base introduction device and the detector
reduces the noise This suggested that mixing within the device is incomplete
Incorporation of a 075 mm id 750 mm long mixing coil woven in the Serpentine II
design^ reduced the noise level to 7 plusmn 2 nScm However the band dispersion induced
by the device already at a significant value of 96 plusmn 8 ixL increased by a further 55 |iL
with the addition of the mixing coil
Both versions of device B exhibited noise levels similar to that of Device A
(without mixer) However dispersion in straight open tubes is the highest of all^ and
even with the narrower membrane tube the band dispersion was measured to be 110 plusmn 4
31
nL (148 plusmn 6 |nL for larger tube) Incorporation of a mixer to reduce noise will clearly
make this even worse
A logical solution seemed to be the incorporation of base introduction and mixing
functions within the same device The helical geometry is known to induce good mixing
while minimizing band dispersion due to the development of secondary flow that is
perpendicular to the axial flow This secondary flow flattens the parabolic profile of the
axial flow velocity observed in a linear tube and leads to both reduced axial dispersion
and increased radial mixing inside the tube^^^ FFAH devices albeit of somewhat larger
dimensions have previously been used as suppressors^^^^
Built along this design Device C indeed exhibited the best performance Even
though the tube itself was nearly three times as long as device B the band dispersion was
measured to be 78plusmn 4|jL Under isocratic elution conditions the noise level was
measured to be 5 plusmn 2 nScm and 10 plusmn 2 nScm under a demanding steeply changing
gradient elution condition Because of its larger surface area relative to device B a lower
concentration of feed KOH is needed to reach a -100 i M concentration in the receiver
At 30 degC a 50 mM KOH feed leads to a background conductance of 28 )iScm with an
eluent flow rate of 1 mLmin Under a given feed condition the penetration of KOH
remains constant In one experiment the flow rate of 35 mM of electrodialytically
generated KOH used as eluent was varied between 05 to 175 mLmin in 025 mLmin
increments The electrodialytically suppressed conductance always remained below 08
^Scm The suppressor effluent (essentially water) was passed through a FFAH device
with 65 mM carbonate-free KOH (electrodialytically generated by a second
32
electrodialytic generator) acting as feed The observed background conductance was
linearly related to the reciprocal of the eluent flow rate with a linear r value of 09999
The device showed excellent reproducibility Taking borate a classic weak acid
analyte the reproducibility at the 50 (xM injected level was 20 in RSD the SN= 3
limit of detection was 06 iM (65 ppb B 25 [iL injection 15 pmol) with a linear r value
of 09997 for response in the 5-100 |LIM range (7 mM KOH isocratic elution XR -63 min)
This performance is notable because boric acid has a pKa of 923 and under the above
conditions elutes as a relatively broad peak (w -40 s) Response from 06 [iM borate
(and several other ions at trace levels) is shown in Figure 210
Base Introduction versus Ion Exchange The Effect of Device Design
Different membrane devices are commercially available as suppressors The
purpose of such devices in anion chromatography is to exchange large concentrations of
eluent cations and as such requires significant ion exchange capacities As a result such
suppressor devices are often designed with ion exchange screens in between ion
exchange membranes^ these screens are particularly valuable in gradient elution
because of their ability to provide reserve ion exchange capacity While these devices
can undoubtedly be used for base introduction it is to be noted that they are capable of
ion exchange on the screens without immediate and concomitant base introduction This
process can occur in addition to the base introduction process Note that when the sole
process is introduction of the base MOH through the membrane the reaction that occurs
33
for any analyte HX (within the limits that HX does not exist as an unionized acid at a pH
of~10(-100|aMMOH))is
MOH + HX ^ MX + H2O (22)
In this case all signals are uniformly negative and the signal intensity is controlled by the
analyte concentration and the difference in equivalent conductance between the analyte
ion and OH If the analyte HX is significantiy ionized the resulting H^ can be ion
exchanged for M at the interior membrane surface
J ^ membrane bull n aq mdash^ H membrane + M aq (2 3)
Processes 22 and 23 cannot be distinguished in practice because the M that is being
exchanged at the membrane surface would have otherwise been introduced as MOH
There is the apparent difference in principle that process 22 results in a production of an
additional water molecule In practice with trace level analysis the difference in the
hydration of ions in the membrane vs free solution and the high water permeability of
all ion exchange membranes will make it impossible to differentiate processes 22 and
23 If however the same process as that in 23 occurs on the ion exchange screens the
outcome will be different
M ^ e r e e n + H ^ Hcreen + M V (24)
34
The screen ion exchange sites are regenerated on a much slower scale and process 24
will therefore lead to the production of MX in addition to the introduction of MOH For
poorly ionized analytes only process 22 can occur But for ionized analytes processes
2223 and 24 can occur in competition If the latter dominates the resuh will be a
positive MX peak atop a MOH background (The screen sites will be regenerated more
slowly basically resulting in an eventual change in baseline) The results of using a
suppressor for base introduction purposes result in the chromatograms shown in Figure
211 This behavior obviously results in an interesting and immediate differentiation
between strong and weak acid analytes and may be useful in some situations The
possibility of co-eluting peaks in opposite directions may however complicate
interpretation of the data in real samples
Illustrative Applications
Figure 212 shows a 2-D chromatogram with the two detector signals being
shown for several strong and weak acid anions Weak acid analytes such as arsenite
silicate borate and cyanide are invisible in the first detector and produce easily
measurable responses in the second detector
Previous work has elaborated on how such 2-D data can be exploited for the
diagnosis of co-elution estimation of analyte pKa values calculation of analyte
equivalent conductance (and thereby provide a means of identification) values and
perform universal calibration^^ The advent of commercial electrodialytic eluent
generators has made possible nearly pure water backgrounds which in conjunction with
35
passive base introduction devices make the practice of 2-D IC detection simpler more
sensitive and attractive than ever User-friendly software that can fully utilize the 2-D
data is needed for the complete exploitation of the technique Recent advances in the
understanding of ion exchange devices in ion chromatography may even make possible
3-D detection schemes (HX MX MOH) ^ However even the present state of
development provides a very useful tool to the interested user as detailed below
Filter samples of airborne particulate matter have been collected and analyzed by
ion chromatography for example during the supersite campaigns in Houston and
Philadelphia^^ While major components such as sulfate nitrate chloride etc are
readily identifiable and quantifiable there are numerous other analytes also present in
these samples that are often hidden by the major analyte peaks Even with IC-MS co-
elution makes identifying the occtirrence and identification of trace constituents a very
challenging task (Contrary to popular belief IC-MS provides considerably poorer
detection limits than either of the detectors in 2D IC when a total ion scan must be
conducted for a totally unknown analyte) Figure 213 shows a 2D chromatogram of an
air filter sample extract collected in Houston during the summer of 2000 Note that the
data immediately reveals that the asterisked peak is clearly an acid weaker than a
common aliphatic carboxylic acid (see response to acetate in Figure 212) This
information would have been impossible to discem by any other means Of the
numerous other nuances that are present in this chromatogram but are too difficult to see
without further magnification I focus only on the 18-21 min region The peak at -19
min is completely invisible in the suppressed chromatogram and must be due to a very
36
weak acid The peak at -20 min is seen as a perfectly clean Gaussian response in the
suppressed chromatogram while the second dimension immediately reveals that it is
actually a mixture of two partially co-eluting analytes probably in an approximate ratio
o f - l 3
In summary 2DIC in its presently developed form is simple to implement and
practice and asides from improving the detectability and response linearity characteristics
of weak to very weak acids it provides a wealth of information that is otherwise difficult
or impossible to obtain
37
References
1 Small H Stevens T S Bauman W S Anal Chem 1975 47 1801-1809
2 Dasgupta P K Anal Chem 1992 64 775A-783A
3 Strong D L Joung C U Dasgupta P K I Chromatogr 1991 546 159-173
4 Strong D L Dasgupta P K Anal Chem 1989 61 939-945
5 Berglund I Dasgupta P K Anal Chem 1991 63 2175-2183
6 Berglund 1 Dasgupta P K Anal Chem 1992 64 3007-3012
7 Berglund I Dasgupta P K Lopez J L Nara O Anal Chem 1993 65 1192-1198
8 Sjogren A Dasgupta P K Anal Chem 1995 67 2110-2118
9 Sjogren A Dasgupta P K Anal Chim Acta 1999 384 135-141
10 Caliamanis A McCormick M J Carpenter P D Anal Chem 1997 69 3272-3276
11 Caliamanis A McCormick M J Carpenter P D Anal Chem 1999 711A-1A6
12 Caliamanis A McCormick M J Carpenter P D J Chromatogr A 1999 850 85-90
13 Caliamanis A McCormick M J Carpenter P D J Chromatogr A 2000 884 75-80
14 Huang Y Mou S Liu K J Chromatogr A 1999 832 141-148
15 Liu Y Avdalovic N Pohl C Matt R Dhillon H Kiser R AmLab 1998 30(22) 48C Liu Y Kaiser E Avdalovic N Microchem J 1999 62 164-173
16 Walsh S Diamond D Talanta 1995 42 561-572
17 Cassidy R M Chen L C LCGCMag 199210 692-696
38
18 Doury-Berthod M Giampoli P Pitsch H Sella C Poitrenaud C Anal Chem 1985 57 2257-2263
19 Dasgupta P K Bligh R Q Lee J DAgostino V Anal Chem 1985 57 253-257
20 Dasgupta P K Anal Chem 1984 56 103-105
21 Waiz S Cedillo B M Jambunathan S Hohnholt S G Dasgupta P K Wolcott D K Anal Chim Acta 2001 428 163-171
22 Dasgupta P K Anal Chem 1984 56 96-103
23 Dasgupta P K US Patent 4500430 1985
24 Stillian J R LCraquoGC Mag 1985 3 802-812
25 Srinivasan K Saini S Avdalovic N Recent Advances in Continuously Regenerated Suppressor Devices Abstract 136 2001 Pittsburgh Conference New Orleans LA March 2001
26 httpwwwutexaseduresearchyceertexaqsindexhtml http wwwcgeny comNarsto
27 Samanta G Boring C B Dasgupta P K Anal Chem 200113 2034-40
39
LLOpoundp ^sajx lsa jgt^^ tUDysnesuodssu gtiestl
40
strong acid H2S04 background
040 Strong acid
pure H20 bgnd
gt Z5 u-0)
E
lt) c
CO
020
000
OOE+0 20E-5 40E-5 60E-5
Peak Concentration eqL 80E-5
-pK10
- pK9 pK8
Strong acid
10E-4
Figure 22 Cassidy plot of response sensitivity in linear axes An ideally linear response produces a flat curve of zero slope The top trace asstunes a 1 M H2SO4 background all others assume a 10 |jM CO2 background
41
EEG
r^QU Oven Enclosure
1mdash1 p
Water
Gas Pressure
KOH
Figure 23 Experimental system Key P chromatographic ptimp (1 mLmin) EEG electrodialytic eluent generator V injection valve(25 i L) GC AGl IHC (4 mm) guard SC AS 1 IHC separator EDS electrodialytic suppressor Dl first detector BID base introduction device D2 second detector R exit restrictor KOH flow into BID is 05 mLmin by nitrogen pressure
42
flow out
(A) flow In
plexiglass slab
metal win
flow channel
metal wire connected to current source
screw hole
bullmA^
KOh Out
Device B
KOMIn
n Eluite out
Device C
Eluite out
Figure 24 Base introduction device designs (a) planar sheet membrane design that can be operated electrodialytically or by Donnan leakage (b) straight tube in shell design and (c) filament-filled annular helical design
43
3000
E
(U O c CD
bullc bull D C o O
2000
1000
000
V n A o 0 o o
Fit All other Membranes
Thin PTFE RAI
Nafion 417
Dionex
Nafion 117
Asahi Glass Selemion
Sybron MC 3470
Asahi Glass CMV
Asahi Glass Flemion
000 4000 8000 12000 Current uA
1 1 1
16000 20000
Figure 25 Ctirrent efficiencies observed with electrodialytic devices with different
membranes
44
V 012 - ^ bull
A O o
Si
Thin Radiation Grafted PTFE (RAI) 007 mm
Nafion 417 043 mm
Dionex radiation grafted memrane 010 mm
Nafion 117 018 mm
Asaiii Glass Selemion 015 O ^ ^
Asahi Glass Flemion 015 mm -COOH
(a)
1 r 000 4000 8000 12000 16000
Current uA 20000
Figure 26 Backgrotmd noise in electrodialytic devices with different membranes as a function of (a) the observed conductance (01 mM KOH) 272 |iScm) and (b) the electrodialytic drive current Internal flow 1 mLmin in this and subsequent figures
45
40 -n
E
ltD o c j5 o T3 C o O o o Q
CO
30
20 mdash
10
0 mdash
+
Dow PFSI 015 mm r 2 10000
Thin Teflon 007 mm r 2 09947
RAI 010 mm r2 09996
Asahi Flemion 015 mm r 2 0995
Nafion 117 018 mm r 2 09996
Nafion 417 043 mm r 2 09986
000 020 040 060 Feed KOH Concentration M
080
Figure 27 Passive Donnan leakage of KOH through various sheet membranes as a function of feed KOH concentration
46
080 -n
c o (0
c 0) o c o o X O T3 0 CD 0 C 0 O
060 mdash
040 mdash
020
000
Eluent Flow 1 mLmin
LiOH
O NaOH
A KOH
+ CsOH
4^A
O A
A
A
O A
n ^ ^ ^ r 100 200 300 400
Feed MOH Concentration mM 500
Figure 28 Donnan leakage of different alkali hydroxides through the RAI PTFE membrane
47
025 mdash1
Device B 0525 x 035 mm od x id 90 mm long
O Device B 040 x 030 mm od x id 90 mm long
40 80 120 Feed KOH mM
160 200
Figure 29 Dependence of Donnan leakage on tubular membrane dimensions Nafion membrane tubes are used
48
020 mdash1
000 mdash
E o
o ca
c o
O
-020 mdash
-040 mdash
-060
400 800 1200 Time min
Figure 210 Detection of 06 j M borate in a sample mixture on the second detector This presentation used a moving average routine to reduce baseline noise The SN= 3 LOD will be 06 |4M based on the baseline noise observed in the raw detector signal
49
E o w iL (D O c as o
bullD c o O
3500
3400 mdash
3300
3200 mdash
3100 mdash
3000
Sulfate
Phosphate
J o bulllt S) 3 a o
n - C
ar
cr o 3
figt
o
20 0 Time min
10 20
Figure 211 Second detector response to various analytes using a commercial membrane suppressor (containing an ion exchange screen) as the base introduction device
50
E ^
lt) O c
o 3 bull a c o O
800 mdash
400 mdash
000 mdash
_
-400 mdash
OC
625 nmol nitrate borate acetate sulfate 125 nmol all others
9gt re
4- 0) o lt AS11HC Column Ramp
^ J
0-30 mM KOH 0-10 min Hold at 30 mM till 15 min Ramp to 10 mM 15-20 min Ramp to 20 mM 20-30 min Ramp to 30 mM 30-40 min
ogt bull o g 3 (0
^ - T--- - - - ^ - - ^ r r m i ^ r r
1ft i ^^ il lt W i O raquo
ide
rate
licate enite
I I I
0 1000 2000
^^ _agt re u w
]S re u
ffs
i t o o M
a p^laquo 1 D)
M
o O) -
bull2 pound re i -^
Z 0)
3 laquo j
1 i
_ - - ^ mdash -
i i i
figt lt rbo nate
I
3000 4000
Figure 212 2D ion chromatogram tmder standard conditions using gradient elution 25-|iL injection volume
51
AS11HC 1 mLmin
E u
8 c 3 bullo C
8
400
000
000 2000 4000 Time min
6000
Figure 213 2D ion chromatogram of an air filter sample extract (Houston TX July 2000) The inset shows the 18-21-min region magnified
52
CHAPTER III
FIELD MEASUREMENT OF ACID GASES SOLUBLE
ANIONS IN ATMOSPHERIC PARTICULATE MATTER
USING A PARALLEL PLATE WET DENUDER
AND AN ALTERNATING FILTER-BASED
AUTOMATED ANALYSIS SYSTEM
Introduction
Many instruments exist for the rapid automated determination of gaseous
constituents of ambient air This includes for example all the gaseous criteria pollutants
Diffusion based collecfion and analysis of atmospheric gases have been reviewed In
regard to suspended particulate matter physical parameters such as optical or
aerodynamic size distribution and mass concentration can be relatively readily
determined by a ntunber of available commercial instruments This is not the case for the
(near) real-time determination of chemical composition of the atmospheric aerosol The
quest for instrumentation that can accomplish this objective began some three decades
ago and continues today
Crider^ first demonstrated real time determination of aerosol sulfur with a flame
photometric detector (FPD) by switching a filter that removes SO2 in and out of line In
many early methods potentially interfering gases were first removed and the aerosol
stream was then thermally decomposed under controlled temperature conditions to
characteristic gases that were collected by a diffusion denuder and then measured
53
periodically Much of the effort was directed to the specific measurement of sulfuric acid
and the various ammonium sulfates^ Similar methods were also developed for
ammonium nitrate One ingenious method for measuring aerosol acidity involved gas
phase titration of the aerosol with ammonia^ The flash volafilization (FV) technique of
rapid thermal decomposition of a collected analyte^ became widely used for the
measurement of aerosol sulfate in conjunction with a FPD^ Although determinafion of
nitrates by thermal decomposition was originally considered questionable^ FV- NOx
detection based meastirement of nitrate has been shown not only to be viable^ recent
innovations and adaptations by Stolzenbug and Hering have made it routine This
technique is also promising for the simultaneous measurement of aerosol S by an FPD
and aerosol C by a CO monitor Thermally speciated elemental vs organic carbon
measurements have been demonstrated
Direct introduction of an air sample into an air plasma has been shown to be viable
for the direct measurement of metallic constituents^ More recently Duan et al^ have
described a field-portable low-power argon plasma that tolerates up to 20 air Coupled
to an inertial particle concentrator such an approach may be practical although the
limits of detection (LCDs) are not as yet good enough for use in ambient air For a given
analyte uniquely simple and sensitive solutions may exist Clark et al^ reported that a
single 100 nm diameter NaCl particle can be detected free from matrix interferences
with an FPD
The application of mass spectrometry (MS) to aerosol analysis has had a long and
illustrious history^ Electron and optical microscopic techniques were once believed to
54
be the best route to the analysis of individual particles^ Single particle MS can do this
today and do so in real time^ MS can provide information on not just specific
components such as sulfates and nitrates but on all material present in the particle
While MS may hold the key to the future the cost bulk operator sophistication and the
extensions needed to produce reliable quantitative data presently leave room for other
more affordable techniques
Since much of the aerosol constituents of interest are ionic typical present day
practice of aerosol analysis involves gas removal with a denuder filter collection with
subsequent extraction of the filter by an aqueous extractant and analysis by ion
chromatography (IC) In this chapter a fully automated IC-based approach to near real
time aerosol analysis is described Continuous impaction is one of the most
straightforward approaches to accomplish aerosol collection but it is difficult to collect
very small particles by impaction This problem was solved by introducing steam into the
aerosol flow and allowing the aerosol to grow This general theme has been adapted
and refined by others^deg as well as by this research group and introduced in parallel by a
Dutch group^^ Although other approaches to collecting atmospheric aerosols into a
liquid receiver coupled to IC analysis have been investigated generally these could not
exceed the efficiency of the vapor condensation aerosol collection approach across a
large particle size range
The steam introduction approach is however not without its shortcomings A
small but measurable artifact is caused by the hydrolytic reaction of NO2 which is not
appreciably removed by most denuder systems now in use The resulting product is
55
measured erroneously as particulate nitrite (and to a much smaller extent nitrate) Steam
introduction requires a condensation chamber that increases the size of the instrument
Filter collection also potentially permits differential analysis via sequential extraction
with different solvents not possible with direct collection in a liquidThis chapter
describes a new instrument that is a fully automated analog of manual filter collection
extraction and analysis
Experimental
The instrtunent was constructed using a full tower size personal computer (PC)
case as the housing Various components were anchored or attached directly to the PC
chassis Fully assembled the particle collection and extraction instrument had
dimensions of 55 cm x 76 cm x 76 cm (L x W x H including instrument components
placed outside the computer case)
Gas Removal and Analysis
Soluble gas collection is accomplished with a parallel plate wet denuder (PPWD) The
current PPWD differs from previous designs as follows The denuder is composed of Plexiglas
plates with Teflon spacers Non-glass construction eUminates fragility problems The desired
area of each Plexiglas plate is microstructured to render it wettable The denuder is bolted to a
stand consisting of a support base to which threaded pipe flanges are secured by screws The
threaded ends ofg in id steel piping used as the support stands are secured thereto
56
For the measurement of gases and aerosols with the highest temporal resolution possible
it is necessary to dedicate individual IC units to the gas system and the aerosol system There are
two potential arrangements (a) a PPWD supplying its liquid effluent to an IC dedicated to gas
analysis and a second independent PPWD the gas phase effluent of which is directed to the
particle collection system (PCS) which is coupled to its own IC and (b) a single PPWD
connected to the PCS the liquid effluent from the PPWD and the PCS each going to separate IC
units Even though the latter arrangement may at first seem to be the simpler in all field
experiments the first option has been chosen Among others HNO3 and HCI are two gases
that are of interest and both are known to be sticky the very minimum of an inlet line must be
used On the other hand it is generally desired to measure the aerosol composition in the lt 25
Ijm size fraction necessitating both a cyclone and a gas removal denuder prior to the aerosol
collector The cyclone cannot be placed after a wet denuder because of the growth in size of
hygroscopic aerosols during passage through the denuder Placing the cyclone before the
denuder would entail loss andor undesirable integration of the sticky gases
The general suggested arrangement thus involves the deployment of the gas analysis
denuder in open air (typically immediately on the roof of the shelter where the analytical
instruments are located) without a cyclone and with a very short inlet (lt 5 cm of a
perfluoroalkoxy (PFA) Teflon tubing) The air sample enters the denuder at the bottom A
peristaltic pump located in the instrument shelter pumps the liquid to and from the denuder The
transit time in typical deployment is about 2 min and temporal gas analysis data are corrected for
this transit delay The denuder stand is sufificientiy tall to allow the inlet to be -60 cm off the
support base To minimize interaction of the inlet air sample with the stand components
57
especially in still air the iron support stand from the base to the bottom of the denuder is wrapped
with Teflon tape
The denuder is shown schematically in Figure 31 Each denuder plate is 100 x
55 cm (Vg thick) with the active wettable area of 65 x 42 cm starting 75 cm from the
top and 175 cm from each edge The denuder liquid is forced through a fritted PVDF
barrier to allow even flow down the plate and is aspirated from the apex of the V-groove
45 cm from the bottom edge The two plates are spaced by a 3 mm thick PTFE spacer
The air inletoutlet holes circular at the termini are machined with a contour that
becomes elliptical as they approach the interior of the denuder to allow for a smooth
entranceexit of the airflow PFA Teflon tubing (I ga 83 mm od 75 mm id) fit
tightly into these apertures
The overall airflow arrangement and gas system liquid flow arrangement is shown
in Figure 32a Typically the air sampling rate is 5 Standard Liters per Minute (SLPM)
controlled by a mass flow controller (MFC-D Aalborg instruments AFC 2600D
Orangeburg NJ) A diaphragm pump (PI Gast DOA-PI20-FB) provides the sample
flow the same pump is used for flow aspiration on a filter FC (vide infra) Hydrogen
peroxide (05 mM) is used as the denuder liquid at -05 mLmin on each plate each
stream pumped through disposable mixed bed ion exchange resin columns MB (067 cm
id X 15 cm PTFE column filled with Dowex MR-3 resin) located immediately before
the PPWD liquid entrance ports The effluent streams are aspirated at -1 mLmin from
each plate (using same peristaltic pump but larger tubing 089 mm vs 129 mm id
Pharmedreg tubes are used for input vs aspiration peristaltic pump speed fixed at 6 rpm)
58
to ensure all liquid is aspirated from the bottom of the PPWD The aspirated flow
streams are combined and sent to the IC analysis system consisting of alternating TAC-
LPl anion preconcentrator columns AGl IHC guard and AS 1 IHC separation columns
and an electiodialytically regenerated suppressor (ASRS operated at 50 mA) The
chromatographic system itself consisted of a DX-100 pump and detector with 225 mM
NaOH eluent flowing at 1 mLmin In more recent work an IS-25 chromatographic
pump coupled to an EG-40 electrodialytic eluent generator (155 mM KOH 15 mLmin
LC-30 oven at 29degC) and an ED40 detector used as a conductivity detector (CD) have
been used Chromatography is conducted either on a 10-min or a I5-min cycle A 4-
chaimel peristaltic pump (Rainin Dynamax) is used for all liquid pumping All
chromatographic equipment and columns above and in the following were from Dionex
Corp
Particle Collection Svstem
A Teflon-coated aluminum cyclone (10 Lmin University Research Glassware
URG Chapel Hill NC) is used as the first element of the inlet system to remove particles
larger than 25 i m The cyclone exhibits the desired size cut point only at the design
flow rate Referring to the overall airflow arrangement in Figure 32a the air sample
passes through the cyclone 10 SLPM and is divided by an Y-connector into two flow
streams of 5 SLPM each One is drawn through a 47 mm glass fiber filter Fl (Whatman
type GFB filters were changed either at 12 h intervals or corresponding to daylight and
nighttime hours and were used for archival purposes and IC-CD-UV-MS analysis of the
59
filter extract in home laboratory) via mass flow controller MFC-C (Aalborg AFC2600D)
The cyclone and the filter holder are mounted on a modified camera tripod The feet of
tiie tiipod are bolted to the roof of the instrument shelter the air inlet is maintained -2m
above the roofline The second flow stream from the cyclone exit proceeds through a
copper conduit or aluminized PFA Teflon tube to a PPWD located within the instrument
shelter The metal is electrically grounded to minimize aerosol loss The PPWD is fed
with -1 mLmin streams of 10 mM Na2HP04 (adjusted to pH 7) containing 05 mM
H2O2 on each plate that serves to remove both acidic and basic gases the denuder
effluent (aspirated at~l 5 mLmin) is sent to waste The gaseous effluent from the
denuder bearing the aerosol proceeds to the PCS
The first element of the PCS is a specially constructed rotary valve VI that directs
the ambient air stream to either filter A or filter B This valve must provide a straight
passageway for the sample stream to one of the two sample filters without aerosol loss
The valve is shown in functional detail in Figure 32b The stator plate has three holes
the central port is connected to the sample air stream (from the PPWD) while the two
other ports are connected in common through a Y-connector to a sequential trap
containing a particle filter (F2) acid-washed silica gel (Tl 6-8 mesh which removes
NH3) followed by a soda-lime trap (T2 4-8 mesh that removes acid gases) and a heater
(H) that thus provides a hot dry clean air source (Figure 32a) The rotor plate has two
holes connected to filter A (FA) and filter B (FB) respectively and is rotated by a
spring-return rotary solenoid (TRWLedex Vandalia OH 30deg rotation angle) The air
transmission tubes to the valve are 75 mm id 875 mm od PFA tubing push fit into
60
the stator and rotor plates of the valve With the solenoid unenergized ambient air is
sampled on filter A and with the solenoid energized ambient air is sampled on filter B
flow is thus switched without aerosol loss Other air valves V2-V4 are 2-NPT large-
orifice low power on-off type solenoid valves (Skinner A10 ParkerHannifin 12 VDC)
that govern airflow in the PCS
Plexiglas filter holders were machined to hold 25 mm diameter filters Atop a
stainless steel screen are placed a paper filter (Whatman grade 5) and a glass fiber filter
(Whatman GFB) Two 10-32 threaded ports on opposite sides of the top half of the filter
holder provide entiy of wash liquids The bottom half of the filter holder is designed as a
shallow cone with the air outlet at the center The liquid exit port is a 10-32 threaded
aperture located equidistant from the inlet apertures such that the inletoutiet apertures
constitute an equilateral triangle in top view
Airliquid separators constructed using 3-inch transparent polyvinyl chloride
(PVC) pipe with PVC caps cemented to each end constituting 500mL capacity
reservoirs were incorporated below each filter holder in the air exit path These
contained air in and exit ports as well as a port to remove accumulated water
(periodically eg every 24 h) using a syringe These separators serve to keep any wash
liquid from entering the respective mass flow controllers (MFC-A B O-IO LPM UFC-
1500A Unit Instruments Inc Chaska MN) The diaphragm pump (P2 same as PI)
used for sampling is capable of aspirating at gt8 Lmin through each filter holder
simultaneously
61
Standard wall PFA Teflon tubes (ISW Zeus Industrial Products) were used for
connecting PCS components upstream of the filter holders This tubing was externally
wrapped with electiically grounded Al tape and then with bare Cu wire This served the
dual purpose of improving its structural strength and reducing electrostatically induced
aerosol loss Instrument components were machined to provide a leak-free push-fit with
this size tubing Flexible PVC tubing (Vg in id) was used for component connections
downstieam of the filter holders
Filter Extraction System
A 6-channel peristaltic pump (Dynamax RP-1 Rainin) provides liquid pumping
Valves V5-V8 are low power miniature liquid solenoid valves Valves V5 and V6 are
subminiature all-PTFE wetted part valves (161T031 Neptune Research W Caldwell
NJ) that direct the flow of deionized water to the filter holders Prior to the filter holders
the pumped water (I mLmin total flow) is split into two flow streams A 2 cm length of
PEEK tubing (0010 inch id Upchtirch Scientific Oak Harbor WA) was placed
immediately prior to the filter holder at each water entrance to provide flow resistance
This served to evenly distribute the flow from both inlets evenly on to the filters Valves
V7 and V8 (161P091 Neptune Research) handle filter extract in which stray glass fibers
may be present Therefore these valves are pinch type valves that can tolerate such
fibers without valve malfunction A low volume fiber-trap-filter (FTF Acrodisc CR 5
^m 25 mm) placed prior to the injection valve prevents glass fiber intrusion to the
preconcentration columns Such intrusion can result in high-pressure drops resulting in
62
decreased sample loading on the columns Injection valve IV is a 10 port electrically
actuated valve (Rheodyne) that contains two low-pressure drop anion preconcentration
columns (TAC-LPI)
PEEK peristaltic pump tubing adapters (PF-S VICI) terminating in ^4-28 fittings
were used Male nuts (14-28 threaded) and ferrules were used to connect tubing to the
pump adapters Pharmed tubing (129 mm and 152 mm id respectively) was used for
pumping water to and from the filter holders (-1 and 15 mLmin) larger aspiration flow
is used to prevent water backup at the filters Similarly 129 and 152 mm id Pharmedreg
ptimp tubes were used for pumping and aspirating liquid to and from each wall of the
PPWD All liquid transfer lines were 20 gauge standard wall PTFE tubing (20 SW Zeus
Industrial Products Orangeburg SC) For connections PTFE tubes were butt-joined
with Pharmedreg pump tubing as sleeves
The chromatographic columns and suppressor were identical to that for the gas
analysis system The chromatographic system itself used either a DX-120 Ion
Chromatograph and detector with a 225 mM NaOH eluent at 10 mLmin or a DX-600
system with an electrodialytically generated (EG 40) 1475 mM KOH eluent flowing at
15 mLmin with columns thermostated at 31 degC and a CD 20 conductivity detector
Under either operating conditions chloride nifrite nitrate sulfate and oxalate were
analyzed in less than 15 min Occasionally the system was operated with 30min sample
collection and 30min gradient elution rtms
63
Instrtiment Operation
Table 31 shows the air and liquid valves and their respective onoff status
Figures 33a and 33b illustrate the four states of the instrument cycle The first state
depicted in Figure 33a is 85 min in duration In the particle collection system the
soluble gas denuded aerosol flow stream is directed to filter A by valve VI Air passes
through filter A though mass flow controller A (MFC-A) which regulates the airflow to
5 SLPM and finally through valve V4 which is on during state 1 Valves V2 and V3 are
off and filter holder B (FB) is under airlock
In the liquid extraction portion of the instrument deionized water is contained in a
2 L bottle (WB) The air entrance to the water bottle is equipped with a soda-lime trap to
minimize acid gas intrusion into the bottle Water from WB is aspirated and then
pumped at 1 mLmin by the peristaltic pump (PP) through a mixed bed ion exchange
column (MBl packed with Dowex MR-3 resin Sigma) to remove any trace impurities
present in the deionized water Valve V5 directs flow to valve V6 which in turn directs
the water to filter FB The water enters FB through the two ports in the top of the holder
and is simuhaneously aspirated from the bottom of FB through valves V7 and V8 by the
peristaltic pump Since FB is under airlock water does not enter the air outiet tubing at
the bottom of the filter holder The extracted material from the filter is pumped through
the fiber trap filter (FTF) to remove glass fibers from the fiow stream before passing to
the appropriate preconcentration column Valve IV is configured such that while one
preconcentiation column is chromatographed the other preconcentration column is
64
loaded with sample or washed with water In the present case preconcentiation column
PCI is loaded with sample Following 85 minutes state 2 begins (Figure 33b)
During state 2 in the PCS ambient air continues to be sampled on FA just as in
state 1 Valves V2 and V3 are activated in state 2 allowing clean hot air to pass through
filter FB for the duration of this state Clean (ammoniaacid gas and particle free) air
produced by passing ambient air through F Tl and T2 is heated to -75degC by passing it
over a siliconized resistance heater (Watlow St Louis MO) contained in a PVC cylinder
housing that is powered by 110 VAC power (-20 W) via a DC relay that is switched in
parallel with valve V2 This clean hot air is aspirated through the previously extracted
filter FB to dry it prior to state 3 Within the PVC cylinder housing the heater a thermal
cutout device is located in close proximity to the heater and is connected in series with
the heater such that the heater shuts off in the event of overheating (t gt I43degC)
Note that at the time the instrument enters state 2 from state I although all the
analyte has been extracted from filter FB and preconcentrated the last portion of the
wash water is still contained in the filter housing This water is aspirated into the trap
bottle ahead of MFC-B Water that enters into the trap bottle is generally of the order of
ImLcycle This volume may be used to monitor the filter extraction process excessive
water accumulation in the water trap bottle indicates fiow problems through the filter or
through the relevant preconcentration column
In the liquid extraction system valves V5 and V8 are activated Valve V5 now
directs water used to wash filter FB in state 1 back into the water bottle This recycling
procedure helps maintain the purity of the water in WB As a resuh of liquid being
65
aspirated faster from the filter housing than it is pumped in air bubbles inevitably enter
into the preconcentration column To remove the air bubbles before the sample is
injected valve V8 is activated and water is aspirated by the pump through a mixed bed
ion exchange coltimn (MB2) through V8 and piunped through the preconcentration
column PCI The dtiration of state 2 is 65 minutes
After state 2 ends state 3 (85 min) and state 4 (65 min) follows States 3 and 4
are identical to states 1 and 2 respectively except that the roles of filters A and B are
interchanged relative to those in states 1 and 2 States 1-4 constitute an instrument cycle
state I starts at the end of state 4 and this continues until deliberately shut down
The chromatographic system is calibrated by a valve-loop combination in which
each side of the valve is separately calibrated volumetrically by filling the loop with an
alkaline solution of bromothymol blue of known absorbance injecting collecting all the
effluent into a 5 mL volumetric flask making up to volume and measuring the
absorbance Such a calibration takes into account the internal volumes of the valve ports
etc Standards containing chloride nitiite nitiate sulfate and oxalate are then injected
using the loop keeping the concentrator column ahead of the guard column to match
actual experimental dispersion Multipoint calibration curves are constructed in terms of
absolute amount injected in ng versus peak area
Electrical
The main ac power to the instrument goes to a PC-style power supply (that comes
with the PC chassis) providing +5 and +-12 V power of which only the +12 V supply is
66
used (rated at 8A lt2A used at any time) A separate power supply board (+- 15 and +5
V) is used for the mass flow controllers
Even the lowest rung IC (DX-120) used with the PCS provides 2 TTL outputs
from the ion chromatograph These can be temporally programmed in the DX-120
operating method Table 31 shows the temporal state of these outputs The schematic
shown in Figure 34a is then used to control the instrument The two TTL outputs are fed
into a demultiplexer chip Normally the output from this demultiplexer is high low
output signals are generated at distinct pin numbers based on the DX 120 TTL signals
input to it Outputs from the demultiplexer chip are inverted and then used to address the
logic level N-Channel MOSFET switches (RFM8N18L Harris) to control the valves
The power supply grotmd is connected in common to all the source pins of the MOSFET
switches while the valves are connected between the positive supply and individual drain
pins of the MOSFET switches with an intervening diode (rated 3A) to provide diode
logic control All valves operate from the 12 V power supply except VI for which a
separate power supply (18VDC 25 A) was constructed
Figure 34b shows the electronics associated with the mass flow controllers The
schematic governing MFC-A is shown (that for MFC-B is identical) The MFCs can be
manually controlled by 3-position center-off toggle switch SWIA Grounding terminal
D or terminal J results in fully opening or fially shutting dovra the control valve
respectively In the center-off position (normal) a 0-5 V contiol signal provided to
terminal A of the controller governs the flow rate This signal is provided by the 10 K
10-tum potentiometer RIA (numeric dial readout) and is normally set to provide 25 V so
67
that airflow is controlled at 5 SLPM on these 10 SLPM flow controllers The output
signal from the MFC (5 VFS) is divided 501 using a simple voltage divider network
(R2A R3A) and displayed on a 200 mV FS 32-digit panel meter (DPM-A) that displays
the air flow rate in SLPM Two DPDT relays (R4 and R5) are used for controls that
affect the filter drying airflow The two relay coils are in parallel with valves V2 and VI
respectively One half of relay R4 is used to apply AC power to the air heater during the
filter drying cycle (only V2 is on at this time) The common pin of the other half of R4 is
grotmded and the corresponding NO pin is connected to one of the common pins in relay
R5 The corresponding NO and NC pins are connected to D-pins of MFC-A and MFC-B
respectively Referring to Table 31 the net resuh is that when V2 is on and VI is off
MFC-A is opened fully to allow maximtim flow through filter A to dry it conversely
when V2 and VI are both on MFC-B is opened fiilly to allow maximum flow through
filter B When V2 is off both MFCs remain under front panel control Total power
consumed by the instrument not including the IC was measured to be 09-11 A
117VAC under 150 W total
IC-CD-UV-MS Analysis of Filter Extracts
Filter extraction and analysis were done at Kodak Research Laboratories
(Rochester New York) Sampled 47 mm filters were individually folded and placed in
Centricon centrifiigal filter devices (YM-IO 10000 MWCO Millipore) Filters were
handled with Nitrile gloves and plastic forceps To each Centiicon was added 20 mL of
water as extractant Two centrifugations were done on the same day with the filtrate
68
was
in
passed back through the device for re-extraction After the second pass the filtrate
again tiansferred to the upper chamber and the devices were capped and placed in a
refrigerator for 28 h Finally it was centriftiged for the third and final time (this was
done to soak the filters to provide better analyte recovery) Two blanks were extracted
the same fashion and the average was subtiacted from the sample data (this correction
was insignificant for most analytes) Chromatography was conducted on a GP-40
gradient pump an ATC-2 cleanup column to clean the NaOH eluent a 2 mm AS-15
column an ASRS-Ultia suppressor in the extemal water mode (20 mLmin) an ED-40
conductivity detector a PD-40 photodiode array UV detector (all from Dionex the UV
detector was scanned from 195-350 nm essentially only the 205 nm response was used)
Chromatography was conducted with a 5-85 mM linear gradient in hydroxide
concentration over 25 min and a final hold of 5 min with a constant concentration of 5
methanol in the eluent and with a total flow rate of 025 mLmin The injected sample
volume was 100 |aL Ion exclusion was also used to help differentiate between malic and
succinic acids (the latter was not eventually detected) which co-elute in anion exchange
with hydroxide gradients An ICE-AS6 column with an AMMS-ICE suppressor was
used for this work The mass spectrometer was a SCIEX API 365 in electrospray mode
with negative ion detection
69
Chemicals
All chemicals were analytical reagent grade Nanopure water gt18 MQlaquocm was
used throughout Hydrogen peroxide (30) Na2HP04 and 50 NaOH were obtained
from JT Baker
Aerosol and Gas Generation
A vibrating orifice aerosol generator (Model 3450 TSI Inc St Paul MN) was
used to generate monodisperse aerosols containing (NH4)2S04 and put through a Kr-85
neutralizer (TSI 3054) A Venturi-type nebulizer was used to generate polydisperse
aerosols A laser-based optical particle counter (Model A2212-01-115-1 Met-One
Grants Pass OR) was used for size characterization Other details of the aerosol
generation and characterization system have been published Clean air was supplied by
a zero air generator (model 737-14 AADCO Clearwater FL 100 SLPM) Gas
standards were generated as previously described
Field Deployability
The instrtiment is designed to be used in the field and is readily transportable (32
Kg) Airliquid separators and fiUer holders were placed outside the instrument for ease
of maintenance PVC airliquid separator holders are mounted with thumbscrews on each
side of the instrument console and readily disassembled A Plexiglas plate held on the
front panel of the instrument by similar thumbscrews accommodates filter holders A and
70
B in recessed housing All user settable items including mass flow controller readout and
controls are easily accessed from the front panel The peristaltic pump body was affixed
within tiie top of the computer case with the case cut out in the front and the top such that
the pump head exits through the top (tubes are readily changed) and the pump panel is
accessible through the front
Resuhs and Discussion
Instrument Performance
Filter Collection Efficiency Recovery and Carryover
Glass fiber filters are known to display essentially zero breakthrough for particles
over a large size range In the present work breakthrough through these filters was
studied using a polydisperse KBr aerosol (Mass median aerodynamic diameter 057 |xm
Gg 147) at concentrations of 21 and 25 |Jgm Breakthrough was determined by
allowing the system to sample through FA and FB for 4 hours each and installing a
separate pre-washed 47 mm quartz fiber filter downstream from each of these The latter
were manually extracted and analyzed Bromide was chosen as the test aerosol because
tiie filter blank for this analyte was below the limit of detection (LOD) Bromide
remained below LOD after 4h sampling (n=6) The capture of the aerosol by the filters is
thus deemed to be quantitative Recovery of the bromide collected on FA and FB
following the standard wash and preconcentiation period of the instrument was 971 plusmn
34 (n=6) compared to parallel sampling on a 47 mm filter manual extraction and
analysis System carryover was determined by spiking the sampling filter with 100 ig
71
aliquots of bromide continuously washing the filter thereafter and preconcentrating every
successive wash for 85 min and analyzing the same The first wash recovered 986
plusmn03 and every successive wash contained exponentially decreasing amounts such that
following four wash cycles the signal was below the LOD
Limits of Detection Filter Blanks and Filter Pretreatment
Instiiimental LODs (SN=3 ) for chloride nitiite nitrate sulfate and oxalate with
electiodialytically generated electrodialytically suppressed eluents are very low under
current experimental elution condhions these are typically in the 5-25 pg range for a
properly operating system using current state-of-the-art commercial hardware (It would
be even lower for the fast eluting fiuoride formate methanesulfonate etc but citing
these LODs may not be relevant because under the current standard elution conditions
these are not resolved) For a 75 L air sample these would translate into LODs that are
of the order of 01 ngm^ for the above anions were it not for the filter blanks Glass fiber
(GF) filters contain high levels of some ions most notably chloride and sulfate If used
as such they must go through cycled instrument operation for several hours before the
chloride and sulfate values still leaching from the filter become insignificant in
comparison to typical urban background levels All of the following strategies can be
successfully used (a) use high purity prewashed quartz fiber fitters (b) pre wash several
GF filters on a Biichner funnel with copious amounts of DI water store refrigerated
singly in pre washed plastic containers (NOTE Do not ultrasonicate or apply any other
similarly energetic measures to wash GF filters they will disintegrate) (c) soak 10-12
72
filters at a time in a beaker of deionized water Decant and replace with fresh water at
least four times at 15 min intervals After the last disposal cover tightiy with Parafilmreg
and store refrigerated Strategy a is convenient but expensive strategy c involves least
labor and is what has generally been used discarding the first three cycles of data when
the filter is first replaced Under these conditions typically filter blanks (or more
accurately variations in filter blanks) are sufficiently reduced such that LODs for all of
the above ions equate to lt10 ngm^ and after a few hours of operation approach I ngm^
Blank issues do not constitute a significant consideration for the gas analysis
system (except for analytes eluting very close to the carbonate (CO2) peak) LODs in the
01 -1 ngm are routinely obtained for the target gases
Choice of Filter Filter Replacement Frequency
Glass fiber (GF) filters have the drawback that during the washing cycle fibers
are shed Fouling of the preconcentration column by the fibers is prevented by the paper
filter underneath the GF filter and by the fiber trap filter (FTF see Figure 33) Current
manufacturers specifications on the preconcentrator columns used are such that the
pressure drops at the desired preconcentration fiow rate are at the limits of performance
for many peristaltic pumps When fouled the pressure drop increases and in the worst
case liquid can back up on the filter housing In the first field deployment in Atlanta in
1999 The system was operated without the paper backup filter for several days and one
preconcentration column was marginally fouled decreasing die flow rate and consistently
producing lower results on that channel The work of Buhr et al has already
73
demonstrated that fritted glass filters may not result in efficient capture of small particles
No filter media other than glassquartz fiber has been found that offer the combined
advantages of (a) high flow rates with minimal pressure drop (b) quantitative retention of
particles across the size range (c) efficient extractability with minimum volume of a
purely aqueous extractant and (d) high flow rate in wet condition to permit rapid drying
The frequency with which the filter needs to be replaced seems to depend on
particle loading Note that water-insoluble substances remain on the filter and gradually
accumulate increasing the pressure drop In at least one location the filter surface was
accumulating substances that were rendering it hydrophobic Once this happens to a
significant extent washing ceases to be uniform and the filter must be replaced regardless
of pressure drop issues In various field sampling locations it has been found that the
necessary filter replacement frequency vary between 1 to 3 days In this context it is
interesting to note that carbonaceous (soot-like) compounds are not water soluble and
accumulate on the filter In urban sampling much as k happens on hi-volume samplers
the filter surface becomes dark as it is used It would be relatively simple to
accommodate LED(s) and detector photodiodes within the filter housing to measure this
discoloration and thus obtain a crude soot index
Denuder Liquid Considerations for IC Coupling
A Dedicated Denuder for the Particle System
With an IC as the analyzer of focus water-soluble ionogenic gases are the analytes of
interest Acid gases include SO2 HCI HF HONO HNO3 CH3SO3H and various
74
organic acids primarily CH3COOH HCOOH and (C00H)2 Ammonia is the only basic
gas of importance under most condhions
If water is used as a collector sulfur dioxide is collected as sulfurous acid
Henrys law solubility of SO2 is limited and quantitative collection may not occur under
these conditions Additionally some of the bisulfite formed undergoes oxidation to
sulfate either in the denuder andor the IC system leading to both sulfite and sulfate
peaks This unnecessarily complicates quantitation Recent evidence^^ indicates that
when a denuder is cooled very little oxidation to sulfate occurs - this suggests that the
oxidation within the IC system may be limited However this is likely a function of the
degree of trace metal fouling of the chromatographic systemcolumn Addition of a small
amoimt of an oxidant like H2O2 to the denuder liquid eliminates this problem and results
in virtually instantaneous oxidation of the collected SO2 to sulfate For the gas analysis
denuder the recommended denuder liquid is thus 05 mM H2O2 All other collected
analytes including nitrite (originating from HONO) is completely unaffected by the
H2O2 Dilute H2O2 is also easily cleansed of ionic impurities by passing it through a
mixed bed ion exchanger
Recently Zellweger et al pointed out a potential problem with collection of the
weaker acids in high SO2 environments It is easily computed that in an atmosphere
containing 100 ppbv SO2 quantitative collection at an air flow rate of 5 LPM and a total
liquid effluent flow rate of 1 mLmin will lead to 20 [iM H2SO4 (pH -44) in the liquid
effluent Many weak acid gases may have solubility limitations in such a solution
Particular concern was expressed about HONO (pKa 31-32) although the sitiiation is
75
obviously worse with gases like acetic acid (pKa 475) Zellweger et al proposed a dilute
solution of their chromatographic eluent ~ 50 i M NaHC03 as the PPWD feed
Unfortunately this may not provide a generally applicable solution In the
presence of large amounts of SO2 the low concentration of influent NaHC03 used
solution may be overwhelmed The following arguments can be made in favor of not
adding any alkaline modifier (a) weak acids dissolve in aqueous solution both by their
ionization and through their Henrys law partition (intrinsic solubility) If the latter is
high (HCN a very weak acid has a very high intrinsic solubility for example^^) then
good collection is maintained (b) levels of SO2 -gt 100 ppbv are found sporadically as a
plume impacts a sampling location but such levels on a sustained hdisxs are not common
at least in the US the suggested approach may be meritorious in an exceptional case but
generates problems for other more common situations (c) a large amount of carbonate in
the sample is incompatible with hydroxide eluent based anion chromatography presently
the preferred practice Use of a carbonate containing PPWD liquid generates a
substantial amount of carbonate in the effluent a broad tailing carbonate peak can
obscure smaller analyte peaks in that region (d) an alkaline denuder liquid will inhibit
uptake of ammonia if ammonia is to be analyzed in the same sample
Although it has not been explicitiy so stated the different composhions tried for
the denuder liquid by the ECN group^ makes it clear that they too have grappled with
this problem A complete solution is not yet available Note that gases that are not
collected by a denuder preceding the PCS will generally be collected by a PCS
(especially a steam condensation based PCS) causing positive error While
76
subquantitative collection of gases by the gas analysis denuder cannot be easily corrected
for errors in the particle composition measurement can be prevented by simply using a
separate gas removal denuder for the PCS This denuder uses a denuder liquid buffered
at pH -7 with sufficient buffer capacity and at enhanced liquid flow rate that allows
complete removal of both acid gases and ammonia
In principle a similar approach can be practiced with the gas analysis denuder if
the buffer material used is removed completely by suppression or is invisible to a
conductivity detector Ito et al ^ used a zwitterionic buffer to remove high levels of
acidic gases (as may be present in indoor environments when a kerosene-fiieled heater is
operated) or high levels of ammonia (which have been encountered in homes with live-in
pets) before aerosol analysis While these approaches have not been demonstrated when
the denuder effluent is to be preconcentrated and analyzed zwitterionic buffering may
still be useful Glycine for example has an appropriate pKa to be useful as a buffer and
is suppressible Morpholinoethanesulfonic acid and Bis-tris should be among other
potentially useful suppressible zwitterionic buffers which will provide a low
conductivity background Initial experiments with such materials appear promising and
future investigation of an optimum choice is required Meanwhile the conflicting needs
of incorporating a cyclone of an appropriate cut point before the PCS and of having no
inlet system for analyzing sticky gases in a gas analysis system still suggests that the PCS
has its own gas removal denuder regardless of denuder liquid considerations
77
Illustrative Field Data
The instiument has been deployed in several summertime field studies each with
4-6 week duration Atlanta Supersite (1999 during which an imtial version of the
instrument was used) Houston Supersite (2000 during which the presently described
version of the instrument was used) and Philadelphia (2001 during which the gas phase
portion of tiie instrument was used) Figure 35 shows the concentrations of nitric
acidparticulate nitrate nitrous acidparticulate nitrite (the latter is nearly zero -
establishing that this type of filter based measurement do eliminate artifact nitrite
formation) and sulftir dioxideparticulate sulfate for a few days from the Atlanta site
Figure 36 shows the concentrations of hydrochloric acidparticulate chloride oxalic
acidparticulate oxalate for a few days from the Houston site Typical chromatograms for
the gas and particle analysis systems are shown in Figure 37
When carefully examined for minor components the chromatograms especially
those for the aerosol samples reveal a far greater degree of complexity A gradient
chromatogram of a 30 min sample collected in Atianta is Shown in Figure 38 with
overlays representing lOx and lOOx magnifications of the base chromatogram
Considering that the baseline is essentially completely flat for a blank run even at the
lOOx magnification the number of real components present in such a sample becomes
readily apparent Not surprisingly a majority of these peaks are organic acids While
MS is uhimately the only completely unambiguous means of identification when
confirmed by a matching standard in many cases the charge on the analyte ion can be
estimated by determining void voltime corrected retention times (^R) under isocratic
78
elution conditions at 3 or more different eluent concentrations Under these conditions it
is well known that the slope of a log R VS log [eluent] plot is equal to the ratio of the
charge on the analyte ion to that on the eluent ion (unity for hydroxide)^ This is shown
in Figure 39 With this information and the nature of UV response of the analyte h is
often possible to determine the identity of the analyte At the very least it provides clues
for selecting confirmation standards for MS
Table 32 lists average daytime and nighttime aerosol composition for a relatively
polluted period during the Atlanta measurement campaign The analysis was conducted
by IC-CD-UV-MS by Drs Martin and Smith at Kodak with identification confirmed by
MS and conductivity providing quantitation Several peaks remain imidentified numbers
in parentheses provided for these are calculated from the conductivity peak areas based
on the average response These should be taken as lower limits because the average
response per imit weight is dominated by strong acid anions and these unidentified
species are almost certainly organic acids for which response per unh weight is likely to
be smaller I have also performed qualitative IC-MS analysis of fiher extracts The filters
were collected in two field studies in Philadelphia and Houston and archived for lab
analysis The resuhs are shown in Table 33 Oxalate Succinate Methylmalonate
Malonate Malate Maleate and Oxalate were present in almost every sample Lactate
Phthalate and Butyrate have been identified in some samples however in others they
were either below the LOD of the instrument or unpresent To the authors knowledge
this is the first attempt to decipher the total anionic composition of ambient urban
aerosol In a global context it is most remarkable that the list of the organic acids
79
identified here overlaps in a major fashion with the list of aliphatic organic acids that are
used as metabolic pathway markers in the human physiological system^^
Conclusion
An automated particle collection and extraction system has been presented When
coupled to an IC for analysis the system mimics the standard procedure for the
determination of the anion composition of atmospheric aerosols The instrument
provides high sensitivity and allows analysis of anions in aerosol in only a fraction of the
time and cost of conventional techniques A wide range of aerosol constituents can be
determined by simply changing the analytical technique used to analyze the filter extract
The instrument is field worthy In the Houston field experiment of a total of continuous
deployment over 872 hours the particle (gas) analyzer instruments respectively produced
meaningfiil data 85 (90)) of the time was being calibrated 5 (5) of the time and was
being equilibrated (fitter wash) in maintenance or down 10 (5) of the time
Acknowledgments
I would like to thank Charles Bradley Boring who gave his time and effort to put
this instrument together and Zhang Genfa who operated the instrument in Atlanta in 1999
before I was able to use it in Houston in 20001 also would like to thank Michael W
Martin and William F Smith at Kodak Research Laboratories for analyzing the filter
samples by IC-CD-UV-MS
80
References
1 Dasgupta P K ACS ADV Chem Ser 1993 232 41-90 idem In Sampling and Sample Preparation Techniques for Field and Laboratory Pawliszyn J Ed New York Wiley NY (in press)
2 Crider W LAnal Chem 1965 37 1770-1773
3 Huntzicker J J Hoffman R S Gary R A Atmos Environ 197812 83-88 Coburn J Husar R B Husar J D Atmos Environ 197812 89-98 Tanner R L DOttavio T Garber R Newman L Atmos Environ 198014 121-127 DOttavio T Garber R L Tanner R L Newman L Atmos Environ 1981 75 197-203 Slanina J Lamoen-Dormenbal L V Lingera W A Meilof W Klockow D Niessner R Int J Environ Anal Chem 1981 9 59-70 Garber R W Daum P H Doering R F DOttavio T Tanner R L Atmos Environ 198317 1381-1385 Slanina J Schoonebeek C A M Klockow D Niessner R Anal Chem 1985 57 1955-1960 Lindqvist F Atmos Environ 198519 I67I-I680 Huntzicker J J Anal Chem 1986 58 653-654 Appel B R Tanner R L Adams D F Dasgupta P K Knapp K T Kok G L Pierson W R Reiszner K D In Methods of Air Sampling and Analysis Lodge J P Ed 3rd ed Lewis Chelsea MI 1988 Method 713 pp 523-532
4 Klockow D Niessner R Malejczyk M Kiendl H vom Berg B Keuken M P Wayers-Ypellan A Slanina J Atmos Environ9S9 23 1131-1138
5 Dzubay T G Rook H L Stevens R K Abstract WATR-045 165th National Meting of the American Chemical Society 1973
6 Roberts P T Friedlander S K Proc Conf Hlth Consequences Environ Controls Durham NC 1974 Roberts P T PhD Dissertation California Institute of Technology 1975 Roberts P T Friedlander S K Atmos Environ 197610 403-408
7 Husar J D Husar R B Stubits P K Anal Chem 1975 47 2062-2064 Husar J D Husar R B Mascias E Wilson W E Durham J L Shepherd W K Anderson J A Atmos Environ 197610 591-595 Hering S V Friedlander S K Atmos Environ 1982 7(52647-2656
8 Sturges W T Harrison R M Environ Sci Technol 1988 22 1305-1311
9 Yamamoto M Kosaka H Anal Chem 1994 66 362-367
10 Hering S V Stolzenburg M R US Patent 5983732 Stolzenburg M R Hering S V Environ Sci Technol 2000 34 907-914 Liu D Y Prather K A Hering S W Aerosol Sci Technol 2000 33 71-86
11 Turpin B J Gary R A Huntzicker J J Aerosol Sci Technol 1990 72 161-171
12 Bacri J Gomes A M Fieni J M Thouzeau F Birolleau J C Spectrochim Acta 1989 44B 887-895 Nore D Gomes A M Bacri J Cabe J Spectrochim Acta 1993 48B 1411-1419 Gomes A M Sarrette J-P Madon L Almi A Spectrochim Acta 1996575 I695-I705
13 Duan Y Su Y Jin Z Abein S Anal Chem 2000 72 1672-1679 idem AIP 200071 I557-I563
14 Sioutas C Koutrakis P Olson B A Aerosol Sci Technol 1994 27 223-235 Sioutas C Koutrakis P Burton R M J Aerosol Sci 1994 25 1321-1330 idem Particul Sci Technol 199412 207-22 idem Environmental Health Perspectives 1995103 172-177
15 Clark C D Campuzano-Jost P Covert D S Richter R C Maring H Hynes A J Saltzman E S J Aerosol Sci 2001 32 765-778
16 Myers R L Fite W L Environ Sci Technol 1975 9 334-336 Sinha M P Giffin C E Norris D D Estes T J Vilker V L Friedlander S K I Colloid Interface Sci 1982 87 140- 153 Marijinissen J C M Scarlett B Verheijen P J T J Aerosol Sci 198819 1307-I3I0 McKeown P J Johnson M V Murphy D M Anal Chem 1991 63 2069-2073 Kievit O Marijinissen J C M Verheijen P J T Scarlett B J Aerosol Sci 1992 23 S30I-S304 Hinz K P Kaufinann R Spengler B Anal Chem 1994 66 2071-2076 Mansoori B A Johnston M V Wexler A S Anal Chem 1994 66 3681-3687 Prather K A Nordmeyer T Salt K Anal Chem 1994 66 3540-3542 Carson P G Neubauer K R Johnson M V Wexler A S J Aerosol Sci 1995 26 535-545 Murphy D M Thomson D S Aerosol Sci Technol 1995 22 237-249 Reents W D J Mujsce A M Muller A J Siconolfi D J Swanson A G J Aerosol Sci 1995 23263-270 Hinz K P Kaufmann R Spengler B Aerosol Sci Technol 1996 24 233-242 Lui D Rutherford D Kinsey M Prather K A Anal Chem 1997 69 1808-1814 Card E Mayer J E Morrical B D Dienes T Fergenson D P Prather K A Anal Chem 1997 69 4083 -4091 Kolb C E Jayne J T Worsnop D R Shi Q Jimenez J L Davidovits P Morris J Yourshaw I Zhang X F Abstract ENVR 100 219 National Meeting of the American Chemical Society March 2000 Song X-H Hopke P K Fergenson D P Prather K A Anal
82
Chem 1999 71 860 -865 Gross D S Galli M E Silva P J Prather K A Anal Chem 2000 72 416-422
17 Lodge J P Ferguson J Havlik B R Anal Chem 1960 32 I206-I207- Lodge J P Pate J B Science 1966 755 408-410 Lodge J P Frank E R J Microscopic 1967 6 449-455 Bigg E K Ono A Williams J A Atmos Environ 1974 8 1-13
18 Suess D T Prather K A Chem Rev 1999 99 3007-3035
19 Blatter A Neftel A Dasgupta P K Simon P K In Physico-Chemical Behavior of Atinospheric Pollutants Angletti G Restelli G eds Proc 6th European Symposium Report EUR 156092 EN Luxembourg 1994 pp 767-772
20 Loflund M Kasper-Giebl A Tscherwenka W Schmid M Giebl H Hitzenberger R Reischl G Puxbaum H Atmos Environ 2001 35 2861-2869 Weber R J Orsini D J Daun Y Lee Y-N Klotz P J Brechtel F Okuyama K Aerosol Sci Technol 2001 (in press) Zellweger C Ammann M Hofer P Baltensperger U Atmos Environ 1999 55 1131-1140
21 Simon P K Dasgupta P K Environ Sci Technol 1995 29 1534-1541 Simon P K Dasgupta P K Anal Chem 1995 67 71-78 Poruthoor S K Dasgupta P K Genfa Z Environ Sci Technol 1998 32 1147-1152 Poruthoor S K Dasgupta P K Anal Chim Acta 1998 361 151-159 Ito K Chasteen C C Chung H-K Poruthoor S K Genfa Z Dasgupta P K Anal Chem 1998 70 2839-2847
22 Slanina J ten Brink H M Otjes R P Even A Jongejan P Khlystov A Waijers-Ijpelaan A Hu M Atmos Environ 2001 35 2319-2330 Khlystov A Wyers G P Slanina J Atmos Environ 1995 29 2229-2234
23 Buhr S M Buhr M P Fehsenfeld F C Holloway J S Karst U Norton R B Parrish D D Sievers R E Atmos Environ 1995 29 2609-2624 Liu S Dasgupta P K Talanta 1996 43 I68I-1688 ibid Anal Chem 1996 68 3638-3644 Karlsson A Irgum K Hansson H J Aerosol Sci 1997 28 1539-1551 Liu S Dasgupta P K Microchem J 1999 62 50-57
24 Atlanta 1999 httpwrvyw-wlceasgatechedusupersite Houston 2000 httpvywwutexaseduresearchceertexaqs Philadelphia 2001 httpwwwcgenvcomNarsto
83
25 Appel B R ACS Adv Chem Ser 1993 232 1-40 Koch T G Fenter F F Rossi M J Chem Phys Lett 1997 275 253-260 Neumann J A Huey L G Ryerson T B Fahey D W Environ Sci Technol 1999 33 1133-1136 Komazaki Y Hashimoto S Inoue T Tanaka S Atmos Environ 2002 (in press)
26 Samanta G Boring B Dasgupta P K Anal Chem 2001 73 2034-2040
27 Chang I H Choi N H Lee B K Lee D S Bull Kor Chem Soc 1999 20 329-332 Chang I H PhD Dissertation Yonsei University Korea August 2001
28 Kuban V Dasgupta P K Anal Chem 1992 64 1106-1112
29 Keuken M Schoonebeek C A M Wensveen-Louter A Slanina J Atmos Environ 1988 22 2541-2548 Wyers G P Otjes R P Slanina J Atmos Environ 1993 27A 2085- 2090 Slanina J Wyers G P Fres J Anal Chem 1994 350 467-473 0ms M T Jongejan P A C Veltkamp A C Wyers G P Slanina J Int J Environ Anal Chem 1996 lt52207-2I8 Jongejan P A C Bai Y Veltkamp A C Wyers G P Slanina J Int J Environ Anal Chem 1997 66 241-251
30 Ivey J P J Chromatogr 1984 257128-132
31 Small H Ion Chromatography New York Plenum 1989 68-69
32 httpoxmedinfoir2oxacukPathwavMiscell24028htm
84
X
O I
o o o
o o
00
gt
o
b
O
O
z o b O o
gt o o o b b o
gt
b b O
b b O o
b b O
gt b b O sect
b b O
z o
gt z o o
b b
o z o
gt
b b O
Z o
2 O sect
gt
b b O z o
b b O sect
b b O
b b O z
o
z o
pound5
H
O CO
o fa
^3
00
3
u
I
(N
u b
OX)
c 2 tft C8 ^ t iS or)
lt
go
nF
c
mpl
i gi
nsa
D CQ
m b
and
pa b J3 OX)
p ^ T3
spir
ate
cd OX)
g X)
td ^
rt
u
on
toP
aded
ig
lo
5 Hi 03
(N
u b
03 b
hing
W
as
^
on F
A
gsti
l pl
in
E
ltu ^ amp E o o
^r t
U (11
r Pu
rg(
ltLgt
Wat
FB
D
ry
u b
03 b o -raquo OX)
_g n 6 ta tA
Si
gt
dry
CQ b
4) T3 O E o o u ^ s O b P
b
lt b 00
S tfi CQ
gin
lto 03
U b
lt b 00
S ampgt Q g ob ltu CQ
03 b C o ^ w 00 _g H E
(N
u b C o (U 00 ^ 3 b
s ^
85
Table 32 Average anion composition of day and night time aerosol in midtown Atlanta August 1999
Retention time
Conductivity Detector
834 895 937 956 983 1096 1123 1187 1304
1493
1560 1623 1657 1723 1813 2046 2158 2328 2433 2487 2587 2672 2850 2910
min
UV Detector
1327
1552
1834
2352 2466
2606
2883
Analyte
Fluoride Glycolate Acetate Lactate Formate
a-Hydroxyisobutyrate Unknown
Methanesulfonate Chloride Pyruvate Unknown
Nitrite Carbonate
Malate Malonate Sulfate Oxalate
Unknown Phosphate
Nitrate Unknown Unknown Unknown Unknown
o-Phthalate Unknown
Concentration Micrograms
Day Samples
11 028 058 081 091 002
[0015] 005 98 tr
[0004] 011 nd
030 036 16
034 [001] 003 19
[002] [003] [0004] [0003]
tr [0004]
per Cubic Meter
Night Samples
058 019 025 032 071 003 [002] 004 55 tr
[001] 015 nd
024 026 11
027 [002] 003 17
[003] [003]
nd [0007]
tr [0072]
Retention times are as per the chromatographic protocol described in text Numbers in parentheses provided for unknown peaks are calculated from the conductivity peak areas based on the average response These likely the lower limits
86
Table 33 Organic anion composition of aerosol filter samples collected in Houston TX 2000 and Philadelphia PA 2001 and identified by IC-MS
Study
Boston TX August 12 -September 25 2000
Period of collection
Aug 22 830 p m -Aug 23 840 am
Aug 23 840 am -Aug 23 750 pm
Aug 28 830 a m -Aug 28 900 pm
Sep 7 830 pm -Sep 8 930 am
Sep 10830 a m -Sep 10830 pm
Sep 12830 a m -Sep 12800 pm
Sep 16830 p m -Sep 17 845 am
Analyte
Succinate Malate Lactate Maleate Oxalate Phthalate
Succinate Methylmalonate Malonate Malate Lactate Maleate Oxalate Phthalate Butyrate
Succinate Methylmalonate Malonate Malate Lactate Maleate Oxalate Phthalate
Succinate Methylmalonate Malonate Malate Maleate Oxalate
Succinate Methylmalonate Malonate Malate Maleate Oxalate Phthalate
Succinate Methylmalonate Malonate Malate lactate Maleate Oxalate Phthalate
Succinate Malonate Lactate Maleate Oxalate Phthalate
Philadelphia PA July 1-July30 2001
July 6 740 am -July 6 800 pm
July 10830 a m -July 10840 pm
July 16 1000 pm-July 17830 am
July 16830 a m -July 16 1000 pm
July 21 900 a m -July 21 900 pm
July 21 900 p m -July 22 840 am
Succinate Methylmalonate Malonate Malate Lactate Maleate Oxalate Phthalate
Succinate Methylmalonate Malonate Malate Lactate Oxalate Phthalate
Succinate Methylmalonate Malonate Malate Oxalate
Succinate Methylmalonate Malonate Malate Lactate Maleate Oxalate
Succinate Methylmalonate Malonate Malate Lactate Maleate Oxalate Phthalate
Succinate Methylmalonate Malonate Oxalate
87
LI o
o
o
A O
o lt
o
LR
W A
Figure 31 Wetted denuder shovra schematically AIAO Air inout aperttires LILO Liquid inout apertures LR Porous polyvinylidene fluoride element acting as a liquid flow restrictor WA wetted area S PTFE spacer SH Screw holes for affixing two denuder plates together
PPWD
MB
MB
[if Ambient
Air I r n
MFC-C
IC1 PP
FC MFC-D
H202 i P2
=Kiir^ Ambient
Air In F P H R l
FA
T
(a)
MFC-B MFC-A P1
Q-
V1
(b)
ON OFF
Figure 32 Particle collection system (a) Total system airflow and gas analyzer liquid flow schematic PPWD Gas system wet denuder MB mixed bed resin deionizer columns IC Gas analysis system ion chromatograph (uses 10-port dual concentrator column injector as in PCS IC in Figure 3 FAFB Glass fiber filters T Trap bottles MFC-ABCD Mass flow controllers C Cyclone FC 47 mm filter for MS analysis PI2 Air sampling pumps PP Peristaltic pump F Filter P Purifer H Heater The dotted section including the denuder is on the roof while the air pumps are either below the instrument shelter or in a modified doghouse with forced air ventilation VI aerosol switching valve shown in detail in (b)
89
OJ
N
P dl o
h
o gt
I
D
(U lgt
re bullcopy
^ s b o b Sa laquor o
00 o
Q ox
J o c
oo r- O
gt U 13
X)
uT u T3 3 C ltu
T3 CA
a 00
U b Q ^ b o b 5=
en
^ s 00 ^ b -3 = cr b mdash gt- 5 i
(C u bullg ^ 3 c D - -u gtgt
bull5
1) D ^ ^-raquo cl
u b T3 S B3
u b i ^ p i
5 o ltN o 5i bull U
to
^ g
- 8 u
^
c o
00 ^ S E
o o
bullO X) S -a ^ S bullmdashbull TO
o u E ^
T H ta
u C bullS o
(U
claquo gt
0) 2 tn o
^ t r c b A ^ - S
E lt 3
90
raquo5 Vdc -
QND-
TTL2ln
MF9-
QNO-
U1
- bull 6 Vdc
-ONO
-QND
- n L 1 In
U22
D13 mdash
OND mdash
U24
D71012
mdashETH U28 mdash mdashID I 04811 mdash
DmdashIsM
1 4
2 13
9 12
4 U2 5 10
C
7
MF3A
U 2 4 mdash ( a
DI9
QND
U2lt mdash 0
bull laquo = D9 4- D
I ONDmdashS
(a)
R I A 1 0 K 5 V 10 -Turn
r Fuse 025 A
(b)
bullmdash^t^rreg~^ LB
LA - SAMPLING ON AT FILTER A
LB - SAMPLING ON AT FILTER B
Figure 34 Schematic ofelectronics governing instrument operation (a) Ul (ECG74155AN) demultiplexer takes chromatograph TTL signals and produces demultiplexed outputs at pins4-7 these are inverted by hex inverter U2 (ECG 7404) and addresses gates of logic level N-Channel MOSFET switches (RFM8N18L) to turn onoff various valves via diode logic (b) Air heater and hot air flow control
91
o E u Q 3 U 0)
a (0 E S O) S u E
c 0) u c o o
i lt
c flgt (0
o
Nitric Acid
Nitrate
Sulfur Dioxide
A Sulfate
81699 81899 82099
Figure 35 HNOsNitrate HONONitrite and S02Sulfate patterns at a Midtown location in Atlanta GA Note nocturnal maxima in the middle panel and opposite behavior in others
92
o
re gtlt
O X
O
1 T CO (Vj 00 ^
9BKu ojqno jacTsujejSojDjUJ uouBJjuaDuoo |OSOjav pue seg
o o (0 ^ agt
o
94
0 2
00
v 0)
o o ^ l - l CO
oo
o o tn CM X CO
o o ^
823
00
H
82
o o 0) H V 00
13 S 3 CO
2P (u S ^
S H as ^ en
O deg ^ J
M O o -s
ite
cl
emis
D V 15 a O 2 XI bullfiu C3 - )
ily i
ndi
e la
rge
^ ^ agt ^
Si o a c
C5 CO
13 S gt o
Ji ltu ogt -^
la pound3 X sect
O S ac
id
isk
n
U (U - Rj V3
rgt ci
e0
Thi
-o
hlor
i T
X
^ S s reg u g
3 CiO
b
93
o H X
fuiSntrOO iraquogtBllaquoxo
in H
pounduijSn sff araquoJins
5
Sis
g = jiu^nj-sapuona
O sect s
stis pilt nntSiio inii[3 -|s laipo 8iiiuoj8iB)83yapuaij
o
CO to
^ mdash f mdash
CM
o c
E
c o
U9l in u
qddfi TZOS
o o 00 f
fo DC 00 a o 5
(U IT) s
00 X
qtW|79ioeoMH
zoo
qddrroosDH qddaocw
(3 l | ltX0qjB30U0Ul )
HOCOH t)VCraquoIdH
1 M 00 ^ H
UJ3su3UJ3soJ3UJ 33uepnpuo3
o d q cvi
OE 00 E
oT E
c o
o d
C o V3
O
K S (U +-raquo a i gt- M
Ji 13
13
o bulls
I o
gt
CO
Pt
rn d)
op
94
bulla ogt o 0 re
re pound re c bullB 0
c u 4-gt
re u
nifi
O) re E X 0 T -
c 0 re u C
gni
re E X 0 0 ^
luosn aouepnpuoQ
0 fO
50
(M
00
cgtlaquo
0 10
^
0 0
50
0 0
c E 0)
t-1-c 0
Elut
u
read
ily
(6)
sulf
at
Onl
y itr
ate
xp
erim
ent
onat
e (
5) n
B J3 a 0
5 (U R
^bulls ^ C
rH -s
B ^ T3 bdquo (11 T j
1 co
llect
2)
chl
ori
0 ^ ^ laquo3 (U
m o
f an
aer
nate
ac
etat
on
chr
omat
ogra
i (I
) fl
uori
de
fon
ient
ak
s
-0 ltu c5 ft
0 1 - 0
u t l S 0 0
( i j tTi (U
oxa
[ ^
b
95
150 - 1
100-
E 0)
050
Cd
S 000 o ltu o O ogt o
-050 -
bull100
Unk4 slope -2061
Unk7 slope-18
Unk3 slope -26 ^ Unk6 slope-11 Nitrate Slope-117
Sulfate Slope-180
arbonate slope-162
Nitrite slope-110 Chloride slope 90
Unk9 slope-11 UnkS slope-101
Unki slope -1
110 120 130 140 log [Hydroxide Eluent Concentration mlVl]
150
Figure 39 Log tRversus log [eluent] plots reveal charge on analytes aiding search for a
confirmatory standard
96
CHAPTER IV
CONTINUOUS ANALYZER FOR SOLUBLE ANIONIC
CONSTITUENTS AND AMMONIUM IN ATMOSPHERIC
PARTICULATE MATTER
Introduction
The health effects of particulate matter (PM) has been a subject of intense and
growing discussion For the most part the available evidence is epidemiological
rather than direct and hence creates a controversy^ PM is an umbrella term that includes
different species that vary widely in chemical composition size and toxicity It is
particularly important to have high temporal resolution PM monitors that provide
chemical composition information along with simultaneous information on gaseous
species and meteorological data to better understand the chemistry of aerosol formation
and transport thermodynamic equilibrium or lack thereof Such information is also
invaluable in performing source apportionment
Several approaches are available towards automated near continuous
measurement of chemical composition of particulate matter Mass spectrometry (MS)
7 0
has been effectively used for online real time analysis of particulate matter Presently
MS is capable of single particle analysis down to nm size particles and provide
information about particle size morphology and compositiondeg However response is
strongly matrix dependent and the results tend to be qualitative and limited by cost and
the complexity
97
More conventional chemical analysis must automate and reasonably integrate the
steps of collection and analysis Very small particles are hard to collect by impaction
The concept of growing particles with steam prior to impaction followed by ion
chromatography (IC) analysis was introduced by Dasgupta et al^^ and almost
simultaneously by Khlystov et al^^ Kalberer et al^ and especially Loflund et al have
described sophisticated systems that are largely modeled after the first design Weber et
al presented a particle-into-Iiquid system that is based on the particle size magnifier
design of Okuyama et al that also uses steam The sample is analyzed by a dual IC
system with a reported LOD of 10-50 ngm and time resolution of 35-4 min Steam
introduction has proven to be one of the most efficient means to grow and collect
particles Yet available denuders do not remove NO and NO2 effectively The reaction of
steam with these gases produces nitrite and to a lesser extent nitrate On a continuously
wetted glass frit Buhr et al found higher levels of nitrate than observed on a
conventional filter based instrument The steam introduction technique involves
generation injection and condensation this also adds to instrument complexity and size
Attempts to obviate the use of steam have recently been underway Boring et al recently
described a filter based automated system^^ coupled with IC for measurement of anions in
PM The system uses a parallel plate wetted denuder (PPWD) and two glass-fiber filters
that alternate between sampling and washingdrying The filter wash is preconcentrated
for analysis The filter based system has its own merits but leaching of fibers from
presently used fibrous fdters leads to fouling of dovmstream components and presents
problems In addition the filter system intrinsically operates on a batch mode To
98
accommodate the needs of future continuous analysis systems a truly continuous analysis
system is desirable
Of PM constituents sulfate and nitrate are of the greatest interest Monitors that
specifically monitor particulate sulfate and nitrate have been introduced Hering and
Stolzenburg^^-^^ described a system that samples air at 1 standard Lmin (SLPM) through
a 25 pm cut cyclone inlet followed by a carbon impregnated denuder to remove the
gases The particles then pass through a Nafion humidifier and are collected by
impaction on a metal sfa-ip For analysis the strip is directly heated electrically and the
liberated gases (SO2 from sulfate NOx from nitrate) are measured by gaseous SOaNOx
monitors^^ A nitrate analyzer that removes NOx collects nitrate on a quartz fiber filter
thermally decomposes the nib-ate and measures the NOx has been described by Allen et
al These researchers have also tested a system in which a sulfur gas free sulfate
aerosol stream is thermally decomposed to SO2 prior to measurement by a modified
gaseous SO2 analyzer ^
The above instruments operate on cylinder gases as the only consumable and are
therefore attractive IC analysis is attractive for a different reason it can provide
simultaneous analysis of multiple constituents Present day ICs can also operate on pure
water as the only consumable In this vein a simple robust device for semi-continuous
collection of soluble ions in particulate matter is developed The collector is inspired by
the designs of Cofer and Edahl^^^ who developed a device to collect and concentrate
trace soluble atmospheric gases from large volumes of air into small volumes of liquid
with high efficiency by a nebulization-reflux techniques Janak and Vecera used the
99
same principle of nebulizationreflux shortly thereafter again for gas collecfion A
similar principle to collect particles after prior removal of soluble gases is used here
The present device can be designed with an optional inlet that can provide a particular
size cut This PC has been extensively characterized in the laboratory and deployed in a
number of major field studies
Experimental Section
Particle Collector Extractor
Figure 41a and 41b show the two designs of the PC investigated in this work
The PC is essentially a sealed cylindrical chamber (3 in od 25 in id 375 in tall)
made of Plexiglas to which the sample airflow is introduced through a constricted nozzle
The simpler version shovm in Figure 41a does not provide any size cut In this design
the soluble gas denuded air stream flows straight into the PC through a Plexiglas orifice
The nozzle bearing the orifice is machined to have a smooth inner surface and a gradual
taper (-75 deg) without an abrupt edge It fits snugly over a perfluoroalkoxy (PFA) Teflon
inlet tube (875 mm od 75 mm id 1 SW Zeus Industrial Products) that serves as the
exit tube of the PPWD and connects it to the PC The PPWD is identical to that used in
chapter III DI Water is pumped peristaltically (PP5) at 1 mLmin into the PC chamber
through a stainless steel capillary (056 mm od 030 mm id type 304 stainless steel B-
HTX-24 Small parts Inc Miami Lakes FL) that delivers the water to the air stream just
exiting the nozzle The water is aerosolized by the high velocity air creating a fine mist
The mist attaches to the particulate matter in the sampled air
100
A hydrophobic microporous PTFE membrane filter (Fluoropore FHLP 05 pm
pores 47 mm dia Millipore) constitutes the top exh of the PC The filter rests between
the cylindrical PC body and the inverted funnel shaped air suction outlet affixed together
by six 4-40 threaded z long stainless steel screws evenly positioned around the
perimeter To assure an airtight seal around the filter an 0-ring put in an appropriately
machined groove on the top perimeter of the cylindrical section of the PC provides
sealing A mesh machined in a Plexiglas disk provides back support for the filter The
water mist coalesces on the hydrophobic filter surface as large droplets These eventually
fall to the bottom of the particle collector chamber The pressure drop needed to aspirate
liquid water through the highly hydrophobic filter is large As such liquid water is not
aspirated through the filter The system thus behaves as a reflux condenser where the
liquid refluxes from the filter
The bottom of the PC is not flat but slopes to a slightly off-center low point much
like a shower drain such that water runs to this point An aspiration aperture is provided
at this point Two stainless steel rods (0064 mm dia) placed radially across the aperture
serve as a conductivity sensors Using the conductivity probes as a simple logic sensor
the presence of water across the electrodes (high conductivity) causes appropriate
electronics to turn on a dedicated one channel peristaltic pump P2 (FIA 8410 BIFOK
Sweden) to aspirate the liquid for analysis
As shown in Figure 41b in lieu of using a separate cyclone the air inlet of the
PC can be designed similar to a cyclone to provide a particular size cut The gas-denuded
air sample enters the interior cylindrical chamber of the PC through a tangential inlet with
101
the interior cylinder serving as the cyclone The cylinder ends in a 1 mm orifice at the
top of a cone A 360 im od 250 ^m id capillary tube serving as the DI water inlet
comes through the bottom of the PC (affixed at the bottom plate with a compression
fitting) and just protrudes through the nozzle orifice
Tvpical Field Installation
The entire instrument was located inside an air-conditioned trailer The general
layout is shown in Figure 42 The preferred sampling arrangement involved a 6 in PVC
pipe vertically traversing the shelter extending I m above the rooftop with a U-joint on
top to prevent precipitation ingress Underneath the shelter a blower fan BF was
attached to the PVC pipe to aspirate air 100-150 Lmin below turbulent conditions but
with a sufficiently fast flow rate to minimize wall losses If a wet denuder is installed
before the PC it can change the original particle size distribution due to aerosol
hydration For this reason the PC with a built-in cyclone was not used in the field
studies with the PPWD units A stainless steel tube SI (lOO mm id 124 mm od 26
cm long) fashioned into an approximately semicircularU shape breaches the PVC tube
at a convenient height within the shelter such that one end of the steel tube is located at
the precise center of the PVC tube pointing upward in the direction of the incoming
airflow In experiments where total particle composition was measured no cyclone was
used and the stainless steel tube directly terminated in the bottom air inlet of the PPWD
which in turn had the PC connected in top The PPWD was strapped to the PVC conduit
as shown in Figure 43 In experiments using this arrangement the gas composition was
102
also measured and tube SI was lined inside with a tightly fitting PFA tube In other
experiments where PM2 5 composition was measured a Teflon-coated Aluminum
cyclone (URG-2000-30EN University Research Glassware Chapel Hill NC) C was
interposed between the stainless tube inlet and the PPWD (The principal flow stream of
interest through the PP WDPC is 5 Lmin the cyclone is designed for 10 Lmin For
simplicity the Y-joint between C and the PPWD and the auxiliary exhaust system that
aspirates the balance 5 Lmin has not been shown in Figure 43) In this configuration
gas sampling was conducted with a different train altogether using a second denuder
This is because the loss of certain gases notably HNO3 in the cyclone was deemed
inevitable A water trap T and a minicapsule filter MF were placed after the PC This
prevents any water condensation downstream of the PC entering the mass flow controller
(MFC model AFC 2600 Aalborg Orangeburg NY O-IO SLPM) Aspiration is
provided by an air pump (model DOA-P120-FB Gast Manufacturing Corp Benton
Harbor MI) All air ptrnips were typically located below the shelter to reduce noise in
the work environment
Liquid Phase Analytical Svstem
Referring to Figure 43 aside from pump P2 the dedicated liquid aspiration pump
for the particle system liquid was pumped using a variable speed 8-channel peristahic
pump (Dynamax RP-I Rainin PPI-7) at a fixed pump speed of 45 RPM Some of the
operational details of the denuder and chromatographic systems are similar to those
reported by Boring et al^ Pharmedreg pump tubing was used throughout 74-28 threaded
103
PEEK tubing adapters (PF-S VICI) Pump lines 1-2 (129 mm id PN 95709-32 Cole-
Parmer) feed the denuder with liquid one on each side ~1 mLmin In most of our
work we used 05 mM H2O2 This nonionic liquid is compatible with the effluent being
subjected to analysis by IC for determining gas composition Questions have been
raised however about the ability of such a liquid to remove weak acid gases notably
HONO and HO Ac particularly in the presence of large SO2 concentrations^^ However
as shown in Figtire 43 the PPWD effluent in the particle sampling train is simply
discarded whenever separate dedicated denuders are used in the gas and particle
sampling trains Any liquid can therefore be used in the particle system denuder A 005
M phosphate buffer in the pH 6-7 range is applicable as the scrubber liquid and is
particularly effective in removing soluble basicacidic gases ranging from NH3 through
HONO to SO2 to strong acids Pump channels 3-4 (152 mm pump tubing PN 95709-
36 Cole-Parmer to ensure that the input liquid is completely removed) takes the denuder
effluent to waste
For cases where the PPWD effluent is used for gas analysis the considerations
have been outlined in chapter III In essence the liquid flow rate into the denuder must
be large enough under all operating conditions to keep the denuder wet at all times
however any flow in excess of this should be avoided because of the need to pump the
effluent through preconcentration columns and the upper pressure limitation of peristaltic
pumping
Channel PP5 pumps house-deionized water through a mixed bed deionization
column (67 mm id 20 cm long filled with Dowex MR-3) MB into the particle collector
104
at 1 mLmin (1 29 mm tubing) Pump P2 actuated by the conductivity sensor aspirates
the water containing the dissolved aerosol and any undissolved solid and pumps h
through a filter F (02 fxm 25 mm dia membrane filter PN 6809-4022 Whatman) and
through cation preconcentrator columns CC1CC2 (contained in valve VI) and anion
preconcentrator colunms ACIAC2 (contained in V2) in sequence P2 aspiration rate
must be equal to or higher than that of PP5 (1 mLmin) and is typically between 12 - 18
mLmin a significantly larger flow rate is avoided because of backpressure caused by the
preconcentrator columns CCl and CC2 are 5 x 35 mm columns (Dionex) filled with a
11 mixture of Dowex-50Wx8 H -form 200^00 mesh strong acid resin with a diluent
(chloromethylated polystyrene-divinylbenzene Bio-Beads S-Xl 200^00 mesh Bio-
Rad Inc) ACl and AC2 are Dionex anion preconcentrator columns that were originally
custom-made for this instrument but are now commercially available (PN TAC-ULP 5 x
23 mm Dionex Corp) VI and V2 are both 10-port electrically actuated valves
respectively of the low- and high-pressure types (C22Z-3180EH VICI EV750-I02
Rheodyne)
Pump channel PP6 (129 mm id tube 1 mLmin) pumps either water or 10 mM
NaOH as selected by 12-V all-PTFE solenoid valve V3 (161T031 NResearch Caldwell
NJ) through CCICC2 through one side of the membrane device PMD to waste The
final pump channel PP7 (051 mm id 03 mLmin Cole-Parmer 95709-18) pumps
water freshly deionized through mixed bed resin column MB (identical to that before the
PC) through the other side of the membrane device PMD in a countercurrent fashion to a
standalone conductivity detector CD25 a restrictor tubing R (0125 x 60 mm) to waste
105
Except as stated all liquid transfer lines are 20 gauge standard wall PTFE tubing
(086 mm id 20 SW Zeus Industrial products)
Operation and Analysis Protocol
Valve V4 is a 6-port low-pressure manually operated loop injector (C22Z-31EH
VICI) that is used for calibrating the system The injection volume of the loop in this
valve was carefully determined (by filling with a dye solution injection making up the
injected material to volume measuring absorbance and comparing with the absorbance
obtained for the same solution after a known dilution) to be 35 pL An equimolar
mixttire of (NH4)2S04 and NH4NO3 at different concentrations was used to calibrate the
system During this calibration air sampling is shut off When V4 is filled with the
calibrant and switched to the inject position P2 pumps the injected sample downstream
where the ammonium is captured by CCICC2 (CCl is in position in Figure 43 as
drawn) The anions pass through the cation exchanger and are captured by AC1AC2
Placing the cation exchange preconcentrator ahead of the anion preconcentrator is
important because these anion preconcentrators contain agglomerated anion exchange
latex on cation exchange beads and cation exchange sites are still accessible If the
sequence is reversed ammonium will be captured by the anion exchange column
NaN02 and Na2C204 solutions were similarly used to calibrate for nitrite and oxalate
VI V3 PP6-7 PMD CD25 and associated components constitute the ammonia
analysis system In principle a second IC can provide complete soluble cation analysis
in lieu of the arrangement chosen here (although it may be necessary to have respective
106
preconcentrators in parallel rather than series to avoid eluent counterion contamination
between systems) However ammonium is often the dominant cation of interest in
atmospheric fine particles and can be determined in a simpler fashion as in this work
The measurement of ammonitun in a sample by basification and diffusion of the resulting
gaseous ammonia into a receptor stream across a membrane was originally introduced by
Carlson ^ and subsequently used in many arenas including the measurement of aerosol
ammonium The present work differs from extant reports in cation exchanger
preconcentration and elution by a strong base The latter elution technique is uniquely
practiced for a weak base cation and is vital for preventing anion contamination in a
serially connected anion chromatography system
The typical operational sequence involves two 15-min halves of a 30 min cycle
As an example dtiring t = 0-15 min the PC effluent is preconcentrated sequentially on
CCl and ACl At 15 min VI-V3 all switch CC2 and AC2 now take the positions of
CCl and ACl to perform preconcentration 10 mM NaOH pumped by PP6 elutes NH4
from CCl as NH3 which flows through the donor side of porous membrane device PMD
The PMD is made of two Plexiglas blocks each containing a flow channel (600
pm deep 5 mm wide 98 mm long) accessed with 10-32 threaded ports that serve as
liquid inlet and outlet A porous membrane (Metricel polypropylene 01pm pores Pall
Corp PN XE20163) separates the two flow channels a number of screws hold the
blocks together (Note that this membrane is asymmetiic and the transfer extent does
differ on which side of the membrane is made the donor) The difftised ammonia is
received by the DI water flowing countercurrent on the receiver side and is carried to the
107
conductivity detector CD25 Restrictor tubing R prevents any bubbles in the detector
All indicated components as well as connecting tubing are placed inside the
chromatography oven maintained at 29-30 degC V3 switches back to water at t = 23 min to
wash CCl with water such that residual NaOH is removed from it before VI and V2 are
switched back at t = 30 min for CClACl to begin preconcentration again
At t = 15 min as V2 switches chromatography begins on ACl with a 1475 mM
KOH eluent generated by an electrodialytic eluent generator EG40 the chromatographic
unh (Dionex DX 600) consisting of an GS50 pump an AGl 1-HC guard (4 x 50 mm) and
ASl I-HC (4 X 250 mm) separation columns A thermally stabilized conductivity cell
(DS-3) is used in conjimction with a CD25 detector The DS-3 conductivity cell like the
identical cell used for the ammonia system is maintained inside an LC 30 oven Both
conductivity detector signals are acquired on an IBM laptop computer interfaced with the
system through a LAN card (Linksys Etherfast 10100 integrated PC card) via aNetGear
EN308 network hub with Dionex PeakNet 62 software
The cycle repeats every 30 min until deliberately shut off or until a
preprogrammed number of cycles have run System automation and valve control is
achieved via PeakNet software via the TTL and Relay outputs in the chromatographic
hardware
108
Chemicals
All chemicals were analytical reagent grade Nanopure water (Barnstead 18
MQ cm) was used to prepare all standards and eluent H2O2 (30) and NaOH (50)
(NH4)2S04 NaN03 NaN02 and Na2C204 were obtained from standard sources
Particle Generation
Fluorescein-doped particles of different sizes were generated using a vibrating
orifice aerosol generator (VOAG model 3450 TSI Inc St Paul MN) The VOAG
generates nearly monodisperse aerosols The charge on the generated particles were
brought to Boltzmann charge by a Kr-85 discharger and characterized by a laser-based
optical particle counter (model A22I2-0I-115-1 Met-One Grants Pass OR) The
general experimental arrangement and details of VOAG operation have been previously
described^^ The aerosol generator feed solution was (NH4)2S04 doped with fluorescein
all related measurements were made using a spectrofluorometer (model RF 540
Shimadzu) using excitation and emission settings appropriate for fluorescein The
fluorescein content was negligible relative to the (NH4)2S04 except for the smallest size
particles generated in this manner
After inttial design experiments were completed particle size-cutoff
characterization of the final version of the PC of Figure 41b was conducted with
standard polystyrene microspheres (Bangs Laboratories Fisher IN) These spheres
(density 105) were dyed (where the dye was not extractable by water but acetone-
extiactable) by equilibrating a stirred suspension of the polystyrene beads with a
109
Rhodamine-B solution The beads were centriftiged resuspended in water recovered by
filtration through a membrane filter and washed several times with water
To generate aerosols containing these beads a diluted suspension of the dyed
beads were used in the VOAG The 20 pm orifice disk was replaced with a larger orifice
and the liquid filter in the VOAG was removed
Particle Characterization
In a VOAG the eventual equivalent spherical diameter of the dry particle is equal
to the cube root of the feed solution concentration multiplied by the primary droplet
volume and divided by the dry particle density^^ Under otherwise fixed experimental
conditions the particle size can be varied by varying the (NH4)2S04 feed solution
concentration The size of the particles computed from the VOAG operating conditions
was cross checked by the laser-based particle counter data consisting of number counts
of particles in discrete size ranges of 01-02 pm 02-03 pm 03-05pm 05-10pm 10-
30pm and gt30 pm The geometric mean diameter was taken to be equal to the count
median diameter (CMD) The mass median diameter (MMD) and mass median
aerodynamic diameter (MMAD) were then calculated from the geometric standard
deviation of the log normal size distribution of the aerosol the density of anhydrous
(NH4)2S04 (177) and including slip correction The relevant data are reported in Table
41
110
Results and Discussion
PC Cyclone Inlet Design
The horizontal and vertical position of the air inlet relative to the cylindrical
cyclone body as well as its angle of entrance affects the removal efficiency and the
sharpness of the size cut All experiments were conducted at a flow rate of 6 standard
liters per minute Predictably the sharpness of the size cut and the coarse particle
removal efficiency were better with a tangential entry than straight entry of the sampled
air all further work was carried out with the tangential entry design
With the cylindrical portion of the cyclone having a height of-35 mm and an
inner bore of 185 mm the tangential inlet of 4 mm bore was placed at a height of 4 18
and 31 mm from the bottom (bottom middle and top positions) Placing the entry at the
top of the cyclone body allows more room for cyclone action and the 50 cut point
observed changed from 78 to 61 to 49 pm from the bottom to the middle to the top
position An increase in the sharpness of the cut-off behavior was also observed in
moving the entry to the top To obtain a 50 size cutpoint (D50) in the desired 20 to 25
pm range further changes were however clearly needed
Reducing the inner diameter of the cyclone cylinder and reducing the air entry
ttibe diameter are both effective in reducing Dso- The chosen values for these two
parameters in the final design were 12 and 25 mm respectively The penefration of size
standard polystyrene particles in this device is shown in Figure 44 At 6 Lmin D50 for
this device was 215 The sharpness of the cyclone defined as (D^efD^f^ where D16
111
and D84 are the aerodynamic diameter of the particles at 16 percent and 84 percent
penetration efficiency respectively^^ is estimated from Figure 44 to be 160
The PC with a size cut inlet eliminates the need for a separate device to provide
the desired cut This is attractive in systems where particles are of primary interest and
dry denuders can be used to remove potentially interfering gases
Particle Losses in the Inlet Svstem
With a wet denuder and the PC of Figure 41a following h minimal particle
losses prior to the PC are desired Losses for fluorescein-doped (NH4)2S04 aerosol
within the nozzle inlet of the PC alone (without the PPWD ahead of it) was found to be
021 096 129 162 262 and 525 for particles of MMAD values 021 055 099
26 48 and 78 pm respectively (mean of two experiments) The PC hself thus exhibits
very little loss of particles up to 25 pm size This and the following experiment were
conducted at a flow rate of 5 SLPM this was also the sampling rate used in all field
experiments With the PPWD ahead of the PC the particle size specification pertains
merely to that entering the PPWD the aerosol size doubtless grows upon passage through
the PPWD Indeed as Table 42 shows substantially higher losses were observed when
the aerosol was first passed through the PPWD(two separate experimental runs were
made) At 25 pm 11-12 total loss was observed the large bulk of the loss occurring in
the PC nozzle The nozzle was redesigned using a much more gradual 75deg taper instead
of the original 45deg taper and the nozzle diameter was increased from 0397 mm to 0500
mm The loss in the PC nozzle decreased to 36+02 with a total loss in the system in
112
the 5-6 range The growth of less hygroscopic particles will be less and total losses are
likely to be lower than that observed with the (NH4)2S04 test aerosol
Testing for breakthrough of a fluorescein-doped (NH4)2S04 aerosol in the size
ranges stated through the PC was accomplished by putting a quartz fiber filter after the
PC at sampling rates up to 6 SLPM In the worst case lt05 of the total fluorescein was
present in the backup filter extract The PC would thus appear to be a neariy quantitative
collector
Response Time and Carryover
The PC operates under continuous air and liquid flow The liquid sample
coalescing on the inner walls of the PC or the filter is continuously collected and sent on
for analysis At a liquid input rate of 1 mLmin each sampling cycle involves 15 mL of
the liquid sample in and out of the PC To evaluate the response time generated
fluorescein particles were sampled and the liquid sample was directly sent into a
fluorescence detector for continuous detection The system was allowed to sample clean
air for 7 min then the fluorescein aerosol sample was sampled for 15 min followed by
clean air again The fluorescence signal rose to half the plateau value in 3 min and the
10-90 rise time was 55 min The 90-10 fall time was slightiy longer at 68 min
Both were adequate for a 15 min sampling cycle
113
Performance and Detection Limits
Using electrodialytic generation and suppression of the eluent current state of the
art in IC technology the LOD (SN = 3) for chloride nitrite nitrate sulfate and oxalate
were each lt OI ngm^ for a 75-L total sample volume (15 min at 5 Lmin) This is
adequate to make measurements of not just polluted urban air but of a pristine
background environment Ammonium is measured as ammonium hydroxide the latter is
a weak base and a quadratic (or higher polynomial) based calibration equation must be
used for quantitation The SN =3 LOD for ammonium in our system was 8 ngm^
Typical instrument outputs are shovm in Figure 45 for (a) ammonium and (b)
anions in particulate matter using data from Tampa FL Note that very low levels of
particulate nitrite are being measured even though it is a relatively high NOx
envirorunent While some of the nitrite being measured may still be an artifact from the
reaction between water and NOx (not removed by the PPWD) the level of artifact nitrite
produced from a comparable instrument using steam is significantly higher
System Maintenance
For continuous prolonged operation periodic attention to the following items is
necessary Adsorption of organics causes the filter eventually to lose its hydrophobic
character causing water leakage through the pores Insoluble particles slowly block the
filter pores increasing the pressure drop to an unacceptable level In urban sampling the
first generally precedes the latter requiring replacement in 2-3 weeks While the system
has been operated as long as 5 weeks without problems the current practice is to replace
114
the filters as a routine procedure every two weeks Replacement requires less than 5 min
and the data from the next two cycles are discarded because of potential contamination
Peristaltic pump tubes are replaced after three weeks of continuous operation
The anion preconcentrator column (5x 23 mm) provides for low pressure and cannot be
replaced witii the more common 4 x 35 mm type this results in more frequent pump tube
replacements and can cause other problems due to higher pressure drop The membrane
filter after the PC (F Figure 3) is replaced every 4 weeks Despite the presence of F the
inlet frh of columns CCICC2 can get clogged with very fine insoluble PM that passes
through F generating backpressure These are inspected for soiling every two weeks and
replaced as needed
Illustrative Field Data
The system has been deployed in a number of field studies Although comparison
between conventional integrated filter measurement techniques and high time resolution
meastirements such as that provided by the present instrument have the intrinsic flaw that
the high temporal resolution data will have to be averaged back over a much longer
period one is always interested in these comparisons with established methods In that
vein Figure 46 shows a comparison of integrated sulfate concentrations (3- 6- or 9-h
samples) measured independently by Brigham Young University researchers by their PC-
BOSS system^^ with data from the present instrument during a study in Lindon UT in
the summer of 2002 Considering that the sulfate data are all lt2 pgm^ and the problems
115
of getting good filter based measurements at low levels the observed agreement is very
good
Figure 47 shows two-week segments of data for nitrate and sulfate collected in
Tampa FL and Philadelphia PA In Philadelphia sulfate levels are generally much
higher than the nitrate levels It will be further noted that the experimental site is
probably impacted by at least two sources one in which the sulfate and nitrate peaks are
coincident in time and another in which they are not correlated In both Tampa and
Philadelphia the levels are predictably much lower during the weekend In Tampa
nitrate levels are substantially higher than in Philadelphia and peaks in nitrate and sulfate
are much better correlated
Gas concentrations were also measured in most of the field studies In Tampa the
average HCI concentration (071 ppb) was found to be nearly twice that measured in
Houston TX and four times that measured in Philadelphia Both Houston and Tampa
have elevated particulate chloride concentrations relative to more inland sites like
Philadelphia or Lindon UT In Tampa the pattern of HCI and particulate nitrate
concentrations (Figure 48) strongly suggests that at least in part HCI formation is related
to nitrate formation The particle collector data shovm in this case was from an
instrument without any cyclone inlets (The nitrate levels were very much lower when a
25 pm cut point cyclone was put in the line suggesting that nitiate was in a coarse
particle fraction) These observations can be reconciled if at least in part the genesis of
particulate NO3 involves the reaction of NO2 or HNO3 on moist sea-salt
116
The acidity of the particles in particular the ammonium to sulfate ratio on an
equivalents basis is often of interest Figure 49 shows the sulfate and ammonium
concentrations for a two-week-segment of the Tampa measurements The
sulfateammonium ratio in equivalents is almost always greater than unity (corresponding
to (NH4)2S04) and frequently greater than 2 (more acidic than NH4HSO4) The latter
events are mainly associated with day time Note that the relative high acidity events are
short-lived and will not be detected by integrated measurements In Tampa ammonium
and sulfate are all in the fine particle phase where as nitrate is predominantly found in a
size greater than 25 pm Thus no major errors are made in assessing relative acidity
when looking at the ammonium to sulfate ratio rather than ammonium to total anions It
is also interesting to note that dtuing the May 11-12 weekend except for a few hours on
Sunday morning (perhaps due to religious reasons) the ratio persists at tmity
characteristic of an aged aerosol In this context it is also worthwhile noting that we
have encotmtered situations in other campaigns where the aerosol is distinctiy alkaline
ie the total measured ammonium equivalents exceeds the total measured anion
equivalents In agriculturally intensive areas there are significant concentrations office
ammonia measured in the gas phase At high humidity the aerosol has significant
amounts of liquid water and ammonia is taken up therein The present systems (or
comparable steam-based collection systems) see this excess ammonia but in integrated
filter samples most of this excess ammonia evaporates
117
References
1 Pope C A Thun M J Namboodiri M M Dockery D W Evans J S Speizer FE Heatii C W Am J Resp Crit Care 1995 151 669 - 674
2 Schwartz J Environ Res 1994 64 68 -85
3 Schlesinger RB Inhal Toxicol 1995 7 99 - 110
4 Wang H Shooter D Atmos Environ 2002 36 3519 - 3529
5 Kitto A M N Harrison R M Atmos Environ 1992 26A 235 - 241
6 Air quality criteria for particulate matter National Center for Environmental Assessment Office of Research and Development US EPA Research Triangle Park NC EPA600-AP-95-I00IA 1996
7 Suess D T Prather K A Chem Rev 1999 99 3007 - 3035
8 Johnston M V J Mass Spectrom 2000 35 585 - 595
9 Noble C A Prather K A Mass Spectrom Rev 2000 19 248 - 274
10 Maynard A D Philos Trans Roy Soc A 2000 358 2593 - 2609
11 Blatter A Neftel A Dasgupta P K Simon P K in Angletti and G Restelli (Eds) Physico-Chemical Behavior of Atmospheric Pollutants Proc6 European Symposium Report EURI56092 EN Luxembourg 1994 pp 161-111
12 Simon P K Dasgupta P K Anal Chem 1995 67 71 -78
13 Simon P K Dasgupta P K Environ Sci Technol 1995 29 1534 - 1541
14 Khlystov A Wyers G P Slanina J Atmos Environ 1995 29 2229 - 2234
15 Slanina J ten Brink H M Otjes R P Even A Jongejan P Khlystov A Waijers-Ypellan A Hu M Lu Y Atmos Environ 2001 35 2319 - 2330
16 Kalberer M Ammann M Gaggeler H W Baltensperger U Atmos Environ 1999332815-2822
17 Loflund M Kasper-Giebl A Tscherwenka W Schmid M GeibI H Hitzenberger R Reischl G Puxbaum H Atmos Environ 2001 35 2861 - 2869
118
18 Weber R J Orsini D Daun Y Lee Y N Klotz P J Brechtel F Aerosol Sci Technol 2001 35 718-727
19 Orsini D A Ma Y Sullivan A Sierau B BaumannK Weber R J Atmos Environ 2003 37 1243-1259
20 Okuyama K Kousaka Y Motouchi T Aerosol Sci Technol 1984 3 353 -366
21 Dasgupta P K Poruthoor S K Pawliszyn J Ed Wilson and Wilsons Comprehensive Analytical Chemistry Series Vol XXXVII Elsevier 2002 161-276
22 Buhr S M Buhr M P Fehsenfeld F C Holloway J S Karst U Norton R B Parrish D P Sievers R E Atmos Environ 1995 26 2609-2624
23 Samanta G Boring C B Dasgupta P K Anal Chem 2001 73 2034-2040
24 Boring C B AI-Horr R Genfa Z Dasgupta P K M W Martin and W F Smith Anal Chem 2002 74 1256-1268
25 Stolzenburg M R Hering S V Environ Sci Technol 2000 34 907 - 914
26 S Hering MR Stolzenburg Integrated collection and vaporization particle chemistry monitoring US Patent 5983732 November 1999
27 httpvywwrpcocomproductsambprodbrochuresbrochtue8400n pagespdf httpwwwrpcocomproductsambprodbrochuresbrochure8400s pagespdf
28 Allen G A Koutrakis P Ding Y US Patent 6503758 January 7 2003
29 Allen G A Personal Communication April 2003
30 Cofer W R Collins V G Talbot R W Environ Sci Technol 1985 19 557
31 CoferW R Edahl R A Environ ScL Technol 1986 20 979
32 JanakL Vecera Z Anal Chem 1987 59 1494 - 1498
33 Zellweger C Ammann M Hofer P Baltensperger U Atmos Environ 1999 33 II3I-II40
34 Carlson R MAnal Cheml9n 50 1528-1531
35 Carlson R M US Patent 4206299 June 24 1980
119
36 Hinds W C Aerosol Technology New York Wiley 1982 p 381
37 Kenny L C Gussman R Meyer M Aerosol Sci Technol 2000 32 338 - 358
38 Eatough DJ Obeidi F Pang Y Ding Y Eatough NL Wilson WE Atmos Environ 1999 33 2835-2844
120
Table 41 Cotmt median diameter mass median diameter and mass median aerodynamic diameter of particle generated by VOAG with different feed (NH4)2S04 solution doped with fluorescein
(NH4)2S04 + Fluorescein
lX10mM+500ngL
01mM + 500|igL
10mM+500ngL
40 mM +800 ^gL
80 mM+1000 ngL
Count Median Diameter CMD nm
020
093
199
316
398
Mass Median Diameter MMD nm
0411
0869
2695
4168
5241
Mass Median Aerodynamic Diameter MMAD ^m
0547
1155
3584
5544
6969
121
Table 42 Loss of aerosols in the PPWD and the air-inlet nozzle of the PC^
Loss Mass Median Aerodynamic Diameter (pm)
MMAD pm 021 055 099 255 479 778
Dry Denuder Inlet and Outlet
Wet Denuder Plates
PC Nozzle Inlet
^Two separate experimental runs are shovm
09 14
0 0
05 0
12 26
126 205
11 32
026 06
152 08
436 501
104 11
229 217
885 782
21 43
37 475
975 969
26 14
909 946
991 1005
122
Air Suction
025 in
Water Out
Air Suction
Air Inlet
Air Inlet Water Inlet Water Inlet
(b)
Figure 41 Particle collector with (a) straight Air Inlet (b) with cyclone-like size cut Inlet
123
PVC Ambient Air In
C 0 M F SI
Ambient Air In
Trailer Roof
MFC
Trailer Floor
Ambient Air Out
Figure 42 Field sampling and airflow schematic PC particle collector PPWD parallel plate wet denuder C cyclone SI stainless steel ttibe inlet PVC 6 PVC pipe 1 water trap MF minicapsule filter MFC mass flow controller P air sampling pump BF blower fan
124
I ]
p
H2C
P5 -^M^-^^-D^ PC w
Figure 43 Total particle collectionanalysis system air and liquid flow schematic C cyclone PPWD parallel plate wet denuder PC particle collector T liquid trap MF minicapsule filter MFC mass flow controller P air pump PPl-7 peristaltic pump lines P2 one channel peristaltic pump MB mixed bed resin deionizer F filter CCl and CC2 cation preconcentration columns ACl and AC2 anion preconcenfrator columns GS50 chromatography pump EG40 eluent generator SRS self regenerating suppressor GC guard column SC separation column VI low presstire 10 port injection valve V2 high pressure 10 port injection valve V3 3way solenoid valve V4 6 port injection valve S Injection Syringe PMD porous membrane device CD25 conductivity detector R restrictor W waste
125
100mdash1
80 mdash
o c 2 60 o It HI c I 40 0)
0)
20 mdash
n ^ 1 r 2 4 6
Aerodynamic diameter jum 8
Figure 44 Penetration curve of standard size polystyrene beads in the particle collector with a cyclone-style inlet
126
E u (A C
1 8
3 bullo C
8
080
060 -
040
020
000
Ammonium Preconcentrator 1 089 Mgm3
Tampa FL BRACE Study May 6 2002 115 PM
Ammonium Preconcentrator 2 092 Mgm3
E u () c
I I 1 c
3 D C
6
-020
800
600
400
200
000
000 1000 2000 Time min
100 to 115 PM 5 6 0 2 Tampa FL
(VJ
R d
a
iT ( I
5
-200
E
o I o
I
o SI
Y u
a
Preconcentrator 1 Cycle A
3
(S d bullo
SI
3000
1 0)
d
1
(vi I bullS 2
Q I
1
s 3 tn
u
1 a
d S (0
Preconcentrator 2 Cycle B
000 1000 2000 Time min
3000
Figure 45 Representative system output (a) ammonium response (b) anion chromatogram over two cycles Tampa FL
127
3 mdashI
CO
E o) IS
o
3 (0 (fi (A O
QQ I
O Q
2 mdash
1 -
11 Correspondence Line^
9-h sample D D D 6-h sample O O O 3-h sample
1 r 1 2
Present Instrument Sulfate |agm^
Figure 46 Integrated sulfate measurements versus sulfate measured by the present instrument The line shown is the 11 correspondence line not the best-fit line
128
Sulfate
bull Nitrate 30 -
CO
1 20 -
10 -
7a01 71001 71201 71401 71601 71801 72001 72201 72401 72601 Date
20 - I
16 -
12 -
bull Sulfate
^ Nitrate
oi
5202 5402 5602 5802 51002 51202 51402 51602 51802 52002 Date
Figure 4 7 Sulfate and nitrate concentrations in (a) Philadelphia PA July 2001 and (b)Tampa FL May 2002 The enclosed areas are the mghttime hours (stmset to sunrise)
129
6 - 1
4 mdash C 2
bullS
2 lt-gt c agt u c o o 2 -
HCI ppbv
NOj ngm
T I I I I I I I I I I
43002 5202 5402 5602 5802 51002 51202 51402 51602 51802 52002 Date
Figure 48 HCI and particulate nitrate patterns in Tampa FL May 1 2002-May 18 2002
130
(aeqm^ sulfate
neqm^ ammonium
sulfateammonium ratio r- 03
mdash 02
E agt
01
- 0
5402 5602 5802 51002 51202 51402 51602 51802 Date
Figure 49 SulfateAmmonium equivalent ratio with sulfate and ammonium equivalent concentration patterns Tampa FL
131
CHAPTER V
SEMI-CONTINUOUS MEASUREMENT OF
MAJOR SOLUBLE GASEOUS AND PARTICULATE
CONSTITUENTS IN SEVERAL MAJOR US CITIES
Introduction
Exposure to high levels of fine particles is believed to be responsible for tens of
thousands of deaths each year in the US Fine particles have been associated with
hospital admissions from cardiopulmonary diseases and mortality^ While fine particles
come fi-om myriad sources and contain hundreds of inorganic and thousands of organic
components fossil fiiel combustion is typically the single most important source
Secondary aerosols are formed via atmospheric reactions In terms of mass fine particles
are composed of primarily sulfate nitrate and ammonium ions organics and mineral dust
make up most of the rest The complex interaction of gases namely that of sulfur
dioxide nitrogen oxides nitric acid nitrous acid and ammonia with each other wdth
other oxidants and with photochemically generated intermediates underlies the genesis of
ionic inorganic constituents in Particulate Matter (PM) Formation and transport are both
subject to meteorological variables
Sulftir dioxide is predominantly oxidized through homogeneous oxidation by OH
radical^ and heterogeneous oxidation by H2O2 and O3 ^ to form sulfate as an end product
The hydroxyl radical is the only significant gas phase oxidant It reacts with SO2 to form
an adduct free radical (HOSO2) which reacts with O2 to form SO3 Sulftir trioxide then
132
reacts readily v^th water forming sulfuric acid Aqueous phase oxidation proceeds by
dissolution of SO2 in water followed by oxidation with H2O2 The overall reaction rate
depends on relative humidity sunlight intensity and concentrations of oxidants Sulfate
generated as H2SO4 reacts with gaseous ammonia to form ammonium sulfate and
ammonium bisulfate^ These secondary sulfate aerosols exist almost exclusively in the
fine aerosol fraction (lt 25 pm) and are also associated with reduced visibility problems
due to their hygroscopic nature^
Nitric acid HNO3 is formed primarily through the homogeneous reaction of NO2
with OH radical hydrogen abstraction by NO3 from aldehydes or reactive hydrocarbons
or hydrolysis of N2O5 The NO2-OH radical reaction is the major source of HNO3 this
takes place during daytime whereas hydrolysis of N2O5 is the dominant nighttime
source Gaseous HNO3 reacts with gaseous NH3 to form solid NH4NO3 in an
equilibrium however the precise value of the equilibrium constant is greatly affected by
temperature and relative humidity^ bull While sulfate and ammonium exist mainly in the
fine mode nitrate exhibits a bimodal size distribution The nitrate size distribution
depends on location and meteorology In coastal areas coarse nitrate is typically present
as NaNOs formed by the reaction of HNO3 and NOx with NaCl sea salt aerosol This
also resuhs in significant amoimts of gaseous HCI
Nitrous acid is formed by the heterogeneous reaction of gaseous NO2 with water
adsorbed on surfaces ^ ^ this reaction may also be mediated by black carbon In
daylight HONO photolyzes to NO and the OH radical^ Nitrite in the aerosol phase can
be oxidized to nitrate by oxidants^deg including the hydroxyl radical
133
Several measurements of soluble ionogenic gases and their corresponding aerosol
phase components have been conducted in order to establish a comprehensive database to
enhance the understanding of tropospheric chemistry and gas-particle chemical and
physical interactions^ in different environments ^ High temporal resolution gas
composition measurement and meteorological data acquisition has long been possible
aerosol composition meastirement with good time resolution has been difficult
Simultaneous coordinated particle and gas composition and meteorological data with
good time resolution can provide an altogether different dimension of understanding of
atmospheric processes
In this chapter data collected in field measurement campaigns latmched at or in
the vicinity of fotu- major urban US cities and one suburban area are presented All of the
measurements were conducted in the summertime This chapter focuses on data
collected during TexAQS 2000 (Texas Air Quality Study Houston TX) NEOPS 2001
(North East Oxidant and Particle Study Philadelphia PA) BRACE 2002 Study (Bay
Region Atmospheric Chemistry Experiment Tampa FL) and a measurement campaign
in Lindon UT a suburban location in 2002 The focus is on incidents that highlight the
importance of continuous analysis in better understanding gas-particle partitioning
heterogeneous chemistry of PM formation relations between PM growth and the
precursor gases An overview of the observed chemistry at the different sites is also
presented
134
Sampling Sites
The Texas Air Oualitv Study (TEXAOS 20001
The Texas Air Quality study ^^ took place during July and August 2000 Houston
has been cited as having numerous air quality problems it is presently in violation of
some of the national ambient air quality standards ^ The study was conducted to better
plan for how the Houston-Galveston regional area and the state can better meet the air
quality objectives The 2000 population of greater Houston (Houston -Galveston-
Brazoria) was 47 million ranking lO in the US The combination of heavy emissions
with the coastal weather patterns adds to the complexity of Houstons air quality
problems Southeast Texas has the largest petrochemical manufacturing industry in the
US It is estimated that around 25 million people in Houston area are exposed to PM
concentrations that exceed 15 pgm^ (annual average)^^ Many different groups
participated in TexAQS 2000 Experimenters were distributed among a significant
ntimber of experimental sites The data discussed here was obtained at Houston Regional
Monitoring Site 3 (HRM3 EPA site number 48-201-0803) located dovrawind from the
heavy industrial area of the Houston ship channel The site itself is located next to a
petrochemical and a chemical manufacturing complex where contributions from primary
emissions can be occasionally significant The land-sea and land-bay breezes are
Oft
responsible for diurnal flow reversal and alternating periods of clean and polluted air
As in most other southern cities the most severe pollution episodes occur during the
summer when generation of secondary PM peaks
135
The Philadelphia Study
The study she in Philadelphia PA was one among a network of sites in the North
East Ozone and Particle Study NEOPS^^ The study was conducted thorough the month
of July 2001 The site was located 13 km northeast the city center of Philadelphia at the
Baxter Water Treatment Facility on the banks of the Delaware River Philadelphia lies
along the northeast corridor between New York and Baltimore (-120 km Southwest of
New York-180 km Northeast of Baltimore) yet more inland (- 200 km offshore) than
both land-sea breeze patterns here has much less effect than Houston Philadelphia-
WilmingtonmdashAtlantic City metropolitan area has a 2000 population of 62 million
ranking 6 in the US
The BRACE sftidv
BRACE^^ was held in Tampa Florida in April and May 2002 There were a
ntimber of experimental sites the principal site where our instilment was located was
located in Hillsborough County near the Valrico Waste Water Treatment Plant (Valrico
WWTP Valrico FL) 20 km West of Tampa city center and 16 km northeast of the bay
The site was in an open agricultiiral area along the predominant northeasterly wind
trajectory h is subject to local traffic emissions and occasionally to plumes from tiie
Tampa Electric Company coal-fired power plants (Gannon and Big Bend plants) The
Tampa-St Petersburg-Clearwater metropolitan area has a 2000 population of 24 million
136
The Lindon Study
In Lindon UT the sampling site was located at the Lindon Elementary School
where a State of Utah air quality sampling site is also located Lindon is 13 km west
nortitwest of Provo UT and 53 km south southeast of Salt Lake City UT The Provo-
Orem area has a 2000 metropolitan population of 037 million (rank no I l l ) and the Salt
Lake City - Ogden area has a 2000 metropolitan population of 13 million (rank no 35)
The sampling site is expected to be impacted predominately by emissions from mobile
sotirces There were no significant point sources that were expected to impact the site
during the study dates in August 2002
Experimental
Table 51 shows the different sampling locations associated sampling periods
measured species and the techniques by which they were measured All the listed gases
(HCI HONO HNO3 SO2 H2C2O4 and NH3) were collected using a high efficiency
parallel plate difftision denuder with 05 mM H2O2 as denuder liquid described in chapter
III Air sampling rate was 5 standard Lmin (SLPM) throughout The denuder liquid
effluent is preconcentrated on sequential cation and anion preconcentrators Using a 10
or 15 min cycle time the collected ions were eluted and analyzed Ammonium captured
by the cation preconcentrator is eluted with NaOH and is passed across an asymmetric
porous membrane device which allows the ammonia from the alkaline donor stream to
difftise into a deionized water receiver stieam flowing countercurrently The
conductivity of the receiver effluent was measured and provides a measure of the
137
collected ammonium The anions were measured by a ftilly automated ion
chromatography system
With tiie exception of the measurements made at Tampa the gas and aerosol
sampling trains were separate In principle it is possible to take the wet denuder effluent
and send it to one analysis system for the measurement of the collected gases and send
tiie effluent from tiie particle collector following it This is precisely the configuration
tiiat was used in Tampa where prior available evidence indicated that nitrate may have
significant presence in a coarse size fraction and no size cut inlet was implemented
Implementing a size cut eg to measure PM25 is difficult in a single train where both
gases and particles are to be measured Implementing a device like a cyclone upstream of
the denuder can lead to large losses of reactive gases especially HN03^^ On the other
hand incorporating the cyclone after the wet denuder does not impose a size cut on the
aerosol that is relevant to the original aerosol population as the aerosol grows
significantly in size dtiring passage through the wet denuder As such two independent
trains (PPWD for gas Cyclone-PPWD-Particle collector for PM25) were used whenever
both gas and PM25 compositions were of interest
For the particle collector in Houston the automated alternating filter-based
system^^ described in Chapter III was used This system uses two glass-fiber filters that
alternate between sampling and washing and drying The frequent washing and drying
does however cause leaching of fibers from these filters that can lead to fouling of
downstream components and thus requires significant maintenance In all subsequent
studies a more robust and compact mist reflux system^^ that is described in Chapter IV
138
was used Briefly the denuder effluent airflow enters a compact Plexiglas chamber
through an inlet nozzle DI water is delivered through a capillary into the center of the
airflow The generated water mist attaches to the aerosol which impacts on a
hydrophobic PTFE membrane filter that constitutes the top of the PC and the airflow exit
Water drops coalesce on the filter and fall into a cavity equipped with a liquid sensor
The solution containing the dissolved constituents is aspirated by a pump and pumped
onto serial cation and anion preconcentrator columns With a 15 min analytical cycle and
a sampling rate of 5 Lmin the limit of detection (LOD) for ammonium is 8 ngm^ and
for sulfate nifrate and oxalate is OI ngm^
Results and Discussions
Overview
The average concentrations of PM components and gases are shown plotted in
Figures 51 and Figure 52 The minimum (usually zero) and maximtim excursions are
numerically shown on each bar The median rather than average particulate Cl values in
Houston is shown because even after washing filter blanks in newly put in filters may
contribute significantly to the measured chloride content and maximum chloride content
information may also not be meaningful
Not surprisingly sulfate nitiate and ammonium constitute the majority of the
soluble inorganic mass of the PM The sum of the average concentiations of all soluble
anions in PM was the highest in Houston followed by Philadelphia and Tampa
Conversely total soluble anions was the lowest in Lindon this follows closely tiie extent
139
of urbanization The fraction of sulfate that constitutes the total measured anions (on an
equivalents basis) was the lower in Houston (036) than at the other sites Particulate
chloride content was by far tiie highest in Houston (median 38 pgm^) followed by
Tampa which averaged about a third of that in Houston and all other chloride
concentrations were lower still by factors of 2-4 On the average the aerosol was most
acidic in Tampa and Lindon in Houston and Philadelphia the measured ammonium
equivalents exceeded tiie measured anion equivalents The Houston aerosol contained
the largest amotmt of NRt compared to any other sites
Some caveats may be in order regarding the data in Houston There were other
adjacent industrial sources on other sides It is possible that because of the very close
proximity of the sampling location to industrial sources the resuhs for some of the
species are not representative of the typical regional air quality However at the same
time it is also true that many other parameters measured at this location have been
indicative of highly polluted air in the region For example concentrations of HCHO a
secondary product formed through photochemical reactions exceeded 25 ppbv on
numerous afternoons and the maximum measured concentration exceeded 47 ppbv 2-3
times the maximtim concentration measured in urban Los Angeles in the late 80s
Particulate Chloride and HCI Concentrations
The high chloride concentration in Houston substantially higher than that
observed in Tampa is all the more remarkable because not only is Houston a more inland
location PM25 measurements were made in Houston and TSP measurements were made
140
in Tampa (actual sampling inlet geometiy probably resulted in a size cut of-20 pm)
The size cut in the particulate sampling protocol imposed in Houston would have
excluded tiie majority of the sea-salt aerosol that typically will be at a larger size fraction
tiian PM25 especially at relative humidity typical of summertime Houston Despite the
particulate chloride concentration being much higher in Houston than in Tampa the
gaseous HCI concentrations were significantly higher in Tampa than in Houston At both
sites there is no correlation between particulate chloride and HCI (r values were both
well below 001) This is to be expected because even if the genesis of HCI is connected
to particulate chloride eg by reactions with NO2 HNO3 or H2SO4 it is the availability
of these reactants rather than the availability of particulate chloride that is likely to be the
limiting factor
The close correspondence of Na with Cl as a fimction of particle size in the
Tampa aerosol ^ leaves little doubt about the sea-salt origin of the chloride in this sample
Sodium was not directly meastu-ed in the Houston aerosol However the cation-anion
equivalent balance in this case does not indicate that an amotmt of Na corresponding to
the large amount of chloride fotmd is likely Rather h appears likely that local sources in
the immediate neighborhood of the sampling site are responsible h is knovm tiiat one of
the nearby plants is among the largest emission sources of chlorine-containing-
compounds in the region and another deals with polyvinyl chloride Some appreciation
of the potential impact of local sources impacting the HRM-3 site can be gleaned from
the photograph of the site in Figure 53 While industrial operations on the back of the
141
site are visible not visible are indusfrial operations to the left of the photograph and on
the back of the camera location
Sulfur Dioxide and Sulfate
The rate of conversion of SO2 to S04^ is a function of multiple factors most
importantly the concentration of oxidants sunlight intensity and relative humidity The
relative ratio of sulfate aerosol to SO2 in a pitune is indicative of the age of the plume
Air masses that impact a sampling site come from different sources have had different
processing histories and are of different age For most of the data in the present chapter
meteorological data are available It is in principle possible to calculate back trajectories
of the air masses and discuss each significant case individually This is however beyond
the scope of the present chapter Nevertheless any significant degree of correlation
between SO2 and sulfate shows the genesis relationship between the species this
correlation will increase as the air mass arrives with a mean transport time close to the
mean half-life for the conversion of SO2 to sulfate A positive correlation (p) between the
gas and particle phase exists in all sites (pTampa= 021 pHouston = 028 pphiiadeiphia = 046)
Tampa has distinct episodes where the air mass originates from the open ocean or
elsewhere eg from further south in the State Philadelphia had tiie highest average mass
of sulfate among the four cities The average sulfate concentration in Philadelphia is 157
and 139 times that in Houston and Tampa respectively This is not directiy associated
with the precursor SO2 levels measured in these locations In fact the SO2 level is
slightly higher in Houston and only intermediate in Philadelphia This lack of direct
142
association between SO2 and S04^ levels in different locations in addition to the their
significant correlation tiiat exists in Philadelphia may be due to the location of
Philadelphia in tiie Nortiieast corridor and being subject to a photochemically more
developed air mass
Figures 54 55 and 56 show a representative one-week plot of SO2 and S04^
concentiations in each tirban location It can be clearly seen from the figures that the best
correlation between SO2 and S04^ exists in Philadelphia Figure 54 shows a clear
diurnal pattern for both SO2 and S04^ in Philadelphia with the daily sulfate maxima
lagging that of sulfur dioxide SO2 levels start increasing between 600 and 800 am
reaching their maximum levels at around 930 am while sulfate levels reach maximtim at
around 300 pm The observed sharp increase and decrease in SO2 concentration seems
associated with the rush in traffic expected each morning In accordance with either gas
phase or aqueous phase SO2 oxidation by OH radical or H2O2 respectively smoother and
more gradual increase and decrease is observed for sulfate levels than for SO2 Gaseous
SO2 supplied to the atmosphere is removed principally by three processes direct
scavenging in precipitation oxidation to aerosol sulfate with subsequent deposition by
vertical and horizontal precipitation and dry deposition The rates of these removal
processes which vary with environmental conditions along with the transport velocity
must be known in order to understand the fate of SO2 In a typical summer day tiie
-5
estimated lifetime for SO2 in the atmosphere is about 15 days
In Houston however the maximum SO2 concentration occurs at night while the
sulfate maximum precedes it by few hours (Figure 55) This seems in accordance with
143
tiie argument presented before that the site is located in an industrial area with heavy
local nighttime SO2 emissions from nearby sources (flaring in petrochemical industries is
notoriously carried out late at night and nocturnal inversion may also help trap the
plvune) In Tampa sulfate and SO2 exhibit patterns with muhiple spikes observed during
the day (Figtire 56) The site is predominantly affected by local traffic however
occasionally plumes from coal power plants passed directly over the site and were
detected by the instrument as can be observed by the fact that the maximum measured
concentiation of SO2 SO4 and HNO3 were measured in Tampa (Figure 52 and Figure
51) The pattern of sulfate in Lindon is similar to that of sulfate in Philadelphia (Figure
57) Despite the much lower concentration a relatively clear diurnal pattern is observed
Nitious Acid Nitrite Nitiic Acid and Nitrate
Table 52 shows the day and night correlation values among N03 N02 HONO
and HNO3 The mean NO2 and HONO concentrations are higher tiian the respective
mean NO3 and HNO3 concentrations in Philadelphia The ratio of the average N02 to
NO3 concentrations and HONO to HNO3 concentrations are 127 and 132 respectively
This close ratio in the particle and gas phase associated with the relatively high
concentiations of both HONO and N02 is not observed in the other tiiree locations Also
a far more significant positive correlation exits between N03 and HONO in Philadelphia
than in Houston or Tampa Due to the expected nighttime abundance and rapid daytime
photolysis of HONO such a correlation with HONO suggests tiiat the concentration of
nitiate is higher during nighttime than daytime Indeed the ratio nightday concentration
144
of nitiate in Philadelphia is 257 while that of nitric acid is 033 At nighttime the
formation of NO3 has been reported to occur due to hydrolysis of gaseous N2O5 on wet
surfaces and aerosol particles to form aqueous HNO3 ^ N2O5 is formed at night by the
reaction of nitiate radical NO3 with NO2 In turn NO3 radical is formed by the
oxidation of NO2 with ozone Thus the formation of nitrate aerosols in Philadelphia is
dominated by nighttime formation^ While in Tampa Houston and Lindon the nitrate
seems to be dominantly formed dtiring daylight via OH radical
Figure 58 and Figure 59 show the pattern for gaseous HONO and HNO3 and
particulate NO3 and NO2 in Philadelphia respectively Nitrate does exhibit a nocttimal
maximum associated with that of HONO in Philadelphia This can be seen very clearly
dtiring the night of July 1617 when the concentrations are higher than those of previous
days Furthermore the diurnal variation of both gases and particles are well resolved but
unlike NO3 NO2 and HONO HNO3 shows a daytime maximtim typically occurring
between 100 and 300 PM The pattern of NO2 NO3 and HONO are broadly similar
but HONO shows the most variation The significant nighttime correlation between
HONO N02 NO3 may suggest that gaseous NO2 is high and more liquid water is
available due to condensation Indeed the heterogeneous reaction of NO2 with H2O
adsorbed on surfaces or aerosols produces HONO(g) and aqueous HN03^^ Also both
HONO and NO2 can be oxidized in aqueous particles to form NO3 However it is more
likely that the nighttime formation of N03 is due to the hydrolysis of N2O5
Unlike in Philadelphia NO3 has an insignificant nighttime correlation and
daytime correlation with HONO in Houston The diurnal pattern appears more clearly for
145
tiie gases than tiie particles however an increase in daytime nitrate can still be clearly
seen in Houston
The lowest measured average concentration of HNO3 is in Tampa The average
concentiation of nitiic acid in Tampa is less than half that measured in Philadelphia or
(Figure 52) Houston however the average concentration of nitrate is more than double
that in Houston and three times higher than that in Philadelphia or Lindon (Figure 51)
In Tampa a significant correlation exists between overall (day and night) HNO3 and total
NO3 (p=044) Since overall NOx concentrations are not that disparate this strongly
suggests that HNO3 is being converted to particulate nitrate in Tampa Indeed the high
average concentiation of total NOs is due to the formation of lutrate on coarse sea salt
particles by the reaction of HNO3 (and possibly NO2) with NaCl This is discussed in
greater detail in a later section The coordinated variation between nitrate and nitric acid
is obvious in their pattern The close diurnal pattern can be clearly seen in Figure 512
between May 7 and May 112002 as well as on the afternoon of May 13 2002 Notice
also the simultaneously low levels of nitiate and nitric acid on the days between May 7
and May 13 Figure 513 shows nitrite and nitrous acid levels in Tampa Both nitrite and
nitious acid levels are relatively low but HONO shows strong interesting variations
between day and night Notice the gradual increase in nitrous acid concentration as the
night progresses and the relatively sharp drop in the morning Nitrate and Nitrite levels
like otiier PM levels are low in Lindon however a stronger variation and clearer diurnal
pattern is seen for nitrate than for nitrite (Figure 514)
146
Observation of High PM pnH Tr^ce Gases FpinHes in Philadelphia
During tiie NEOPS study three major events of high PM and trace gases were
observed The first and second episodes occurred on July lO Vd July I7^ respectively
and were relatively brief lasting for only one day However the third episode started on
July 22 and lasted till tiie 26 During this episode strong diurnal pattern for both PM
and gases were observed and the highest levels were measured on the 25 Figure 515
Figure 516 and Figure 517 show tiie variations of N03 S04^ SO2 and HONO3 during
tiie first second and tiiird episode respectively The wind direction and solar radiation for
tiiese episodes are shown in Figure 518 All those episodes were strongly correlated with
a south southwest wind which brings the air mass from the city center to the study site
The second episode which took place between July 17 and July 18 serves as a good
representation of the other two episodes
July 17 started with a northern wind associated with low levels of pollution Just
after midiught the wind became southeast blowing a different air mass over the site A
sharp increase in SO2 S04^ and NO3 levels was observed that lasted until early morning
hotirs The close similarity in the concentration profiles of SO2 S04^ and NO3 in the
early part of the night suggests that these species have originated from the same sotirces
andor has been simultaneously photochemically processed during the previous day By
morning hours the wind direction became from the southwest The correlation between
gas and particle concentrations specifically between SO2 and SO4 immediately
deteriorated While sulfate maintained its high nighttime level of-15 pgm^ SO2 levels
increased sharply exceeding 30 ppb at 900 am before dropping sharply at noon This is
147
probably associated witii tiie local morning emissions of SO2 especially since the wind
was blowing from tiie city center to the site S04^ and HNO3 are associated with
photochemical activity thus increased rapidly during daytime and reaching their
maximum levels in the afternoon The next day was dominated by a northeriy wind
associated with substantially lower levels of gases and particles
This relation between wind direction and elevated levels of PM and gases can be
seen on an extended scale in the last episode The episode was longer lasting 4 days and
associated with a rectirring ditimal pattern with incremental levels
NitrateChloride Replacement on Sea Salt Particles in Tampa FL
Recent studies of size resolved particle analysis in Tampa Bay has revealed the
predominant existence of nitrate in the coarse PM size fraction and sulfate in fine PM
size fraction^ The average PM25 nitrate composhion measured in Tampa from May I to
May 9 2002 is 029 pgm^ while the average TSP nitrate composition is 209 pgm^ for
the same period However the average fine and total sulfate for the same period are 518
pgm^ and 558 pgm^ respectively The PM25 were measured by different instrument
tiiat has been developed by URG Corp The instioiment uses steam to grow and collect
particles The large difference between the average total and fine nitrate fraction is
attributed to the reaction of gaseous HNO3 or other NOxNOy species with particle
surfaces and compounds thereon The most significant of these reactions is tiiat between
HNO3 and NaCI(s aq) in sea salt particles which resuhs in the production of HCI(g)
Indeed the highest average HCI concentration was measured in Tampa In addition the
148
correlation between HNO3 and HCI is significant (p- 0734) reflecting the direct
relationship between reaction of HNO3 and liberation of HCI gas The correlation
between NO3 and HCI is 035 Despite being significant it is smaller than that between
HCI and HNO3 This may be atfributed to formation of coarse nitrate through other
documented reaction patiiways such as the reaction of NO2 with NaCl^ Figure 519
shows representative one -week patterns of HCI HNO3 and N03 in Tampa The close
correlation in the pattern of HCI and HNO3 can be cleariy noted in the figure
The relative concentration of fine and coarse nitrate and the scarcity of fine nitrate
in Tampa are related to the different nature of nitrate in the fine and coarse PM fraction
Fine NO3 is predominantly NH4NO3 formed by the reaction of NH3 and HNO3 and
requires a certain partial presstire product of NH3 and HNO3 to exist The reaction is
reversible thus relating the existence of fine nitrate to sufficient abundance of ammonia
which in turn is related to the acidity of fine particles and the level of sulfate
neutralization In Tampa the ratio of sulfate equivalents to those of ammonium is more
than unity ie the aerosol is acidic at the level between NH4HSO4 and (NH4)2S04
Under these conditions if nitrate were present as NH4NO3 HNO3 would form and be
driven into the gas phase and in turn will react with sea salt aerosol to form coarse
NaNOs Thus the lack of sufficient ammonia for complete neutralization of sulfate in
addhion to the abundance of sea salt NaCI may be behind the almost exclusive presence
of nitrate in the coarse PM fraction
Figure 520 shows the patterns of HCI Cf and relative humidity (RH) in
Tampa An inverse variation between HCI and relative humidity is clearly observed in the
149
figure witii HCI maximum occurring at RH minimum The degassing of formed HCI
from sea salt particles depends on relative humidity Thermodynamic calculations
predicted that 90 of the initial HCI concentiation is lost from droplets at relative
humidity less than 97 but under extremely humid conditions HCI will not be depleted
from large droplets^ The abundance of HCI gas suggests that relative humidity was not
sufficiently high to prevent the degassing of HCI from the particle phase
Ammonia Ammonium and PM Neutralization
Semi-continuous measurement of NH3 and NH4 has a particular advantage in
eliminating significant errors associated with long term collection Underestimation of
NH3 and overestimation of NILt can be caused by absorption of NH3 to the collection
medium itself or the already collected particulate matter Absorption of NH3 to acidic
aerosols has been reported in the determination of H2S04 The opposite can happen as
well A presstire drop over the collection medium as well as changes in humidity
temperature and pressure during sampling might change equilibrium condhions for
NH4NO3 aerosols and cause evaporation of NH3^ Such errors are significantly reduced
by reducing the residence time of particles and gases on the collection medium
The ratios of the total measured anion equivalents to ammonitim equivalent are
077 and 061 in Houston and Philadelphia respectively Figure 521 and Figure 522
show a plot of the meastu-ed ammonium equivalent total measured anion equivalents
and measured NH3 levels in Philadelphia and Houston respectively In Philadelphia the
ratio of the total measured anion equivalents to ammonium equivalent is biased by tiie
150
values of tiie last few days of the study specifically from July 18 till July 30 During tiiis
period the measured equivalent ammonium is significantiy higher than that of total
measured anion equivalents and this can be observed in Figure 521 as well In fact the
ratio of the total measured anion equivalents to ammonium equivalent is 123 and 037
for tiie periods from Julyl to July 18 and from July 18 to July 30 respectively In the
latter period the excess ammonium may be due to the uptake of anmionia by aerosols
having significant amounts of liquid water in a high humidity environment The present
system can see tiiis excess ammonia but in integrated filter samples most of this excess
ammonia evaporates Or it may be due to association of ammonium with organic anions
in particulate matter which may be significant during that period In Houston ammonia
from petiochemical sources may be significant and it is very likely that it is being taken
by water containing aerosols Figure 521 and Figure 522 reveal the close association
between the equivalent concentrations of ammonium and total meastired anions The
correlation between the total anion equivalents and that of NIL are 049 and 030 in
Philadelphia and Houston respectively Furthermore consistent with previous
indications that the air mass meastired in Philadelphia is relatively more aged than that in
Houston the correlation between gaseous NH3 and UlU is higher in Philadelphia than in
H o u s t o n (pHouston= 0 1 4 4 pPhiladelphia= 0 34 )
In Tampa both nitrate and chloride are associated with sea salt particles rather
than being neutralized by ammonium Thus sulfate remains the only predominant anion
to be neutralized by ammonia The equivalent ratio of sulfate to ammonitim in Tampa is
109 Though total sulfate was measured sulfate is almost entirely present in fine
151
in particles and seems to be associated mainly with NH4^ rather than Na or Mg present i
coarse sea salt particles Figure 523 shows the equivalent sulfate and ammonium and
ammonia levels measured in Tampa Notice the coordinated variation in the levels of
ammonium and sulfate A ftirther indication of the strong association between sulfate and
ammonium is their high correlation (p= 082) Figure 524 shows a plot of equivalent
ammonium versus equivalent sulfate in Tampa The majority of the points lie in the
region between NH4HSO4 and (NH4)2S04 suggesting that sulfate is only partially
neutialized by ammonium
In Lindon the correlation between equivalent ammonitim and total anion
equivalents is (p == 062) but when only equivalent sulfate and nitrate are correlated with
eqtuvalent ammonium the correlation increases (p = 071) The equivalent ratio of the
total measured anions to ammonium is 179 suggesting that among all locations the most
acidic particles are measured in Lindon However the equivalent ratio of only nitrate and
sulfate to ammonitim is 119 The difference is largely due to the significant equivalent
contribution of chloride relative to sulfate nitrate and ammonium Chloride constitutes
11 of the equivalent anionic composition of PM in Lindon and may be associated with
other cations rather than ammonitim Figure 525 shows the equivalents of sulfate +
nitrate vs the equivalents of ammonitim in Lindon The close time-coordinated variation
of anions and ammonium can be clearly observed especially at the higher concentrations
152
Conclusion
Fifteen minute measurements of inorganic soluble gaseous and particulate
constituents in 3 urban and 1 suburban locations in the United States are presented The
data among different locations and among gases and PM constituents were compared and
correlated Among all locations the concentration of PM was highest in Philadelphia
and lowest in Lindon S04^ levels were compared to precursor SO2 levels in each
location and the correlation between the two was measured in each site In Houston
localized pltunes with significant concentrations of SO2 observed during nighttime
impacted the site location The predominant formation of coarse nitrate on sea-salt NaCl
particles in Tampa was specifically investigated and the levels of HNO3 were correlated
with the production of HCI gas The acidity of particles and extent of neutralization by
ammonium was also studied In Houston and Philadelphia the ammonium equivalents
exceed those of sulfate nitrate chloride and oxalate Particles are slightly acidic in Tampa
and Lindon
153
References
1 Kaiser J Science 2000 289 22-23
2 Pope C A Thun M J Namboodiri M M Dockery D W Evans J S Speizer FE Heath C W Am J Resp Crit Care 1995 151 669 - 674
3 Wang H Shooter D Atmos Environ 2002 36 3519 - 3529
4 Saxena P Hildemann L M J Atmos Chem 1996 24 57 - 109
5 John W Wall S M Ondo J L Winklmayr W Atmos Environ 1990 24A 2349 -2359
6 Matsumoto K Naggo I Tanaka H Miyaji H lida K Ikebe Y Atmos Environ
1998321931-1946
7 Sander S P Seinfeld J H Environ Sci Technol 1976 10 1114 - 1123
8 Monn C Schaeppi G Environ Technol 1993 14 869 - 875
9 Kasper A Puxbaum H Atmos Environ 1998 32 3925 - 3939 10 Hering S V Stolzenburg M R Hand J L Kreidenweis S M Lee T Collett J
L Jr Dietrich D Tigges M Atmos Environ 2003 37 1175 - 1183
11 Russell A G Cass GR Seinfeld J H Environ Sci Technol 1986 20 1167 -1172
12 Hildemann L M RusseU A G Cass G R Atmos Environ 1984 18 1737 -1750
13 Mozurkewich M Atmos Environ 1993 27A 261 - 270
14 Laskin A ledema M J Cowin J P Environ Sci Technol 2002 36 4948 -4955
15 Lammel G Atmos Environ 1996 30 4101 -4103
16 Ten Brink H M Spoelstra H Atmos Environ 1998 32 247 - 251
17 Ammann M Kalberer M Jost DT Tobler L Rossler E Piguet D Gaggeler HW Baltensperger U Nature 1998 395 157-160
154
18 Zellweger C Ammann M Hofer P Baltensperger U Atmos Environ 1999 33
19 Koutrakis P Wolfson J M Bunyaviroch A Froehlich SE Hirano K Mulik J D Anal Chem 1993 65 209-214
20 Geyh AS Wolfson JM Koutrakis P Mulik JD Avol EL Environ Sci Technol 1997 312326-2330
21 Chow J C Watson J G Lowenthal D H Egami R T Solomon P A Thuillier R H Magiliano K Ranzeiri A Atmos Environ 1998 32 2835 - 2844
22 Tanner R L Parkhurst W J J Air amp Waste Manage Assoc 2000 50 1299 -1307
23 Brook J R Dann T F Burnett R T J Air amp Waste Manage Assoc 1997 47 2-19
24 httpvvfv^fwutexaseduresearchceertexaqs
25 Cooke G A Federal Register 67 (148) (2002) 49895-49897 August I 2002
26 httputsccutexasedu-gcarchHoustonSuperSite
27 httpwwwcgenvcomNarsto
28 httpwwwhscusf edupublichealthEOHBRACEBracelinkhtml
29 Li-Jones X Savoie DL Prospero JM Atmos Environ 2001 35 985-993
30 Boring C B Al-Horr R Genfa Z Dasgupta P K M W Martin and W F Smith Anal Chem 2002 74 1256-1268
31 Samanta G Boring C B Dasgupta P K Anal Chem 2001 73 2034-2040
32 A Continuous Analyzer for Soluble Anionic Constituents and Ammonium in Atmospheric Particulate Matter R Al-Horr G Samanta P K Dasgupta
33 P K Dasgupta S Dong and H Hwang Aerosol Sci Technol 1990 12 98-104
34 Lawson D R Biermann H W Tuazon E C Winer A M G I Mackay Schiff H I Kok G L Dasgupta P K Fung K Aerosol Sci Technol 1990 12 64-76
155
35 Campbell S W Evans M C Poor N D Atmos Environ 2002 36 4299^307
36 Finlayson-Pitts B J Pitts Jr J N Chemistry of The Upper and Lower Atmosphere Theory Experiments and Applications San Deigo Academic Press 2000 Ch 8 296 -297
37 Detener N M Crutzen P J J Jeophys Res 1993 98 7149 - 7163
38 Wayne R P Barnes I Biggs J P Burrows C E Canosa-Mas C E Hjorth J Le Bras G Moortgat G K Pemer D Poulet G Restelli G Sidebottom H Atmos Environ 1991 25A 1-203
39 Lammel G Cape J N Chem Soc Rev 1996 25 361 -369
40 De Bock L A Van Malderen H Van Grieken R E Environ Sci Technol 1994 281513-1520
41 Ro C Oh K Kim H Kim Y P Lee C B Kim K Kang C H Osan J Hoog J D Worobiec A Grieken R V Environ Sci Technol 2001 354487-4494
42 Weis D D Ewing GE J of Phys Chem A 1999 25 103 4865-4873
43 Clegg S L Brimblecombe P Atmos Environ 1985 19 46 5-470
44 Koutrakis P Thompson K M Wolfson J M Spengler J D Keeler G J Salter J L Atmos Environ 1992 26 A 987-995
45 Forrest J Tanner R L Spandau D J D Ottavio T Newman L Atmos Environ 1980 14 137- 144
156
Table 51 Sampling locations and available measurements
Location
Houston TX TexAQS 2000
Philadelphia PA NEOPS
Tampa FL BRACE 2002
Lindon UT
Sampling Period
August 12 -September 25 2000
July 1-302001
April 26-May 302002
August 1-30 2002
Gases^
HCI HONO HNO3 SO2
H2C2O4 NH3
HCI HONO HNO3 SO2
H2C2O4 NH3
HNO3 H O N O SO2 HCI NH3
C2O4H2
PM
PM2 5 (N03 N02- S04^
euro204^ NH4^)
PM25 (NO3- N 0 2 S04^
euro204^ NH4)
TSP (NO3 NO2 S04^-
euro204^ NH4)
PM25 ( N 0 3 -
N02 S04^ C204^ NH4 Cl)
System
PPWD + PPWD-altemating filterautomated IC PPWD + PPWD-Mist Reflux Automated-IC PPWD-Mist Reflux Automated-IC
PPWD-Mist Reflux Automated-IC
157
Table 52 Day and night correlation of NO3 NO2 HONO and HNO3 measured in fotir cities
Correlation HNO3 NO3 Correlation HONO NO2
Correlation HONO HNO3 Correlation NO2 NO3
Correlation NO HNO3
Correlation NO3 HONO
Houston TX
Day Night
016 021
041 0044
-0061 -0095
0042 014
-019 -014
0045 -0012
Philadelphia PA
Day
018
032
033
017
056
063
Night
025
0041
029
-0044
038
044
Tampa FL
Day
011
-0040
0057
-012
014
035
Night
021
0084
019
009
-039
0026
Lindon UT
Day Night
0012 -005
158
c 0 E E lt
ZIP 9 6 U - 9 Z 0
900 I see - ZOO
901^- ZOO
0)
X
0
980-frOO L 9 9 9 - 0 C
C8C-300 I 8 9 3 - 0
frZ-9-ZOO
oe-frzoQ 0) 4-)
3 0)
9-8C-990 (_
9Seuro - lpound 0 C
0
5
ZZ 8 - UOO
39Z-C10 I ^ 90Z - UOO
19-9-ZWO E
c 0
3 0 I
E a 3 T5 (0
0)
t ^ o - uoo C96- 9 0 0
Cl-C- 3 0 0 tZP - ZOO
J h Q X
- I h Q X
-J h Q X
J h Q X
c 0 bullp (0 0 0 - I o c c 0
a (A 0) k u 0 o c
(0
Q (0 c
_0
0) z 3 0 (0
jUiyen uoBBJiuaouoo
bull3 3
2
CO
B
s
a S ii c
_o u
I o o a o
o u
a
a bulla a u
00
159
X z
bdquo 303-^10 [ 6S^-0 [
6 C 6 - Seuroi 0 [
O o e^o - 0 [
600-o[
0 o
CM
X
SSO-0 [
etc-zoo [ 8 8 9 - 300 [
0 z X
I66 - kOO
C9Z - 3 0 0 I
si-e-coo I VPL - WO
3frC- 0
CO pound
X D I-I
X Q I-
0 z 0 X
SO-fr -900 [ 3C - ZOO L
I Z I -300 [
h
X
h
Q
z
(0 c 0 n u 0
0) c bullo c 0 a tn
0)
0
o bull0 c n bull0 0) 3 (A (0 0 (0 0) 0) n 0
O X
9 k - 0
1 I
Aqdd uojiampi^uaouoo
d) 9^
a (53
S O
cd 00
I o
o Cl
o I u u c o u
h
Q
X
a bulla a
u gt lt
gtri (Lgt
ap
160
bull gt
a o
o
00
c
o
XI u
o gt 13
ii
C3
-a 1 T3
ca c
CJ
o
_o (Lgt
Q
S 00
161
H O (0 (M
o in
o CM
o CO
0)
M CM
H
o
o H
lt PL
1 3
OH
a CM
H O ^ o CM
bullT3
ure
^ u a u
T3
oxi
UJ3ri
3 00
3
1 00
162
o o
X I-c o () 3 o X
(0 N
3 O
o o o
00
o to
ujsectn
X H d o
O
(U
i U
ca (Lgt
o
3
I 3 iri in u
00 P I
163
CM O
00
ugt
o CM
m
ltM
o
in
CM
o o 1-1 gt irgt
CM o gtgt a gtlaquo m
CM o gt 00
m
CM
o
in
agt S (0
lUSrl
cf
H c
e a u
a u
O
3
I C+H
3 C3
op
164
o bullo
5
CM O
00
00
CM
o
00
CM
o
00
CM
o in
00
CM
o
00
O (0
O
o o od
o q to
o q o q o q d
iu3ri
CM O ^ rH ^ 00
CM o ^ CM i H ^ 00
CM o ^ i H i H ^ 00
H t^ c o bullT3 C
K J
c C1
u
i OH
sur
ca (U
a u +-bull
3 CD
t-j i n u I i 3 00
b
165
lt Q
Q
bullo (0
m 0 0 z Z 0 1 I
o q (M H
0)
C3
o u
a I op
S
ca
i u V3
c u
bulla CL
o sect
gUiSn
o
00 i n (U
gt - op
166
80 - 1 -^ Nitrate -^ Nitrite Philadelphia PA
40
00
71201 71301 71401 71501 71601 71701 71801 71901
Date
Figure 59 Pattern of NO2 and NO3 in Philadelphia PA The enclosed areas are the nighttime hours (sunset to sunrise)
167
0)
O
o
a I 00
u ca ii ca
T3 ii Vi
13 s=i ii a H gtlt H o c3
O
O
g o e i PL
op
168
i 7^rr^lt t
mdashCnV9 ^ ^
o
reg 0) bull bull ^Vraquo
_raquo bull
bull ^ Z A raquo gt
o o Oi V
o o 00
0)
o o
o o to
o o m Oi
o o
o o
0)
o
o o CM
0gt
q CO (M
o a
O UJSrI
claquo
C3
o
CO
O
a
a 00
ii bull ^ - raquo
CO
13 u u
H
gtlt H C o ^-raquo CO 3 O
3
o
o z C t -
o
PL
m u -( 3 00
169
CO o z X
(U
a E (0 1-agt
rat
z
CM O
H N in
CVJ
o bulls
ri
in CM
o CM rH
in
CM
o
in 0)
V O H in
CM
o
in
CM
o 00
in
CM
o rs in
O 00
o o o (NJ
o
o uiSri
o X I ii
a 00
ii bull3 a CO ca a
T3 ii Vi
3 u ii
PL
ca
O
o
ii
i PL CM
in a u 3 00
170
(0 a E I-
Z -
z z
UJSrl
o XI ii
a I 00
bulla -3 a ca CO ca ii ii Vi
O
1 ii X H J
H
rs
o
o z o C-(
o E u
i
a
in
i 00
PH
171
(M O
OO
CO
(M o ^ H X 00
N O
10 H s 00
N o s in H
00
N O N
^
Q) 4^ (0 0
eh
o
a tti
X 00 3
1 u u ^
dar
e
a Vi O
end
a X H H D
00
CM o s m H oo
o (M H N OO
O
00
UJ3rl
3 O bulla
3
3 o
o z o ii
PL
op
172
giuSri
qdd
o o CN
3
3 bull - gt
cd X
1 3 1 X a
e ltu
O H
o z
o
o in
in
i op
173
elUSrt
o o
o 0) H s rs
o o
o o
o IS H bulls fs
O o CN
oo o 12
3
3 gtmdashgt 2
X _amp 13
o V
718
at
e
Q
X OH
3
patte
o z -o
qdd
O V3
o
Vi
in Si 3 op
174
gUiSrl
175
36000 mdash1
bull Wind Direction
Solar Radiation
mdash 50000
mdash 000
100000
I IS
100000
^
5 0 0 0 0 O
(0
amp
000 j5
1 1 1 1 1 1 1 1 1 7 1 7 0 1 7 18 01 7 19 01
^ Wind Direction
laquo 36000 mdashI
270 00 mdash
c S 18000 mdash
Q 9000 mdash bullo c S 0 00
Solar Radiation
V
Y gt^iW4WrrTy
^ laquo f^ -| 1 raquo mdash 1 1 1 1 1 1 1 1 1 1 1 I I I I I I I I T
c o
000 I (B
72101 72201 72301 72401 72501 72601 72701 Date
Figure 518 Wind direction and solar radiation in Philadelphia during high PM and tiace gases episodes
176
)
o X
a E (tj 1-
0) m t
o SJ z t X z
CM O
CO
in CM
o CM
in CM
o
in
CM
o o H in
d) 3 V A (0
CM
o OO
in
CM
o rs laquos in CM
o CO
in
CM o Ss
m in
PL
ca
H 3 Vi
B ii
i I
O
z
o o o cvi
o d
u j 3 n
o OS
gtn
i op
177
A)PUjnH aAUcpd
0)
_ o Z U pound GC Z O
0) fl]
PL
ca O H
H 3 13
e 3
gt
B 13
Uisectn
o o X o CN gtn
S op
Pu
178
qdd ^HN
lt Q
0) bullo fl]
uibaT^
lt PL
d
13 B X PH
3
3 O
ta
u o 3 o o
X
z
z
3 gt 3 u 3
3 gt
3 O
B o H
CN in a 3 00
179
qdd ^HN
o 00
d
o (0 d
o d
o CM
O O d
o o CO
0gt
o o CO s 0gt
o o
s 0gt
o o CM
0gt
o o
H
00
o o (3) CM
CO
o o rs CM
CO
0)
(0
X H d o ^ - raquo CO
3 o
X
3 o
o 3 o o
X
z
z ^ - raquo 3
3 gt 3 cy ii
3 u 3 gt 3 a a 3 O
ca o
H CN CN
ltn
i op
ujbaTl
180
qdd ^HN
(Q Q
fl)
ujbarl
pL
ca
H 3 3 O
bull ^
0) CJ 3 O o
X
z
z
3 gt 3 3 3 gt 3 ii 3 O
3 o H (^ CN i n u i-i 3 op
181
Tampa FL
0 8 0 mdashI Ammonium Bisulfate
060 mdash E O 0)
(0 lt ^ 3
V)
040 mdash
020 mdash
000
Ammonium Sulfate
000 020 040 060 080
Ammonium jxeqm^
Figure 524 Equivalent anmionitmi versus equivalent stilfate in Tampa FL
182
CM O
o eg s 00
CM
o oo H oo
M O
(0 H
00
CM
o H
CO
CM
o CM H
CO
CM
o o H
00
0)
(0
Q
d o 3 3 _S
3 O
ta
o 3 o o m
z
-uibarl
3
3 gt 3 a 3
3 gt (Lgt
3 O
cd -raquo o
H gtn CN i n u 3 op
183
CHAPTER VI
SUMMARY AND CONCLUSIONS
Environmental policies and regulations have always spurred hot debates for their
enormous socioeconomic implications When the Environmental Protection Agency
(EPA) set standards for fine PM in 1997 the agency acknowledged that the uncertainties
associated with setting standards for particles relative to other gaseous pollutants are
significantly higher Despite a major increase in PM related research over the past few
years these major uncertainties remain Atmospheric modeling is helpful in explaining or
predicting atmospheric events but often it does so with a wide range of uncertainty and
large number of asstunptions
The context of this research was to provide tools that scientists as well as
practitioners of atmospheric analysis can use to measure species contributing to
atmospheric pollution There is no argtiment about the need for systems that can
automatically measure chemical composition of PM and of the precursor gases with high
temporal resolution Beside providing a better understanding of the chemistry of gas and
aerosol formation and transport such measurement is also cost effective and does not
suffer from problems associated with long term collection such as particle evaporation
gas-particle interaction and particle-particle interaction on the collection media
184
Two Dimensional Detection in Ion Chromatographv
The recent commercial availability of electrodialytic eluent generators capable of
producing highly pure hydroxide eluents which lead to nearly invariant backgrounds
even with gradient elution makes two-dimensional ion chromatography (2DIC) more
attiactive tiian ever before The work described in chapter II elaborates on previous
studies that utilized base introduction after a conventional suppressed IC It differs from
other work in that passive rather tiian electrodialytic base introduction is used requiring
no electronic control After suppressed conductometric detection of an electrolytically
generated hydroxide eluent and an electrolytic suppressor the eluent is passed into a
membrane device where potassium hydroxide (KOH) is passively introduced into the
eluent stieam using Dorman forbidden leakage The background conductance measured
by a second downstream detector is typically maintained at a relatively low level of 20 -
30 pScm Weak acids are converted to potassium salts that are fully ionized and are
detected against a low KOH background as negative peaks Further different
commercially available membranes have been studied in different physical designs and in
different thickness with different bases to determine the optimtmi conditions so that
resuhs as good as the best of the previous electrodialytic base introduction efforts can be
realized in a simpler maimer Device configurations investigated include a planar 2-
channel device a tubular device and a filament filled helical (FFH) device The FFH
device provides more effective mixing of the penetrated hydroxide with the eluent stream
resuhing in a noise level lt 7 nScm and a band dispersion value of less than 82 pL
185
In conclusion 2-D IC in hs presentiy developed form is simple to implement and
practice Aside from improving the detectability and response linearity characteristics of
weak to very weak acids it provides a wealth of information that is otherwise difficult or
impossible to obtain 2-D data can be exploited for diagnosis of co-elution and
performing universal calibration It can be used for the estimation of analyte pKa values
and the calculation of analyte equivalent conductance both as means of identification
However user-friendly software that can fiilly utilize the 2-D data is needed for the
complete exploitation of the technique Recent advances in the understanding of ion
exchange devices in ion chromatography may even make possible 3-D detection schemes
(HX MX MOH) However even the present state of development provides a very useful
tool to the interested user
Measurement of Acid Gases and Soluble Anions in Atmospheric Particulate Matter Using a Parallel Plate Wet Denuder and an
Alternating Filter-Based Automated Analysis Svstem
Chapter III describes a fitlly automated instrument for the meastirement of acid
gases and soluble anionic constituents of atmospheric particulate matter Soluble gas
collection is accomplished with a parallel plate wet denuder (PPWD) The denuder liquid
effluent is then preconcentrated on anion exchange preconcentrator colunms and then analyzed
by IC In a second independent chatmel a new instrument collects particles in a fully
automated procedure The system mimics the standard procedure for the determination of
anion composition of atmospheric aerosols A cyclone removes large particles and the
aerosol stream is then processed by a second wet denuder to remove potentially
186
interfering gases The particles are then collected by one of two glass fiber filters which
are alternately sampled washed and dried The washings are preconcentrated and
analyzed by IC The instrument provides high sensitivity and allows analysis of anions in
aerosol in only a fraction of the time and cost of conventional techniques A wide range
of aerosol constituents can be determined by simply changing the analytical technique
used to analyze the filter extract Detection limits of low to subnanogram per cubic meter
concentrations of most gaseous and particulate constituents can be readily attained
Ftuther an attempt to decipher the total anionic composhion of urban particulate
matter by IC with on-line confirmation by MS revealed the complexity of particles
compositions Several organic anions were identified and quantitated most commonly
formate acetate oxalate lactate glycolate malate and malonate
A Continuous Analvzer for Soluble Anionic Constituents and Ammonitmi in Atmospheric Particulate Matter
The filter based instrument described in chapter III is field worthy and has been
extensively field-tested However leaching of fibers from presently used fibrous filters
has led to fouling of downstream components of the analytical system In addition the
filter system intrinsically operates on a batch mode To accommodate the needs of future
continuous analysis systems a truly continuous analysis system is desirable Thus A new
continuous soluble particle collector (PC) has been developed Described in Chapter IV
this device does not use steam and avoids the problems associated with fibrous filter
leaching The PC is essentially a sealed cylindrical chamber (3 in od 25 in id 375
in taII)This compact collector permits automated collection and continuous extraction of
187
soluble anions and ammonium in atmospheric particulate matter The PC is mounted
atop a parallel plate wetted denuder for removal of soluble gases The soluble gas
denuded air enters the PC through an inlet One version of the PC contained an integral
cyclone-like inlet For this device penetration of particles as a fimction of size was
characterized In the simpler design the sampled air enters the PC through a nozzle and
deionized water is pumped peristaltically at 1 mLmin into the PC chamber through a
stainless steel capillary that delivers the water to the air stream just exiting the nozzle
The water is aerosolized by the high velocity air creating a fine mist The resulting water
mist attaches to the aerosol which impacts on a hydrophobic PTFE membrane filter that
constitutes the top of the PC and the airflow exit Water drops coalesce on the filter and
fall below into a purpose-machined cavity equipped witii a liquid sensor The water and
the dissolved constituents are aspirated by a pump and pumped onto serial cation and
anion preconcentrator columns Ammonium captured by the cation preconcentrator is
eluted with NaOH and is passed across an asymmetric membrane device which allows
the ammonia from the alkaline donor stream to difftise into a deionized water receiver
stream flowing countercurrently The conductivity of the receiver effluent is measured
and provides a measure of ammonium The anions on the anion preconcentrator column
are eluted and measured by a fiilly automated ion chromatography system The total
system thus provides automated semicontinuous measurement of soluble anions and
ammonium With a 15-min analytical cycle and a sampling rate of 5 Lmin the limit of
detection (LOD) for ammonitim is 8 ngm and those for sulfate nitrate and oxalate are
lt0I ngm^ The system has been extensively field tested The system has been
extensively operated in several field studies averaging 94 data capttire (not including
calibration or maintenance) which indicates instrument robustness and reliability
Although only the ammonium among soluble cations has been measured the
system can be configured with an additional ion chromatograph to measure other major
soluble cations In principle a second IC can provide complete soluble cation analysis
however it may be necessary to have respective preconcentrators in parallel rather than
in series to avoid eluent counterion contamination between systems
Semi-Continuous Measurement Of Maior Soluble Gaseous And Particulate Constituents In Several Maior US Cities
The data collected in four field studies held in Houston TX Philadelphia PA
Lindon UT and Tampa FL using the above described systems is presented in chapter
V Sulfate nitrate and ammonium constitute the majority of the soluble inorganic mass of
the PM Among all locations the concentration of PM was highest in Philadelphia and
lowest in Lindon Concentrations of different gases and ionic constituents of PM were
compared and correlated The correlation between S04^ and SO2 levels was also highest
in Philadelphia In Houston the site location was impacted by a fresh air mass with
significant concentrations of SO2 observed during nighttime Particulate chloride
concentrations were highest in Houston but gaseous HCI concentrations were highest in
Tampa This in addition to the large difference between the average total and fine nitrate
fraction measured in Tampa was attributed to the reaction of gaseous HNO3 or
alternatively NO2 NO3 or N2O5 with coarse sea salt particles A significant correlation
between total measured equivalent anion PM composition and equivalent ammonium
189
exits in all location However The ratios of the total measured anion equivalents to
ammonium equivalent varied significantly among locations
The data collected provide a wealth of information that is of tremendous value
For most of the data presented meteorological data are also available from other
participants in the studies In principle it is possible to calculate back tiajectories of the
air masses and discuss each significant case individually
Conclusion
The systems described in this research were fully automated and possessed a
degree of robustness adequate for field deployment The measurement was based on a 15-
min cycle for collection and analysis The current temporal resolution was mainly limited
by the chromatographic separation Future effort directly involved with these systems
will be focused on developing significantly faster analysis allowing for even higher
temporal resolution while maintaining adequate sensitivity and limits of detection
While the scope of this research constitutes an important contribution to
atmospheric measurement of gases and particles it was mainly limited to the
measurement of soluble inorganic gases and inorganic ionic composition of particulate
matter Measurement of organic gases and organic species present in PM is another even
more challenging and interesting dimension of atmospheric analysis Organic compounds
constitute a large fraction of the total chemical composhion of atmospheric particles
Present available methodologies and instrumentation are unqualified for such a task In
recent years mass spectrometers that have the ability to provide real time measurement
190
of tiie chemical composition of a single particle has been developed However these
instruments are fairly expensive and currently not suitable for reliable quantitative
analysis The development of less expensive alternative instrumentation that can provide
more reliable quantitative real-time analysis of organic gases and organic composition of
PM will be among the future projects that I would like to research
There is significant interest in developing systems with a capacity to detect bio-
agents for early detection of airborne bacterial and viral contamination This year the US
government is proposing 6 billion dollars for a bioshield program A significant portion
of it will tmdoubtedly be spent on developing necessary early detection technology
Again The cost and complexity of mass spectrometry provide an opportunity for
developing less expensive and more specific technology
The tmcertainty of any ambient air analysis is largely affected by problems
associated with the instrument inlet Losses of gases and particles in the system prior to
collection are among the most common problems Uncertainties remain even if the
instrument was carefiilly characterized and calibrated with the appropriate gases or
particles This is because inlet losses depend on factors like humidity temperature in
addhion to the relative concentration of gases and density and composhion of particles
measured which are often variable and hard to predict Therefore my fiiture work will
certainly involve developing gas and particle system inlets that will have a high degree of
flexibility but will eliminate or at least decrease the level of gas or particle loss within
191
Finally In the past few years miniaturization has been the trend of many chemical
applications It would be particularly interesting to develop miniattirized systems that
can provide similar analysis
192