Embed Size (px)
Citation preview
Advancements in Vehicle Technology & Alternative Fuels – OEM Overview
Curt Augustine, Director of Policy & Government Affairs, Alliance of Automobile Manufacturers Tri-State Transportation Commission Meeting, 6/17/16
Connected Cars & Driver Assists Automated Vehicle Technology
New Vehicle Safety & Technology
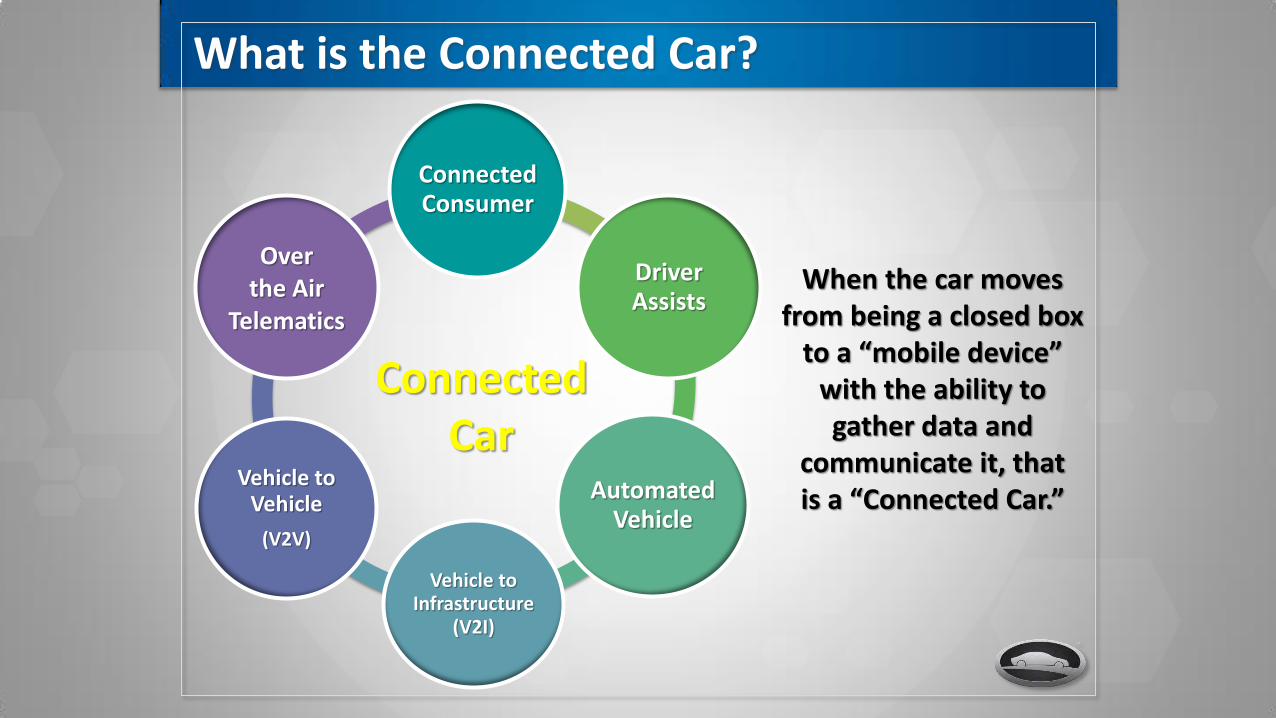
What is the Connected Car?
Connected Consumer
Driver Assists
Automated Vehicle
Vehicle to Infrastructure
(V2I)
Vehicle to Vehicle
(V2V)
Over the Air
Telematics
Connected Car
When the car moves from being a closed box
to a “mobile device” with the ability to gather data and
communicate it, that is a “Connected Car.”
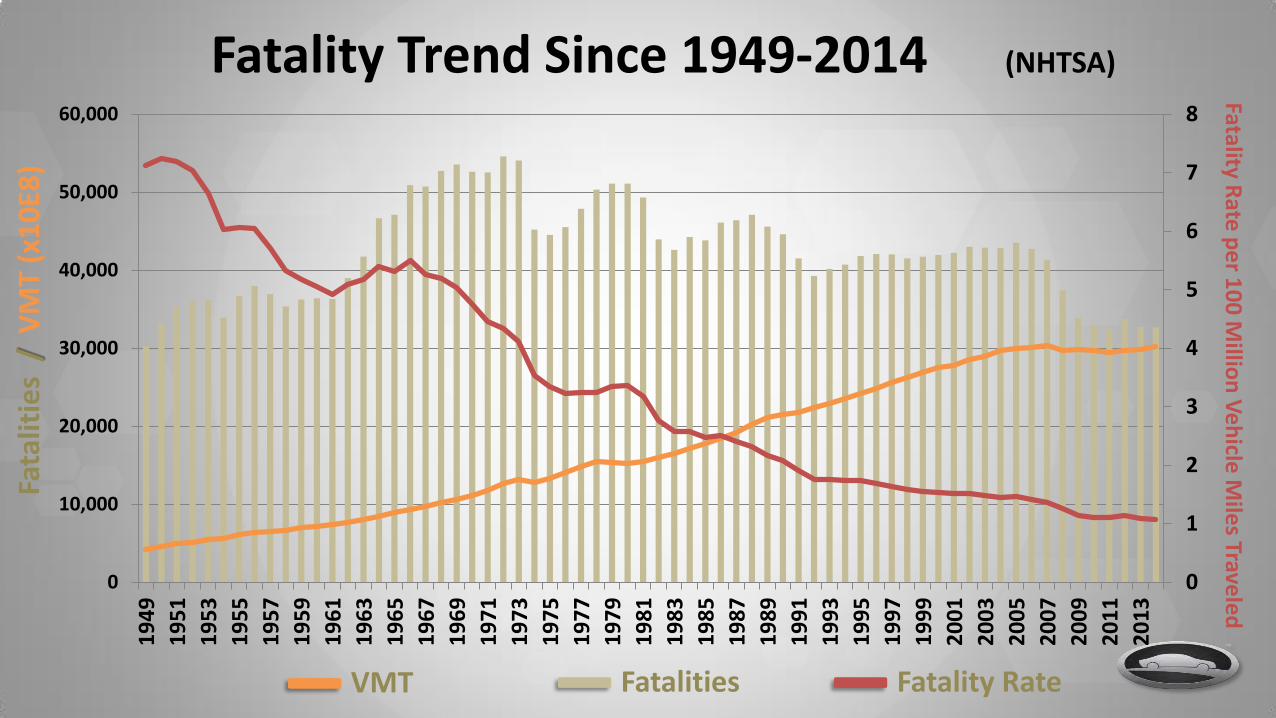
Fatality Trend Since 1949-2014 (NHTSA)
0
1
2
3
4
5
6
7
8
0
10,000
20,000
30,000
40,000
50,000
60,000
19
49
19
51
19
53
19
55
19
57
19
59
19
61
19
63
19
65
19
67
19
69
19
71
19
73
19
75
19
77
19
79
19
81
19
83
19
85
19
87
19
89
19
91
19
93
19
95
19
97
19
99
20
01
20
03
20
05
20
07
20
09
20
11
20
13
Fata
litie
s /
VM
T (x
10
E8)
VMT Fatalities Fatality Rate
Fatality Rate
pe
r 10
0 M
illion
Ve
hicle
Mile
s Travele
d
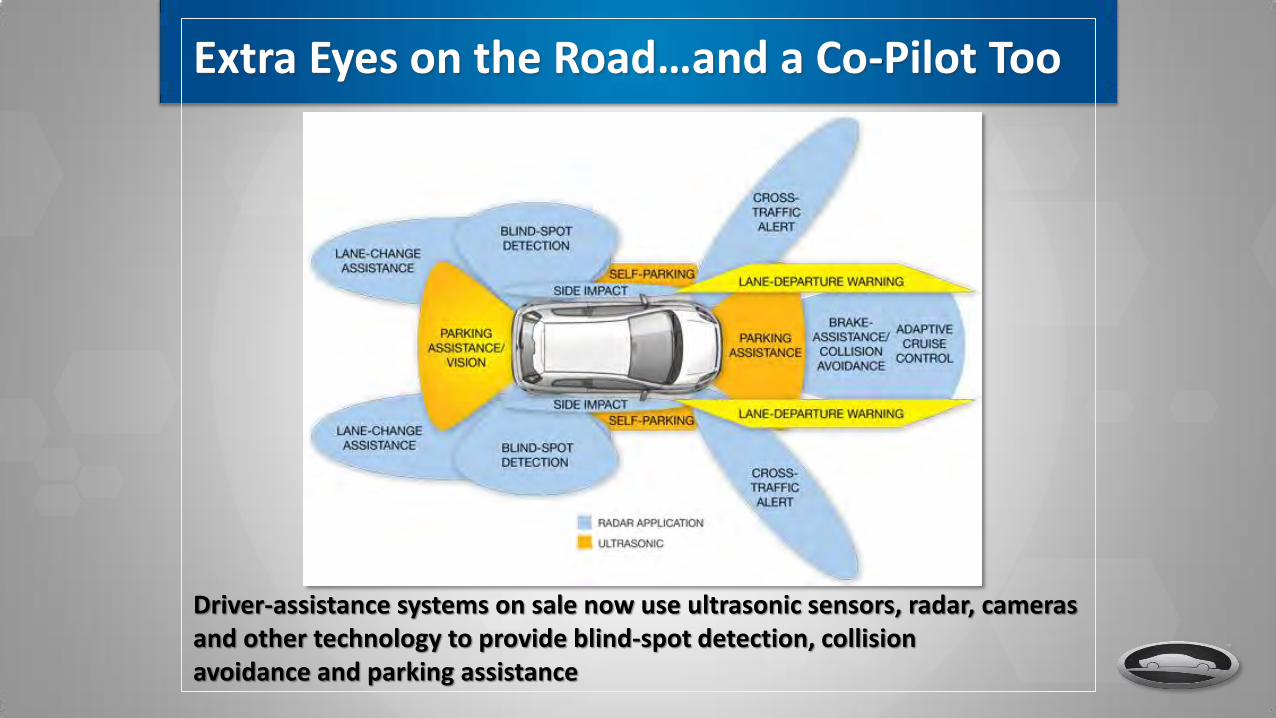
Extra Eyes on the Road…and a Co-Pilot Too
Driver-assistance systems on sale now use ultrasonic sensors, radar, cameras and other technology to provide blind-spot detection, collision avoidance and parking assistance
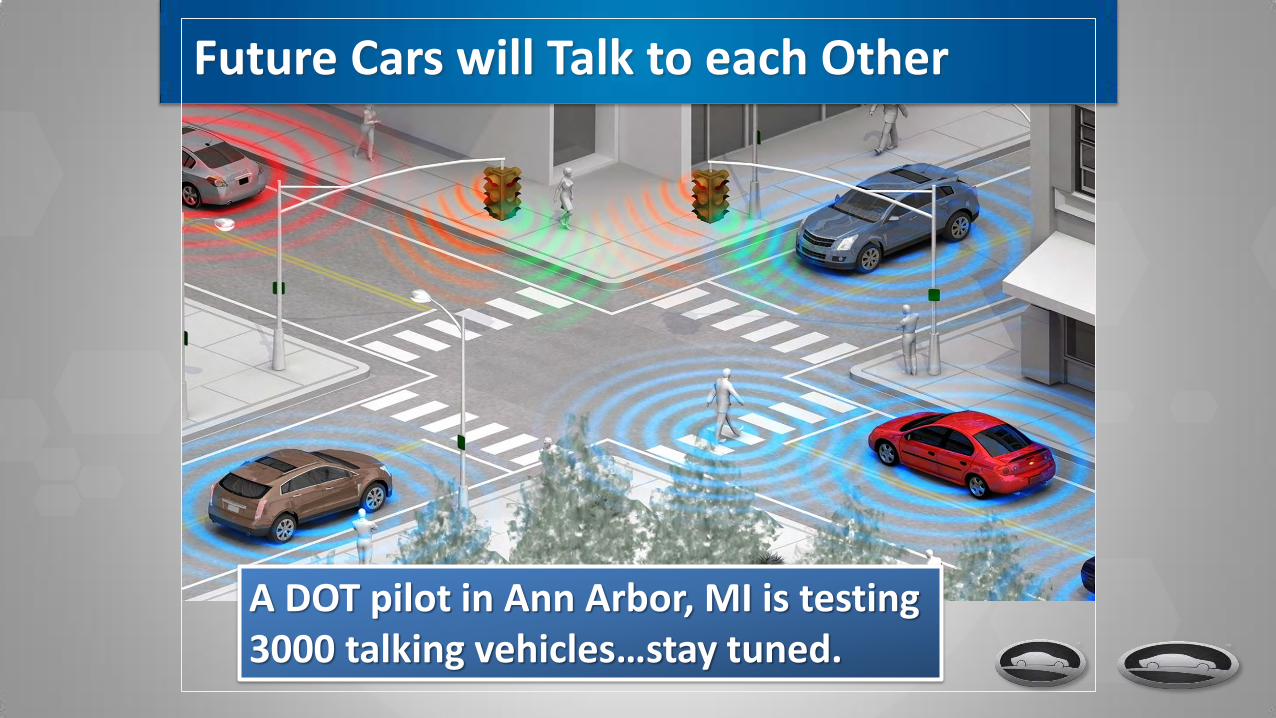
Future Cars will Talk to each Other
A DOT pilot in Ann Arbor, MI is testing 3000 talking vehicles…stay tuned.
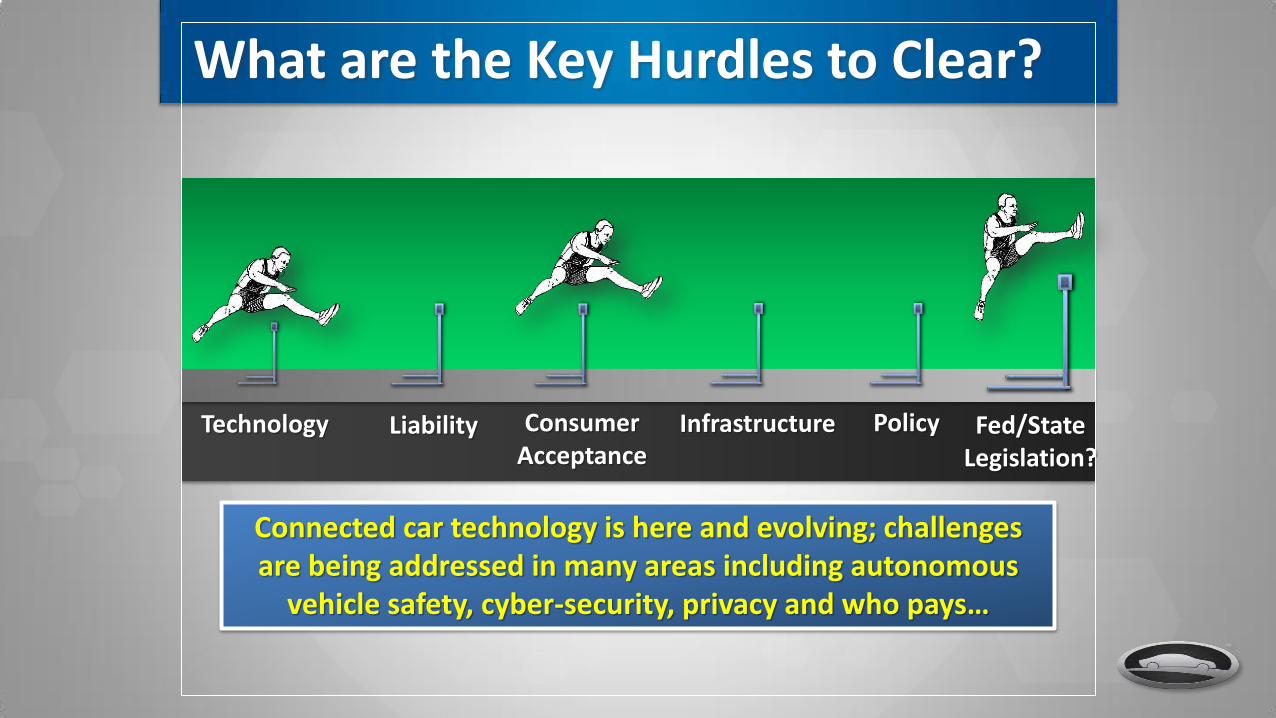
What are the Key Hurdles to Clear?
Technology Liability Consumer Acceptance
Infrastructure Policy Fed/State Legislation?
Connected car technology is here and evolving; challenges are being addressed in many areas including autonomous
vehicle safety, cyber-security, privacy and who pays…
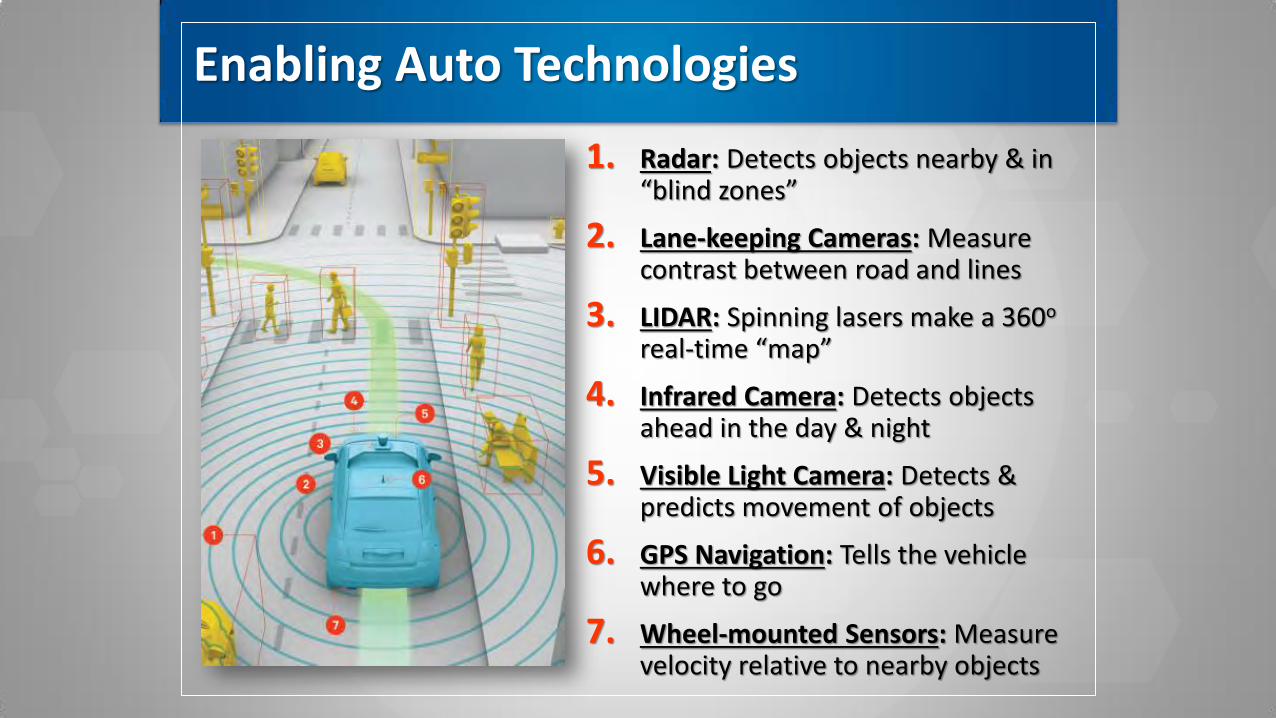
Enabling Auto Technologies
1. Radar: Detects objects nearby & in “blind zones”
2. Lane-keeping Cameras: Measure contrast between road and lines
3. LIDAR: Spinning lasers make a 360o real-time “map”
4. Infrared Camera: Detects objects ahead in the day & night
5. Visible Light Camera: Detects & predicts movement of objects
6. GPS Navigation: Tells the vehicle where to go
7. Wheel-mounted Sensors: Measure velocity relative to nearby objects
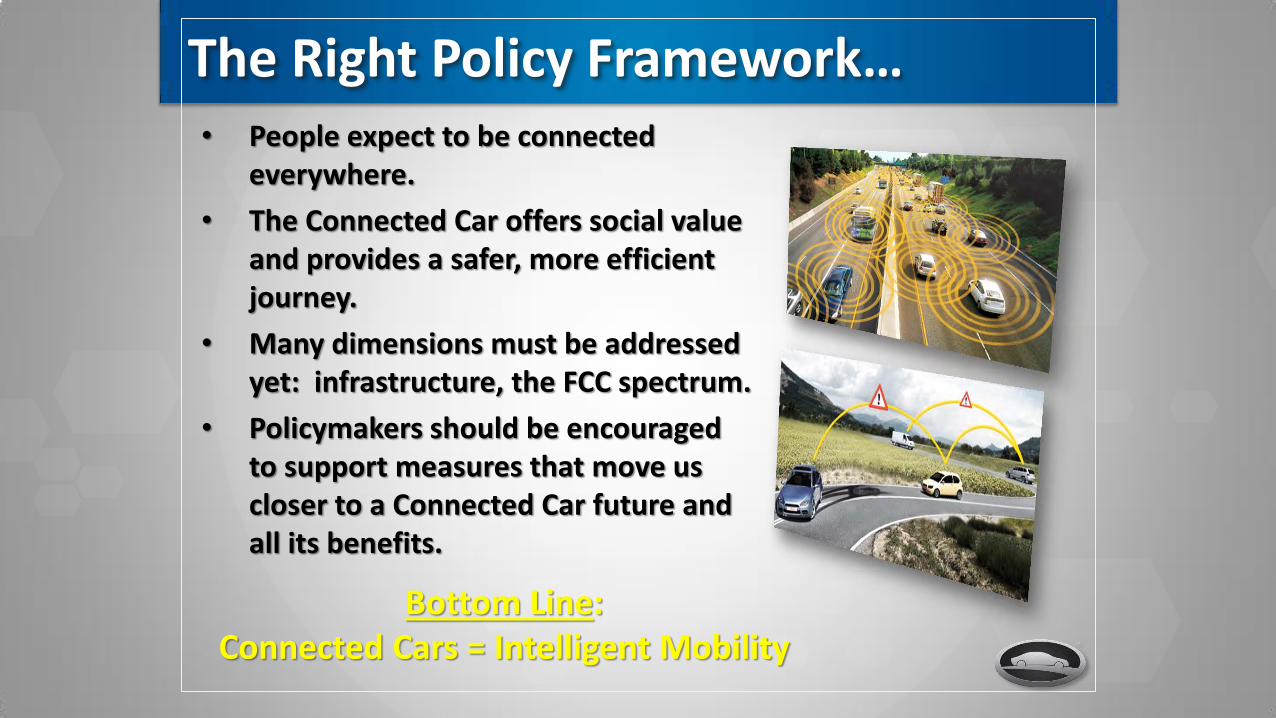
The Right Policy Framework… • People expect to be connected
everywhere.
• The Connected Car offers social value and provides a safer, more efficient journey.
• Many dimensions must be addressed yet: infrastructure, the FCC spectrum.
• Policymakers should be encouraged to support measures that move us closer to a Connected Car future and all its benefits.
Bottom Line: Connected Cars = Intelligent Mobility

Consumer Trends and Consumer Choice… Dozens of Options
Advanced Power Trains
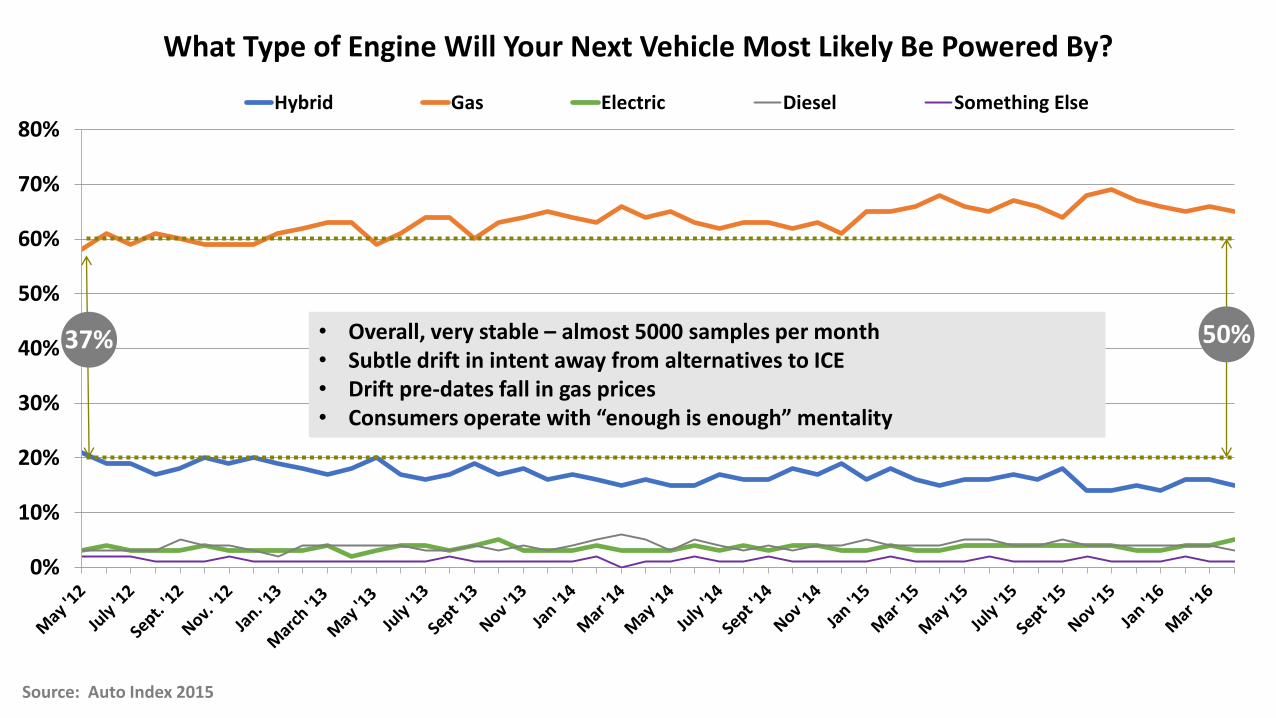
What Type of Engine Will Your Next Vehicle Most Likely Be Powered By?
0%
10%
20%
30%
40%
50%
60%
70%
80%Hybrid Gas Electric Diesel Something Else
Source: Auto Index 2015
37% 50% • Overall, very stable – almost 5000 samples per month • Subtle drift in intent away from alternatives to ICE • Drift pre-dates fall in gas prices • Consumers operate with “enough is enough” mentality
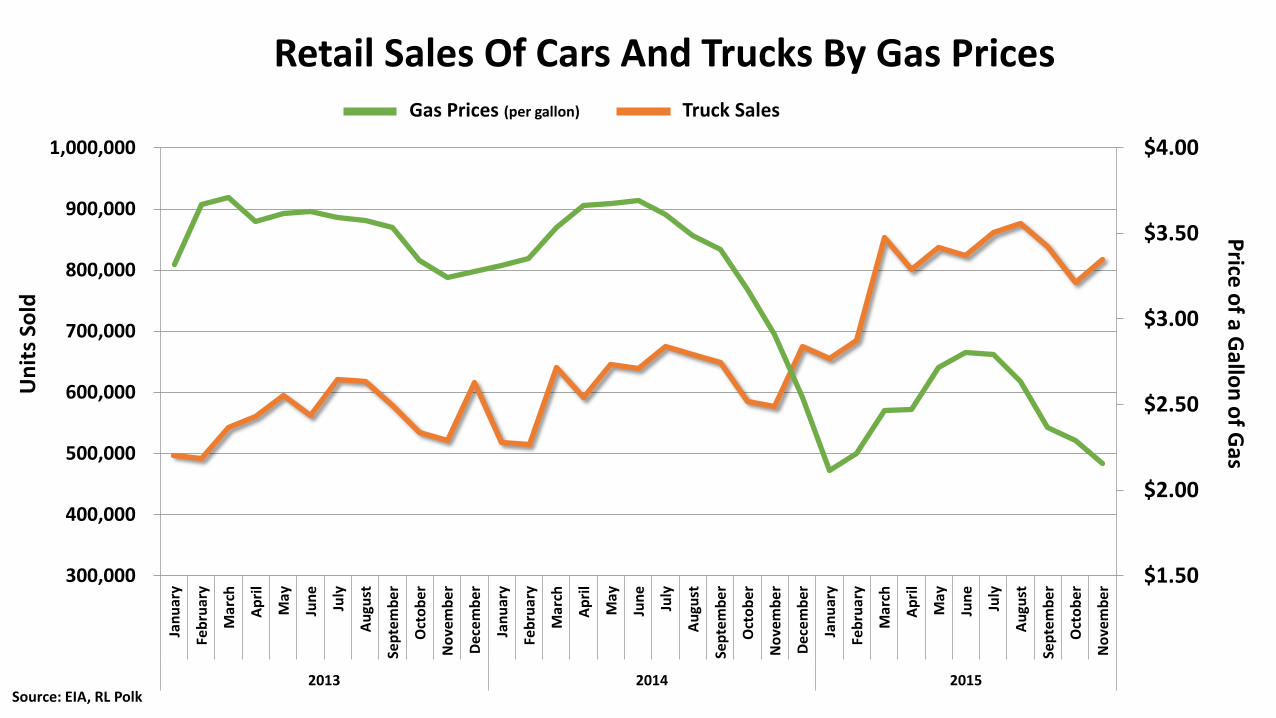
Retail Sales Of Cars And Trucks By Gas Prices
$1.50
$2.00
$2.50
$3.00
$3.50
$4.00
300,000
400,000
500,000
600,000
700,000
800,000
900,000
1,000,000Ja
nu
ary
Feb
ruar
y
Mar
ch
Ap
ril
May
Jun
e
July
Au
gust
Sep
tem
be
r
Oct
ob
er
No
vem
be
r
Dec
em
ber
Jan
uar
y
Feb
ruar
y
Mar
ch
Ap
ril
May
Jun
e
July
Au
gust
Sep
tem
be
r
Oct
ob
er
No
vem
be
r
Dec
em
ber
Jan
uar
y
Feb
ruar
y
Mar
ch
Ap
ril
May
Jun
e
July
Au
gust
Sep
tem
be
r
Oct
ob
er
No
vem
be
r
2013 2014 2015Source: EIA, RL Polk
Gas Prices (per gallon) Truck Sales
Un
its
Sold
P
rice o
f a Gallo
n o
f Gas
$1.00
$1.50
$2.00
$2.50
$3.00
$3.50
$4.00
1
1.5
2
2.5
3
3.5
4
4.5Ja
nu
ary
Feb
ruar
y
Mar
ch
Ap
ril
May
Jun
e
July
Au
gust
Sep
tem
ber
Oct
ob
er
No
vem
ber
Dec
em
ber
Jan
uar
y
Feb
ruar
y
Mar
ch
Ap
ril
May
Jun
e
July
Au
gust
Sep
tem
ber
Oct
ob
er
No
vem
ber
Dec
em
ber
Jan
uar
y
Feb
ruar
y
Mar
ch
Ap
ril
May
Jun
e
July
Au
gust
Sep
tem
ber
Oct
ob
er
No
vem
ber
Dec
em
ber
Jan
uar
y
Feb
ruar
y
2013 2014 2015 2016
Hyb
rid
Ve
hic
le S
ale
s A
s P
erc
en
tage
Of
Ret
ail S
ale
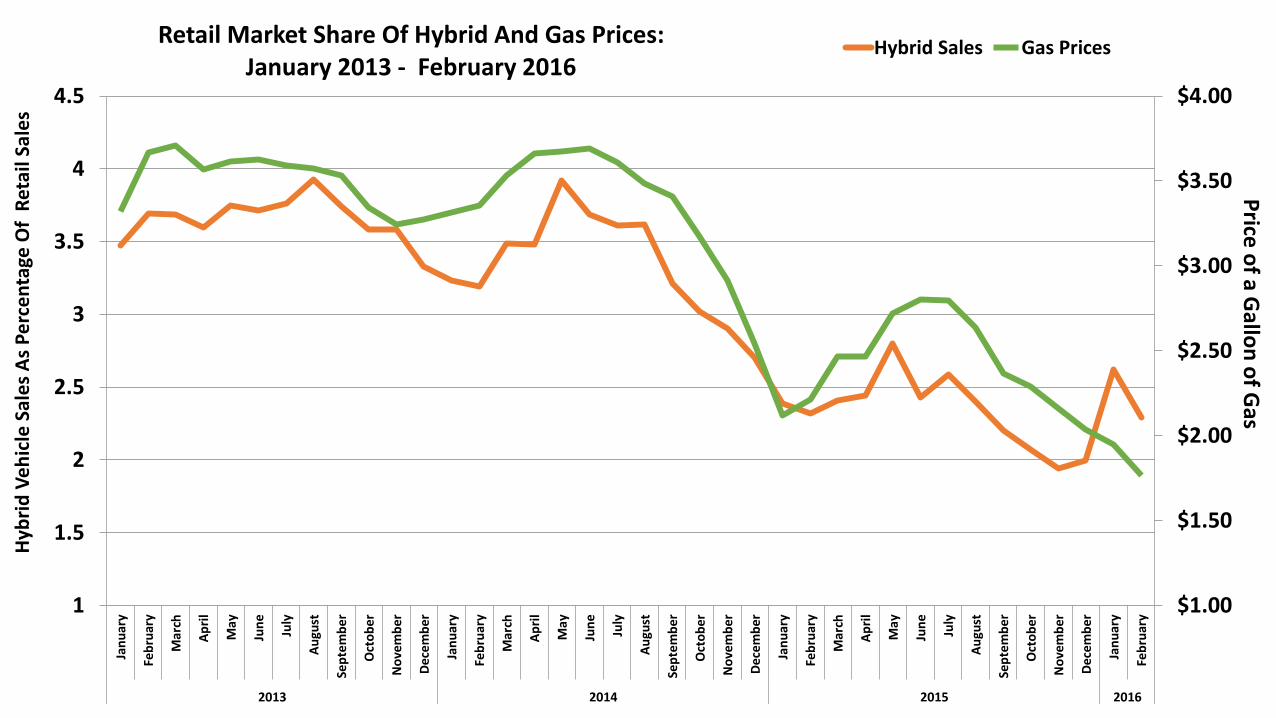
s Retail Market Share Of Hybrid And Gas Prices:
January 2013 - February 2016 Hybrid Sales Gas Prices
Price
of a G
allon
of G
as
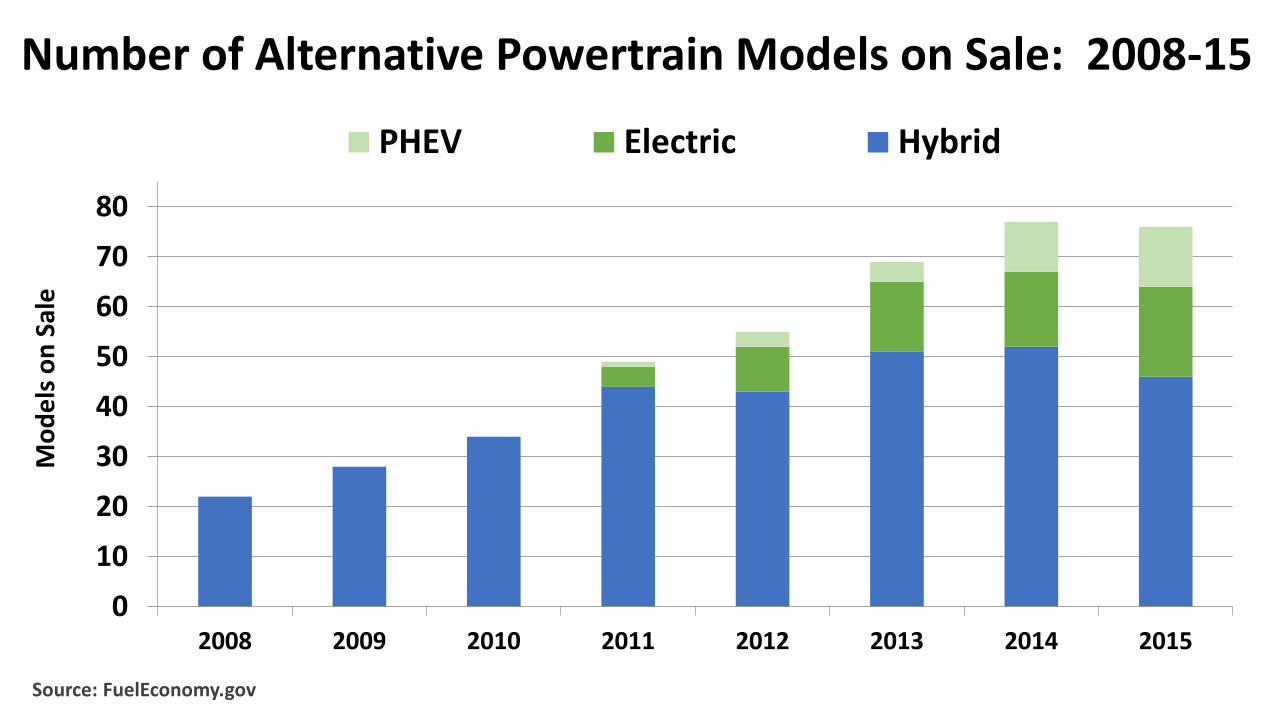
Number of Alternative Powertrain Models on Sale: 2008-15
0
10
20
30
40
50
60
70
80
2008 2009 2010 2011 2012 2013 2014 2015
PHEV Electric Hybrid
Mo
de
ls o
n S
ale
Source: FuelEconomy.gov
0.0%
0.5%
1.0%
1.5%
2.0%
2.5%
3.0%
3.5%
4.0%
4.5%
0
100,000
200,000
300,000
400,000
500,000
600,000
2005 2006 2007 2008 2009 2010 2011 2012 2013 2014 2015
Un
its
Sold
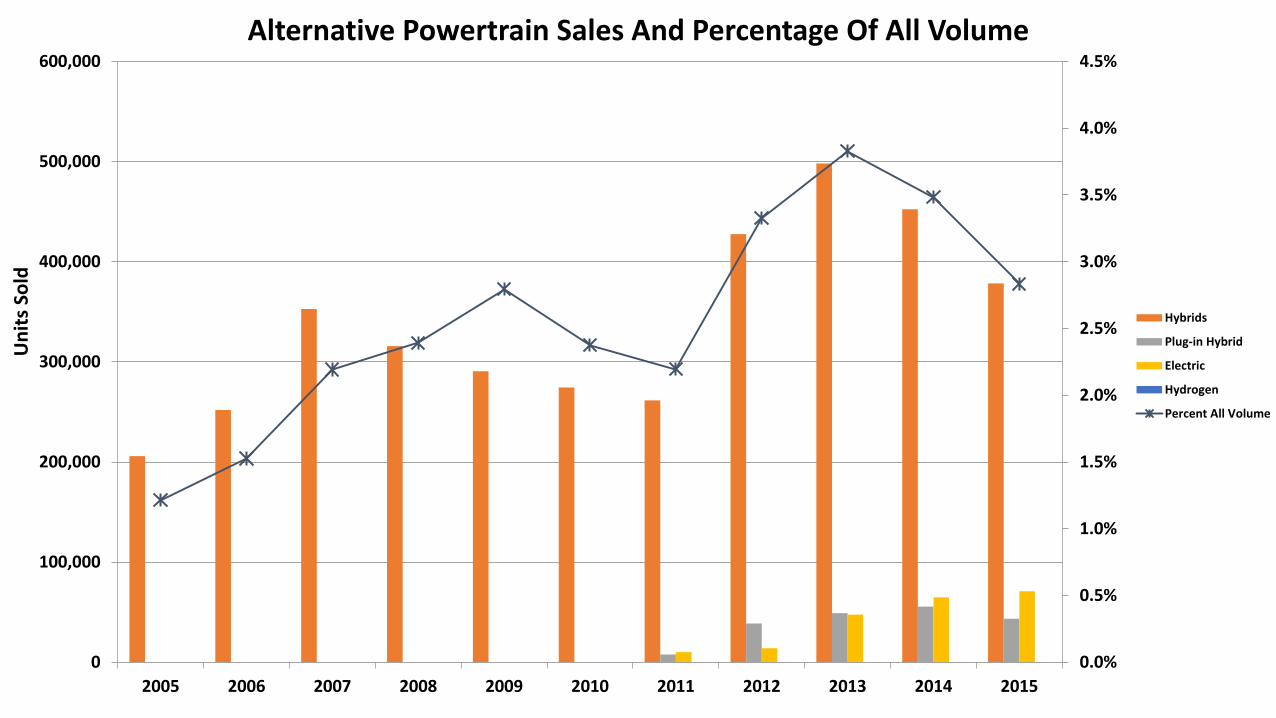
Alternative Powertrain Sales And Percentage Of All Volume
Hybrids
Plug-in Hybrid
Electric
Hydrogen
Percent All Volume
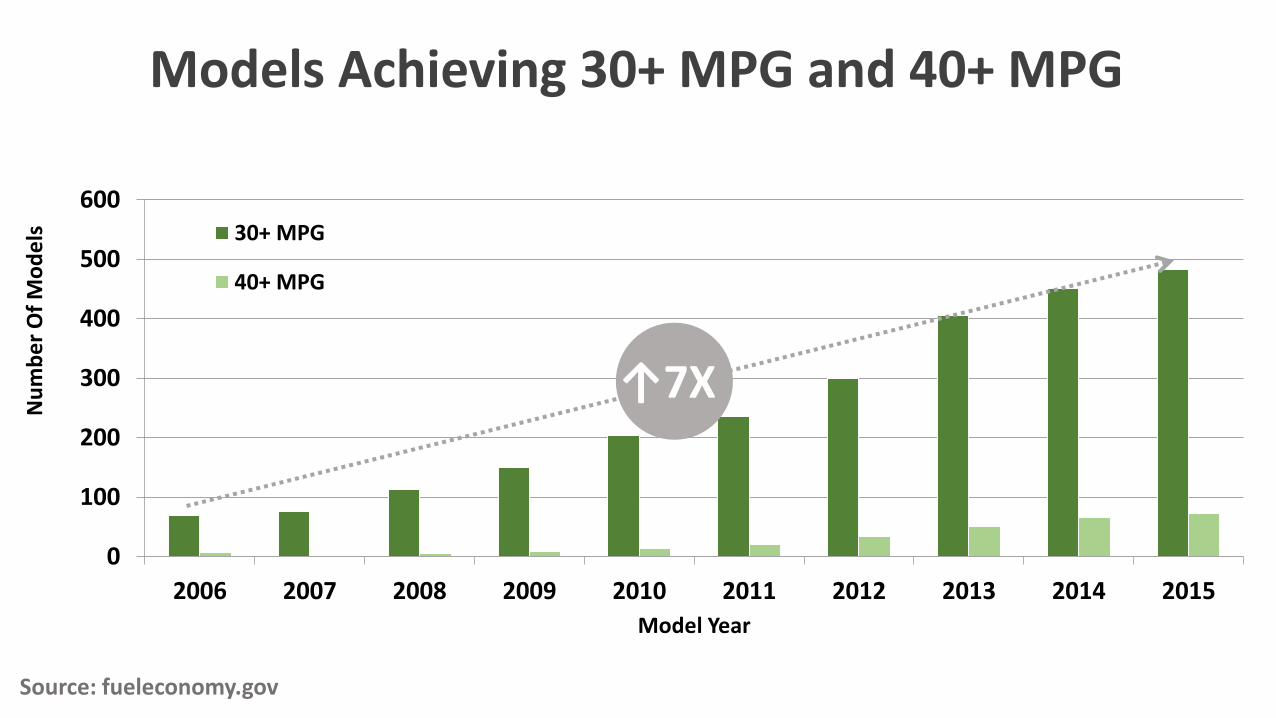
Models Achieving 30+ MPG and 40+ MPG
0
100
200
300
400
500
600
2006 2007 2008 2009 2010 2011 2012 2013 2014 2015
Nu
mb
er
Of
Mo
de
ls
Model Year
30+ MPG
40+ MPG
↑7X
Source: fueleconomy.gov
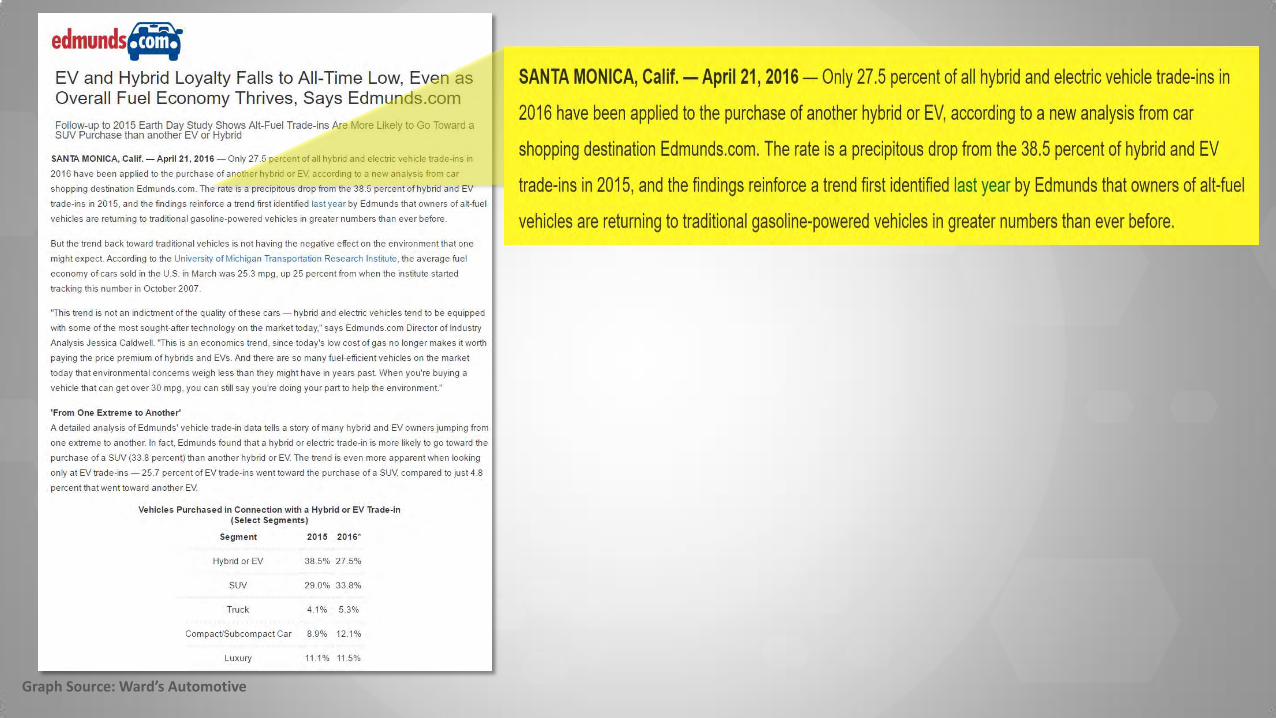
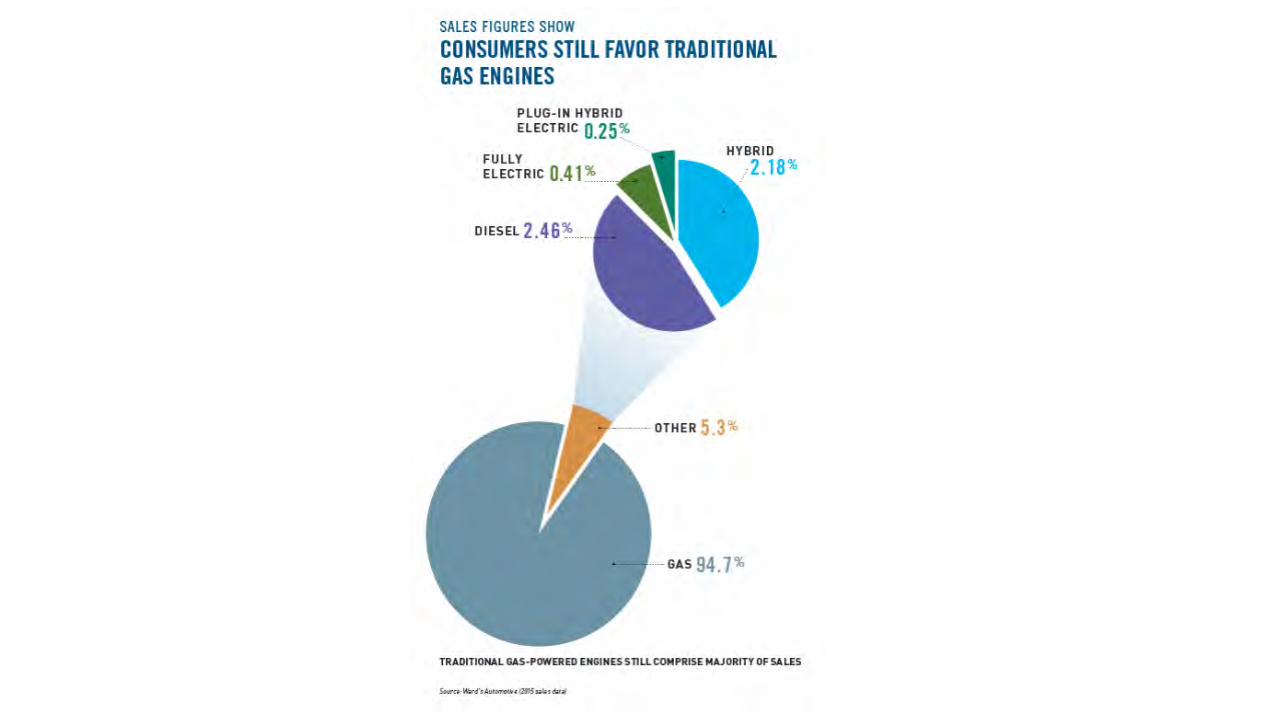
Graph Source: Ward’s Automotive
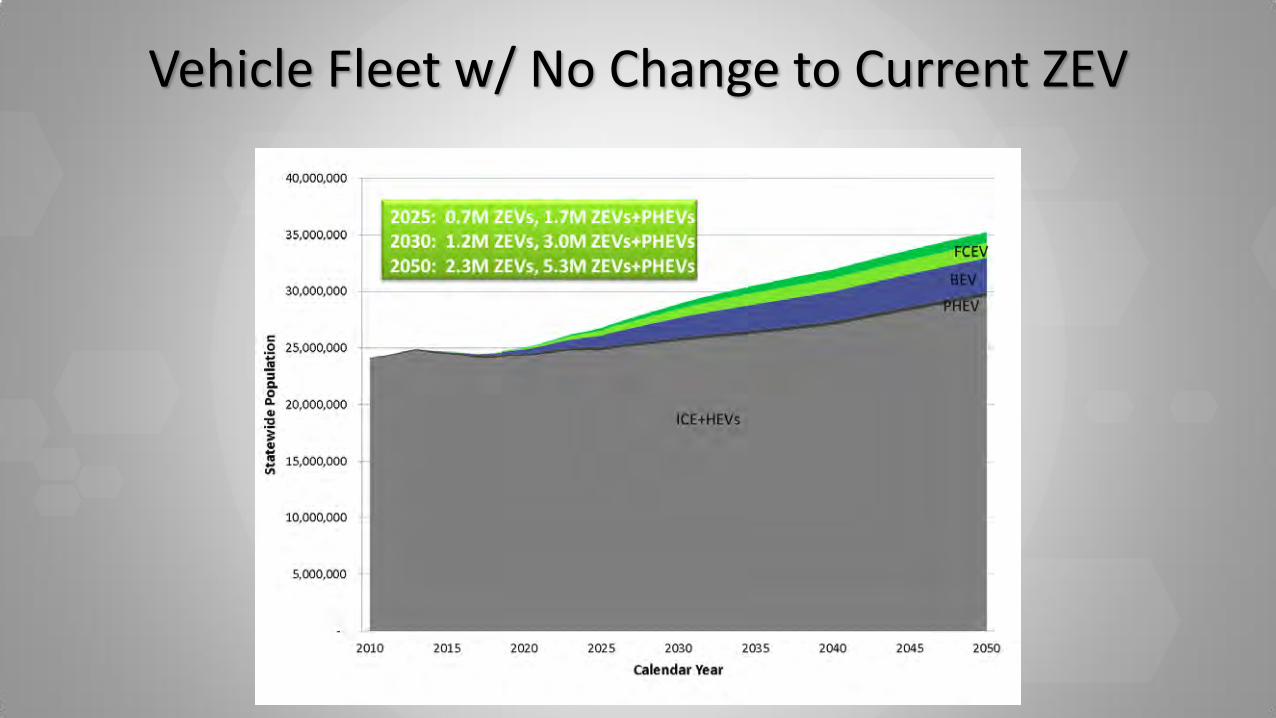
Vehicle Fleet w/ No Change to Current ZEV
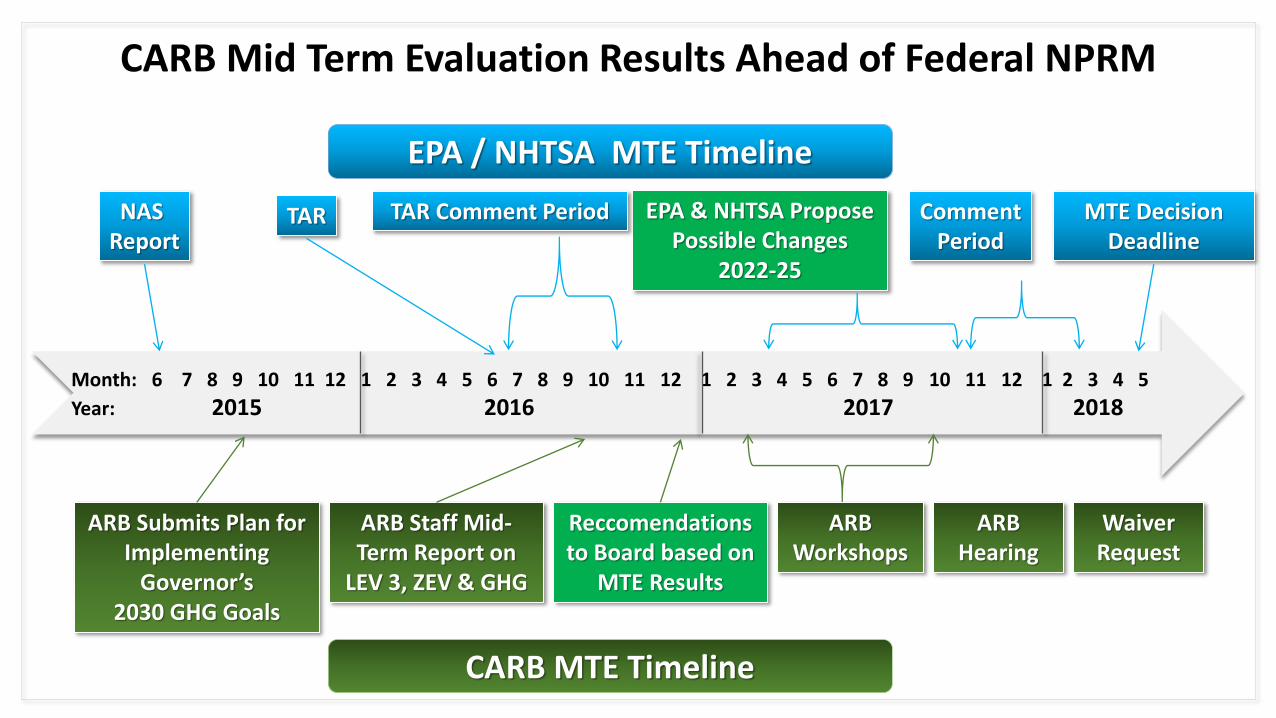
CARB Mid Term Evaluation Results Ahead of Federal NPRM
Month: 6 7 8 9 10 11 12 1 2 3 4 5 6 7 8 9 10 11 12 1 2 3 4 5 6 7 8 9 10 11 12 1 2 3 4 5
Year: 2015 2016 2017 2018
NAS Report
EPA / NHTSA MTE Timeline
TAR EPA & NHTSA Propose Possible Changes
2022-25
Comment Period
MTE Decision Deadline
CARB MTE Timeline
ARB Submits Plan for Implementing
Governor’s 2030 GHG Goals
ARB Staff Mid- Term Report on
LEV 3, ZEV & GHG
Reccomendations to Board based on
MTE Results
ARB Workshops
ARB Hearing
Waiver Request
TAR Comment Period