Embed Size (px)
Citation preview

Advancements in Dual-Pump Broadband CARS for Supersonic Combustion Measurements
Sarah Augusta Umberger Tedder
Christiansburg, Virginia
Bachelor of Science in Aeronautical and Astronautical Engineering, Purdue University, 2003
Master of Science in Physics, The College of William and Mary, 2006
A Dissertation presented to the Graduate Faculty of the College of William and Mary in Candidacy for the Degree of
Doctor of Philosophy
Department of Physics
The College of William and Mary August, 2010

APPROVAL PAGE
This Dissertation is submitted in partial fulfillment of
the requirements for the degree of
Doctor of Philosophy
Sarah Augusta Umberger Tedder
Approved by the Committee, June, 2010
Committee Chair Professor John Delos, Physics
The College of William and Mary
Committee Co-Chair Adjunct Assistant Professor Paul Danehy, Physics
The College of William and Mary, NASA Langley Research Center
Assistant Professor Seth Aubin, Physics
The College of William and Mary
Professor Gunter Luepke, Applied Science
The College of William and Mary
Assistant Professor Irina Novikova, Physics The College of William and Mary
Professor Andrew Cutler, Mechanical and Aerospace Engineering
George Washington University

ABSTRACT PAGE
Space- and time-resolved measurements of temperature and species mole fractions of nitrogen, oxygen, and hydrogen were obtained with a dual-pump coherent anti-Stokes Raman spectroscopy (CARS) system in hydrogen-fueled supersonic combustion free jet flows. These measurements were taken to provide time-resolved fluid properties of turbulent supersonic combustion for use in the creation and verification of computational fluid dynamic (CFD) models. CFD models of turbulent supersonic combustion flow currently facilitate the design of air-breathing supersonic combustion ramjet (scramjet) engines. Measurements were made in supersonic axi-symmetric free jets of two scales. First, the measurement system was tested in a laboratory environment using a laboratory-scale burner (~10 mm at nozzle exit). The flow structures of the laboratory-burner were too small to be resolved with the CARS measurements volume, but the composition and temperature of the jet allowed the performance of the system to be evaluated. Subsequently, the system was tested in a burner that was approximately 6 times larger, whose length scales are better resolved by the CARS measurement volume. During both these measurements, weaknesses of the CARS system, such as sensitivity to vibrations and beam steering and inability to measure temperature or species concentrations in hydrogen fuel injection regions were indentified. Solutions were then implemented in improved CARS systems. One of these improved systems is a dual-pump broadband CARS technique called, Width Increased Dual-pump Enhanced CARS (WIDECARS). The two lowest rotational energy levels of hydrogen detectable by WIDECARS are H2 S(3) and H2 S(4). The detection of these lines gives the system the capability to measure temperature and species concentrations in regions of the flow containing pure hydrogen fuel at room temperature. WIDECARS is also designed for measurements of all the major species (except water) in supersonic combustion flows fueled with hydrogen and hydrogen/ethylene mixtures (N2, O2, H2, C2H4, CO, and CO2). This instrument can characterize supersonic combustion fueled with surrogate fuel mixtures of hydrogen and ethylene. This information can lead to a better understanding of the chemistry and performance of supersonic combustion fueled with cracked jet propulsion (JP)-type fuel.

i
TABLE OF CONTENTS
Dedication. ....................................................................................................................... v
Acknowledgments .......................................................................................................... vi
List of Tables ................................................................................................................ viii
List of Figures ................................................................................................................. ix
Chapter 1: Introduction .................................................................................................... 1
1.1 Study of Supersonic Combustion Flows ............................................................. 1
1.1.1 Motivation ....................................................................................................... 1
1.1.2 Measurement Goals ........................................................................................ 2
1.1.3 Measurement techniques ................................................................................. 4
1.2 CARS ................................................................................................................ 10
1.2.1 Classical Theory ............................................................................................ 10
1.2.2 Quantum Theory ........................................................................................... 15
1.2.3 Instrumentation ............................................................................................. 17
1.2.4 Survey of CARS Techniques, Strategies, and Systems ................................ 22
1.3 CARS Measurements in Supersonic Combustion ............................................ 27
References ..................................................................................................................... 34
Chapter 2: Laboratory-Scale Supersonic Combustion Free-Jet Measurements with

ii
Dual-Pump CARS ........................................................................................................... 39
2.1 Introduction ....................................................................................................... 39
2.2 Experimental Setup ........................................................................................... 41
2.2.1 Supersonic Flow Facility .............................................................................. 41
2.2.2 CARS System ............................................................................................... 42
2.3 Results and Discussion ..................................................................................... 46
2.3.1 CARS Instrument Characterization .............................................................. 46
2.3.2 Supersonic Reacting Jet ................................................................................ 57
2.4 Conclusions and Recommendations ................................................................. 61
References ..................................................................................................................... 64
Chapter 3: CARS Temperature Measurements in a Full-Scale Combustion-Heated
Supersonic Free-Jet ........................................................................................................ 65
3.1 Introduction ....................................................................................................... 65
3.2 Test Hardware and Facility ............................................................................... 67
3.3 Test Procedure .................................................................................................. 68
3.4 CARS Instrumentation ...................................................................................... 70
3.5 CARS Data Analysis......................................................................................... 75
3.6 CARS Instrument Characterization .................................................................. 78
3.7 Results and Discussion ..................................................................................... 85
3.7.1 CARS Measurements in the Mixing Flow Experiment ................................ 85
3.7.2 Mixing Flow Data Yield ............................................................................... 93
3.7.3 CARS Measurements in the Fueled Flow Experiment ................................. 98
3.8 Concluding Remarks ....................................................................................... 100

iii
References ................................................................................................................... 103
Chapter 4: Instrumentation Advancements Inspired by Application-Specific Issues
and Goals ....................................................................................................................... 106
4.1 Introduction ..................................................................................................... 106
4.2 Data Analysis .................................................................................................. 107
4.3 Beam Movements and Defocusing ................................................................. 108
4.4 “Cold” Hydrogen and Ethylene Combustion Products ................................... 111
4.5 Other issues ..................................................................................................... 111
4.6 Conclusion ...................................................................................................... 112
References ................................................................................................................... 114
Chapter 5: Characteristics of a Broadband Dye Laser Using Pyrromethene and
Rhodamine dyes for WIDECARS ............................................................................... 115
5.1 Introduction ..................................................................................................... 115
5.1.1 Lasers .......................................................................................................... 116
5.1.2 Broadband Dye Lasers ................................................................................ 119
5.2 Experimental Setup ......................................................................................... 120
5.3 Results and Discussion ................................................................................... 127
5.3.1 Concentration .............................................................................................. 129
5.3.2 Spectrally Selective Optics ......................................................................... 137
5.3.3 Fluence ........................................................................................................ 142
5.3.4 Amplifier ..................................................................................................... 144
5.3.5 Aging........................................................................................................... 146
5.3.6 Spectral Noise ............................................................................................. 150

iv
5.4 Conclusion ...................................................................................................... 152
References ................................................................................................................... 155
Chapter 6: Width-Increased Dual-Pump Enhanced Coherent Anti-Stokes Raman
Spectroscopy (WIDECARS) ........................................................................................ 159
6.1 Introduction ..................................................................................................... 159
6.2 The Design of WIDECARS ............................................................................ 161
6.3 Experimental Setup ......................................................................................... 172
6.4 Results and Discussion ................................................................................... 176
6.5 Conclusion ...................................................................................................... 182
References ................................................................................................................... 184
Chapter 7: Conclusion and Recommendations........................................................... 186
7.1 Conclusion ...................................................................................................... 186
7.2 Recommendations ........................................................................................... 188
7.2.1 Supersonic Combustion CARS Instrumentation ........................................ 188
7.2.2 Future Development of CARS Instrumentation ......................................... 190
References ................................................................................................................... 194
APPENDIX A: Determination of Probe Volume Dimensions in Coherent
Measurement Techniques ............................................................................................ 195

v
For my mother, who taught me how to teach myself, to whom I am dedicating this.

vi
ACKNOWLEDGMENTS
I would like to thank all everyone who helped and supported me during my
dissertation work. Specifically, I would like to thank Paul, Markus, Gaetano, Andrew,
Daniel, Steve, Jeff, Mike, Thomas, Frank, Yifang, Diego, Barry, and Lloyd for helping
me prepare, collect, and present the work in this dissertation, without their help this
dissertation would not have been possible. I would like to thank my advisor Paul Danehy
for his patience and willingness to support me in my interests. Thank you to my husband,
Eric, who put his interests aside to support my dreams. Thank you to my big sister in
graduate school, Jen Inman, whose advice and friendship gave me reassurance. Thanks
to my big brother in CARS, Markus Weikl, who taught me everything I know about
CARS, encouraged me to stand-up for myself, and gave me respect that boosted my
confidence. Thanks to my little brother in CARS, Gaetano Magnotti, who was a fun and
brilliant lab partner and whose help and support kept me going when the times were the
toughest. Thanks to Andrew Cutler, whose advice and direction I value greatly and who
is my role model. Thanks to Daniel Bivolaru who taught me about optics and was always
ready with the quick joke to entertain me. Thank you to Steve Jones for his excellent
professional technical support of my work, for his friendship, and for making tasks as
mundane as ordering parts fun. Thank you to my students, Jeff Wheeler and Mike Heinz,
for their patience, companionship, ideas, and hard work. Thanks to Thomas Seeger for

vii
the opportunities and education he offered me and for being a great host to me and my
family while I was in Germany. Thanks also to Frank Beyrau for making my trip to
Germany possible and being a great host while I was there. Thanks to Yifang Cong for
her excellent help in the lab and her friendship. Thanks to Diego Capriotti, Barry
Lawhorne, Lloyd Wilson, and the other tunnel technicians for being so easy to work with
and for their help during testing. Thanks to Greg Herring for loaning me equipment and
giving me advice. Thanks to Ken Wright for being my advocate. Thanks to Brett Bathel
for his patience and his willingness to listen. Thanks to James Downey for offering a
friendly ear when I needed one and for giving me encouragement and respect. Thanks to
Gunter Luepke for his advice and teachings about lasers and for graciously allowing me
to audit his class. Thanks to John Delos for co-chairing my committee and for his
support of my education. Thanks to Benny Lunsford for sharing lab space with me and
allowing me to run my lasers. Thanks to my professors at the College of William and
Mary for providing me with a solid background in Physics. Thanks to my parents for
giving me the skills and encouragement I needed to persevere. Thanks to all my teachers
and mentors who have given their time to guide me.

viii
LIST OF TABLES
Table 1.1: Examples of CARS systems using different techniques, attributes summarized.
........................................................................................................................................... 24
Table 1.2: CARS measurements in supersonic combustion. .......................................... 29
Table 3.1: Percentages of data removed and total data yields. ......................................... 93
Table 5.1 Summary of broadband dye lasers’ characteristics. ........................................ 120

ix
LIST OF FIGURES
Figure 1.1: Different ways of phase matching the wave vectors of CARS. ..................... 13
Figure 1.2: A drawing of the lasers forming the folded BOXCARS phase matching
scheme............................................................................................................................... 14
Figure 1.3: Laser light interaction with molecular energy levels. .................................... 16
Figure 1.4: Optical layout of a typical CARS system. ...................................................... 18
Figure 1.5: Image of a CARS spectrum. ........................................................................... 19
Figure 1.6: Theoretical CARS spectra generated from CARSFT at room temperature with
varying concentrations of nitrogen and oxygen. ............................................................... 20
Figure 1.7: Theoretical CARS spectra generated from CARSFT of nitrogen at a range of
temperatures. ..................................................................................................................... 21
Figure 1.8: Broadband CARS energy level diagram. ....................................................... 25
Figure 1.9: Dual-pump CARS energy level diagram........................................................ 25
Figure 2.1: Cross-sectional drawing of the flow facility that creates the supersonic
combustion free jet (Courtesy of A. D. Cutler and G. Magnotti). .................................... 42
Figure 2.2: Image of CARS laser beams crossing at measurement volume over the flow
facility of the laboratory-scale supersonic free jet. ........................................................... 44
Figure 2.3: Measurements in a H2-air laminar flame obtained in the Hencken burner for a

x
range of equivalence ratios. ............................................................................................ 48
Figure 2.4: Percentage standard deviation versus temperature. ........................................ 49
Figure 2.5: Single shot CARS spectra in a H2-air laminar flame at different equivalence
ratios (Φ), a) Φ=0.3, b) Φ=1.8. ......................................................................................... 50
Figure 2.6: Histogram of CARS temperatures demonstrating fitting bifurcation ............ 51
Figure 2.7: Percentage standard deviation of the “modeless” broadband laser spectral
profile used in this experiment versus wavelength. ........................................................ 53
Figure 3.1: Test apparatus and flow field. ........................................................................ 68
Figure 3.2: Test matrix used for experiments. ................................................................ 69
Figure 3.3: A photograph of the mobile cart containing the lasers of the CARS system.
........................................................................................................................................... 71
Figure 3.4: N2 peaks from CARS spectra demonstrating movement of signal during flow.
........................................................................................................................................... 74
Figure 3.5: Calculated values versus CARS measurements taken in flat flame burner with
hydrogen fuel. ................................................................................................................... 79
Figure 3.6: CARS spectrum taken in a Hencken burner flame at an equivalence ratio of
0.3...................................................................................................................................... 80
Figure 3.7: Relative standard deviation versus temperature. .......................................... 84
Figure 3.8: (a) is a contour map of mean CARS temperature data taken in an axi-
symmetric free jet. (b) is a contour map of CARS temperature standard deviation. ....... 86
Figure 3.9: N2 peak of CARS spectra comparing FWHM in ambient air (300 K) with
flow on and off. ................................................................................................................. 88
Figure 3.10: The effect of fitting a CARS spectrum with a 25% larger instrument function

xi
width.. ............................................................................................................................... 90
Figure 3.11: CARS temperatures along axis of the full-scale jet. ................................... 91
Figure 3.12: Temperatures taken at the overlap (40 cm) of the upstream and downstream
measurement region. ....................................................................................................... 92
Figure 3.13: Contour map of percentage data yield per measurement location. ............ 97
Figure 3.14: Dependence of CARS signal intensity on temperature. ............................. 98
Figure 4.1: Planar BOXCARS phase matching geometry.. ............................................ 109
Figure 5.1: Drawing of optical setup of the laser. ......................................................... 121
Figure 5.2: Transmission curves for tested spectrally selective optics. .......................... 124
Figure 5.3: An example of a doubled peak spectrum demonstrating the type
measurements made to characterize the spectral profile of the laser. ............................. 126
Figure 5.4: Trends of the characteristics of the laser versus dye concentration. . ......... 129
Figure 5.5: The effect of adding PM 650 to PM 597 in the oscillator dye cell on the
spectrum emitted from the oscillator. ............................................................................. 133
Figure 5.6: Trends of the characteristics of the laser versus dye concentration of PM 650
for relatively constant concentrations of PM 597. ........................................................ 134
Figure 5.7: The half-maximum wavelengths versus concentrations of PM 650 added to a
~50mg/L solution of PM 597 in ethanol at different angles of incidence of the spectral
selective optic, TFP. ..................................................................................................... 139
Figure 5.8: Efficiency of oscillator versus TFP angle of incidence at a range of PM 650
concentrations. ................................................................................................................ 140
Figure 5.9: Wavelengths of amplifier range, half-maximum, and peaks versus angle of
incidence of optics placed in the oscillator cavity. . ...................................................... 142

xii
Figure 5.10: Oscillator laser characteristics versus pumping efficiency measured as
fluence (mJ/mm2). ........................................................................................................... 143
Figure 5.11: Wavelengths of peak, half-maximums, and range from the amplifier for a
range of concentrations of Rhodamine dyes. .................................................................. 144
Figure 5.12: Relative standard deviation of a series of single-shot WIDECARS laser
spectra and Rhodamine dye laser spectra. . ................................................................... 151
Figure 6.1: Other CARS techniques spectral probing regions compared to WIDECARS.
......................................................................................................................................... 163
Figure 6.2: Plot of the square root of the theoretical CARS signal peak height of
rotational S-branch H2 lines as a function of temperature. ........................................... 165
Figure 6.3: The square root of theoretical CARS signal peak height from CARSFT
plotted as a function of the hydrogen mole fraction.. . .................................................. 168
Figure 6.4: The normalized amplitude of laser output versus wavelength. .................. 173
Figure 6.5: Single-shot CARS spectrum of gas mixture 40% H2, 1% CO2, 1% CO, 1%
C2H4, and 57% N2 at room temperature. . ...................................................................... 177
Figure 6.6: Single-shot CARS spectrum of gas mixture 3% H2, 20% CO2, 8% CO, 10%
C2H4, and 59% N2 at room temperature. ....................................................................... 179
Figure 6.7: Single-shot CARS spectrum of unlit water welder gases mixing in air,
concentrations unknown. ................................................................................................ 180
Figure A.1: Experimental setup of probe volume measurement technique. ................... 199
Figure A.2: Illustration of the dual-pump dual-broadband folded BOXCARS phase
matching scheme used to demonstrate the new technique for probe volume
measurements. ................................................................................................................. 200

xiii
Figure A.3: For each individual beam images at z-locations along the focus spaced by
0.25 mm are taken. .......................................................................................................... 201
Figure A.4: Representation of the 3-D model of the dual-pump CARS probe volume,
(E1E2E3) as a function of x,y,z or zyxE ,,,4 . ...................................................................... 203
Figure A.5: Integrated magnitude plot giving the length of the probe volume defined as
5%-95% of the accumulated intensity. ........................................................................... 204
Figure A.6: Comparison of probe volume lengths of different phase-matching geometries,
BOXCARS, from a dual-pump dual-broadband CARS setup. ....................................... 205
Figure A.: Verification of overlap of the rotational and vibrational dual-pump dual-
broadband CARS 3-D probe volumes. ........................................................................... 207

1
CHAPTER 1
Introduction
1.1 Study of Supersonic Combustion Flows
1.1.1 Motivation
The objective of the study of supersonic combustion is to facilitate the design of
supersonic combustion ramjet (scramjet) engines as propulsion systems for hypersonic
vehicles. Scramjet powered hypersonic vehicles could be part of lower cost launch
vehicles that deliver people and materials to low earth orbit [1]. Other uses of hypersonic
vehicles are: faster civil transport, trans-atmospheric access to study upper atmospheres
[2], and military applications [3].
Supersonic is defined as speeds faster than the speed of sound. Supersonic flight is
often described in terms of Mach number, which describes the vehicle’s speed in terms of
the speed of sound. Currently, supersonic flight can be reached with vehicles propelled
by ramjet engines. Ramjets and scramjets are simply carefully designed ducts, containing
few moving parts. In ramjet engines, the speed of the intake air is reduced to subsonic
speeds before the entering the combustion chamber. Therefore, the combustion of fuel in

2
ramjets takes place at subsonic speeds. Ramjets are unable to produce net thrust at
speeds higher than about Mach 6 because of the amount of heat generated in the flow
when it is reduced to subsonic speeds [4].
Hypersonic is defined as speeds about Mach 5 and faster. Hypersonic flows are
characterized by the chemical phenomena of gases when these flows are stagnated, such
as molecular disassociation. Scramjet engines offer the capability to produce thrust to
speeds greater than Mach 5 by combusting fuel at supersonic speeds. Scramjets
estimated operating range is Mach 6 to 15 [3]. A scramjet engine can be more efficient
than rockets. Scramjets take in atmospheric air, using the oxygen as their oxidizer,
eliminating the need to carry oxidizer. Some scramjet engines are reusable. Often,
hydrogen is the fuel of choice because of its efficiency, fast combustion rate [4], and the
high cooling capacity of cryogenic hydrogen [1]. Detailed understanding and
quantification of the fluid properties of supersonic combustion flow is needed to design
high performance scramjet engines and to maximize their thrust. The complex nature of
these high temperature and high speed, turbulent flows makes understanding supersonic
combustion difficult [3]. Measurements of supersonic combustion flows offer a way to
increase the understanding of these flows.
1.1.2 Measurement Goals
The purpose of measuring supersonic combustion flow is to assess the performance
of the combustion and enable the design of scramjet engines. Properties of the flow that
need to be measured to assess performance include fuel mixing, extent of reaction
(burning), temperature, pressure, and velocity [2].

3
Computer models of these flows using computational fluid dynamics (CFD) are
being developed [3], [5], [6]. CFD models of the turbulence are engineering
approximations of statistical properties of the turbulence that arise from time-averaging
the governing equations for the flow. These turbulence models require empirical inputs,
for example the turbulent Prandtl and Schmidt numbers [5]. Validation of models of the
reactions in the flow (chemical kinetic models) requires temperature and species
concentration measurements. Measurements of supersonic combustion flows are being
made to create a benchmark data set to validate and improve CFD models and create new
ones. Different models of the same flow can vary up to ~200 K [7]; therefore
measurements with accuracies on the order a hundred Kelvin would prove useful. If
made accurately, CFD models could reduce the cost of experiments by reducing or
eliminating the need for ground testing. These CFD models could also increase the range
of conditions at which the performance of scramjets could be predicted. For example,
performance could be simulated by computers for speeds not easily reached in the ground
testing facilities.
The practical application of measurement techniques to supersonic combustion flows
is challenging. There are many desirable characteristics of the measurement
instrumentation for the best characterization of these flows. For example, instruments
should be able to withstand the high acoustic noise, strong velocity gradients, and high
temperatures produced by these flows. To characterize the turbulence of the flow,
instruments are required to be able to obtain repeated, spatial- and time-resolved
measurements of multiple flow properties simultaneously. The instrument must be able
to operate within the duct of a scramjet engine which typically has very limited access.
4
Finally, the measurements will be most accurate if they are non-intrusive to retain the
integrity of the flow properties.
1.1.3 Measurement techniques
A variety of instruments have been used to measure the desired properties of
supersonic combustion flow. Different measurement techniques are commonly used in
combination with each other. Using multiple measurement techniques at once allows the
cross check of measurements and measurement of multiple properties at once. An
overview of the types of instruments used to measure in supersonic combustion and the
properties they measured are presented in this section. For this discussion the
measurement techniques are broken in two groups: non-laser based techniques and laser
based techniques.
1.1.3.1 Non-Laser Based Techniques
The non-laser based techniques used to measure supersonic combustion can measure
a variety of properties. Most non-laser measurements are taken on the wall of the duct
forming the scramjet engine or are visualization techniques and provide only qualitative
information. The few non-laser measurements taken within the flow are intrusive
(perturb the flow) and therefore change the fluid properties being measured.
Visualization and imaging of the general flow structures has been obtained with
techniques such as Schlieren, shadowgraph, direct video, photography, spontaneous OH
emission, and broadband flame emission in the UV, visible, and IR spectral regions. All
these visualization techniques provide line-of-sight flow field images that give general

5
spatial information about flow structures. Line-of-sight techniques are optical techniques
where the light collected is a summation over the line of sight. Therefore, these
techniques cannot provide information that is distinguished spatially in the propagation
direction of the collected light.
The widely used Schlieren technique visualizes the first derivative of density,
providing general spatial information of flow structures. Refs. [8]-[10] have used
Schlieren to visualize flow structures such as the shocks structures of fuel injection [10].
Shadowgraphs measure the second derivative of density which limits its measurement
capability to flows having strong density gradients. This line-of-sight technique has been
used to visualize supersonic combustion flow structures like the turbulent structures of
hydrogen fuel injection in Refs. [8] and [11]. Direct video images and photographs used
in Refs. [12] and [13] can provide information about the structure of the flame and
observe phenomena such as the ignition process [13]. During the combustion process
OH is created and spontaneous emission of this molecule can be used to visualize the
location of OH, which indicates the location of the combustion zone [8], [14].
Broadband flame emission has been used to indentify regions of no combustion [11].
Thermal infrared (IR) imaging has been used to visualize the plume of the flow as
reported in Ref. [12]. This technique also gives combustion location information.
The most commonly measured parameter in supersonic combustion flows is
pressure. Most measurements are obtained with wall static tapped pressure transducers to
measure wall pressure [13]-[25]. Measurements have been made within the flow with
Pitot probes or Pitot rakes (a row of Pitot probes) [26], which are equipped to withstand

6
the high temperatures of combustion. Although these probes can measure within the
flow, they are intrusive and change the properties of the flow.
Most temperature measurements that are non-laser based are made by
thermocouples. Some thermocouples were placed in the wall of the model as in Refs.
[13], [15], and [24]. Magre et al. [19] and Anderson et al. [27] used thermocouples as
intrusive temperature probes to measure the stagnation or total temperature within the
flow for comparison to laser based temperature measurement techniques.
Species concentrations have been measured to characterize the chemistry and mixing
of supersonic combustion. A gas sampling probe connected to a mass spectrometer was
used by Skinner et al. [28] to collect and analyze samples of a supersonic combustion
flow at a row of centerline locations along the wall. The mass spectrometer measured
species concentrations of hydrogen, oxygen, nitrogen, water, and nitric oxide. Javoy et
al. [29] measured the concentration of the O atom, created by behind reflected shock
waves, with atomic resonance absorption spectroscopy.
Other performance properties such as heat transfer and release, thrust, and skin
friction have also been measured. Goyne et al. [23] measured the heat transfer to a wall
of the combustor model with a thin film gauge. Simultaneously, on the same wall, skin
friction measurements were made with skin friction gauges to assess the drag of the flow.
Ryan et al. [24] used calorimetry to measure the total heat release and a thrust stand to
measure the thrust produced by a supersonic combustor.
In summary, a variety of non-laser based techniques have been used to measure
properties in supersonic combustion flow, some of which have been described above.
These measurements provide some information about the flow field and duct allowing an
7
improved understanding of scramjets. But, none of the measurements offer the
nonintrusive time- and space- resolved measurements within the flow that are needed to
fully characterize the flow for modeling the turbulence and/or chemistry.
1.1.3.2 Laser-Based Techniques
Laser-based techniques are advantageous over non-laser based techniques because
they offer the capability to measure the flow non-intrusively and can provide time- and
space-resolved measurements within the flow. Some laser-based measurement
techniques can measure more than one property at once. Depending on the technique, the
measurements spatial resolution can be line-of-sight averaged, planar, or point (small
volumes).
A laser can be formed into a sheet and passed through a flow to visualize properties
qualitatively (or quantitatively) in a variety of ways. A variation of the shadowgraph
technique, mentioned above, can produce time resolved images of flow structures by
using a laser sheet as the illumination source as reported in Ref. [25]. A laser sheet was
used by Gong et al. [13] to produce frozen pictures of the supersonic mixing and
combustion flow field with Mach-Zehnder interferograms. Springer et al. [26] and Smith
et al. [30] used a laser sheet to produce Mie scattering from silica. Silane was seeded
into the flow with the hydrogen fuel and when it was ignited silica was produced. The
Mie scattering signal was used to indicate high temperature regions of the flow. Goyne et
al. [20] obtained images of the fuel plume with the Mie scattering technique by seeding
the fuel with silicon dioxide particles. OH planar laser-induced fluorescence (PLIF) can
be used to visualize the location of OH in the flow and therefore the location of

8
combustion. OH PLIF is a commonly used technique and a few examples of supersonic
combustion applications are reported in Refs. [8], [11], [18], [24], [31]-[33]. Along with
OH PLIF, Bryant et al. [32] used PLIF to image acetone seeded in the hydrogen fuel to
measure the fuel locations before combustion occurs. Allen et al. [33] used nitric oxide,
which occurs naturally in some facilities, to visualize basic flow features with PLIF.
The PLIF technique can also be quantitative. Listed here are a few examples of
measurements made in supersonic combustion. Allen et al. [33] not only used nitric
oxide PLIF to visualize the flow but also to measure temperature distributions in the
nonreacting and nonmixing portions of the flow. Laufer et al. [34] used OH PLIF to
measure OH density and temperature in supersonic combustion. Gauba et al. [35] used
OH PLIF to measure velocity on a plane in the flow.
There are a few other techniques that have been used to measure velocity in
supersonic combustion flow. Laser Doppler velocimetry was used by Refs. [8], [9], [18],
and [36] to measure velocity. This technique requires particle seeding of the flow. For
supersonic combustion, the particles must be able to withstand the high temperatures
within the flow. Magre et al. used [18] submicron carbon and MgO particles. Jiang et al.
[9] and Jarrett et al. [36] both used Al2O3 particles for their velocity measurements.
Another measurement technique, particle imaging velocimetry (PIV) was used by
Weisgerber et al. [37] and Goyne et al. [38] to measure two components of velocity.
Smith et al. [39] used PIV to measure three components of velocity. Like LDV, PIV
requires seeding of the flow with particles such as Al2O3. A technique called laser-
induced grating (LIG), does not require seeding of the flow to measure velocity and was
demonstrated in supersonic combustion by Schlamp et al. [40].

9
Ultimately, simultaneous measurement of as many properties as possible is desirable.
Several techniques capable of measuring multiple properties simultaneously have been
demonstrated in supersonic combustion including: Rayleigh scattering, diode laser
absorption spectroscopy, Ultraviolet (UV) Raman spectroscopy, and coherent anti-Stokes
Raman spectroscopy (CARS). Rayleigh scattering was used to measure temperature and
density in Ref. [41]. Diode laser absorption spectroscopy can simultaneously measure
temperature, species concentrations, and pressure. This method has been demonstrated in
supersonic combustion flows in Refs. [42]-[44]. Bolshov et al. [42] used diode lasers to
measure water concentration and temperature. Lindstrom et al. [43] used diode lasers to
measure water concentration, temperature, and static pressure. Rieker et al. [44] used
diode lasers to measure water, carbon dioxide, and temperature. Diode laser absorption
spectroscopy is a line-of-sight technique and therefore cannot offer fully spatially
resolved flow measurements. UV Raman spectroscopy was used by Pitz et al. [45] to
measure temperature and species concentration. In the supersonic combustion
environment the UV Raman signal suffers from a low signal-to-noise ratio because the
natural fluorescence emitted from the combustion is near in wavelength to the UV Raman
signal. CARS can measure temperature and species concentrations and has been
demonstrated in supersonic combustion by Refs. [8], [16]-[19], [26], [27], [36], [46]-[51].
Details about these applications of CARS can be found in Section 1.3.
CARS has advantages over the other techniques that are also capable of time
resolved, nonintrusive, simultaneous multiple property measurement. CARS can provide
spatially resolved measurements, whereas diode laser absorption spectroscopy cannot.
The laser like signal of CARS offers the capability to measure in enclosed flows with

10
limited optical access and gives CARS a higher signal-to-noise ratio capability than UV
Raman spectroscopy. Because of these advantages CARS was chosen as the technique to
characterize the supersonic combustion flows measured in this dissertation.
1.2 CARS CARS is a laser measurement technique that collects spectral information about the
volume of molecules probed by the overlap of three laser beams. The collected spectra
are sensitive to properties of the molecules within the volume probed (probe volume)
such as temperature, species concentrations, and pressure. This section will include a
brief classical explanation of CARS, a brief quantum mechanical explanation, a
discussion of the general instrumentation used for CARS, and a comparison of different
CARS techniques. For further detailed information about CARS see Refs. [52] and [53].
1.2.1 Classical Theory
A CARS signal is created because of an interaction of molecules with light called
scattering. The scattering of electromagnetic waves of light from molecules can be
described classically by Maxwell’s equation, Eq. 1.1,
∇2𝐸𝐸�⃑ − 𝜇𝜇0𝜀𝜀0𝜕𝜕2𝐸𝐸�⃑
𝜕𝜕𝜕𝜕 2 = 𝜇𝜇0𝜕𝜕2𝑃𝑃�⃑
𝜕𝜕𝜕𝜕 2 , 1.1
where the light is modeled by the electric field (𝐸𝐸�⃑ ) and the molecules response as
changes in polarization (𝑃𝑃�⃑ ). When solving for the polarization in Eq. 1.1, the magnitude
of the polarization of the molecule can be approximated as a Taylor series expansion in
terms of the amplitude of the electric field (E) and the susceptibility of polarization(𝜒𝜒).
This expansion is shown in Eq. 1.2.

11
𝑃𝑃 = 𝜀𝜀0(𝜒𝜒(1)𝐸𝐸 + 𝜒𝜒(2)𝐸𝐸 ∙ 𝐸𝐸 + 𝜒𝜒(3)𝐸𝐸 ∙ 𝐸𝐸 ∙ 𝐸𝐸 + ⋯ ) 1.2
The first order scattering responses of the molecules to light are linear and incoherent
(spread in all directions). These first order responses scatter the light either elastically
(Rayleigh scattering) or inelastically (Raman scattering). The second order response is
zero for molecules with inversion symmetry [54], as are many of the gaseous molecules
studied by CARS. The third order response of the susceptibility to polarization is the
largest nonlinear response of most gaseous media. The components of the third order
polarization are related to the third order susceptibility and electric fields of the lasers as
in Eq. 1.3.
𝑃𝑃𝑖𝑖(3) = 𝜀𝜀0𝜒𝜒𝑖𝑖 ,𝑗𝑗 ,𝑘𝑘 ,𝑙𝑙
(3) 𝐸𝐸𝑗𝑗𝐸𝐸𝑘𝑘𝐸𝐸𝑙𝑙 1.3
The third order susceptibility is a tensor containing 27 terms for each component of
polarization. This tensor is a property of the medium being polarized. For example, in
isotropic media (e.g. gas molecules with inversion symmetry) there are only 21 terms in
the third order susceptibility tensor of which only three are independent [52]. Raman
scattering can be enhanced to a coherent signal by using this third order response to light.
One of these enhanced Raman techniques is termed coherent anti-Stokes Raman
spectroscopy (CARS).
CARS uses three photons, contributed from three electric fields of the lasers, to
generate a coherent signal. These three electric fields are combined in a specific way to
interact with a medium so that the signal coherently builds. The electric field of the
signal can be expressed as an integral over the overlap volume of the three laser beams as
derived in Ref. [55]. This equation was derived assuming that the beams are all polarized

12
in the same direction and that the index of the refraction of the medium is one. This
derivation is expressed in Eq. 1.4:
𝐸𝐸4(𝑟𝑟0) = 𝜒𝜒(3)𝑒𝑒−𝑖𝑖𝑘𝑘4𝑟𝑟0 𝑘𝑘42
𝑟𝑟0∫𝐸𝐸1 (𝑟𝑟)𝐸𝐸2
∗(𝑟𝑟)𝐸𝐸3(𝑟𝑟) × 𝑒𝑒−𝑖𝑖𝑟𝑟∙�𝑘𝑘�⃑ 4𝑟𝑟0̂+𝑘𝑘�⃑ 2−𝑘𝑘�⃑ 1−𝑘𝑘�⃑ 3�𝑑𝑑𝑑𝑑 , 1.4
where 𝑟𝑟0� = 𝑟𝑟0/𝑟𝑟0. Eq. 1.4 the 𝑘𝑘�⃑ represents the wave vector of each electric field,
subscripts 1-3 indicates the input lasers and subscript 4 represents the CARS signal beam.
This equation shows the dependence of the CARS signal on the magnitude of the electric
fields, Ei, (determined by the intensity of the lasers), the volume of the overlap of the
lasers (probe volume), and the wave vectors summation. For maximum CARS signal the
momentum of the input and generated electric fields must add to zero so that the
exponential term within the integral is equal to its maximum value of one. This
summation of the wave vectors is referred to as phase matching, which is a statement of
the conservation of momentum. Any summation not adding to zero is referred to as the
phase mismatch and is represented as Δk in Eq. 1.5.
∆𝑘𝑘 = 𝑘𝑘�⃑ 4 + 𝑘𝑘�⃑ 2−𝑘𝑘�⃑ 1 − 𝑘𝑘�⃑ 3 1.5
Each wave vector is equal to,
𝑘𝑘�⃑ = 𝜔𝜔𝑐𝑐�̂�𝑟 1.6
where ω is the frequency of the laser light, c is the speed of light in the medium, and �̂�𝑟 is
the direction of the propagation of the laser. The frequencies of the lasers (ω1, ω2, and
ω3) add as in Eq. 1.7 to equal the CARS signal frequency (ω4).
𝜔𝜔4 = 𝜔𝜔1 + 𝜔𝜔3 −𝜔𝜔2 1.7

13
Equation 1.7 is a statement of the conservation of energy. In Eq. 1.7 the index of
refraction is assumed to be equal for all frequencies. This assumption is made because
CARS is typically performed in air or gases with similar indexes of refraction near one.
There are different ways of achieving phase matching as in Fig. 1.1. The lasers can
be added collinearly or at angles with a scheme referred to as BOXCARS. The choice of
phase matching scheme depends on spatial resolution versus signal strength desired.
Collinear phase matching creates a larger probe volume, increasing signal strength but
decreasing the spatial resolution. USED CARS is a collinear phase matching scheme that
uses the shape of an unstable resonator Nd:YAG beam profile to reduce the size of the
probe volume [52], although it is still typically greater than 4 mm long. The phase
matching scheme used in the experiments in this dissertation used the folded BOXCARS
scheme because of its high spatial resolution capability and propagation of the signal in a
direction spatially separated from the input lasers. A three dimensional representation of
Figure 1.1: Different ways of phase matching the wave vectors of CARS.

14
Figure 1.2: A drawing of the lasers forming the folded BOXCARS phase matching scheme. the lasers in a folded BOXCARS phase matching scheme is shown in Fig. 1.2, including
the lenses used to cross, focus, and collimate the laser beams.
The intensity of the CARS signal (𝐼𝐼) can be found by time averaging the Poynting
vector (𝑆𝑆) shown in Eq. 1.8, where n is the index of refraction (assume to be one) and c is
the speed of sound.
⟨𝑆𝑆⟩ = ⟨ 1𝜇𝜇0𝐸𝐸�⃗ × 𝐵𝐵�⃗ ⟩ = 𝐼𝐼 = 𝑛𝑛𝑐𝑐 𝜀𝜀0�𝐸𝐸�⃗ �
2
2 1.8
In Eq. 1.8 the intensity is shown to be proportional to the square of the magnitude of the
electric field of the CARS signal from Eq. 1.4. The integral over the overlap region of
the electric fields of the input laser beams in Eq. 1.4 can be approximated by assuming
the probe volume (overlap region) is a cylinder with length, 𝑙𝑙. It is also assumed that the
intensity of the CARS signal is uniform over the probe volume and that phase matching
is always satisfied at all points. The resulting intensity using these approximations is
shown in Eq. 1.9 and reveals that the intensity of the CARS signal is proportional to the
square of the third order polarization susceptibility [52].

15
𝐼𝐼4 = 𝜔𝜔42
𝑐𝑐4𝜀𝜀02 𝐼𝐼1𝐼𝐼2𝐼𝐼3�𝜒𝜒(3)�2𝑙𝑙2 �
sin Δ𝑘𝑘𝑙𝑙2Δ𝑘𝑘𝑙𝑙
2
�2
1.9
1.2.2 Quantum Theory
CARS depends on the polarization of molecules. In classical theory the polarization
is assumed to be continuously variable, but in fact quantum theory shows that the
susceptibility to polarization of a molecule is quantized into rotational and vibrational
energy levels. The spacing between energy levels is not uniform, causing transitions
between energy levels to have unique frequencies. This allows distinction between
energy transitions within the molecule and therefore comparison of the population of
each state. Because the molecule’s energy state depends on the temperature of the
molecule, a group of molecules’ temperature can be determined from the distribution of
the population of the energy levels. This behavior varies according to Boltzmann’s
distribution. Every type of molecule’s energy spacing between quantized energy levels is
unique, allowing distinction between the spectral responses of different molecules. As a
result, a group of molecules’ species can be identified by the frequency of their energy
transitions. The population of the energy levels of each type of molecule can be
compared to the population of the other molecules allowing concentration measurements.
When light interacts with the molecules, transitions can occur between the vibration
and rotational energy levels, causing inelastic scattering of light. This process is referred
to as Raman scattering and scatters light that is changed in frequency. In the CARS
technique, the frequencies of the CARS lasers are chosen to drive the excitation of the
molecules to achieve a coherent Raman signal. The frequencies of two of the lasers are

16
chosen to correspond to the spacing of the energy levels of the third order susceptibility
(Raman transitions) of the molecule. All three lasers frequencies must add as in Eq. 1.7.
Shown in Fig. 1.3, one of the lasers (pump beam) of frequency ω1, adds energy to the
molecules while another laser (Stokes) of frequency ω2, reduces the energy of the
molecules, having a combined effect that excites the molecule to a higher energy level.
A third laser beam (probe) of frequency ω3, scatters light from the molecules and the
CARS signal is emitted. The frequency difference of the pump and the Stokes beam
determines the frequency spacing probed and thus which molecules and energy levels are
excited. The summation of this frequency difference and the probe laser frequency
determines the frequency of the CARS signal.
Although this interaction of the light and molecule probes the energy level of the
molecule (resonant signal), other interactions with other molecules with different energy
spacings or types of reactions to the light occur in the probe volume that add to the signal.
These are referred to as nonresonant signals and include off-resonant reactions, electronic
transitions, and other Raman interactions. While much smaller than the resonant signal,
Figure 1.3: Laser light interaction with molecular energy levels.

17
the nonresonant contributes to the signal and must be accounted for to obtain accurate
measurements of the properties of the material within the probe volume.
1.2.3 Instrumentation
CARS setups vary widely; here a description of a typical setup of a CARS system for
gaseous measurement will be described. The diagram of the optical layout of a typical
CARS system is shown in Fig. 1.4. A CARS system typically uses a Nd:YAG laser as its
main laser source, this provides a high energy pulsed source that can be used as the
excitation source for dye lasers. The pulsing of the laser allows for time resolved
measurements on a nanosecond timescale. The frequencies of the dye lasers are chosen
depending on the desired species measurement. The optical setup of a CARS system is
designed with delay lines so that the lasers arrive at the probe volume simultaneously for
maximum signal. The focuses of the lasers are matched with telescopes to maximize the
energy density at the probe volume, increasing CARS signal. Two sets of mirrors for
each laser beams control location and direction of the laser to minimize the phase
mismatch and maximize the spatial overlap of the laser beams. The CARS signal is
generated at the beam overlap called the probe volume. The CARS signal is separated
from the input beams after the collimating lens. The CARS signal is then directed to
lenses which focus the signal through the slit of a spectrometer. The spectrometer
disperses the signal and the spectrum is collected on a CCD. An image of a CARS
spectrum taken in air is shown in Fig. 1.5.
The CCD is horizontally binned into 3 rows to decrease the readout time of the CCD

18
Figure 1.4: Optical layout of a typical CARS system.

19
for the camera to be capable to acquiring images at 10-30 Hz. Binning horizontally also
increases the signal-to-noise ratio of the CARS signal. The CARS spectrum with
background light is placed in the center bin, while the other bins only contain background
scattered light. The background scattered light collected in the other bins can then be
used to remove background light from the CARS spectrum.
After subtracting the background light from the signal the nonresonant contributions
to the signal are removed. The nonresonant contributions to the CARS signal are
characterized by acquiring CARS spectra of gas with no resonances in the CARS probing
region (e.g. argon). The square root of the CARS spectrum is then taken so the intensity
of the resulting spectrum scales linearly with the third order susceptibility to polarization
(see Eq. 1.9).
Next, the CARS spectrum is compared to theoretical spectra generated in the data
analysis program CARSFT [56]. CARSFT generates theoretical CARS spectra using the
quantum mechanical model that approximates the molecules as a rigid rotator as outlined
by Herzberg [57]. Measured constants describing the molecular characteristics of each
molecule required for this model are in an input file used by CARSFT.
In general, the height and shape of the CARS resonant spectrum in relation to the
nonresonant background depends on species concentration as shown in Fig. 1.6. In this
figure the theoretical resonant spectra of nitrogen and oxygen generated by CARSFT are
Figure 1.5: Image of a CARS spectrum.
20
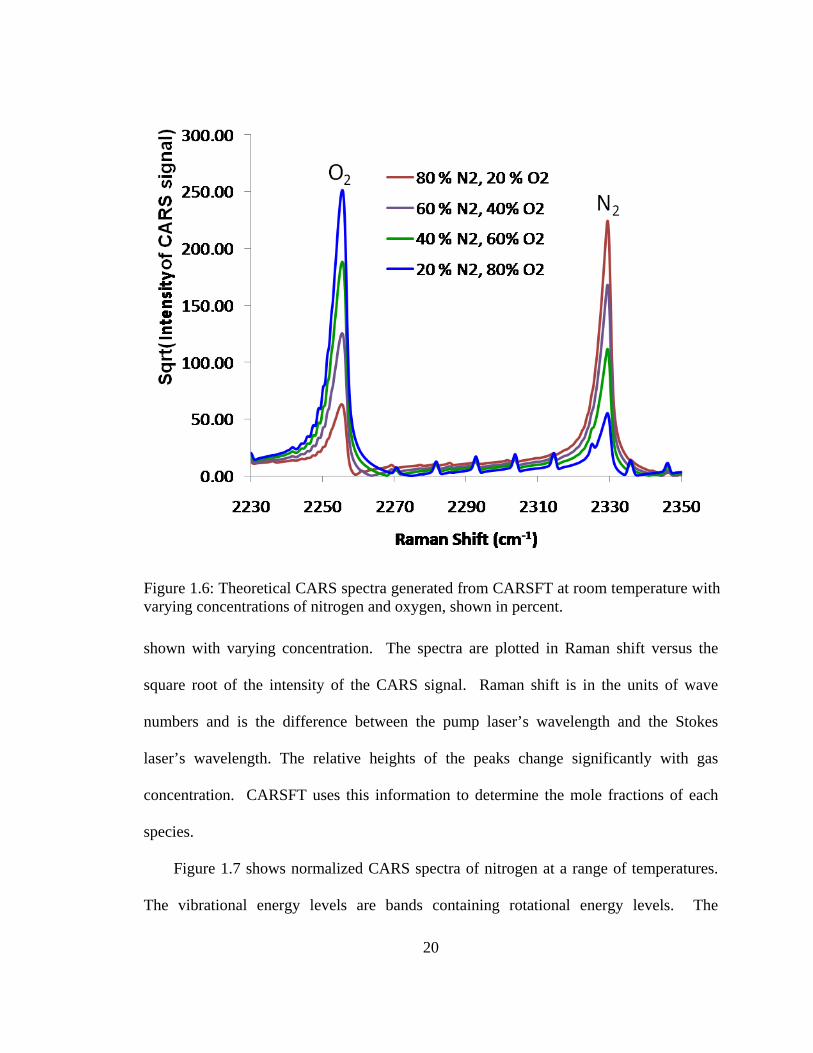
shown with varying concentration. The spectra are plotted in Raman shift versus the
square root of the intensity of the CARS signal. Raman shift is in the units of wave
numbers and is the difference between the pump laser’s wavelength and the Stokes
laser’s wavelength. The relative heights of the peaks change significantly with gas
concentration. CARSFT uses this information to determine the mole fractions of each
species.
Figure 1.7 shows normalized CARS spectra of nitrogen at a range of temperatures.
The vibrational energy levels are bands containing rotational energy levels. The
Figure 1.6: Theoretical CARS spectra generated from CARSFT at room temperature with varying concentrations of nitrogen and oxygen, shown in percent.

21
vibrational level transitions are labeled in Fig. 1.7 as v=ij, where i and j indicate
vibrational energy levels. A few of rotational transition levels are pointed to with arrows
in Fig. 1.7. The intensity of the CARS signal from each energy level depends on the
population of each energy level. The distribution of the population in the different
energy levels is determined by the Boltzmann distribution which depends on the
temperature. As shown in Fig. 1.7, the intensity of the CARS signal and therefore
population of higher energy levels increases with increasing temperature. At
Figure 1.7: Theoretical CARS spectra generated from CARSFT of nitrogen at a range of temperatures. The populations of higher energy levels both rotational and vibrational increase with temperature.

22
temperatures near room temperature (300 K) the higher vibrational energy levels are not
significantly populated to produce a detectable CARS signal. Also, at these temperatures
the rotational energy levels are not resolved with typical spectrometer used for CARS.
Therefore, at low temperature, the temperature is determined from the width of the
spectrum.
The temperature and concentration is determined by finding the best match between
theoretical and experimental spectra. The best match can be determined by searching a
library of theoretical spectra and then interpolating between entries (as in Chapter 2 and
6) or varying the input parameters to generate theoretical spectra according to the least
square fitting algorithm in the CARSFT code (Chapter 3). Details of these methods are
given in each chapter in which they are used.
1.2.4 Survey of CARS Techniques, Strategies, and Systems
CARS can be tuned to different species by choosing different frequencies of the
lasers. The type of Raman transitions probed, rotational or vibrational (which contain
rotational transitions) are determined by the frequency of the lasers. Vibrational and
rotational CARS are considered as two different disciplines of CARS.
At low temperatures (near room temperature), rotational CARS measurements are
more precise and accurate measurements than vibrational CARS measurements.
Rotational CARS spectra contain resolved rotational Raman transitions and the
temperature is determined by comparing the heights of these rotational lines. At low
temperatures, the higher energy vibrational bands obtained with vibrational CARS are not
populated and cannot be used to measure temperature. The rotational levels within the

23
ground vibrational bands are typical not resolved; therefore the temperature is determined
by width of the vibrational band spectrum alone. Small variations in the width of the
spectrum indicating large temperature changes (~50 K) are not easily distinguished
leading to poorer accuracy and precision. At high temperatures the signal-to-noise of
rotational CARS is much less than vibrational CARS. Therefore, vibrational CARS is
more accurate and precise at higher temperatures than rotational CARS. Vibrational
CARS was chosen for the experiments presented in this dissertation because of the high
temperature (> 2000 K) environments in which the CARS systems were applied.
Different designs and types of CARS systems have been used for a variety of gas
species measurements. Table 1.1 compares examples different types of rotational,
vibrational, and combination rotational/vibrational CARS systems: broadband [58],[59],
dual-pump [25], [60]-[63], dual-pump Stokes [64], dual-Stokes [27], triple-pump [65],
dual-broadband [66],[67], combined vibrational and rotational dual-broadband [68] and
dual-broadband dual-pump [69],[70].
Vibrational broadband CARS enables the measurements of a range of frequencies at
once by making the Stokes laser broadband, typically 5-10 nm full width half maximum
(FWHM). The other lasers are narrowband, and have FWHM that are less than 0.1 nm.
This allows the simultaneous probing of a range of Raman transitions as shown in Fig.
1.8. This spreads the probing energy for each transition over a range of transitions,
allowing multiple line measurement and enabling transition height comparison giving
single laser pulse (single-shot) temperature measurement capability.
A common problem with broadband CARS is the imprecision of the measurements,
when compared to scanning CARS. The intensity of the CARS signal at each frequency

24
varies with the probing intensity. The probing intensity varies with the intensity of the
broadband dye laser at each wavelength determined by its spectral profile. A broadband
dye laser’s spectral profile varies from shot-to-shot because of changes in dye
concentration, changes in temperature, and mode competition. Since the relative
intensity of each transition used to determine temperature and concentration varies shot-
to-shot, these measurements are imprecise. But broadband CARS enables measurement
of temperature and multiple species simultaneously and instantaneously, which
outweighs this disadvantage and is therefore the most commonly used variation of the
technique in combustion applications. Examples of broadband CARS in Table 1.1, Yueh
Table 1.1: Examples of CARS systems using different techniques, attributes summarized.

25
et al. [58] and Flores [59], demonstrate the capability of broadband CARS to measure
multiple species simultaneously. All other references in Table 1.1 used broadband CARS
in combination with other CARS techniques.
Dual-pump CARS, first demonstrated by Lucht [71], uses two different frequency
narrowband lasers to simultaneously probe two energy levels as shown in Fig. 1.9. The
Figure 1.8: Broadband CARS energy level diagram.
Figure 1.9: Dual-pump CARS energy level diagram.

26
Stokes simultaneous probes one frequency in combination with the first pump laser in (a)
while also probing another frequency with the second pump laser (b). The third beam not
being used in combination with the Stokes laser becomes the probe beam. Dual-pump
CARS is typically used in combination with broadband CARS which allows
simultaneous probing of two spectral regions, as is true for all dual-pump examples listed
in Table 1.1.
Dual-pump broadband CARS is advantageous because its design allows the same
three lasers to probe two spectral regions while producing one signal beam. Since the
same three laser beams are used, the probe volume for each spectral region is identical in
size and location, thus species correlation between the two spectral regions probed is
strong. Because dual-pump broadband CARS probes vibrational bands, its temperature
accuracy is higher than dual-broadband rotational CARS at combustion temperatures.
The other techniques in Table 1.1 have more complicated setups or data analysis.
Dual-broadband CARS uses two broadband Stokes lasers to probe two frequency regions.
These systems lead to more complicated CARS spectra because of the overlapped
spectral response of the molecules and is less commonly used. More complicated setups
of CARS systems involve adding a fourth laser beam for systems such as dual-Stokes,
triple pump, and dual-broadband dual-pump. Dual-Stokes uses four laser beams to
measure two overlapped probe volumes. This method requires two spectrometers and two
broadband dye lasers with different center wavelengths. The fourth laser beam used by
dual-Stokes and other techniques enables more combinations of frequencies
simultaneously and therefore more species probing opportunities. All these systems have
increased equipment requirements compared to broadband or dual-pump systems. Table

27
1.1 references some specific uses of each of these systems and what species they
measured.
The CARS systems used for the experiments presented in this dissertation are the
dual-pump broadband system by O’Byrne et al. [16] and WIDECARS. The O’Byrne et
al. system is used in Chapter 2 and Chapter 3 to measure nitrogen, hydrogen, and oxygen
in hydrogen-fueled flows. Typically, CARS systems can only measure relative species
concentrations, but because all the major species present in the combustion flow (except
water, which is found by difference) were measured, absolute concentration
measurements could be made. WIDECARS is a dual-pump broadband system with a
spectrally broadened Stokes laser and has demonstrated the capability to detect the most
species of all the systems presented in Table 1.1. This system was developed for the
measurement of all the major species in hydrogen and ethylene fueled supersonic
combustion flames and therefore, like the O’Byrne et al. system, can measure absolute
species concentrations. This new system will be presented in detail in Chapter 6.
1.3 CARS Measurements in Supersonic Combustion CARS has been used as a tool for characterizing supersonic combustion for the last
~20 years. CARS is well suited for this environment because of its high signal-to-noise
ratio and its ability to access a ducted flow through small, slotted windows. It is
desirable to make time-resolved measurements to characterize the turbulence of the
supersonic combustion flow; therefore the single-laser-pulse (single-shot) measurements
made with CARS are desirable. Another desirable attribute of CARS is its measurement
volume on the order of millimeters which allows structures of the flow to be resolved.

28
The location of the CARS measurement volume is typically moved by traversing the
beam crossing using a translation system. As mentioned above, the capability of CARS
to obtain simultaneous space and time resolved measurements of multiple properties of
the combustion flow is desirable. Researchers have attempted to measure the variances
in the flow by using CARS to make multiple species and temperature measurements with
adequate spatial resolution, accuracy, and precision.
Although these goals seem readily achievable by CARS in the laboratory
environment, reaching these goals with a practical application to large scale supersonic
combustion is difficult because of the harsh environment produced by the flow.
Supersonic combustion flows are noisy and generate vibrations. Within the flow are steep
temperature and density gradients over large temperature ranges. The high temperatures
cause large temperature changes in the testing environment. The flows also can change
in composition completely from measurement to measurement. All of these flows
attributes offer challenges for applying CARS and can adversely affect the CARS
instrument. In summary, CARS is suitable for application to supersonic combustion but
the instrument must be robust.
All CARS measurements of supersonic combustion made previous to the
experiments presented in chapters 2 and 3, are discussed in this section and their details
are summarized in Table 1.2. An attempt has been made to make this an exhaustive
listing. All flows that have been measured were hydrogen fueled and have been
combustion heated (vitiated) to simulate a higher Mach flight number (enthalpy) than the
actual flow velocity. All CARS systems used have a 10 ns resolvable time scale
determined by the duration of their laser pulse. All flows studied were enclosed by a

29
rectangular duct, except the measurements in a laboratory-scale (~18 mm diameter) open
flame by Jarrett et al. [36] in 1988. The first ducted measurement was performed by
Anderson et al. [27] in 1992. Anderson et al. used a Dual-Stokes CARS system to
measure species concentrations of N2, H2, and H2O at points along a line in the flow.
This system measured the gases’ vibrational bands. Temperature measurements were
determined from the N2 spectrum. Measuring only the nitrogen band limited the
precision and accuracy of temperature measurements in locations of the flow containing
small amounts of N2.
Other researchers have followed, such as Waidmann et al. [7], who measured mean
temperatures at points along a line across the axis of the flow at three positions
Table 1.2: CARS measurements in supersonic combustion. The shaded entries are measurements taken at NASA Langley.

30
downstream. A research group in China measured locations along the centerline of the
combustor and along the centerline of the diffusion flame in a supersonic combustion
flow. First, Gong et al. [13] measured with N2 CARS, which worked for locations in the
flow where N2 was > 30%. Next, Zhao et al. [17] measured temperature with N2 at two
points simultaneously. Finally, Yang et al. [46] revisited the same flow and
demonstrated a system, capable of measuring O2 and H2 relative species concentrations
and temperature using the ratio of the H2 peaks of S(5) and S(6), by taking measurements
at three locations along the centerline. The temperature measurements from the ratio of
the H2 peaks were calibrated with N2 measurements in a calibration flame. Using the
high energy rotational lines of H2 limited their temperature measurement to greater than
700 K. Another group from France, also performed two tests in the same flow, Marge et
al. [18] and [19], once using N2 CARS as a temperature probe and another time using H2
Q branch (vibrational band) as a temperature probe. The N2 CARS and the H2 CARS
measurements were not taken simultaneously, but during separate tests with the same
conditions. The combination of these temperature measurements for each species
increases the locations of the flow that can be measured because when a species is not
present or is low in concentration, the temperature measurement is unusable. During
both tests, points along the radial profiles were measured at several locations along the
direction of flow. Yet another group, Vereschagin et al. [47], used N2 CARS to measure
temperature at one point in a supersonic combustion flow.
NASA Langley Research Center, where the research for this dissertation was
performed, has a long history of CARS measurements in supersonic combustion starting
with Jarrett et al. [36] in 1988. The intent of these measurements has been to benchmark

31
CFD models. Jarrett et al. [36] performed CARS measurements in a laboratory scale
open flame, using a Dual Stokes CARS system with four laser beams. Temperature,
nitrogen density, and oxygen density were measured in a vertical scan along the
centerline and radial surveys at 5 axial locations. Unfortunately, the size of the flow
structures was too small to resolve with the CARS measurement volume. Also, flow
design was inadequate for CFD validation because the mixing and combustion of the
flow was dominated by a diamond shock system formed by the nozzle (Cutler et al. [48]).
Following this experiment, a series of full-scale ducted flows were measured in the Direct
Connect Supersonic Combustion Testing Facility (DCSCTF). Smith et al. [49] made
temperature measurements with broadband N2 CARS in a ducted flow. The hydrogen
was injected normal to the flow. Scans were performed at several locations downstream
to form 3 planes of temperature measurements. The model hardware did not withstand
the harsh environment and was destroyed during these measurements.
Starting in 1999 with Springer et al. [26], a series of CARS measurements were
made on a ducted model with inlet dimensions of 38.5 mm × 88 mm designed to simulate
Mach flight number of 7. At first, the hydrogen fuel was injected into the duct at an
angle of 30 degrees with respect to the flow. During the Springer et al. [26] test, which
used a 30 Hz Nd:YAG laser, the CARS signal level was too low for measurements and
N2 CARS temperature measurements were made during only one run at the center of the
nozzle exit. The same CARS system was upgraded with a much more powerful 10 Hz
Nd:YAG laser, resulting in improved signal strength. Cutler et al. [50] used this system
to make temperature measurements of spanwise planes at five axial locations within the
duct. The same duct and fuel injection was used for the O’Byrne et al. [16]

32
measurements but with a further-improved CARS system. The new CARS system used
the dual-pump technique and could measure N2, O2, and H2 species concentrations.
Measurements were made with this system at the same planes and fuel injection
configuration as Cutler et al. [50]. The fuel injection angle was subsequently changed to
be normal to the flow and again the same five planes were measured and are reported in
Tedder et al. [51]. These simultaneous measurements of multiple variables were taken in
order to measure turbulent characteristic variances, called Prandtl and Schimdt numbers,
for a Reynolds/Favre Averaged Navier-Stokes equations CFD model [5]. Unfortunately,
when the CFD modelers attempted to use these measurements to validate their codes, the
experiment proved to be a challenging test case because the combustion was initiated
well downstream of the fuel injection [72].
The current research effort aims to provide CFD modelers with simultaneous
measurements of all the previous physical parameters, plus additional parameters, in a
simplified flow. To provide CFD modelers with a simple flow in which the flow
structures could be resolved by the CARS system, a full-scale supersonic nozzle for an
open flame was designed. To add more measured physical parameters and further
characterize variances in the flow, the Interferometric Rayleigh Scattering (IRS) [73]
technique was added to the instrumentation. IRS can measure time and space resolved
velocity components simultaneously with CARS by using one of the CARS lasers.
Adding more measured flow properties and properties to correlate variances allows for a
deeper understanding of combusting and turbulence flows to be obtained.
This dissertation will describe preparations of the CARS system for testing in the
full-scale flow by measuring in a laboratory-scale model of this flow in Chapter 2. Then,

33
CARS measurements made in a mixing case of the full-scale flow will be presented in
Chapter 3. The issues with the instrumentation of the CARS system that were indentified
during these measurements and the improvements developed as solutions will be
discussed in Chapter 4. One of the improvements to the CARS system is a new
technique called WIDECARS, design details of this will be described in Chapter 5 and
Chapter 6. Chapter 5 will also offer a characterization the dependence of broadband dye
lasers’ spectral profile and efficiency on their optical components. Finally, a summary of
accomplishments, problems solved, and future recommendations are described in Chapter
7.

34
REFERENCES
[1] G. B. Northam, E. A. Andrews, R. W. Guy, Jr., G. L. Pellett, J. P. Drummond, A. D. Cutler, and K. E. Rock, “An overview of Hypersonic Propulsion Research at NASA Langley Research Center”, NASA Langley Research Center, Hampton, Va.
[2] R. C. Rogers, D. P. Capriotti, R. W. Guy, “Experimental Supersonic Combustion Research at NASA Langley”, 20th AIAA Advanced Measurement and Ground Testing Technology Conference, Albuquerque NM, June 15-18, 1998.
[3] M. Berglund, E. Fedina, C. Fureby, and J. Tegner, and V. Sabelnikov, “Finite Rate Chemistry Large-Eddy Simulation of Self-Ignition in a Supersonic Combustion Ramjet”, AIAA Journal, 48, 540-550 (2010).
[4] P. G. Hill and C. R. Peterson, Mechanics and Thermodynamics of Propulsion, 2nd Ed., Addison-Wesley Publishing, Inc., 1992.
[5] R. A. Baurle, “Modeling of High Speed Reacting Flows: Established Practices and Future Challenges”, 42nd Aerospace Sciences Meeting and Exhibit, Reno NV, 5-8 Jan., 2004.
[6] X. Xiao, H. A. Hassan, R. A. Baurle, “Modeling Scramjet Flows with Variable Turbulent Prandtl and Schmidt Numbers, AIAA Journal, 45, 1415-1423 (2007).
[7] R. L. Gaffney, Jr., “Numerical Simulations of a Co-axial Supersonic Combusting Free-Jet Experiment”, 55th JANNAF Meeting, May, 12-15, 2008.
[8] W. Waidmann, F. Alff, M. Bohm, U. Brummund, W. Clauss, and M. Oschwald, “Supersonic combustion of Hydrogen/Air in a Scramjet Combustion Chamber”, Space Technol., 15, 421-429 (1995).
[9] L. Y. Jiang and J. P. Sislian, “Velocity and Density Measurements in Supersonic High-Temperature Exhaust Plumes”, AIAA Journal, 36, 1216-1222 (1998).
[10] A. Ben-Yakar, and R. K. Hanson, “Hypervelocity combustion studies using simultaneous OH-PLIF and Schlieren imaging in an expansion tube”, 35th AIAA/ASME/SAE/ASEE Joint propulsion Conference and Exhibit, AIAA, Reston, Va., 1999.
[11] J. D. Abbitt, and C. Segal, J. C. McDaniel, R. H. Krauss, R. B. Whitehurst, “Experimental Supersonic Hydrogen Combustion Employing Staged Injection Behind a Rearward-Facing Step”, Journal of Propulsion and Power, 9, 472-478 (1993).
[12] E. Ajdari, E. Gutmark, T. P. Parr, K. J. Wilson, and K. C. Schadow, “Thermal Imaging of Afterburning Plumes”, 27th Aerospace Sciences Meeting, Jan. 9-12, 1989.
[13] Y. Gong, L. Jian-guo, Z. Jian-Rong, Y. Shi-Run, and L. Chun-jin, “Experimental Studies on H2/Air Supersonic Combustion”, International Space Planes and Hypersonic Systems and Technologies Conference, Nov. 18-22, 1996.
[14] R. B. Whitehurst, R. H. Krauss, and J. C. McDaniel, “Parametric and Time Resolved Studies of Autoignition and Flameholding in a Clean-Air Supersonic Combustor”, 28th Joint Propulsion Conference and Exhibit, Nashville, TN, July 6-8, 1992.

35
[15] C. Segal, J. C. McDaniel, R. H. Krauss, and R. B. Whitehurst, “Combustion Efficiency Determined from Wall Pressure and Temperature Measurement in a Mach 2 Combustor”, Reno, NV. Jan. 7-10, 1991.
[16] S. O’Byrne, P. M. Danehy, S. A. Tedder, and A. D. Cutler, “Dual-pump Coherent Anti-Stokes Raman Scattering Measurements in a Supersonic Combustor”, AIAA Journal, 45, 922-933 (2007).
[17] J. Zhao, S. Yang, J. Li, G. Yu, C. Li, “CARS measurements in a hydrogen/air supersonic combustor”, 35th AIAA, Aerospace Sciences Meeting and Exhibit, Reno, NV., Jan. 6-9, 1997.
[18] P. Magre and P. Pouchardy, “Nitrogen and Hydrogen Coherent Anti-Stokes Raman Scattering Thermometry in a Supersonic Reactive Mixing Layer”, Proceedings of the Combustion Institute, 28, 697-703 (2000).
[19] P. Magre, G. Collin, O. Pin, J.M. Badie, G. Olalde, and M. Clement, “Temperature measurements by CARS and Intrusive Probe in an Air-Hydrogen Supersonic Combustion”, 44, 4095-4105 (2001).
[20] C. P. Goyne, J. C. McDaniel, Jr., R. H. Krauss, and W. B. Whitehurst, “Test Gas Vitiation Effects in a Dual-Mode Scramjet Combustor”, Journal of Propulsion and Power, 23, 559-565 (2007).
[21] C. P. Goyne, J. C. McDaniel, T. M. Quagliaroli, R. H. Krauss, and S. W. Day, “Dual-Mode Combustion of Hydrogen in a Mach 5, Continuous-Flow Facility”, Journal of Propulsion and Power, 17, 1313-1318 (2001).
[22] A. M. Bonanos, J. A. Schetz, W. F. O’Brien, C. P. Goyne, “Dual-Mode Combustion Experiments with an Integrated Aeroramp-Injector/Plasma-Torch Igniter”, Journal of Propulsion and Power, 24, 267-273 (2008).
[23] C. P. Goyne, R. J. Stalker, and A. Pauli, “Shock Tunnel Skin Friction Measurement in a supersonic combustor”, 36th Aerospace Sciences Meeting and Exhibit, Reno NV, Jan. 12-15, 1998.
[24] M. Ryan, M. Gruber, C. Carter, T. Mathur, “Planar laser-induced fluorescence imaging of OH in a supersonic combustor fueled with ethylene and methane”, Proceedings of the Combustion Institute, 32, 2429-2436 (2009).
[25] S. O’Byrne, M. Doolan, S. R. Olsen, and A. F. P. Houwing, “Measurement and imaging of supersonic combustion in a model scramjet engine”, Shock Waves, 9, 221-226 (1999).
[26] R. R. Springer, and A. D. Cutler, “Conventional/Laser Diagnostics to Assess Flow Quality in a Combustion-Heated Facility”, 35th AIAA, Joint Propulsion Conference and Exhibit, 20-24, June, 1999.
[27] T. J. Anderson and A. C. Eckbreth, “Simultaneous Coherent Anti-Stokes Raman Spectroscopy Measurements in Hydrogen-Fueled Supersonic Combustion”, Journal of Propulsion, 8, 7-15 (1992).
[28] K. A. Skinner and R. J. Stalker, “Species Measurements in a Hypersonic, Hydrogen-Air, Combustion Wake”, Combustion and Flame, 106, 478-486 (1996).
[29] S. Javoy, V. Naudet, S. Abid, C. E. Paillard, “Elementary reaction kinetics studies of interest in H2 supersonic combustion chemistry”, Experimental Thermal and Fluid Science, 27, 371-377 (2003).

36
[30] M. W. Smith, and Northam, G. B., “Instantaneous Planar Visualization of Reacting Supersonic Flows Using Silane Seeding”, AIAA Paper 91-1690, June 1991.
[31] T. M. Quagliaroli, G. Laufer, S. D. Hollo, R. H. Krauss, R. B. Whitehurst, and J. C. McDaniel Jr., “Planar KrF Laser-Induced OH Fluorescence Imaging in a Supersonic Combustion Tunnel”, Journal of Propulsion and Power, 10, 377-381 (1994).
[32] R. A. Bryant, and J. F. Driscoll, “Structure of Supersonic Flames Imaged Using OH/Acetone Planar Laser-Induced Fluorescence”, AIAA Journal, 39, 1735-1741 (2001)
[33] M. G. Allen, T. E. Parker, W. G. Reinecke, H. H. Legner, R. R. Foutter, W. T. Rawlins, and S. J. Davis, “Fluorescence Imaging of OH and NO in a Model Supersonic Combustor”, AIAA Journal, 31, 505-512 (1993).
[34] G. Laufer, T. M. Quagliaroli, R. H. Krauss, R. B. Whitehurst, and J. C. McDaniel, “Planar OH Density and Apparent Temperature Measurements in a Supersonic Combusting Flow”, AIAA Journal, 34, 463-469 (1996).
[35] G. Gauba, K. G. Klavuhn, J. C. McDaniel, K. G. Victor, R. H. Krauss, and R.B. Whitehurst, “OH Planar Laser-Induced Fluorescence Velocity Measurements in a Supersonic Combustor”, AIAA Journal, 35, 678-686 (1997).
[36] O. Jarrett, Jr., A. D. Cutler, R. R. Antcliff, T. Chitsomboon, C. L. Dancey, and J. A. Wang, “Measurements of Temperature, Density, and Velocity in Supersonic Reacting Flow for CFD Code Validation”, 25th JANNAF Combustion Meeting, Huntsville Alabama, Oct. 24-28, 1988.
[37] H. Weisgerber, R. Martinuzzi, U. Brummund, and P. Magre, “PIV Measurements in a Mach 2 Hydrogen-air Supersonic Combustion,” AIAA Paper 2001-1757, April, 2001.
[38] C. P. Goyne, , C. G. Rodriguez, R. H. Krauss, J. C. McDaniel, and C. R. McClinton, “Experimental and Numerical Study of a Dual-Mode Scramjet Combustor”, Journal of Propulsion and Power, 22, 481 – 489 (2006).
[39] C. T. Smith and C. P. Goyne, “Three-component Velocimetry in a Scramjet Combustor”, 44th AIAA/ASME/SAE/ASEE Joint Propulsion Conference and Exhibit, Hartford, CT, July 21-23, 2008.
[40] S. Schlamp, T. Rosgen, D. N. Kozlov, C. Rakut, P. Kasal, and J. von Woldersdorf, “Transient Grating Spectroscopy in a Hot Turbulent Compressible Free Jet”, Journal of Propulsion and Power, 21, 1008-1018 (2005).
[41] L. Y. Jiang, and J. P. Sislian, “Rayleigh Scattering in Supersonic high-temperature exhaust plumes”, Experiments in Fluids, 32, 487-493 (2002).
[42] M. A. Bolshov, Y. A. Kuritsyn, V. V. Liger, V. R. Mironenko, S. B. Leonov, D. A. Yarantsov, “Measurements of Gas Parameters in Plasma-Assisted Supersonic Combustion Processes Using Diode Laser Spectroscopy”, Quantum Electronics, 39, 869-878 (2009).
[43] C. D. Lindstrom, K. R. Jackson, S. Williams, R. Givens, W. F. Bailey, C. Tam, W. F. Terry, “Shock-Train Structure Resolved with Absorption Spectroscopy Part: 1 System Design and Validation”, AIAA Journal, 47, 2368-2378 (2009).
[44] G. B. Rieker, J. B. Jeffries, and R. K. Hanson, “Calibration-free Wavelength-Modulation Spectroscopy for Measurements of Gas Temperature and Concentration in Harsh Environments”, Applied Optics, 48, 5546-5560 (2009).

37
[45] R. W. Pitz, N. R. Grady, S. W. Shopoff, S. Hu, C. D. Carter, “UV Raman Scattering Measurements of a Mach 2 Reacting Flow over a Piloted Cavity”, 46th AIAA Aerospace Sciences Meeting and Exhibit, Jan. 7-10, Reno, NV, 2008.
[46] S. Yang, J. Zhao, C. Sung, and G. Yu, “Multiplex CARS Measurements in Supersonic H2/air Combustion”, Applied Physics B, 68, 257-265 (1999).
[47] K. A. Vereschagin, V. V. Smirov, O. M. Stelmakh, V. I. Fabellinsky, V. A. Sabelnikov, V. V. Inanov, W. Clauss, M. Oschwald, “Temperature Measurements by Coherent Anti-Stokes Raman Spectroscopy in Hydrogen-Fuelled Scramjet Combustion”, Aerosp. Sci. Technol., 5, 347-355 (2001).
[48] A. D. Cutler, G. S. Diskin, P. M. Danehy, and J. P. Drummond, “Fundamental Mixing and Combustion Experiments for Propelled Hypersonic Flight”, 38th Joint Propulsion Conference and Exhibit, Indianapolis, IN, 7-10 July, 2002.
[49] M. W. Smith, O. Jarrett, Jr., R. R. Antcliff, G. B. Northam, A. D. Cutler, and D. J. Taylor, “Coherent Anti-Stokes Raman Spectroscopy Temperature Measurements in a Hydrogen-Fueled Supersonic Combustor”, Journal of Propulsion and Power, 9, 163-168 (1993).
[50] A. D. Cutler, P. M. Danehy, R. R. Springer, S. O’Byrne, D. P. Capriotti, and R. DeLoach, “Coherent Anti-Stokes Raman Spectroscopic Thermometry in Supersonic Combustor”, AIAA Journal, 41, 2451-2459 (2003).
[51] S. A. Tedder, S. O’Byrne, P. M. Danehy, and A. D. Cutler, “CARS Temperature and Species Concentration Measurements in a Supersonic Combustor with Normal Injection”, Reno, NV. , Jan. 10-13, 2005.
[52] A. C. Eckbreth, Laser Diagnostics for Combustion Temperature and Species, 2nd Ed., Gordon and Breach Pub., 1996.
[53] G. L. Eesley, Coherent Raman Spectroscopy, Pergamon Press, 1981. [54] W. T. Silfvast, Laser Fundamentals, 2nd Ed., Cambridge University Press, 2003. [55] R. E. Teets, "CARS signals: phase matching, transverse modes, and optical damage
effects," Appl. Opt. 25, 855-862 (1986) [56] R. E. Palmer, “The CARSFT Computer Code for Calculating Coherent Anti-Stokes
Raman Spectra: User and Programmer Information”, Sandia National Laboratories Report SAND89-8206, Livermore, California (1989).
[57] G. Herzberg, Molecular Spectra and Molecular Structure, Second Edition, D. Van Nostrand Company, Inc., 1950.
[58] F. Y. Yueh and E. J. Beiting, "Simultaneous N2, CO, and H2 multiplex CARS measurements in combustion environments using a signal dye laser", Applied Optics, 27, 3233-3243 (1988).
[59] D. V. Flores, "Analysis of Lean Premixed Turbulent Combustion Using Coherent Anti-Stokes Raman Spectroscopy Temperature Measurements" PhD dissertation, Chemical Engineering Department, Brigham Young University, 2003.
[60] M. C. Weikl, T. Seeger, R. Hierold, and A. Leipertz, “Dual-pump CARS measurements of N2, H2, and CO in a partially premixed flame”, J. Raman Spectros., 38, 983-988 (2007).
[61] F. Beyrau, T. Seeger, A. Malarski, and A. Leipertz, “Determination of temperatures and fuel/air ratios in an ethane-air flame by dual-pump CARS”, J. Raman Spectros., 34, 946-951 (2003).

38
[62] S. P. Kearney, K. Frederickson, and T. W. Grasser, "Dual-pump coherent anti-Stokes Raman scattering thermometry in a sooting turbulent pool fire" Proceedings of the Combustion Institute. 32, 871-878 (2009).
[63] F. Beyrau, A. Datta, T. Seeger, and A. Leipertz, "Dual-pump CARS for the simultaneous detection of N2, O2 and CO in CH4 flames" J. of Raman Spec. 33, 919-924 (2002).
[64] A. C. Eckbreth, T. J. Anderson, and G. M. Dobbs, “Multi-Color CARS for Hydrogen-Fueled Scramjet Applications”, Appl. Phys. B, 45, 215-223 (1988).
[65] S. Roy, T. R. Meyer, M. S. Brown, V. N. Velur, R. P. Lucht, and J. R. Gord, “Triple-pump CARS: temperature and multiple species concentration measurements in reacting flows”, Optics Communications, 224, 131-137 (2003).
[66] F. Vestin, Development of dual-broadband rotational CARS for applied flame diagnostics”, Doctoral Thesis, Lund University, Sweden, 2008.
[67] A. C. Eckbreth, T. J. Anderson, “Dual-broadband CARS for simultaneous, multiple species measurements”, Applied Optics, 24, 2731-2736 (1985).
[68] P. Bengtsson, L. Martinsson, and M. Alden, “Combined Vibrational and Rotational CARS for Simultaneous Measurements of Temperature and Concentrations of Fuel, Oxygen, and Nitrogen”, Applied Spectroscopy, 49, 188-191 (1995).
[69] S. Roy, T. R. Meyer, R. P. Lucht, M. Afzelius, P. Bengtsson, and J. R. Gord, “Dual-pump dual-broadband coherent anti-Stokes Raman scattering in reacting flows”, Optics Letters, 29, 1843-1845 (2004).
[70] M. C. Weikl, Y. Cong, T. Seeger, and A. Leipertz, “Development of a simplified dual-pump dual-broadband coherent anti-Stokes Raman scattering system”, Applied Optics, 48, 43-50 (2009).
[71] R. P. Lucht, “Three-laser coherent anti-Stokes Raman scattering measurements of two species”, Optics Letters, 12, 78-80 (1987).
[72] C. G. Rodriguez and A. D. Cutler, “Computational Simulation of a Supersonic-Combustion Benchmark Experiment”, 41st AIAA/ASME/SAE/ASEE Joint Propulsion Conference and Exhibit, 10-13, July, 2005.
[73] D. Bivolaru, P. M. Danehy, K. D. Grinstead, S. A. Tedder, A. D. Cutler, “Simultaneous CARS and Interferometric Rayleigh Scattering,” AIAA Aerodynamic Measurement Technology and Ground Testing Conference, AIAA-2006-2968, San Francisco, June 2006.

39
CHAPTER 2
Laboratory-Scale Supersonic Combustion Free-Jet Measurements with Dual-Pump CARS
2.1 Introduction Measurements of the flow parameters of turbulent supersonic combustion must be
made to provide quantitative data for turbulence model development and code validation.
The flow parameters’ mean values, variances, and covariances are desired because the
combination of these quantities characterizes the flow and turbulence in the flow. These
measurements can be used to validate existing supersonic combustion models and aid in
developing new ones. To make these measurements, a dual-pump broadband coherent
anti-Stokes Raman spectroscopy (CARS) system was combined with an interferometric
Rayleigh scattering (IRS) system. The combined CARS-IRS system, first described in
Ref. [1], was developed to study H2-fueled supersonic combustion free-jet flows. The
CARS-IRS system can provide spatially and temporally resolved simultaneous
measurements of temperature, multiple absolute species concentrations (N2, O2 and H2),
and multiple components of velocity.

40
To use the CARS-IRS system to make a benchmark set of measurements, a flow
facility was designed to generate a supersonic combustion flow easy to characterize and
model. In pursuit of these goals, the flow was designed to be an axi-symmetric free-jet.
While this free jet flow is not ducted as a scramjet would be, it captures the most
important fluid physics (turbulence, fuel-air mixing, chemical reactions, compressibility
effects, etc.) and offers suitable optical access for the measurement techniques.
Two different sets of flow facility hardware were constructed: a full-scale version to
be used in NASA Langley’s Direct Connect Supersonic Combustion Test Facility and a
1/6.35 laboratory-scale version [2]. The purpose of the laboratory-scale apparatus is both
to verify the operability of the jet design and to validate the capability of the
measurement techniques in a low-cost laboratory setting. Some of the fluid dynamical
length scales of the flow are too small to be resolved by the CARS measurement volume,
which is an elongated ellipsoid that is ~ 1.5 mm in length. Therefore, a larger-scale
experiment is needed to better resolve the spatial scales of the flow with the CARS-IRS
system and generate benchmark data sets for CFD modelers.
To verify the performance of the CAR-IRS system in a noisy environment,
measurements were taken in the laboratory-scale supersonic combustion jet flow. This
chapter will describe only the CARS system and measurements taken in the laboratory-
scale jet. Details of the IRS technique, its combination with CARS, and measurements in
the laboratory-scale jet can be found in Ref. [3]. Further preparation for the large-scale
experiment included measurements in a near-adiabatic, laminar flat flame Hencken
burner. This high-temperature source provides a steady, known (easily calculable)
temperature and species concentration, and a near-zero flow velocity, allowing for

41
determination of accuracy and precision of the system. CARS results from these
Hencken burner measurements will be presented in this chapter.
2.2 Experimental Setup
2.2.1 Supersonic Flow Facility
Figure 2.1, from Ref. [2], shows the axi-symmetric laboratory-scale supersonic
burner assembly, sectioned along the axis, which generates the supersonic reacting jet to
be measured. The assembly consists of a combustion chamber and a central convergent-
divergent nozzle with an exit diameter of 10 mm. The central nozzle delivers vitiated air.
Vitiated air is created by reacting air, H2, and O2 (to increase the mass fraction of oxygen
to 23%). Combustion raises the temperature of the gas to simulate the enthalpy of a high
Mach number (hypersonic flight at Mach 7 for this experiment). The nozzle is designed
to accelerate the vitiated air to Mach 1.6 at the nozzle exit. Unheated H2 fuel is
accelerated through a convergent nozzle, co-axial to the central nozzle, with an exit width
of 1 mm. This co-axial jet is referred to as the co-flow. The inner and outer diameter of
the central nozzle separates the central jet flow and co-flow by 3 mm at the exit. Further
downstream, the central jet flow and co-flow mix and combust. During measurement
with the CARS-IRS system the burner is run continuously. The burner was placed on
slides driven by stepper motors to move the measurement volume across the flow.
Further details of this laboratory-scale burner and its design can be found in Ref. [2].

42
Figure 2.1: Cross-sectional drawing of the flow facility that creates the supersonic combustion free jet (Courtesy of A. D. Cutler and G. Magnotti).
2.2.2 CARS System
For the measurement of temperature and the absolute mole fractions of N2, O2, and
H2 the same dual-pump broadband CARS method is used as described in Refs. [3], [4],
[5], and [7]. Dual-pump broadband CARS allows species with Raman transitions in two
spectral regions to be overlapped and so increases the number of species measured at
once. The CARS system used for these measurements, uses a spectrally-narrow injection

43
seeded Nd:YAG at 532 nm (green), pulsed at 20 Hz for 10 ns. The Nd:YAG laser emits
850 mJ/pulse which is split in three beams. Approximately 350 mJ of the energy is used
for the CARS green pump beam and for IRS. Another 250 mJ is used for pumping a
broadband dye laser, with the wavelength centered at 604 nm (red) that uses Rhodamine
640 laser dye diluted in methanol. The rest of the Nd:YAG laser energy is used to pump
the tunable narrowband dye laser centered at 552.75 nm (yellow). The beam energies for
generating the CARS signal at the measurement volume varied during experiments in a
range from 80 to 85 mJ/pulse for the green, 1 to 8 mJ/pulse for the red, and 5 to 15
mJ/pulse for the yellow laser beam.
The broadband dye laser has a full width at half maximum (FWHM) of ~7 nm. This
broadband dye laser was built according to the description in Ref. [8] to decrease the
variability of the amplitude of the resonant cavity modes in the spectral profile. Lasers
built in this way are commonly referred to as modeless and have been shown to increase
the precision of the CARS instrument [9], [10]. The major difference between the
construction of a modeless dye laser and a conventional dye laser is the lack of an output
coupler (for a discussion of lasers and their components see Section 5.1.1 and 5.1.2). The
removal of an output coupler reduces the competition of modes created by the oscillator
laser cavity.
The beams are combined at the focusing point of a spherical lens (focal length of 410
mm) in a folded BOXCARS geometry [11], generating a probe volume estimated to be
1.5 mm × 0.2 mm × 0.2 mm. The crossing of the laser beams at the measurement volume
in the flow of the facility can be seen in the image in Fig. 2.2, from Ref. [2].

44
Figure 2.2: Image of CARS laser beams crossing at measurement volume over the flow facility of the laboratory-scale supersonic free jet.
The frequency difference between the green and red beams corresponds to the
vibrational Raman transition of N2. The frequency of the yellow pump beam is chosen so
that the frequency difference between the yellow and red beams equals the vibrational
Raman transition of O2. Pure-rotational H2 Raman transitions from the S branch (change
in rotational quantum number +2) are also present in both spectral regions. The input
beams plus the coherent blue signal beam centered at 491 nm are collected and
collimated by another spherical lens, after which the pumps and Stokes beams are
blocked with a beam dump. The signal beam then passes through an interference filter
that rejects stray light. Next, the signal beam is focused at the input slit of a one-meter

45
spectrometer by two cylindrical lenses, with the focus oriented in the vertical and then
horizontal direction. The CARS signal is dispersed by a spectrometer with a 2400
groove/mm grating and recorded by a CCD camera (Princeton Instruments PIXIS-100B
with an area of 1340 × 100 pixels). The CARS signal is collected on the middle third of
the pixels in the vertical direction. The top and bottom thirds of the CCD were used to
collect background light.
The background is subtracted from the CARS signal to correct for camera dark noise
and other light not originating from the CARS signal. The background corrected
spectrum is then divided by a fit of an averaged nonresonant spectrum to correct for the
shape of the broadband dye laser’s spectral profile. The broadband dye’s laser spectral
profile determines the probing energy per wave number and therefore the relative
intensity per wave number of each collected CARS spectrum. The broadband dye lasers
contribution to the CARS spectrum, referred to as a nonresonant spectrum, is collected at
the beginning or at the end of a data set by filling the measurement volume with a
flowing nonresonant gas (argon) to remove resonant species. The broadband dye laser
shot-to-shot changes in spectral profile shape and intensity is not accounted for in the
data processing. Because these variations in the spectral profile can lead to errors in
single shot measurement, a dye laser designed to have reduced variations (modeless) was
used. Over several hours of data collection, the broadband dye laser frequency can drift
significantly so a fitting procedure is used to account for this change per run [3]. After
these initial preprocessing steps, the spectrum is compared with a theoretical model to
determine the temperature and mole fractions.

46
An instrument function is required to compute the theoretical model for comparison
with data. The instrument function accounts for the broadening of the spectrum due to
various instrument effects including the shape of the broadband dye laser. The
instrument function is found by fitting a CARS spectrum obtained in room air, at
standard temperature and pressure, using a dual-Gaussian function as the instrument
function’s line shape. Then, the instrument function and other values describing the
system are used to create a library of theoretical spectra generated by a modified version
of the CARSFT code [5] originally written by Sandia National Laboratories [12]. The
library has entries every 200 K and a range of species mole fractions with finer grid
points in the lower value ranges. The fitting algorithm interpolates theoretical spectra
between the temperature/composition grid points in the library and the result with the
smallest residual in comparison with the experimental spectrum is selected. The spectral
response from the N2 is predominantly used to determine the temperature because it is
present in the most locations of the combustion flow studied. For further details of the
analysis method see Ref. [4].
2.3 Results and Discussion
2.3.1 CARS Instrument Characterization
A series of measurements to determine the accuracy and precision of the CARS
instrument were performed using a Hencken burner flame. This burner provides a
relatively uniform and well-understood environment in which to measure temperature
and species concentration. This type of burner has also been used by Hancock et al. [13]
and others for characterization of CARS systems. In each of these characterizations, data

47
are compared to adiabatic equilibrium calculations of the flame constituents. An attempt
was made to perform the CARS measurements in a region of the flame where the flow is
laminar and has reached chemical equilibrium, to allow noise from the instrument to be
distinguished from variations in the flow properties. Measurements were taken over a
range of fuel-to-air ratios (equivalence ratios) to test the accuracy of CARS at a range of
temperatures and mole fractions. To assess the accuracy of the CARS measurements,
computed values of temperature and composition were compared to mean values of 400
CARS single-shot measurements. One standard deviation is used as a benchmark for the
measurement of the instrument’s precision.
In Fig. 2.3 (a) the measured temperatures, shown as circles, are compared to
theoretical temperatures, shown by a solid line, measured at a range of equivalence ratios.
Figure 2.3 (b)-(d) show theoretical mole fractions versus measured mole fractions for N2,
O2, and H2 at the same range of equivalence ratios. The CARS measurements in Fig. 2.3
(a), (b), (c), and (d) are shown in different colors to represent matching testing conditions
(equivalence ratios). The error bars in Fig. 2.3 (a)-(d) represent ± 1 standard deviation of
the 400 acquisitions taken at each equivalence ratio. Dashed lines represent percentage
difference from the theory as labeled.
The standard deviation of temperature increases with temperature from ~20 K at
room temperature to ~50-60 K for temperatures ~ 2100 K. The standard deviation
increases to ~90-130 K for temperatures greater than 2100 K. The relative standard
deviation or percentage standard deviation, calculated by dividing the standard deviation
by the mean value of temperature, decreases with temperature up to ~ 1500 K, as seen in
diamonds in Fig. 2.4. This means that the measurement of temperature is more precise

48
for higher temperatures in relation to their mean value. This occurs because as the
temperature increases a second N2 vibrational band (v=1 2) near 2290 cm-1 increases
in population providing a more temperature-sensitive shape to fit. The increase in the N2
v=1 2 band with increasing temperature can be seen in the spectra in Fig. 2.5 from a)
to b). The spectra shown in Fig. 2.5 are single-shot spectra taken in a Hencken burner for
two different equivalence ratios. Also seen in Fig. 2.5 from a) to b), is the decrease
signal-to-noise ratio caused by a decrease in the overall CARS signal intensity with
increasing temperature. The decrease in signal limits the improvement of the relative
Figure 2.3: Measurements in a H2-air laminar flame obtained in the Hencken burner for a range of equivalence ratios (fuel to oxidizer ratios). Theoretical values are plotted versus CARS measurement values. Temperatures are plotted in (a) and mole fractions are plotted in (b), (c), and (d). The colors represent data taken at matching equivalence ratios.

49
Figure 2.4: Percentage standard deviation (relative standard deviation) versus temperature. standard deviation and explains why at temperatures higher than ~1500 K the
development of the N2 hot band no longer improves the relative standard deviation.
The measurements at an equivalence ratio of 1.0 (~2300 K) and 1.5 (~2200 K) do
not follow the precision trends of the rest of the data set and show a higher relative
standard deviation. These incongruous data points can be explained by an error in the
library interpolation procedure. At an equivalence ratio of 1.5, almost half of the 400
acquisitions fit to a temperature near 2000 K and the other half fit to a temperature near
2300 K with only a few fitting to values in-between. Figure 2.6 shows this bimodal
behavior at the equivalence ratio of 1.5 in a histogram compared to an expected, single
peaked, histogram from an equivalence ratio of 1.8. At an equivalence ratio of 1.0 there
is a similar bifurcation, which is somewhat more subtle. These bifurcations of the
temperature measurements are unphysical. The source of the unphysical bifurcations was

50
determined to be an anomaly of the library searching and interpolation spectral fitting
technique. The data for which the fitting technique was originally designed in Ref. [7]
showed no bimodal behavior. This behavior that may have arisen as a result of fitting the
lower signal-to-noise ratio spectra collected in this experiment compared to those
Figure 2.5: Single shot CARS spectra in a H2-air laminar flame at different equivalence ratios (Φ), a) Φ=0.3, b) Φ=1.8.

51
Figure 2.6: Histogram of CARS temperatures demonstrating bifurcation in the fitted measurments. Filled bars show expected spread of results for measurements taken in a Hencken Burner flame at equivalence ratio of 1.80. Open bars show bimodal nature of 400 consecutive single-shot measurements taken in Hencken burner at equivalence ratio 1.5. collected in Ref. [7].
Comparing spectra from this experiment, as in Fig. 2.5, to spectra taken by a similar
CARS system, shown in Ref. [7], the spectral resolution has increased. The increase in
spectral resolution is because of the use of a grating in a one meter spectrometer with
twice the grooves per mm. The spectra from this experiment show better resolved
rotational lines in the peaks corresponding to N2 and O2. This increase in resolution
should lead to an increase in accuracy for temperatures where the hot band of the N2

52
spectrum is not sufficiently populated (<1000 K). Unfortunately, this cannot be verified
as Ref. [7] made no measurements at these temperatures. In general, the accuracy of the
temperatures in the experiment described in this chapter is lower than in Ref. [7]. This
decrease in accuracy can be attributed to the low signal-to-noise ratio of this data set.
This low signal-to-noise ratio is caused by the low probing energy of the broadband dye
laser and the use of a higher resolution grating which spread the signal counts over more
camera pixels. The temperature accuracy, defined by the average percentage difference
of measured temperature from theoretical temperature, is 2.6%.
Further comparing these Hencken burner results with results presented in Ref. [7],
the temperatures in the current work are more precise for temperature less than ~2000 K.
Fig. 2.4 shows the relative standard deviation from Ref. [7] in square symbols. An
explanation for increased precision is the increased resolution which provides more
information about the population distribution. The more information in the spectra on the
population distribution, the more there is a distinction between spectra of different
temperatures. Better distinction between temperatures leads to an increased precision.
Another possible reason for increased precision is the modeless broadband dye laser.
This laser was designed to have a smoother spectral profile and reduced shot-to-shot
intensity fluctuations compared to the conventional broadband dye laser used in Ref. [7].
A comparison between the variability in percentage standard deviation for a modeless
and a conventional dye laser built as described in Chapter 3, with the same dye mixture is
shown in Fig. 2.7. The decrease in variability of the modeless dye laser led to the
increase in precision for temperatures less than ~ 2000 K and should have increased the
precision for all temperatures. However, in this experiment, for temperatures greater

53
Figure 2.7: Percentage standard deviation of the “modeless” broadband laser spectral profile used in this experiment versus wavelength. For comparison a conventional (not modeless) broadband dye laser’s percentage standard deviation is shown in green circles. Wavelengths of the laser which excite (probe) the nitrogen and the oxygen vibrational bands, and the H2 rotational lines are indicated. Note that the nitrogen band is not the same wavelength at which the percentage standard deviation is minimized. than ~2000 K, the temperatures are less precise than in Ref. [7]. The decrease in
precision from the system used in Ref. [7] can be explained by the fitting anomaly
discussed in the previous paragraph and the decrease in the broadband dye laser energy.
Less energy in the broadband dye laser decreases the signal- to-noise ratio which has
increased effect at higher temperatures when the signal level is lower.
Although the broadband dye laser showed reduced frequency variability, similar to
other modeless dye lasers, the anticipated improvement in precision of temperature down
to relative standard deviations of <2% in the range of 1000 K to 2000 K, as described in

54
Refs. [9] and [10] were never achieved. The lowest relative standard deviation reached in
this experiment was ~3% at from 1500 K to 2000 K, as seen in Fig. 2.4. This is because
the N2 spectrum, which is the dominant spectrum from which temperature is determined,
was not placed at the location of the lowest frequency variability of the laser, as seen in
Fig. 2.7. Instead, the N2 spectrum was placed towards the edge of the broadband laser
spectrum to allow collection of all spectral lines from O2 and H2. In retrospect, it is
possible that if the N2 spectrum had been placed at the location of minimum variability in
laser fluctuation that the expected precision improvements of temperature may have been
realized. But this placement would have led to reduction of the signal-to-noise of one of
the H2 lines and the O2 spectrum.
All mole fraction results are less accurate that those reported in Ref. [7]. A possible
cause of inaccuracy in all measurements (temperature and composition) is the method
used to determine the change or shift in the broadband dye laser frequency. During the
course of an experiment the shape and or location of the broadband dye laser will drift.
Correct removal of this laser’s spectral shape, collected as a nonresonant spectrum, from
the measured resonant spectrum is required for accurate results. The method used for this
experiment to correct for the drift in the spectra employs a fitting algorithm, detailed in
Ref. [3]. This method is subject to error and will sometimes shift the nonresonant
spectra, even if the CARS spectrum is taken immediately after the nonresonant is
collected, allowing no time for drift. While Ref. [3] reported no error from using this
method, changes to the CARS system, such as a decreased signal-to-noise, may have
decreased the accuracy of this method. This method may account for inaccuracy in the
results, especially the mole fractions. A method to determine the broadband dye laser’s

55
contribution to the CARS spectrum that relies on a measurement of the drift of the
spectrum instead of a fitted estimate would be more robust and could increase accuracy
of all measured values.
Another possible cause of inaccuracy and precision in all of the measurements is the
low signal-to-noise ratio caused by the low energy efficiency of the broadband dye laser.
The overall low signal-to-noise ratio has the greatest effect on accuracy and precision
when the CARS signal already is low for other reasons. Other reasons for low CARS
signal is high temperatures and low mole fractions of resonant species. Figure 2.4 shows
a decrease in accuracy and precision at these conditions.
Most N2 mole fractions shown in Fig. 2.3 (b) are inaccurate by more than 5%. The
average standard deviation of the N2 mole fractions is 0.03 or 5% of the measurement. In
Fig. 2.3 (c), for mole fractions greater that 0.1 the O2 mole fractions are typically higher
than the theory by ~ 0.03. As the O2 mole fraction decreases, the measurements become
increasingly inaccurate because of the decrease in signal-to-noise ratio. This increased
inaccuracy caused by low signal-to-noise occurs at a higher mole fraction than in Ref.
[7]. This occurs because the broadband dye laser has a lower energy output than the one
used in Ref. [7].
O2 mole fractions that should be zero, fitted to values that are well below zero. This
is an unphysical result generated by the method of data analysis which allows for fitting
below zero. This is allowed by design to combat bias from instrument error when the
mole fraction of a species is zero. Although this is useful in certain cases it allows for
extrapolation extending far beyond physically possible values, thus increasing error when
no signal is present or the signal-to-noise ratio is low. The 0.05 standard deviation for O2

56
mole fraction is much larger than the others because of a bifurcation of O2 mole fraction
caused by an error in the fitting method, as previously discussed for temperature. The
average standard deviation for the rest of the O2 mole fractions (not including
measurements of zero) is 0.02 or 8.5% of each measurement.
In Fig. 2.3 (d) the average standard deviation of H2 mole fractions for measured
values greater than one is 0.015 or 12.5% of each measurement. The H2 mole fractions
(for mole fractions greater than one) are consistently low by ~0.06 (~30%) on average. A
previous version of this CARS system described in Ref. [7], also reported consistently
low H2 measurements, but only by 10-15%. This error in H2 concentration fits for both
experiments is believed to be due to an error in the spectral modeling of the H2
linewidths, which affect the intensities, in the data analysis program CARSFT. The
decrease in accuracy for these measurements is probably caused by the 30% decrease in
the FWHM of the nonresonant spectrum produced by the broadband dye laser. Very
little energy probes the edges of the broadband spectrum, resulting in low signal intensity
in the vicinity of the H2 lines. During data processing the resonant spectrum is divided
by the nonresonant spectrum. The edge of the nonresonant spectrum, which is low in
intensity, amplifies the noise due to division, as can be seen in Fig. 2.5. The most
populated H2 lines, S(5) and S(6), are located at exactly this position, leading to a lower
accuracy for hydrogen concentration measurement. This increased noise is near the edge
of the N2 spectrum, as seen in Fig. 2.5 (b), and could be a reason for the inaccurate N2
mole fractions seen in Fig. 2.3 (b). The increased noise may have other consequences as
well, since the fitting method simultaneously solves for all variables. For example, the
accuracy of the other species mole fractions may be decreased because of an inaccurate

57
fitting of the H2 mole fraction. Also since the ratio of the population of the rotational
energy levels of H2 S(5) and H2 S(6) change with temperature, an inaccurate fitting of the
lines would lead to inaccurate temperatures.
2.3.2 Supersonic Reacting Jet
Measurements to demonstrate the capability of the system were performed on the
laboratory-scale version of the supersonic reacting jet. These experiments provided a
challenging noisy and turbulent environment, with a noise level up to 140 dB at 2 m
away from the test jet. Data sets of 1000 consecutive spectra are used for this evaluation.
Figure 2.8 is a comparison of measurements of temperatures at z = 70 mm downstream of
Figure 2.8: Histogram of CARS temperatures. Results are from the supersonic burner at different locations from the centerline, 70 mm downstream of the nozzle exit.

58
the nozzle exit. Temperatures at the center of the jet are shown in blue histogram bins.
The center jet measurements are less scattered compared to temperatures measured 12
mm off-axis from the center of the jet (filled black bins) where mixing of cold ambient
air and hot vitiated air, as well as combustion, is occurring. This figure demonstrates the
capability of the system to quantify the turbulence of flow showing a larger spread of
temperature in the turbulent location (12 mm from center) than in the quiescent location
(center) in the flow. The histogram has bins of 100 K to reflect the lowest precision of
the CARS instrument determined in the Hencken burner.
Figure 2.9 shows measurements of temperature and mole fractions of a scan through
the flow in the radial direction, 2 mm downstream of the nozzle exit. Below the CARS
Figure 2.9: CARS species concentrations and temperature measurements from a scan across the supersonic combustion flow, 2 mm from the exit plane. Below the measurements is a representation of the cross section geometry of the burner exit plane, showing the center jet and co-flow nozzles locations. Note the missing measurements from ~-8 to -5 mm and 5 to 8 mm.

59
Figure 2.10: A single-shot spectra taken in the supersonic burner in a region of the flow containing only hydrogen fuel. This spectrum exemplifies the inability of the fitting algorithm to resolve a CARS spectra containing only one rotational hydrogen line. Note the unphysical oxygen mole fraction of 0.40 (more than in air or vitiated air). data is a representation of the locations of the nozzle cross sections and the flow injection
locations. The scan begins in the ambient air 12 mm from the center of the jet (-12 mm)
were the CARS measurements show ~ 0.8 N2 and ~ 0.2 O2 mole fractions and ~ 300 K in
temperature. As the scan approaches ~ 8 mm (or -8 mm) from the center, the N2 and O2
mole fractions decrease while the H2 mole fraction and temperature increases, indicating
a mixing of ambient air and H2 fuel. The measured temperatures reach flame
temperature, ~2500K, indicating a burning of the H2 fuel.
In the region from ~ -8 mm to -5 mm, where there is no CARS data shown in Fig.
2.9. Spectra were acquired in this region but unphysical temperatures (>3000 K) and/or
unphysical O2 mole fraction (0.40) resulted from the fits. Contrary to the fitting results,
the CARS spectra contained only one spectral line, H2 S(5), as seen in Fig. 2.10. The
presence of only the H2 S(5) spectral line indicates this region of the scan contains mostly

60
H2 (and possibly nonresonant species) at a temperature lower than ~500 K (see Chapter 6
for more information on this problem and its solution). The reason that the CARS spectra
could not be accurately fit is explained in the following paragraph.
Raman rotational populations and therefore resonant spectral line intensities, change
with both temperature and mole fraction. When fitting CARS spectra, both temperature
and mole fraction are unknowns. Therefore, an unsolvable problem is created when there
are two unknown variables and only one defining data point: in this case the height of the
H2 S(5) line. When the fitting method attempts to fit such a CARS spectrum, it
extrapolates beyond the bounds of the calculated library and fits to noise, as shown by the
solid black line in Fig. 2.10. CARS spectra containing only the H2 S(5) line occurs for
this CARS system when all other resonant species are absent in the probe volume and the
temperature is too low for the H2 S(6) to be populated enough to generate a CARS signal.
If the H2 S(6) line, or N2 or O2 was present in the spectrum the fit would have yielded
sensible results. Without these accompanying spectra, temperature and species could not
be determined. Consequently, data was removed when the only spectral line present was
the H2 S(5), because there was not enough information in the CARS spectra for the fitting
program to determine the unknown variables.
As the scan continues towards the center of the jet, just before -5 mm, the CARS
system returns sensible results again. For a very short region the mole fractions indicate
a mixing of H2 and vitiated air. In this region, the temperatures (500 K- 1000 K) indicate
no burning of fuel (the vitiated center jet has a temperature of about 1000 K). After this
small mixing region, as the scan progresses towards the center of the burner, the mole
fractions H2 are zero, as expected, and confirming that the H2 fuel added to vitiate the air

61
is completely burnt. The N2 mole fraction measured in the center of the jet is lower than
in ambient air, while the O2 mole fraction is about the same as ambient, indicating the
remaining gas mole fraction to be nonresonant species (mostly water). This is expected
since this region is directly over the vitiated air jet which contains water as a product of
the combustion used to heat the center-jet test gas. The temperatures in this region
parabolically increase to peak at the center of the jet. The measurement in the rest of the
scan from the center (0 mm) to 12 mm is a mirror image of the scan from -12 mm to 0
mm, reflecting the axi-symmetric nature of the flow.
2.4 Conclusions and Recommendations An assessment of the accuracy and precision of the system was obtained by taking
measurements in a Hencken burner. Causes of inaccuracies and low precision were
indentified. The low energy output of the broadband dye laser caused low signal-to-
noise, decreasing the accuracy and precision of all the measurements. The nonresonant
spectral width, defined by the broadband dye laser, was smaller than desired and
generated low signal-to-noise data at the edges of the CARS spectra. This low signal-to-
noise decreased the accuracy of the H2 species mole fraction and, in turn, all
measurements. Before applying the CARS system to the full-scale flow, the width of the
laser and energy output should be (and was, in chapter 3) increased to decrease the noise.
Several errors in the fitting algorithms were identified which led to a decrease in accuracy
and precision of some of the CARS measurements. A new method of fitting spectra must
be explored to improve the accuracy and precision of the system. The method of
determining the drift in frequency of the nonresonant spectrum may be a cause of

62
inaccuracies in the results. Because the nonresonant spectrum can change with time,
more frequent measurements of its shape and a new modeling is proposed. This is
addressed in Chapter 3.
The use of the modeless dye laser only minimally improved or did not improve the
temperature precision. The attribute of modeless dye lasers that improves the precision,
reduced spectral intensity variations, only occurred in a limited spectral range of the
broadband dye laser. A multi-species CARS system, like the one described in this
chapter, require the use of a larger spectral range and therefore this system only received
a limited benefit from this modeless dye laser. Because of the limited precision
improvement offered by the modeless dye laser and reduced energy output, this type of
laser design was abandoned for the multi-species CARS systems used for these
experiments.
Results from the laboratory-scale reacting jet demonstrate that the system is capable
of making measurements in supersonic combustion flows and can resolve large-scale
variations in the turbulent flow field. Raman rotational transitions S(5) and S(6) are used
to probe H2. When no N2 or O2 is present (for example in the pure-H2 co-flow of the jet)
and the H2 S(6) line has very low signal intensity (or is not present) because the gas
temperature is <500 K, it is not possible to accurately determine either temperature or
concentration from these lines. A possible solution to this problem is to develop a
measurement system that probes additional lower rotational quantum number H2
transitions. Another solution would be to add a small amount (for example, several
percent) of N2 to the H2 co-flow. Temperatures could be determined from the N2 spectra
and then H2 concentrations could be determined from the intensity of the H2 S(5) line. In

63
summary, all these issues discovered in this chapter are investigated and addressed in the
chapters that follow.

64
REFERENCES
[1] D. Bivolaru, P. M. Danehy, K. D. Grinstead, S. A. Tedder, and A. D. Cutler, “Simultaneous CARS and Interferometric Rayleigh Scattering,” AIAA Aerodynamic Measurement Technology and Ground Testing Conference, AIAA-2006-2968, San Francisco, June 2006.
[2] A. D. Cutler, G. Magnotti, R. Baurle, D. Bivolaru, S. A. Tedder, and P. M. Danehy,, “Development of Supersonic Combustion Experiments for CFD Modeling ” AIAA Paper 2007-0000, 45th AIAA Aerospace Sciences Meeting and Exhibit, Reno, Nevada, Jan., 2007.
[3] S. A. Tedder, D, Bivolaru, P. M. Danehy, M. C. Weikl, F. Beyrau, T. Seeger, and A. D. Cutler, “Characterization of a Combined CARS and Interferometric Rayleigh Scattering System”, AIAA-2007-0871, Reno, NV, Jan. 2007.
[4] P. M. Danehy, S. O’Byrne, A. D. Cutler, and C. G. Rodriguez, “Coherent anti-Stokes Raman Scattering (CARS) as a probe for supersonic hydrogen-fuel/air mixing,” JANNAF APS/CS/PSHS/MSS Joint Meeting, Colorado Springs, Colorado, December, 2003.
[5] S. O’Byrne, P. M. Danehy, and A. D. Cutler, “Dual-Pump CARS Thermometry and Species Concentration Measurements in a Supersonic Combustor,” 42nd Aerospace Sciences Meeting and Exhibit, Reno, NV, January 5-8, 2004.
[6] P. M. Danehy, R. DeLoach, and A. D. Cutler, “Application of Modern Design of Experiments to CARS Thermometry in a Supersonic Combustor,” 22nd AIAA Aerodynamic Measurement Technology and Ground Testing Conference, AIAA Paper 2002-2914, June 2002.
[7] S. O’Byrne, P.M. Danehy, and A. D. Cutler, “N2/O2/H2 Dual-pump CARS: Validation experiments”, 20th International Congress in Aerospace Simulation Facilities, Goettingen, Germany, August, 2003.
[8] P. Ewart, “A modeless, variable bandwidth, tunable laser”, Opt. Comm., 55, 124-126 (1985).
[9] E. V. van Veen and D. Roekaerts, “Thermometry for turbulent flames by coherent anti-Stokes Raman spectroscopy with simultaneous referencing to the modeless excitation profile”, Applied Optics, 44, 6995-7004 (2005).
[10] J. W. Hahn, C. W. Park, and S. N. Park, “Broadband coherent anti-Stokes Raman spectroscopy with a modeless dye laser”, Applied Optics, 36, 6722-6728 (1997).
[11] A. C. Eckbreth, Laser Diagnostics for Combustion Temperature and Species, 2nd Ed., Gordon and Breach Pub. (1996).
[12] R. E. Palmer, “The CARSFT Computer Code for Calculating Coherent Anti-Stokes Raman Spectra: User and Programmer Information”, Sandia National Laboratories Report SAND89-8206, Livermore, California (1989).
[13] R. D. Hancock, K. E. Bertagnolli, and R. P.Lucht, “Nitrogen and Hydrogen CARS Temperature Measurements in a Near-Adiabatic, Surface- Mixing (Hencken) Burner,” Combustion and Flame,109, 323–331 (1997).

65
CHAPTER 3
CARS Temperature Measurements in a Full-Scale Combustion-Heated Supersonic Free-Jet
3.1 Introduction As introduced in Chapter 2, a supersonic free jet was designed to provide CFD
modelers with fundamental data sets of the properties of supersonic combustion flows.
While Chapter 2 discussed the CARS results from a laboratory-scaled version of this
flow, this chapter will discuss the CARS data from a full-scale flow configuration. This
configuration is scaled to a size that allows the dominant flow structures to be better
resolved with the CARS-IRS measurement volume. During this experiment, IRS data
was taken simultaneously with the CARS data. For a presentation and discussion of the
IRS results see Ref. [1].
As part of the full-scale experiment, two flow conditions were studied: combusting
flow and mixing flow (no fuel). This chapter describes only the mixing flow results. For
these experiments, the CARS instrument was modified to improve the performance from
the instrument presented in Chapter 2. To quantify the effect of the changes, the

66
accuracy and precision of the instrument were reassessed using a Hencken burner flame
set up in the testing facility.
The locations, number, and order of measurements made to characterize the
supersonic flow were determined by several methods from the methodology known as
design of experiments [2]. This methodology defends against systematic errors and
facilitates obtaining meaningful statistics. Using this method, the amount of data needed
to obtain the desired precision was optimized [3].
Because of the harsh environment of the test facility, the CARS instrument did not
always yield reliable data. Therefore a secondary objective of this chapter is to discuss
the challenges of applying the CARS instrument in the harsh environment of the full-
scale supersonic free jet. In the free jet flow the laser beams experience beam steering
and beam defocusing, which causes changes in beam direction and focus. Beam steering
occurs when laser beams pass through variations in the index of refraction caused by the
large temperature gradients in the turbulent flow. The effect of beam steering is more
prominent on unfocused laser beams as shown by experimentation in Ref. [4]. The flow
in this study passes through the laser beams when they are far from their focus. Another
effect that can change the direction and focus of the lasers is the vibration caused by the
uncontained supersonic flow on structures and mirrors within the test section. Changes in
direction can decrease the overlap of the laser beams decreasing the CARS signal
intensity and lowering the data yield (fraction of spectra that could be fit to determine
measurements). Changes in the focus of the signal beam can increase the standard
deviation of the temperature measurements by changing the width of the spectrum.
Previous CARS studies of supersonic combustion with a similar scale [5]-[13] were

67
ducted and therefore mostly avoided conditions that would cause large amounts of beam
steering or excessive acoustic-induced vibrations of the instrument.
Other challenges of this study included: maintaining alignment of the lasers crossing
over the span of the measurement space (a 70 cm axial distance), the laser’s change in
propagation direction because of ambient temperature changes within the test cell, and
limited access to the system delivering the laser beams during the experiment. Another
challenge was the large temperature variations within the flow creating the need for a
large dynamic range of the CARS instrument. The discussion of these challenges
includes insight on how some of these challenges were addressed and suggestions how
some of these challenges could be addressed in the future.
3.2 Test Hardware and Facility The experiments were performed in the Direct Connect Supersonic Combustion
Facility (DCSCTF) at NASA Langley Research Center. This facility delivered vitiated
air with an enthalpy equivalent to flight at Mach 5.5. The vitiated air was accelerated in a
nozzle and discharged into the test cell at atmospheric pressure. The nozzle, described in
Ref. [14], created an axi-symmetric free-jet flow at Mach 1.6. A drawing of the nozzle is
shown on the left of Fig. 3.1. The heated gas is delivered through the center nozzle with
an exit diameter of 6.35 cm. A concentric cone around the center nozzle formed a co-
flow nozzle that was not used in this experiment. An infrared image of the heated gas
being delivered from the nozzle can be seen on the right side of Fig. 3.1. Vertical lines in
the infrared image are artifacts caused by reflections from the structure holding the optics
for the CARS-IRS instrument. The flow rates of gases to the facility heater for the

68
mixing flow condition were: 0.92±0.012 kg/s of air, 0.155±.005 kg/s of O2, and
0.0147±.0004 kg/s of H2.
Figure 3.1: Test apparatus and flow field. Rendering of a section through the model (left hand side) and infrared image (Ref. of an axi-symmetric free jet for the mixing case (right hand side). Part of the CARS apparatus is shown in the image.
3.3 Test Procedure To fully characterize the flow field of the axi-symmetric jet, the measurement
locations were chosen using design of experiment methods [3]. The locations chosen are
shown in Fig. 3.2, where (0,0) is defined as the geometrical center of the exit of the
nozzle. The axial distance increases in the direction of the flow. Because the flow was
assumed to be axi-symmetric, most of the locations were chosen in one half of an axial
cross section (circles and squares). Because of a physical limitation of the system
delivering the laser beams, the data set was split in two separate regions. These two

69
Figure 3.2: Test matrix used for experiments. Circles indicate the upstream region locations. The symmetry-check locations are indicated by triangles. The downstream region is indicated by squares. Within each region the measurement locations are visited in random order. regions are defined as the upstream region and downstream region and are indicated in
Fig. 3.2 by circles and squares, respectively. These two regions overlap at an axial
distance of 40 cm. A third region of locations, on the other side of the half-axial cross
section (triangles), was chosen to check the symmetry of the jet. This region also
assesses the alignment of the CARS instrument with respect to the flow. In all regions, a
higher density of measurement locations were placed in regions of flow believed to have
high gradients in the values being measured. The locations within a given region were

70
visited in a random order so that trends from environmental or instrumental sources
would not affect the data set.
The number of samples taken per location was determined by the number required to
achieve a pre-determined statistical uncertainty. Samples from every location could not
be taken on the same run. Each run lasted 50 s, limited by the memory of the CARS CCD
camera. The 20 Hz repetition rate of the laser allowed for data collection every 50 ms.
Thus, 1000 samples were taken during each run, allowing 4 measurement locations to be
visited each run, each having slightly more 200 samples per location. These repeated
samples at the same location allow computation of various statistical means, variances,
and covariances. Most measurement locations were visited during more than one run to
defend against run-to-run trends from environmental or instrumental sources.
3.4 CARS Instrumentation A very similar dual-pump broadband CARS instrument as used in Chapter 2 was
placed in a mobile cart, detailed in Ref. [15], for use in the DCSCTF. The mobile cart
was placed in a room underneath the test cell (see Fig. 3.3) to protect the lasers from the
large temperature changes and vibrations within the test cell. This also allowed access to
the laser system between runs and simplified the setup of the CARS system when
transferring it from the laboratory to facility. The cart contained the three lasers required
for CARS and IRS. A Spectra Physics Pro-290 Nd:YAG laser emitted approximately 1
Joule of energy with a 10 ns pulse duration at a rate of 20 Hz and at a wavelength of 532
nm (green). A fraction of the energy from the Nd:YAG, 180 mJ, pumped the narrowband
dye laser operating at 552.75 nm (yellow). This yellow laser had a measured FWHM of

71
0.3 cm-1 and provided an output of 20 mJ/pulse. Then, 250 mJ, pumped a home-built
broadband dye laser centered at 604 nm (red). This red laser is the major difference of
the CARS instrument from Chapter 2. Unlike the laser in Chapter 2, this laser was not
intended to be modeless. Consequently, the laser included an output coupler and was
able to emit approximately twice the energy, with 20 mJ/pulse. The laser had a larger
FWHM of ~12 nm formed by using a mixture of Rhodamine 610 and Rhodamine 640
dyes in methanol. The increase in energy and width of this laser increased the signal-to-
noise ratio of the CARS instrument from Chapter 2. Finally, 100 mJ of the Nd:YAG
energy was used as the green beam for CARS and the remaining green energy was used
in a pulse stretcher for IRS. More detail of the cart and the Rayleigh instrument can be
Figure 3.3: A photograph of the mobile cart containing the lasers of the CARS system. The cart is in the room underneath the test cell in DCSCTF.
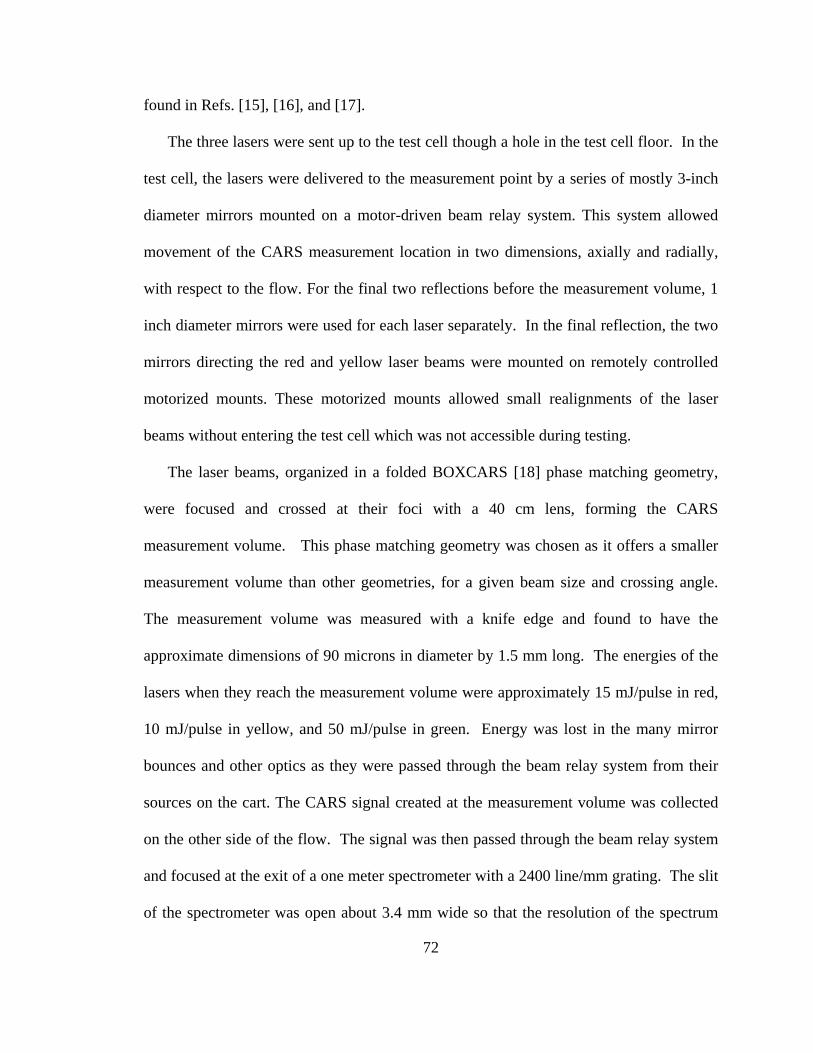
72
found in Refs. [15], [16], and [17].
The three lasers were sent up to the test cell though a hole in the test cell floor. In the
test cell, the lasers were delivered to the measurement point by a series of mostly 3-inch
diameter mirrors mounted on a motor-driven beam relay system. This system allowed
movement of the CARS measurement location in two dimensions, axially and radially,
with respect to the flow. For the final two reflections before the measurement volume, 1
inch diameter mirrors were used for each laser separately. In the final reflection, the two
mirrors directing the red and yellow laser beams were mounted on remotely controlled
motorized mounts. These motorized mounts allowed small realignments of the laser
beams without entering the test cell which was not accessible during testing.
The laser beams, organized in a folded BOXCARS [18] phase matching geometry,
were focused and crossed at their foci with a 40 cm lens, forming the CARS
measurement volume. This phase matching geometry was chosen as it offers a smaller
measurement volume than other geometries, for a given beam size and crossing angle.
The measurement volume was measured with a knife edge and found to have the
approximate dimensions of 90 microns in diameter by 1.5 mm long. The energies of the
lasers when they reach the measurement volume were approximately 15 mJ/pulse in red,
10 mJ/pulse in yellow, and 50 mJ/pulse in green. Energy was lost in the many mirror
bounces and other optics as they were passed through the beam relay system from their
sources on the cart. The CARS signal created at the measurement volume was collected
on the other side of the flow. The signal was then passed through the beam relay system
and focused at the exit of a one meter spectrometer with a 2400 line/mm grating. The slit
of the spectrometer was open about 3.4 mm wide so that the resolution of the spectrum

73
was limited by the size of the focus of the CARS signal beam at the entrance slit location
and not by the aperture of the slit itself. The slit was opened in this manner to prevent the
signal from missing the slit and not entering the spectrometer. The signal missing the slit
is not a concern in quiescent conditions as the signal is stationary, but shot-to-shot motion
of the signal was observed during the supersonic jet measurements. After passing
through the spectrometer, the spectra were collected by a back illuminated PIXIS 100
CCD camera with 1340 pixels horizontally and 100 pixels vertically. The vertical
direction of the CCD was summed, by groups of 33 pixels, into 3 bins.
As mentioned in the previous paragraph, during supersonic jet measurements the
focused signal suffered from shot-to-shot motion with respect to the entrance slit of the
spectrometer. In Fig. 3.4, the red dashed lines labeled as “flow data”, show several
spectra obtained during a single run in the mixing flow. These flow data are compared in
Fig. 3.4 with spectra taken while there was no mixing flow, shown as blue dotted lines
and labeled as “no flow data”. The flow data have much greater movement on the CCD
camera than the no flow data. There are multiple possible sources of this movement.
First, the flow could have caused the structure holding the mirrors and the mirrors
themselves to vibrate and change in shape and location. Evidence of this change in the
mirrors and/or the structure was seen in movement of the CARS signal location on the
CCD array. The CARS signal would change to another location while the flow was
operated and then would remain in this offset position after the flow stopped. Second, a
contributing factor to the movement of the signal could have been the temporal and
spatial variation of density in the hot, turbulent jet. Different densities of gas have
different indices of refraction. A gradient in index of refraction changes the angle of

74
Figure 3.4: N2 peaks from CARS spectra demonstrating movement of signal during flow. The red dashed lines show N2 peaks taken in supersonic jet at the mixing condition. The solid black lines show these peaks corrected during data analysis. Dotted blue line shows N2 peaks taken as reference data with no flow. propagation of light. Therefore, a gradient of density of the gas can change the direction
or focus of the beams. As previously mentioned this effect is referred to as beam
steering.
The motion of the CARS signal was reduced by the addition of two 1 meter focal
length relay lenses in the path of the CARS signal. These lenses, placed two focal
lengths apart, reduced the propagation of changes in deflections of the signal from the
measurement volume to the spectrometer. Although the deflections were reduced, some
motion of the signal remained.
Loss of signal from horizontal motion of the signal was prevented by opening the
spectrometer slit as previously mentioned. The vertical motion of the signal also created
the potential for loss of signal on the CCD array. In defense against this vertical motion,

75
the signal was placed into the center of the 3 vertical bins. This allowed vertical motion
of the signal both up and down into the other bins without loss of signal. As previously
mentioned, after some runs the signal location permanently changed. In this event, the
motorized mirror in front of the spectrometer was adjusted to direct the CARS signal
back to the center bin.
Originally, it was intended to increase the dynamic range of the instrument by
dividing the signal over two or more bins. The third bin would be used for background
subtraction. However, the vertical movement of the signal during the runs prevented the
use of this approach. Instead, a neutral density filter on a remote switch was added into
the signal path to vary the dynamic range of the system. The filter was used in low
temperature regions of the flow, where the signal intensity is the highest, to prevent
saturation of the CCD camera. The filter was removed in hotter parts of the flow to
improve the signal-to-noise ratio. More details about the structure holding the mirrors
(beam relay system) and the instrumental setup up can be found in Ref. [15].
3.5 CARS Data Analysis CARS data collected in this experiment were analyzed using a different fitting
process than described in Chapter 2. The CARS data were first pre-processed using
newly written in-house software. This pre-processing software improved on the method
used in Chapter 2 by better approximating the broadband laser profile for deconvolution,
among other improvements. After preprocessing, the spectra are then compared to theory
using a modified version of the widely used Sandia CARSFT code [19]. Unlike in
Chapter 2 where CARSFT was used to create a library of spectra for comparison, this

76
data was fitted using the CARSFT’s own least squares fitting algorithm. While this
method is more processing intensive since it computes a new theoretical spectrum at each
iteration of the solver, this method has the advantage of eliminating the previous fitting
error described as bifurcations in Chapter 2.
The following paragraphs describes the spectral fitting processing in more detail. The
first pre-process step in the new software is to subtract background light from the
spectrum. Background light is any light collected on the CCD that is not the CARS
signal. A background light spectrum is either collected in one of the 3 CCD bins where
no CARS signal is present or in a spectrum obtained with the red laser beam blocked.
Blocking only the red laser beam prevents the creation of the CARS signal while
allowing any background noise from the lasers with frequencies nearest the CARS signal
(491 nm) to be collected (the other two laser wavelengths were 532 nm and 552.75 nm).
Next, the spectra are corrected (approximately) for the horizontal motion of the
focused signal at the entrance to the spectrometer. This correction is made by shifting
each spectrum, in wavelength, to match spectra taken while the jet was not operating (no
flow data). Using the N2 spectral peak, the spectra are matched at the location in
wavelength (pixels) towards the blue side of the band head where 20% of the spectra’s
maximum intensity occurred. This location in the spectrum is used because its
normalized intensity changes the least as temperature changes, offering a consistent
location to match relative intensities of spectra with unknown temperature. The results of
this shift are shown by black solid lines in Fig. 3.4. This shift must be performed before
the normalization of the broadband dye laser spectrum from the CARS signal. This
ensures the correct alignment of the measured broadband dye laser profile spectral

77
location to its contribution to the measured CARS signal.
The shape of the broadband dye laser spectrum is removed from the spectra by
dividing by a time-shifted non-resonant reference spectrum. Just like in Chapter 2, non-
resonant reference spectra were obtained by performing CARS in an argon gas cell each
day of testing. But during this experiment, non-resonant spectra were collected both
prior to the start of testing and again upon the completion of testing. The non-resonant
spectra collected at the beginning and the end of testing were used to calculate the change
in the broadband dye laser’s spectral profile over the day. The changes in the spectral
profile of the broadband dye laser can be mostly characterized by a shift in frequency
(usually ~1 nm) which is caused by changes in temperature and concentration of the laser
dye. Assuming the change of the spectral profile is only a shift in frequency changing at
a constant rate, the non-resonant spectrum taken closest in time to the CARS spectrum is
shifted by the amount calculated for the time at which the CARS spectrum is taken. The
final pre-processing step is taking the square root of the spectral intensities to convert
from intensity to susceptibility (for comparison with CARSFT theoretical spectra).
The processed CARS spectra were analyzed using a version of the Sandia code
CARSFT that was modified by Lucht et al. [20] for the use of dual-pump CARS and
which was further modified by O’Byrne et al. [6]. This code computes theoretical
spectra convolved with an instrument function. The instrument function shape is modeled
with a double Gaussian function. The parameters of this double Gaussian are found by
optimizing their values to produce a best fit of room temperature theoretical spectra to
experiment. The instrument function accounts for the spectral line broadening from
several sources, including the finite width of the focus of the CARS signal at the entrance

78
to the spectrometer, the finite resolution of the CCD detector, and the spectral profile of
the broadband dye laser. CARSFT subsequently compares these theoretical spectra to the
experimental spectra, iterating on temperature and composition to minimize an objective
function, χ2. χ2 is a goodness-of-fit parameter calculated using the formula,
∑ −k
kdataktheory 2))()(( 3.1
where k is the pixel number, or wavelength of the spectrum. The theoretical values in
this formula have been normalized by setting their maximum value to one. An arbitrary
scaling factor is applied to the data for best fit to the theory. Values of χ2 less than one
generally produce reasonable fits to the data, judged by eye. Fits to data with χ2 greater
than one have large discrepancies by visual inspection.
3.6 CARS Instrument Characterization To provide CFD modelers with the precision and accuracy of the CARS
measurements, the CARS instrument was characterized in a well understood flat flame
burner called a Hencken Burner, just as in Chapter 2 and Ref. [21]. The fuel-to-air ratio
was varied to obtain a range of temperature and species concentrations. These
measurements were made with the CARS system in the test cell prior to supersonic jet
measurements, but the data were not fully analyzed until after all the experiments had
been completed. The accuracy of the results can be seen in Fig. 3.5 showing the
calculated values of temperature and species concentration compared with means of 1000
CARS measurements.
Overall the accuracy of the temperature measurements present in Fig. 3.5 (a) is

79
similar average percentage difference from theory of 3%. The temperature shows
improved accuracy over the Chapter 2 results for temperatures higher than ~2000 K most
likely due to the increase in signal-to-noise ratio of this instrument (owing to a more
powerful broadband dye laser). The decrease in accuracy occurs only for temperatures
less than ~2000 K. In this temperature range, the temperature is mostly determined from
the width of the N2 v=01 spectral peak, unless the rotational spectral lines are resolved.
Spectra without resolved rotational lines have less information for the determination of
Figure 3.5: Calculated values versus CARS measurements taken in flat flame burner with hydrogen fuel. Circles indicate mean CARS measurements and the error bars indicate the standard deviation. The solid lines show the calculated trends and the dashed lines show the 5% and 25% difference from the calculated values in the flame burner. The colors represent data taken at matching equivalence ratios in (a), (b), (c), and (d).

80
the temperature therefore the decrease in accuracy maybe explained by a reduced spectral
resolution seen in the spectrum in Fig. 3.6. This spectrum was taken in the Hencken
burner at the equivalence ratio 0.3 and has a reduced resolution in comparison to the
spectrum shown in Fig. 2.5 (a). Although the same spectrometer and grating were used
for the collection of both of the spectra, the signal was not focused at the slit of the
spectrometer for the spectrum in Fig. 3.6, which defocused the signal on the CCD,
reducing the resolution. Unfortunately, all the results from the supersonic measurements
presented in this chapter will be in the reduced accuracy temperature range (300 K-1000
K). At 300 K the percentage difference between measured and computed temperatures is
~2.3 %, at ~1200 K the percentage difference is 7.4%, and no measurements were made
at the temperatures in-between.
Figure 3.6: CARS spectrum taken in a Hencken burner flame at an equivalence ratio of 0.3.

81
In comparison to the Chapter 2 Hencken burner measurements, the mole fraction
results shown in Fig. 3.5 (b), (c), and (d) are more accurate. The nitrogen mole fraction
measurements are within 5% of the theory, improved from measurements in Chapter 2
which had some accuracies of ~25%. The largest percentage difference of N2 mole
fraction from the theoretical is 7.2% for this instrument. The O2 mole fraction no longer
fits to far below zero and difference from the theory has been reduced. The greatest
percentage error of O2 mole fraction is 31%. The H2 mole fraction accuracy increased to
similar accuracy as in Ref. [6] (10%-15% low). These improvements in the CARS
instrument accuracy can be attributed to a higher signal-to-noise ratio, a more accurate
non-resonant deconvolution, and an improved fitting method.
Although the mole fraction accuracy has been improved there are still errors in the
measurements. These errors can be attributed to several possible sources: poor location
selection of CARS measurement volume in the Hencken burner, incorrect non-resonant
deconvolution, and polarization of the lasers, each of which is detailed in the following
paragraphs.
The theoretical values used for comparison to the CARS measurements are calculated
by making assumptions about the flow. These assumptions were shown only to be true
for a small region (2-4 cm from the exit) of the Hencken burner flame in Ref. [21] for
certain flow rates. During the characterization measurements used in this experiment and
in Chapter 2 the location of this region was estimated and the flow rates were changed.
This means that some of the difference between expected and measured temperatures and
mole fractions maybe be explained by the uncareful execution of the characterization.
Another major cause of inaccuracy in CARS measurements could be the incorrect

82
estimation of the broadband dye spectrum contribution to the collected CARS signal by
using a non-resonant spectrum for deconvolution. For this experiment, the non-resonant
deconvolution method was improved from Chapter 2, but is still just an estimate. For the
best accuracy, the non-resonant spectrum must be collected every shot as discussed in
Ref. [22]. This avoids systematic errors caused by the changing broadband dye laser
spectrum. However, incorrect non-resonant deconvolution cannot explain inaccuracies
greater than O’Byrne et al. [23], which used the same the non-resonant deconvolution
method as in Chapter 2. The mole fractions of this instrument are less accurate than Ref.
[23].
The most likely source of inaccuracy of the mole fraction measurements is that the
input laser beams were not linearly polarized all in the same direction. For dual-pump
CARS, the polarizations of the input lasers with the frequency difference tuned to each
spectral region determine the components of the third order susceptibility tensor elements
that contribute to the signal, as discussed in Ref. [24]. If the polarization of the pump
beams used to probe the two different spectral regions are different then different
components of the third order susceptibility tensor contribute to the signal. The different
components of the susceptibility have different amplitudes, causing the intensities of the
spectra from the two spectral regions to be different. Therefore, if the polarization of the
input beams differ from each other, the intensity of the spectra from the two different
spectral regions probed vary.
After the flat flame burner data and supersonic mixing flow data were collected,
evidence was discovered that the lasers were not all linearly polarized in the same
direction, as intended. First, the polarization of the broadband dye laser was observed to

83
be slightly elliptical. Also, the CARS signal showed evidence of elliptical polarization as
no direction of a linear polarizer placed in the beam path could completely extinguish the
light. This was unexpected because the CARS signal was designed to be linearly
polarized in the same direction as the input lasers. Another unexpected observation was
the orientation of the CARS signal’s maximum component of polarization. When
measured at the spectrometer, the orientation was approximately 45 degrees from the
expected direction. Thus, the elliptical polarization of the red laser could have caused a
systematic error and explain the incorrect measurement of the species mole fractions. In
previous work such as Ref. [6] and [23], this error was avoided by placing linear
polarizers in the path of the laser beams near the crossing of the beams.
One standard deviation of the 1000 individual measurements is used as a measure of
precision and is shown in the plots in Fig. 3.5 as error bars. The single-shot precision of
temperature averaged over all measured temperatures is 71 K, similar to the value
obtained by O’Byrne et al. [23]. At room temperature the precision is ~25 K. From
~1000 K to ~2100 K the precision is ~60-65 K which is slightly less precise than the
instrument measured in Chapter 2. This decrease in precision can also be seen in the plot
of relative standard deviation versus temperature shown in Fig. 3.7. An explanation of
this decrease in precision is the decrease in resolution of the spectra, as seen in Fig. 3.6
caused by poor focusing of the CARS signal. Lower resolution decreases the capability
to distinguish between temperatures as discussed for temperature accuracy.
An alternative explanation of this decrease in precision is the replacement of the
modeless broadband dye laser with a conventional one. Although the modeless dye laser
did show reduced shot-to-shot variability and may have slightly improved the precision

84
of the CARS instrument in Chapter 2 in this temperature range, the low efficiency of the
laser decreased the overall signal-to-noise ratio.
The lower signal-to-noise ratio of the Chapter 2 instrument may have caused the
lower accuracy and precision of the mole fractions and temperature >2100 K than this
chapter’s instrument. A conventional dye laser was used in the new CARS instrument to
increase the efficiency of the laser and therefore to increase the signal-to-noise ratio.
Another possible source of the lower precision for the Chapter 2 instrument at
temperatures > 2100 K is the bifurcation fitting error of the algorithm used in that
chapter. In summary, the increased signal-to-noise ratio in combination with the
improved fitting method increased the precision of all the mole fraction measurements
Figure 3.7: Relative standard deviation versus temperature. The characterization of the CARS instrument from Chapter 2 shows higher precision for temperature less the ~2100 K. The CARS instrument from this Chapter has improved fitting method that improves the precision, as seen for temperatures 2100 K and 2200 K.

85
and some of the temperature measurements.
3.7 Results and Discussion
3.7.1 CARS Measurements in the Mixing Flow Experiment
The results of the mixing flow experiment will be presented in this section and will
focus on the temperature measurements. Since the errors in the composition
measurements were on the same order as the variations in N2 and O2 composition
(hydrogen wasn’t present in the flow) in the flow field, the composition data are not
reported. Figure 3.8 (a) shows the mean of temperature in the form of a contour plot.
This plot was generated using the grid of the measured mean values at the locations
shown in Fig. 3.2. The temperature is 1010±49 K at the first measurement location
downstream of the nozzle exit (5.5 cm) and 0.25 cm from geometric center. The highest
temperature gas is indicated by red in the figure. This high temperature starts with the
same width as the diameter of the jet (6.35 cm) and slowly narrows downstream as the
heated gas mixes with the ambient air. The blue color indicates the ambient air
temperature of 300 K and shows the boundary of the jet flow. The temperature range
between ambient and the vitiated air jet (roughly 450 K to 950 K) is indicated mostly by
green and shows the region in which these gases are mixing. Referred to as the mixing
layer, this region grows as it moves downstream.
According to the measurements made in the flat flame burner at 1100 K, the mean
temperature measured with CARS may be lower than the actual temperature by 100 K.
This indicates that the mean temperatures measured near 1000 K may be lower than the
actual temperature as much as 100 K. Ambient room temperature, 300 K, has a higher

86
accuracy. This indicates the other temperatures in-between may have increasing
accuracy as room temperature is approached.
Figure 3.8 (b) shows a contour plot of the standard deviation of the temperature, in
Kelvin. The standard deviation in the plot has been corrected for the CARS instrument
single-shot precision. This correction was calculated by assuming that the instrument
Figure 3.8: (a) is a contour map of mean CARS temperature data taken in an axi-symmetric free jet. (b) is a contour map of CARS temperature standard deviation. The standard deviation has been corrected by the CARS instrument precision. Radial distance versus axial distance is plotted in centimeters with respect to (0,0) which is the location of the center of the nozzle exit.

87
error and the fluid flow fluctuations added in quadrature. The correction was executed by
taking the difference of the squares of the measured standard deviations and the single-
shot precision and then taking the square root of this value. The single-shot precision
was measured for temperatures in the flat flame burner, which was assumed to be steady
in all flow variables. The single-shot precisions for temperatures not measured in the flat
flame burner were found by using a linear interpolation between measured temperatures.
In Fig. 3.8 (b), the highest standard deviations of temperature, of about 110 K, are seen in
the mixing layer regions. The mixing layer increases in width as it progresses
downstream. In the core of the heated flow and in the ambient air, the standard deviation
decreases to a range of 50 K to 70 K indicating steadier flow conditions.
The standard deviation map in Fig. 3.8 (b) shows the combined effect of the
unsteadiness of the flow and random errors in the instrument above levels experienced in
the quiescent Hencken burner. One such error is related to shot-to-shot changes in the
width of the CARS spectra caused by changes in the focusing of the CARS signal at the
entrance to the spectrometer. Variation in the focus of the CARS spectrum on the CCD
changes the width of the instrument function. If a constant instrument function width is
used in the analysis this variation in focus leads to erroneous changes in temperature
when the temperature is <~1000 K. For the range of temperatures measured in this
experiment, 300 K - 1000 K, the temperatures obtained using CARSFT are mainly
determined by the width of the CARS spectra since the N2 v=12 is not highly
populated. Figure 3.9 demonstrates shot-to-shot changes in the observed width of room
temperature CARS spectra, which lead to erroneous variations in temperature. The
spectra in the figure shown with solid lines were taken during operation of the supersonic

88
jet in immediate succession, 50 ms apart. These spectra were obtained while the jet flow
was operating, but with the CARS measurement volume located well outside the jet flow,
in the ambient air (while the laser beams still passed through the jet flow). The spectra in
Fig. 3.9 vary significantly in width. This width variance is best seen at the half maximum
indicated by the arrows in the figure. The variation of the width causes spectra to fit to
temperatures both above and below the expected ambient, as indicated in the figure
caption. For comparison, a reference CARS spectrum taken in ambient air with the jet
flow off is shown in the figure as a dashed black line.
The change in width seen in Fig. 3.9, while temperature stays relatively constant
(room temperature), is caused by a variation in the focus of the CARS signal at the
entrance to the spectrometer. This change of focus could be caused by the movement of
Figure 3.9: N2 peak of CARS spectra comparing FWHM in ambient air (300 K) with flow on and off. Normalized signal intensity plotted against frequency (units are wave numbers) of N2 peaks of CARS signals. Green showing a narrowed 300 K spectrum fitted to 177K. Red showing a widened 300 K spectrum fitted to 400 K. Compared to blue and black fitted to the near room temperature with flow on and off respectively.

89
the location of the beams’ crossing. If the location of beams’ crossing changes, then the
distance from where the CARS signal is created to the collimation lens changes. This
change in distance to the collimation lens would lead to a change of the focus at the
entrance of the spectrometer, and consequently a change in focus at the CCD camera.
Another possible source of change in focus of the CARS signal is the change in density
of the turbulent gases in the jet as the CARS signal passes through. A density gradient in
the flow could change the index of refraction and act like a lens. A lens-like effect could
change the collimation of either the input CARS beams or the signal beam, changing the
focus at the entrance of the spectrometer.
The effect of a change in the width of the instrument function on the fitted
temperature depends on the temperature at which the spectrum was measured. Figure
3.10 shows the effect of fitting theoretical spectra at various temperatures with theoretical
spectra computed with a 25% larger instrument function width. This study was done for
an actual instrument function width of 3 wave numbers. The plot shows that, as the
temperature increases, the percentage difference between the fitted temperature and the
known temperature decreases. The trend of increasing accuracy at higher temperature is
due to the increase in population of the N2 v=12 band. The accuracy also increases
because as the width of the spectrum increases with temperature, the percentage of the
change in the width of the spectrum from the change in focus decreases.
A bias in the mean temperature to a higher temperature would have occurred if the
signal was focused as tightly as possible at the entrance to the spectrometer, since then
any change in focus during the tests would have increased the instrument function width.
Fortunately, in ambient air with the jet flow off, the CARS signal was slightly defocused

90
Figure 3.10: The effect of fitting a CARS spectrum with a 25% larger instrument function width. Percentage difference of the original temperature of the spectrum to the fitting temperature versus the expected temperature. The percentage difference decreases with higher temperatures. allowing both focusing and defocusing of the signal to occur. Thus, the mean values of
the temperatures in ambient air did not show any bias. Unfortunately, the change in
width of the instrument function is not consistent or predictable on a shot-by-shot basis,
because it is caused by random fluctuations in the flow. Therefore standard deviations in
the supersonic jet flow presented in Fig. 3.8 (b) may be overestimated, especially in
colder regions of the flow, because, although they are corrected for instrument precision,
this correction does not include the effects of change in signal focus at the spectrometer
entrance.
Another view of the CARS temperature data is offered in Fig. 3.11, in which
single-shot data (data from individual laser pulses) are shown in red. These data points
were all taken as a scan during one run. This scan was collected along the axis of the jet

91
for half of the measurement space (the upstream region). The data from the scan are
compared with mean values of data acquired with the test matrix, shown as black squares.
The error bars in the figure represent the corrected standard deviation for the mean
values. The mean values follow the trends of the single-shot spectra shown, for example
at the axial distance of 10 cm both the mean and the single-shot data show a dip in the
measured temperature. This dip in temperature may indicate a shock wave or expansion
affecting the temperature at this location.
As mentioned in the test procedure section, the data were taken in two regions due to
constraints of the beam-relay system. In the one month break between the upstream
(including the symmetry check locations) and downstream data set regions minor
modifications were made to the facility. These changes raised the measured stagnation
Figure 3.11: CARS temperatures along axis of full-scale jet. Single shot temperatures, shown in red, from an axial scan are compared with mean temperatures, shown with black squares, error bars indicating corrected standard deviation of the means.

92
Figure 3.12: Temperatures taken at the overlap (40 cm) of the upstream and downstream measurement region. Temperature versus radial distance is plotted. Black diamonds in the plot indicating the measurements taken with the upstream locations and red squares indicating the measurements taken with the downstream locations. Error bars indicate standard deviations. pressure in the combustion chamber by nearly 7%, even though the same flow rates were
set as before. Oddly, this change in pressure was accompanied by an increase in
temperature measured by CARS: this change can be seen in Fig. 3.12. This indicates that
although the flow rates were set to be the same, they may actually have increased. The
figure compares the mean values of temperature at an axial distance of 40 cm where the
upstream region overlaps the downstream region. The standard deviation at each
measurement location is shown by the error bars in the graph. The statistical corrected
uncertainties in the means (not shown) are about an order of magnitude smaller than the
error bars because these are averages of hundreds of individual measurements. The
temperature increase from the downstream region, shown as red squares, compared to the

93
upstream region, shown as black diamonds, is much larger than the statistical
uncertainties in the means. This indicates that the change made to the facility changed
the properties of the jet flow. Because of this difference in the flow conditions, the two
regions should be considered by computational fluid dynamists to be two separate data
sets. Note this difference was also present in the plots in Fig. 3.8, but the data sets have
been averaged together at the 40 cm axial distance.
3.7.2 Mixing Flow Data Yield
Not all of the CARS spectra (data) collected during the mixing flow experiment
could be analyzed to yield measurements. Table 3.1 shows the percentage of the data
that could not be analyzed because of several factors. These factors are listed in the
columns of Table 3.1 and are detailed below: camera saturation (>65000 counts), low
signal intensity (below 100 counts above the background), laser-induced breakdown of
the gases in the measurement volume, and other factors that resulted in poor fitting to
theory. Each factor contributing to data removal is separated into percentages removed
Table 3.1: Percentages of data removed and data total yields. The percentages of data removed for the upstream region, downstream and total data set because of saturation, breakdown, low signal counts, and χ2>1 (poor fit). The last column shows the yields for the data set.

94
for the upstream region, downstream region, and entire data set.
The CCD array of the camera has a saturation threshold. CARS spectra for which a
range of pixels exceed that limit are considered saturated. Saturated spectra cannot be fit
with the analysis code because a critical part of the spectrum has an unknown intensity;
therefore these data were removed from the data set. The fraction of saturated spectra
was nearly the same for upstream and downstream data sets.
Breakdown of the gas sometimes occurs at the location of the beams’ crossing. At
their crossing, the lasers are focused on top of one another and their combined energies
can exceed the threshold of the energy at which the gases or dust particles will dissociate.
This dissociation causes a spark or “breakdown”. The spark of light is combined with the
CARS signal on the CCD array, increasing the background light with an unknown
profile. These spectra are identified by monitoring a region of the spectrum not
containing resonant signal and spectra are rejected which exceed the normal background
in this region. This effect only contributes to a very small amount of data loss and was
nearly the same for upstream and downstream data regions.
Spectra with peak intensities below 100 counts were removed from the data set prior
to fitting. The signal-to-noise ratio of these spectra was so low that when the square root
of the signal was taken for fitting with CARSFT, it was indistinguishable from the noise.
The decrease in CARS signal intensity is caused by increase in temperature and flow
effects on the beams. Flow effects that could decrease the CARS signal intensity include:
higher temperature, increase in turbulence, and movement of the mirrors. The CARS
signal could also reduce in intensity if it travels a longer path through turbulence. All of

95
these effects would cause more movement of the beams and would decrease or eliminate
the size of the beams’ overlap region, reducing the resulting CARS signal intensity.
Signal counts below 100 were more frequent in the downstream region, indicating an
overall lower CARS signal intensity. During the days that the downstream region data
were collected, the CARS signal intensity, with the flow off, was at the same intensity
level as the upstream data set. Therefore, the reduction in CARS signal intensity in the
downstream region is attributed to effects that occur in response to the flow. There are
two possible reasons that the CARS signal intensity decreased beyond an axial distance
of 40 cm. Increased beam steering could have been caused by the trends of increased
turbulence and larger diameter of the jet further downstream. Alternatively, the
instrument or facility could have changed between the near and far field measurements.
As the flow proceeds downstream the jet diameter increases, expanding the region of
turbulence further from the focus of the beams and therefore increasing the effect of
beam steering. If the change in signal intensity was caused by natural trends of increased
turbulence this effect would gradually increase as the region of the turbulence expanded.
Along with the change made to the flow facility that increased the temperature in the
interim between the measurements of the two regions, a change was also made to the
CARS instrumental setup up. This change was the increase of the path length from the
mobile cart to the measurement volume. This was done by the addition of two mirrors in
the path of delivery of the lasers to the measurement volume. These additions could have
decreased the stability of the structure and increased the movement of the beams during
flow operation. If the change in signal intensity was caused by a change in
instrumentation the effect would be sudden.

96
To distinguish between these two possibilities a comparison of the data yield at the
overlap of the measurement region at an axial distance of 40 cm was made. The data
yield for the upstream region is 21% higher than for the downstream region, even though
the measurement location was identical. Therefore it was determined that the change in
instrumentation was the reason for the decrease in the CARS signal in the downstream
region.
Most of the data removed from the data set were from a criterion set on the χ2 value.
Removing data that fitted with χ2 > 1 effectively removed all spectra with peak signal
intensities below 1500 counts indicating that the signal-to-noise ratio is too low for these
spectra. The requirement of having χ2 < 1 removed more data from the downstream
region than the upstream region. This indicates a higher frequency of signal lower than
1500 counts in the downstream region. The decrease in the CARS signal intensity for the
downstream data region follows the trend from the “signal below 100 counts” criterion.
Adding these two criterions together 38.2% of the data was lost due to low signal counts
most likely caused by beam misalignment. Reference [25] showed similar losses (50%)
from low signal when studying beam misalignment caused by turbulent flow.
The decrease in data yield at 40 cm, where the upstream and downstream regions
overlap can also be seen in Fig. 3.13. Figure 3.13 shows the percentage data yield at each
measurement location in the form of a contour map. Not only can a sharp drop in the
yield be seen between the upstream and downstream data region but also by comparison
with Fig. 3.8 (a), the effect of temperature on the signal intensity can be seen. The data
yield decreases at locations in the flow where the temperature is higher.

97
The dependence of the data yield on temperature can be attributed to the
dependence of the signal intensity (counts) on the temperature as shown in Fig. 3.14. All
the data points used in the results are shown as red data points in the figure. The data are
compared to a theoretical trend of signal intensity versus temperature, as used in Ref.
[26], T-3.5, arbitrarily scaled, is shown as a line in black. The data points generally follow
the trend but even at ambient room temperature the signal intensity range is very broad.
This large signal intensity range at low temperature shows the effect of the beam
misalignment to be greater than the temperature effect in most instances. This
temperature effect on signal intensity was shown to not create a large bias in the means of
temperature in a previous preliminary report on this data set by Danehy et al. [27].
Figure 3.13: Contour map of percentage data yield per measurement location. The data yield depends on temperature. The upstream region shows more yield than the downstream region.

98
Figure 3.14: Dependence of CARS signal intensity on temperature. CARS data points shown in red and the theoretical dependence of intensity on temperature, arbitrarily scaled.
3.7.3 CARS Measurements in the Fueled Flow Experiment
The measurements taken in the fueled version of the axi-symmetric full-scale jet
flow have not been analyzed for several reasons. First, not all of the data required to
meet the statistical goals was collected. All of the data in the downstream region was
collected but the Nd:YAG laser failed after ~8 runs in the upstream region and the
experiment was terminated. Second, the yield was even lower than in the mixing case
because the increased turbulence and higher temperatures of the fueled jet reduced even
further the CARS signals intensities.

99
Third, a method must be found to combat the horizontal signal moving shot-to-shot.
As discussed in the CARS data analysis section, spectra containing nitrogen were aligned
to a spectrum taken in no flow conditions. For spectra not containing nitrogen an
alternative method must be found. For example, an alternative method is needed for
spectra containing only hydrogen because no flow-off measurements were taken in pure
hydrogen. A correct alignment is critical for accurate removal of the nonresonant
contribution to the CARS spectra and therefore species concentration measurement.
Fourth, fitting the data would have been problematic: the method used for the mixing
data case was already processing intensive even though it only included 3 unknowns (N2,
O2, and temperature). The fueled flow would include another variable and therefore
would increase the processing time.
Finally, the spectra collected included background luminosity from the supersonic
jet. Apertures, a polarizer, and a shutter were placed in the path of the CARS signal to
prevent as much of the background light as possible from reaching the CCD. The
polarizer eliminated the background light with polarization different than the CARS
signal. A shutter eliminated light collecting on the CCD during the 1 ms exposure time
but light still reached the CCD during the time the shutter was open. The shutter didn’t
open 4% of the time, decreasing the data yield. A process to remove the remaining
background light from the measured spectra would need to be developed to properly
analyze the spectra.

100
3.8 Concluding Remarks The CARS system’s accuracy and precision was improved by making changes to the
system described in Chapter 2. The broadband dye laser’s FWHM and energy output
was increased. Compared to Chapter 2, a more accurate method to estimate the
broadband dye laser’s contribution to the CARS signal and a different data analysis
method fitting method was used. With the improved system, measurements were made
in an axi-symmetric supersonic free jet. These measurements were used to generate maps
of the mean and standard deviation of the temperature field.
The data were collected with a yield of 54%. About 7% of the data were lost
because of signal saturation. The majority of the data loss was due to low signal
intensity, 38%. This percentage is the addition of the percentage of spectra removed
because of signal below 100 counts and the goodness-of-fit criteria of χ2<1. Most of the
low-signal data were lost because of CARSFT’s inability to distinguish the signal from
the noise. Movement of the beams contributed to a change in focus of the CARS signal
at the entrance of the spectrometer. This change in focus did not affect the mean values of
the temperatures since the CARS signal began slightly defocused so the change in focus
was equally likely to increase or decrease the temperature. The change in focus did,
however, increase the standard deviations and could not be decoupled from the standard
deviation of temperature in the flow. Changes were made to the facility between the
measurements of two regions of the flow defined as upstream and downstream. These
changes to the facility changed the flow properties of the jet. Because flow conditions for

101
the upstream region and downstream region are different, the regions should be
considered separate data sets.
It is recommended to make the following changes to the CARS instrument to
increase the quality of future data sets. The dynamic range of the CARS instrument
needs to be increased to decrease the loss of data from saturation of the CCD. The beam
relay structure rigidity needs to be increased to decrease loss of signal due to beam
movement by structural vibration. The phase matching could be changed to another
phase matching geometry to address the loss of signal intensity caused by beam steering
by refractive index gradients. In other phase matching geometries two or all of the laser
beams pass through the same path in the flow, reducing the chance of beam
misalignment. The CARS signal could be collected closer to the measurement volume to
reduce propagation of changes in focus or direction. This could be executed with a fiber
optic as in Refs. [7], [9] and could decrease the loss of signal and increase the accuracy of
the standard deviation measurements. Since the variation in focus of the CARS signal at
the entrance of the spectrometer is difficult to fully eliminate, increasing the resolution of
the spectrometer would improve the temperature accuracy of each laser shot
measurement. Better resolution will also improve the temperature precision. Polarizers
should be implemented in each input beam, directly before the CARS focusing lens to
eliminate any possible elliptical polarization, to improve the accuracy of the CARS
concentration measurements. A polarizer should also be placed in the signal beam before
the spectrometer. Also in the experiment, a test case having a larger difference of species
from ambient air would provide better distinction between facility air and ambient air.
The measurement location and flow rates of the Hencken burner should be chosen to

102
match where the theoretical predictions are known to better characterize the CARS
instrument, and smaller temperature increments should be studied during calibrations.
During combustion measurements a faster shutter should be explored, like a liquid crystal
shutter which opens for only 70 µs, as used in Ref. [28], to eliminate background
luminosity.

103
REFERENCES
[1] D. Bivolaru, A. D. Cutler, P. M. Danehy, R. L. Gaffney, and R. A. Baurle, “Spatially and Temporally Resolved Measurements of Velocity in a H2- Air Combustion- Heated Supersonic Jet” AIAA Paper 2009-0027, 2009.
[2] R. A. Fisher. The Design of Experiments, 9th Edition, Macmillan, 1971. [3] R. T. Johnson, P. A. Parker, D. C. Montgomery, A. D. Cutler, P. M. Danehy and R.
D. Rhew “Design Strategies for Response Surface Models for the Study of Supersonic Combustion” Quality and Reliability Engineering International, v.25(3), pp. 365–377, April (2009).
[4] L. P. Goss, D. D. Trump, B. G. MacDonald, and G.L. Switzer, “10-Hz coherent anti-Stokes Raman spectroscopy apparatus for turbulent combustion studies”, Rev. Sci. Instrum. 54, (1983).
[5] A. D. Cutler, P.M. Danehy, R.R. Springer, S. O’Byrne, D.P. Capriotti, R. DeLoach, “Coherent Anti-Stokes Raman Spectroscopic Thermometry in a Supersonic Combustor,” AIAA J., Vol. 41, No. 12, Dec. 2003. pp. 2451–2459.
[6] S. O’Byrne, P. M. Danehy, S. A. Tedder, A. D. Cutler, “Dual-Pump Coherent Anti-Stokes Raman Scattering Measurements in a Supersonic Combustor,” AIAA J., Vol. 45, No. 4, p. 922-933, April 2007.
[7] T. J. Anderson and A. C. Eckbreth, “Stimultaneous Coherent Anti-Stokes Raman Spectroscopy Measurements in Hydrogen-Fueled Supersonic Combustion”, J. Propulsion, Vol. 8, NO. 1, Jan. 1992.
[8] P. Magre, G. Collin, O. Pin, J.M. Badie, G. Olalde, and M. Clement, “Temperature measurements by CARS and intrusive probe in an air-hydrogen supersonic combustion” Int. Journal of Heat and Mass Transfer, Vol. 44, pp. 4095-4105, 2001.
[9] M. W. Smith, O. Jarrett, Jr., R. R. Antcliff, , G. B. Northam, A. D. Cutler, and D. J. Taylor, “Coherent Anti-Stokes Raman Spectroscopy Temperature Measurements in a Hydrogen-Fueled Supersonic Combustor,” Journal of Propulsion and Power, Vol. 9, No. 2, 1993,pp. 163–168.
[10] S. R. Yang, J. R. Zhau, G. J. Sung, and G. Yu, “Multiplex CARS Measurements in Supersonic Hydrogen/Air Combustion,” Applied Physics B, Lasers and Optics, Vol. 68, No. 2, 1999, pp. 257–265.
[11] K. A. Vereschagin, V. V. Smirnov, O. M. Stelmakh, V. I. Fabelinski, V. A. Sabelnikov, V. V. Ivanov, W. Clauss, and M. Oschwald, “Temperature Measurements by Coherent Anti-Stokes Raman Spectroscopy in Hydrogen-Fuelled Scramjet Combustor,” Aerospace Science and Technology, Vol. 5, No. 5, 2001, pp. 347–355.
[12] S. O’Byrne, Danehy, P. M., and Cutler, A. D., “Dual-Pump CARS Thermometry and Species Concentration Measurements in a Supersonic Combustor,” AIAA Paper 2004-0710, Jan. 2004.
[13] S. A. Tedder, S. O’Byrne, P. M. Danehy, and A. D. Cutler, “CARS Temperature and Species Concentration Measurements in a Supersonic Combustor with Normal Injection,” AIAA Paper 2005-616, 2005.

104
[14] A. D. Cutler, G. Magnotti, R. Baurle, D. Bivolaru, S. A. Tedder, P. M. Danehy, M.C. Weikl, F. Beyrau, and T. Seeger, “Development of Supersonic Combustion Experiments for CFD Modeling,” AIAA-2007-0978, 45th AIAA Aerospace Sciences Meeting and Exhibit, Reno, NV, Jan.8-11, 2007.
[15] D. Bivolaru, J. W. Lee, S. B. Jones, S. A. Tedder, P. M Danehy, M. C. Weikl, G. Magnotti, and A. D. Cutler, , “Mobile CARS- IRS Instrument for Simultaneous Spectroscopic Measurement of Multiple Properties in Gaseous Flows,” 22nd International Congress on Instrumentation in Aerospace Simulation Facilities, Asilomar Conference Center, Pacific Grove, California, June 10– 14, 2007.
[16] D. Bivolaru, P. M. Danehy, J. W. Lee, R. L Gaffney, Jr., and A. D Cutler, “Single-pulse Multi-point Multi-component Interferometric Rayleigh Scattering Velocimeter,” AIAA-2006-0836, 44th Aerospace Sciences Meeting, Reno, NV, January 9-12, 2006.
[17] D. Bivolaru , P. M. Danehy, and J. W. Lee, “Intracavity Rayleigh-Mie Scattering for multipoint, two-component velocity measurement,” Optics Letters, Vol. 31, No. 11, pp. 1645-1647, June, 2006.
[18] A. C. Eckbreth, Laser Diagnostics for Combustion Temperature and Species (Gordon & Breach, Amsterdam, Nederland, 1996.
[19] R. E. Palmer, “The CARSFT Computer Code for Calculating Coherent Anti-Stokes Raman Spectra: User and Programmer Information,” Sandia National Laboratories Report SAND89-8206, Livermore, CA, 1989.
[20] R. P. Lucht, “Three-Laser Coherent Anti-Stokes Raman Scattering Measurements of Two Species,” Optics Letters, Vol. 12, 1987, pp. 78–80.
[21] R. D. Hancock, K. E. Bertagnolli, and R. P. Lucht, “Nitrogen and Hydrogen CARS Temperature Measurements in a Near-Adiabatic, Surface- Mixing (Hencken) Burner,” Combustion and Flame,Vol.109,1997, pp.323–331.
[22] E. H. van Veen and D. Roekaerts, “Thermometry for turbulent flames by coherent anti-Stokes Raman spectroscopy with simultaneous referencing to the modeless excitation profile”, Applied Optics, 44, 6995-7004, (2005).
[23] S. O’Byrne, P. M. Danehy, and A. D. Cutler, “N2/O2/H2 Dual-Pump CARS: Validation Experiments,” 20th International Congress on Instrumentation in Aerospace Simulation Facilities, Göttingen, Germany, Aug. 2003.
[24] R. D. Hancock, F. R. Schauer, R. P. Lucht, and R. L Farrow,., “Dual-Pump Coherent Anti-Stokes Raman Scattering (CARS) Measurements of Hydrogen and Oxygen in a Laminar Jet Diffusion Flame,” Applied Optics, Vol. 36, 1997, pp. 3217–3226.
[25] B. Attal-Tretout, P. Bouchardy, P. Magre, M. Pealat, and J. P. Taran, “CARS in Combustion: Prospects and Problems”, Appl. Phys. B, 51, 17-24 (1990).
[26] P. M. Danehy, S. O’Byrne, A. D. Cutler, and C. G. Rodriguez, “Coherent Anti-Stokes Raman Scattering (CARS) as a Probe for Supersonic Hydrogen-Fuel/Air Mixing,” Proceedings of the JANNAF APS/CS/PSHS/MSS Joint Meeting [CD-ROM], CPIA, Columbia, MD, Dec. 2003.
[27] P. M. Danehy, G. Magnotti, D. Bivolaru, S. A. Tedder, and A. D. Cutler, “Simultaneous Temperature and Velocity Measurements in a Large-scale,

105
Supersonic, Heated Jet,” Paper 1193, 55th JANNAF Propulsion Meeting, Boston, MA, May 12-16, 2008.
[28] S. P. Kearney, M. N. Jackson, “Dual-Pump Coherent Anti-Stokes Scattering Thermometry in Heavily Sooting Flames”, AIAA Journal, 45, 2947-2956 (2007).

106
CHAPTER 4
Instrumentation Advancements Inspired by Application-Specific Issues and Goals
4.1 Introduction The laboratory-scale and full-scale supersonic combustion flow applications,
described in Chapters 2 and 3, indentified numerous issues with the CARS
instrumentation. Errors were found in the data analysis method used for the laboratory-
scale flow. To avoid these errors, a different data analysis method was used for the full-
scale mixing flow; unfortunately this alternative method is impractical for fitting more
than two species, though the dual-pump broadband CARS method has the capability of
measuring 3 or more species. The full-scale flow experiment revealed the CARS
instrument’s sensitivity to beam steering and defocusing caused by the free jet flow’s
index of refraction gradients and/or vibration of the instrument. The laboratory-scale
experiment identified the inability of the CARS instrument to measure in <500 K pure
H2. These listed issues and others (discussed in Section 4.5) inspired further
development of the CARS instrumentation. Also inspiring CARS instrument
development is the goal to apply CARS in ethylene (and ethylene/hydrogen mixture)

107
combustion flows. Measurements of the major species in these flows are desired to
understand the chemistry of a combustion flow fueled with cracked (chemically
disassociated) fuel, such as JP-7 [1] or JP-10 [2]. This chapter will briefly describe the
solutions considered, attempted, and developed to resolve these issues and meet the new
goal.
4.2 Data Analysis The data analysis used for the laboratory-scale measurements employed a library
interpolation method to fit spectra. This interpolation method reduced the time to process
spectra compared to CARSFT’s internal fitting method [3], but showed evidence of
inaccuracy at some conditions. As presented in Chapter 2, the library interpolation fitting
code sometimes returns unphysical results. To eliminate the inaccuracy caused by the
library interpolation fitting method, the fitting algorithm within CARSFT was used for
the full-scale measurements. Unfortunately, this method requires significant processing
time and only works well for three or fewer unknowns (temperature and two mole
fractions). To resolve these issues, a third fitting method was developed by Cutler et al.
[4]. The new fitting method uses a library interpolation method, but unlike the previous
method, produces accurate results by using a weight distribution function. This new
fitting method also reduces the processing time beyond the previous library method by
employing a sparse library interpolation. Ref. [4] includes further discussion about
CARS spectral fitting issues and this new fitting method.

108
4.3 Beam Movements and Defocusing In the full-scale flow, the prominent issues affecting the CARS measurements were
the laser beam movements and changes in focus caused by flow density gradients and/or
vibrations. These same effects were not seen in the laboratory-scale flow. The
laboratory-scale flow was ~1-2 cm in diameter and therefore the laser beams only passed
through the flow near their focus. The full-scale flow field is much larger and the laser
beams’ path through index of refraction gradients is much longer (6-20 cm), increasing
the beam steering effects [3]. Another difference from the laboratory-scale flow is that
the flow passes through the laser beams when they are far from their focus. This
increases the beam steering/defocusing effects because changes in gradients affect the
beams more when they are collimated [6]. The vibrations were larger for the full-scale
flow than the laboratory-scale flow, resulting in greater measurement susceptibility to
such vibrations in the full-scale environment.
Beam movements caused beam overlap reduction or elimination at the measurement
volume, resulting in loss of signal and therefore reduction in the CARS measurement
yield. To increase the occurrence of overlap of the beams in environments with large
changes in index of refraction, other phase matching geometries besides folded
BOXCARS can be used. Folded BOXCARS was used in these experiments to create a
small measurement volume and give the measurements high spatial resolution. There are
other phase matching geometries that are less likely to lose signal because of beam
steering or vibration. Unstable-resonator spatially enhanced detection (USED) CARS [7]
and collinear phase matching both send all of their laser beams down the same path and
therefore if the lasers encounter changes in index of refraction, then they change in

109
direction together, maintaining their overlap. But the large probe volumes / reduced
spatial resolutions of these geometries would decrease the capability of the instrument to
resolve turbulent flow structures. Planar BOXCARS [7], shown in Fig. 4.1, has lower
resolution than folded BOXCARS but offers some beam steering insensitivity. In planar
BOXCARS, two of the beams are almost collinear and the spatial resolution is adjustable
by the angle of the third laser beam. The collinear beams experience the same beam
steering effects, maintaining their overlap at the measurement volume. In the plane
formed by these laser beams and the third laser beam the overlap location may change
but the beams will remain overlapped. Out of this plane, beam steering may decrease the
overlap of the collinear beams with the third beam. To increase the chance of overlap in
the out of plane direction, a new phase matching technique was developed by Magnotti et
al. [8]. This new technique, referred to as beam shaping, is shown in Fig. 4.1.
Figure 4.1: Drawing of planar BOXCARS phase matching geometry. In detail is shown the beams at the intersection, for both round and elliptic green beam. Figure from Magnotti et al. [8].

110
In the beam shaping technique the third beam’s focus is shaped into an ellipse in the out
of plane direction and therefore increases the chance of overlap in this direction. Ref. [8]
describes the implementation and implications of this development.
Changes in focus of the signal and loss of the signal from the CARS signal beam
movement off of the collection optics (spectrometer, CCD, etc) are not resolved by the
planar BOXCARS beam shaping technique. To reduce both of these effects, propagation
of the change in focus and direction of the CARS signal must be reduced. In Chapter 3,
relay lenses were used to reduce beam deflection propagations from creation to collection
and showed reduction of the movement of the signal beam. However, the path was still
long enough to allow significant propagation of changes in direction and focus of the
signal beam. Changes in focus decreased the accuracy of the measurement of
temperature variation in the full-scale flow. These changes in focus would have also
caused inaccuracy in the mean temperature measurements if the focus of the signal beam
had been optimal. However, the signal was slightly out of focus, allowing changes in the
focus in both directions and thus avoiding a bias error. Defocused spectra have a reduced
resolution and therefore the precision and accuracy of the temperatures are reduced, as
discussed in Chapters 2 and 3. To increase the accuracy and precision of measurements
in a flow like the full-scale jet, the path length to the collection optics must be reduced.
Ways to reduce the length of this path include: using more relay lenses, moving the
collecting optics closer to the measurement volume [9] or collecting the signal after the
collimating lenses with a fiber optic cable. Fiber optics were used in Refs. [9] and [10] to
combat these effects.

111
4.4 “Cold” Hydrogen and Ethylene Combustion Products
In the laboratory scale flow, it was discovered that the CARS system was incapable
of measuring in “cold” (i.e. non-combustion temperatures) pure hydrogen. Two solutions
were suggested: add N2 to the injected fuel flow to avoid measuring flow containing only
hydrogen or modify the CARS system to measure lower energy H2 rotational lines.
During the full-scale experiment, the solution of adding N2 to the H2 co-flow was
attempted. Unfortunately, this resulted in a change in the character of the flow and could
not serve as a solution. Following the full-scale experiment, a new CARS system was
developed to include the measurement of lower energy hydrogen rotational lines. This
new CARS system, called WIDECARS, was also designed to enable measurement of all
the major species of ethylene combustion besides water. This meets the new goals of
characterizing ethylene and hydrogen fueled combustion. To create the WIDECARS
system, a new broadband dye laser was developed as described in Chapter 5. The design
and preliminary testing of WIDECARS are described in Chapter 6.
4.5 Other issues Others lessons learned about the CARS instrumentation during the experiments will
be implemented in future applications. In Chapter 2, it was explained that the broadband
energies of 1-8 mJ/pulse were too low to generate a signal-to-noise ratio adequate for
accurate and precise spectra fitting. Also, the spectral width of the broadband laser was
inadequate, decreasing the accuracy and precision of the mole fraction measurements.
All systems built after the one described in Chapter 2, including the system used in

112
Chapter 3, have a broadband laser with adequate width and energy output for making
measurements at the desired conditions. A lesson learned in Chapter 3 was that long,
complicated beam paths can lead to poor matching of the polarization direction of the
input laser beams within the measurement volume. This mismatch can create an
elliptically polarized signal, causing poor mole fraction accuracy. The solution
commonly implemented to minimize this problem is to place polarizers in each of the
beams directly prior to the measurement volume, as used in Refs. [9], [11], and [12].
Correct nonresonant referencing is critical to accurate CARS measurements;
therefore in Chapter 3 a new process to estimate the nonresonant reference for each
spectrum was developed. This new process corrects for frequency drifting of the
broadband dye laser over time by shifting the nonresonant spectrum the appropriate
amount for each run. To make this process accurate, it is necessary to first match in wave
number each spectrum to a spectrum taken with the same conditions as the argon
spectrum (having no major changes in index of refraction). All the solutions described in
this paragraph have been implemented in the CARS systems used to test WIDECARS
and beam shaping described in Chapter 6 and in Ref. [8], respectively.
4.6 Conclusion In conclusion, problems associated with the applications of CARS in the previous
chapters were indentified and solutions were developed. The remaining chapters will
describe the development and design of one of these solutions, WIDECARS.
WIDECARS uses the new data analysis method developed by Cutler et al. [4].
WIDECARS not only solves a previous instrumentation issue, but also increases the

113
types of gas species that can be measured, thus making the new goal of measuring in
ethylene combustion reachable.

114
REFERENCES
[1] R. W. Pitz, N. R. Grady, S. W. Shopoff, and S. Hu, “UV Raman Scattering Measurement of a Mach 2 Reacting Flow over a Piloted Cavity”, 46th AIAA Aerospace Sciences Meeting and Exhibit, Reno, NV, Jan., 2008.
[2] E. H. Andrews, “Scramjet Development and Testing in the United States”, AIAA/NAL-NASDA-ISAS 10th International Space Planes and Hypersonic Systems and Technologies Conference, April 24-27, 2001.
[3] R. E. Palmer, “The CARSFT Computer Code for Calculating Coherent Anti-Stokes Raman Spectra: User and Programmer Information,” Sandia National Laboratories Report SAND89-8206, Livermore, CA (1989).
[4] A. D. Cutler and G. Magnotti, "CARS Spectral Fitting of Multiple Resonant Species Using Sparse Libraries", 48th AIAA Aerospace Sciences Meeting Including the New Horizons Forum and Aerospace Exposition, Orlando, Florida, Jan. 4-7, 2010.
[5] L. P. Goss, D. D. Trump, B. G. MacDonald, and G.L. Switzer, “10-Hz coherent anti-Stokes Raman spectroscopy apparatus for turbulent combustion studies”, Rev. Sci. Instrum. 54, (1983).
[6] W. B. Rho, “Coherent Anti-Stokes Raman Scattering of Molecular Gasses”, Technical Report, AFAPL-TR-77-47, Wright-Patterson Air Force Base, Ohio, 1977.
[7] A. C. Eckbreth, Laser Diagnostics for Combustion Temperature and Species, Gordon & Breach, Amsterdam, Nederland, 1996.
[8] G. Magnotti, A. D. Cutler, P. M. Danehy, “Beam Shaping for CARS Measurements in Turbulent Environments”, 48th AIAA Aerospace Sciences Meeting Including the New Horizons Forum and Aerospace Exposition, Orlando, Florida, Jan. 4-7, 2010.
[9] K. Frederickson, S. P. Kearney, and T. W. Grasser, “Dual-Pump CARS Probing of Meter-Scale Turbulent Fires”, 46th AIAA Aerospace Sciences Meeting and Exhibit, Reno NV, Jan 7-10, 2008.
[10] M. W. Smith, O. Jarrett, Jr., R. R. Antcliff, G. B. Northam, A. D. Cutler, and D. J. Taylor, “Coherent Anti-Stokes Raman Spectroscopy Temperature Measurements in a Hydrogen-Fueled Supersonic Combustor”, Journal of Propulsion and Power, 9, 163-168 (1993).
[11] F. Beyrau, A. Datta , T. Seeger, and A. Leipertz, “Dual-pump CARS for the simultaneous detection of N2, O2, and CO in CH4 flames”, Journal of Raman Spectroscopy, 33, 919-924 (2002).
[12] F. Y. Yeuh, and E. J. Beiting, “Simultaneous N2, CO and H2 multiplex CARS measurements in combustion environments using a single dye laser”, Applied Optics, 27, 3233-3243 (1988).

115
CHAPTER 5
Characteristics of a Broadband Dye Laser Using Pyrromethene and Rhodamine dyes for WIDECARS
5.1 Introduction A new variation of dual-pump broadband CARS, called Width Increased Dual-Pump
Enhanced CARS (WIDECARS), described in detail in Chapter 6, was designed to
increase the number of species that can be measured simultaneously with CARS. This
CARS system requires a broadband dye laser with a full-width half-maximum (FWHM)
of 18 nm, from 592 to 610 nm, when pumped by a frequency-doubled Nd:YAG laser. To
the author’s knowledge there exists no other laser with these desired spectral attributes.
This chapter describes how this goal was reached and the attributes of the resulting laser.
The spectral attributes of the WIDECARS laser were not the only goals when
designing this laser for a practical application of CARS. Because the broadband dye
laser is only one component of the complicated setup that makes a CARS system, it is
desirable for the laser to be easy to maintain and have simple construction. Another
consideration was safety. Working in a hazardous environment increases the complexity

116
of daily operation for CARS system operators and increases their risk of injury. Also, the
energy output of the laser was desired to be similar to previously used broadband dye
lasers. Finally, to obtain accurate and precise measurements with the CARS system, the
laser needs to have stable spectral characteristics throughout the testing day (8 hours) and
as low as possible spectral noise (shot-to-shot variability).
This chapter will start with a brief explanation of lasers and then discuss more
specifically broadband dye lasers. A brief survey of other broadband dye lasers used by
other researchers will follow. The main body of this chapter will include a detailed
description of the experimental setup of a broadband dye laser and how its components
and changes in its components affect the characteristics of its output. These descriptions
are intended to allow others to be able to make a laser with their desired characteristics
and decide if this laser has acceptable attributes for their application. Specifically,
described are the effects that dye concentrations, transmittance of a spectrally selective
optic, and input energy (fluence) have on the efficiency, spectral bandwidth (FWHM),
range, and wavelengths of the laser. The effect of aging of the laser’s dyes will be
discussed for long exposures and long periods of no laser light exposure. Also included
will be a description of the spectral noise of the laser. This chapter will also describe in
detail how the spectral shape of the broadband dye laser for WIDECARS was reached
and how it can be maintained.
5.1.1 Lasers
The word laser stands for Light Amplification by Stimulated Emission of Radiation.
Lasers operate on the principle of amplifying stimulated emission. Materials that respond

117
to light with stimulated emission are used as gain media. These gain media are excited
(pumped) by a light source or electrical power. The gain media are placed between two
reflective surfaces, commonly mirrors, to amplify the stimulated emission. These
reflective surfaces build up the light by passing the stimulated emitted light back through
the gain medium producing more stimulated emission. This part of a laser is referred to
as the oscillator cavity. One of the reflective surfaces has partial transmittance and
allows some of the light to leave the oscillator; this optic is referred to as an output
coupler. After the light leaves the oscillator, if higher intensity or power of the light is
desired, then the light is passed through an amplifier. The amplifier is a gain medium
that is pumped by a light source. The light from the oscillator stimulates emission from
passing through the amplifier gain medium while another light source or electrical power
excites the gain medium. This results in an increase in the intensity of the light that was
emitted from the oscillator.
The frequency and intensity of the pumping source of the laser can affect the
frequency of the light emitted from the gain medium. Whether the excitation source of
light is continuous or pulsed will usually cause the output of the laser pump to be the
same. Continuous light sources typically have lower intensity than pulsed lasers;
therefore pulsed lasers are used for applications when higher intensity is required. Not
only are pulsed lasers commonly more powerful, they also offer the ability to make
measurements that have short time intervals. For example, a laser with a 10 ns pulse
length can make a measurement on the time scale that is short compared to the gas
mixing time scales in combustion. Consequently, many such measurements can be made
to determine the statistics of the turbulent fluctuations in the measured quantities, which

118
are useful in formulating mathematical models of the turbulence. For example, pulsed
lasers are used for CARS applications where the measured quantity changes quickly with
time, like supersonic combustion.
The wavelength of the light emitted from a laser depends on the gain medium. Laser
gain media emit wavelengths from the ultraviolet to the infrared. These gain media come
in many different forms, from solid-state where the gain medium is a doped solid crystal
to organic dye lasers where the gain medium is dissolved in a liquid solvent. A common
solid-state laser that is used for CARS is a Nd:YAG laser. Its gain medium is
neodymium and it produces output in the infrared, at 1064 nm. For CARS applications
this light is typically frequency doubled with a doubling crystal to 532 nm (green).
The oscillator cavities’ properties, for example, the reflective coatings of the mirrors,
affect the frequency of the light emitted from the laser. Although a gain medium may
produce stimulated emission over a range of wavelengths, the oscillator will fail to
amplify a given wavelength if an optic that forms the cavity has absorbance or low
reflectance for that wavelength. The oscillator will also fail to amplify wavelengths
corresponding to the wavelengths absorbed or reflected by an optic placed within the
cavity. Therefore, if a gain medium has a response that is broader than desired, spectrally
selective optics suppress the undesired wavelengths, while the desired wavelengths are
amplified. This is more efficient than rejecting the undesired wavelengths after the
oscillator, as more of the energy from the excitation source is converted to stimulated
emission of just the desired wavelengths. As explained in Refs. [1] and [2], the physical
mechanism that allows this efficient transfer of energy is the homogenous broadening of
dye lasers. The shaping efficiency depends on the selective optic’s transmission and the

119
spectral properties of the gain medium. Narrowband dye lasers use this principle to
narrow their gain media’s spectral output by replacing one of the mirrors with a grating,
and/or prisms.
5.1.2 Broadband Dye Lasers
Broadband dye lasers typically operate without a spectrally selective optic in their
oscillator cavity. This means that the bandwidth (FWHM) of the laser is determined by
the organic dyes that are used as a laser gain medium. The organic dye’s complicated
molecular structure generates a tightly-spaced energy spectrum which causes a
“broadband” response to light stimulation of the molecules [1], [3], [4]. Different types
of dyes and solvents can be selected and mixed to tune the laser to the desired
wavelengths for different applications. Broadband dye lasers are used in a wide range of
laser diagnostics applications such as degenerate four wave mixing (DFWM) [5], dye
laser amplified absorption spectroscopy (intracavity absorption) [6], [7], broadband
cavity enhanced absorption spectroscopy [8], and broadband CARS [5]. These
broadband dye lasers have a variety of wavelengths and a large range of attributes.
Table 5.1 has a representative collection of broadband dye lasers that have been
used for broadband CARS and are near the desired spectral bandwidth range (592-610
nm) for the WIDECARS laser. The table summarizes each laser’s FWHM, spectral
locations (center wavelength and location of bandwidth (FWHM)), oscillator dye gain
medium, and solvent. Commonly, the organic dyes used for this wavelength range are
Rhodamines because of their high efficiency and photostability [9]. The typical FWHM
of a Rhodamine broadband dye laser is 4-7 nm [10]-[14]. When mixed with other laser

120
Table 5.1 Summary of broadband dye lasers’ characteristics. Note only the dye concentrations in the oscillator dye cells are reported in this table. dyes the FWHM of the lasers can be slightly larger with a range of 4-10 nm [15]-[21].
A much broader FWHM of about 18 nm is desired for WIDECARS. A mixture of
Pyrromethene dyes offer a FWHM of ~45 nm from 565-610 nm, as demonstrated in Refs.
[22] and [23]. These lasers are broader than what is desired for WIDECARS but include
the wavelength range desired. Spectrally narrowing the emission will increase the energy
per wavelength for the desired wavelengths. This narrowing is accomplished in
narrowband dye lasers by using spectrally selective optics. So, by using a spectral
selective optic with a mixture of Pyrromethene dyes as a gain medium a broadband dye
laser with the desired spectral attributes for WIDECARS was generated.
5.2 Experimental Setup A diagram of the optical setup of the broadband dye laser is shown in Fig. 5.1. The
oscillator cell is side pumped (excited) by a frequency doubled Nd:YAG laser (532 nm)

121
Figure 5.1: Drawing of optical setup of the laser. All distances measured with an accuracy of ±0.5 cm. pulsed for 10 ns at a 10 Hz repetition rate. The average maximum input energy to the
oscillator cell is 37.9 ± 0.4 mJ. To maximize the conversion efficiency from the pump
laser to the emitted laser, the pump laser is expanded in the horizontal direction to use the
full length of the dye cell. This expansion is done with a 5.08 cm diameter concave
cylindrical lens of -12 cm focal length, placed 21±.5 cm from the front face of oscillator
cell. In the vertical direction the excitation light is focused with a 5.08 cm diameter,
convex cylindrical lens of focal length 15 cm, placed 12±0.5 cm from the oscillator cell.
This vertical focus increases the energy density overlap of the pump and oscillator laser
beams. Increasing this overlap increases the energy conversion efficiency. The convex

122
lens is mounted on a rotation mount so that the pump beam can be aligned with the path
of the oscillator beam. The cross section of the pump beam on the front face of the
oscillator cell is 22±1 mm by 4±1 mm.
The oscillator cavity is formed by a concave mirror and a convex output coupler.
This gives the oscillator cavity inherent stability for laser beam creation, allowing for
easy alignment. This design outputs a divergent beam. Therefore, the laser created by
this cavity design never reaches its focus which would be located outside the cavity
beyond the back mirror. This reduces the energy density within the cavity and therefore
the likelihood of burning optics. The cavity is constructed with a 0.5 m radius convex
back mirror and a 0.75 m radius concave output coupler, both with a diameter of 2.54 cm.
The curvature of these mirrors (R1 and R2) and the distance between them (d=24.5±0.5
cm) were chosen to create a stable cavity. These values satisfy the requirement for a
stable cavity as stated in Eq. 5.1 from Ref. [3] resulting in a value of 0.34.
0 < �1 − 𝑑𝑑𝑅𝑅1� �1 − 𝑑𝑑
𝑅𝑅2� < 1 5.1
In a stable cavity the beam creates a repeated path through the cavity allowing for the
buildup of stimulated emission in the gain medium. The output coupler’s coating is 50%
reflective and is centered at 589 nm. The back mirror has a coating centered at 600 nm
with a manufacturer reported reflectivity of greater than 99% for a 68 nm range. The
oscillator dye cell is placed between the mirrors nearer to the output coupler. This is
where the diameter of the oscillator beam is the largest allowing for a larger volume of
the gain medium to be used, therefore increasing the intensity output of the laser. The
dye cell dimensions are ~ 1.5 cm × 2 cm × 5 cm with its longest dimension perpendicular
with the pump beam and parallel to the oscillator beam. The dye cell’s walls are at

123
Brewster’s angle with respect to the propagation direction of the oscillator beam. Gain
media tested in this cell were a range of concentrations of Rhodamine 590, 610, and 640
in methanol and mixtures of these dyes. Also tested were a range of concentrations of
Pyrromethene 597 and 650 in ethanol and mixture of these dyes. Ethanol was chosen as
the solvent for the Pyrromethene dyes over methanol because they have higher solubility
[24] and higher photostability in air-saturated ethanol than in air-saturated methanol [25].
A spectrally-selective optic is placed within the oscillator, between the back mirror
and the oscillator dye cell. Depending on the type of optic used, mirror or filter, this
optic rejects or absorbs light of undesired wavelengths, respectively. The spectral region
of light that this optic rejects or absorbs suppresses the gain of the laser in that region.
This suppression allows increased gain in other spectral regions of the laser’s frequency
output operating on the same principle as tunable narrowband dye lasers. Just like
narrowband dye lasers, the frequency selective optic channels all the stored energy into a
narrower range of emission with low loss in power.
The rejection or absorption of light by an optic within an oscillator depends on its
transmission spectrum. Transmission spectra of optics tested in the laser cavity are
shown in Fig. 5.2. A thin film polarizer (TFP) from Rocky Mountain Instruments with
part number TP2607K060, centered at 600 nm, has transmission curves as shown in red.
This optic’s transmission spectrum depends on the angle of incidence (labeled as θ in Fig.
5.1) and the polarization of the incoming light. The solid, dashed, and dotted curves, in
Fig. 5.2, show the transmittance of the TFP for angle of incidences 60, 56, and 30
degrees, respectively. These curves were measured by the manufacturer. For each angle
of incidence the transmittance is different for parallel (P) and perpendicular (S)

124
Figure 5.2: Transmission curves for tested spectrally selective optics. polarization directions over a range of wavelengths. P polarized light is transmitted at
lower wavelengths than the S polarization, therefore separating the polarization of the
light in this wavelength range. When placing this optic in the cavity the S-polarized light
is rejected from the oscillator laser beam creating a P-polarized laser beam. Such an
optic can act both as a polarizer and a frequency-selective optic.
Another optic tested is a yellow mirror centered at 550 nm; its transmission curves
are shown in yellow in Fig. 5.2. These curves were measured with a spectraphotometer.
The transmission of the yellow mirror also depends on the angle of incidence as shown
by the difference between the solid, dashed, and dotted yellow curves. Optics with
transmittances that have dependence on the angle of incidence allow for the control of the
spectral shape of the laser output by changing of the angle of incidence. RG and OG

125
filters transmission curves are shown in Fig. 5.2 in orange. These filters’ transmittances
are not dependant on their angles of incidence as they filter light by absorption rather
than reflection.
The laser light from the oscillator cavity is passed through an amplifier cell 25.4±0.5
cm away from the output coupler. The amplifier cell’s dimensions are ~ 1 cm × 3 cm × 6
cm. It is oriented at Brewster’s angle with respect to the propagation of the laser light.
The laser is amplified in the cell with a mixture of Rhodamine dyes dissolved in
methanol and pumped by light from the Nd:YAG laser. The beams are crossed in the cell
at the smallest angle geometrically possible to maximize the overlap length in the cell and
therefore increase the energy conversion efficiency. The maximum energy of the
amplifier pump beam is 169 ± 1 mJ. To maximize the energy conversion, the cross
sections of the beams are matched using a 2.54 cm diameter cylindrical lens with a 2 m
focal length in the amplifier beam, placed 53±.5 cm from the amplifier cell. The cross
sections of the beams are approximately 1 cm2 as they enter the cell. So that the time
overlap of the pump and broadband laser beam in the amplifier dye cell is optimum for
energy conversion, the pump beam is delayed with a path 71±0.5 cm longer than the
broadband.
The oscillator measurements used to characterize the broadband dye laser were taken
between the output coupler and the amplifier dye cell. The amplifier measurements were
taken after the amplifier dye cell and a collimating lens. Energies were collected with a
pyroelectric detector power meter with a diffuser. The spectra were collected through a
fiber optic cable to a spectrometer with a 0.48 nm resolution. Energy efficiencies were
calculated using measured input and output energies in mJ. Spectral characteristics of

126
Figure 5.3: An example of a doubled peak spectrum demonstrating the type measurements made to characterize the spectral profile of the laser. the collected spectrum such as the FWHM (half maximum range), range (range of
wavelengths at which the intensity is greater than 10% of the maximum intensity), and
peak wavelengths were found using a code written specifically for this application.
Figure 5.3 shows an example of a spectrum and the characteristics that the code
determines (half maximum, range, and peak locations). Some of the collected spectra
were double peaked like the one in Fig. 5.3 and for these spectra two peak locations were
measured. If between the two peaks the intensity of the spectra fell below the 50% of the
maximum intensity, two half maximum ranges are collected – both based on the
maximum peak, as shown in Fig. 5.3. Similarly, two ranges were collected if the
intensity fell below 10% of the maximum peak.

127
5.3 Results and Discussion The wavelength, spectral shape, and efficiency of the laser are affected by every
component of the laser. Components of the laser tested and characterized in this section
are: dye type and concentration, the transmittance of the spectrally selective optics placed
within the cavity, pump energy (fluence), and age of the dye solution. The output of the
laser changes with age whether the gain medium is pumped by laser excitation light or
not. How each of these factors affects the FWHM (or half-maximum ranges), range
(range of wavelength greater that 10% of maximum intensity), efficiency, and
wavelengths of the oscillator output will be presented. Next, the effects of amplifier dye
type and concentration on the overall laser output will be presented and discussed.
Finally, to allow users to more fully assess whether this laser design is usable for their
application, the spectral noise of the laser will be reported. To illustrate how the results in
this chapter were used to design a laser with specific spectral characteristics, the
broadband dye laser for WIDECARS is used as an example throughout all discussions.
In the pursuit of the desired spectral characteristics for WIDECARS, a variety of
dyes and dye mixtures where tested to achieve the required 18 nm FWHM in the spectral
range 590-610 nm. Mixtures of Rhodamine dyes were tested first, because they are
desirable for their chemically safety and photostability [9]. The Rhodamine dyes with
emission within the desired spectral range (590-610 nm) are Rhodamine 590, 610, and
640 (abbreviated R590, R610, and R640 respectively). Solutions of these dyes by
themselves in methanol yielded a maximum FWHM of 7.2 nm. Two dye mixtures (R590
with R610 and R610 with R640) achieved a maximum FWHM of 9.4 nm with the
mixture of R610 and R640. This result was expected because the maximum reported

128
FWHM in Refs. [15]-[20] using the same two dye mixtures was 10 nm. These results are
presented in further detail in Fig. 5.4(a) in the next section. A mixture of all three dyes
was attempted but the mixture’s energy conversion efficiency decayed 35% after 4 hours
of being mixed and 62% after 22 hours with limited laser excitation exposure. This
decay appears to be caused by some sort of interaction between R590 and R640, also
reported by Ref. [26]. The other Rhodamine dye combinations showed no such decay in
this experiment or in others as reported in Refs. [16]-[21].
Because the desired spectral width for WIDECARS was not reached with the
Rhodamine dyes, other dyes and setups were investigated. In Ref. [28] two separate dye
cells were used with R590 and R610 to extend the tuning range of a narrowband dye laser
and could possibly create a wider broadband dye laser. This setup was not used as it
would add to complexity of the laser and would not meet the goal of a simple setup to
maintain. A mixture of R590 and 4-dicyanomethylene-2-methyl-6-p-
dimethylaminostyryl-4H-pyran (DCM) dyes might have been able to reach the desired
broadband spectrum as the narrowband laser output in Ref. [27] shows a wide tuning
range. But this mixture was not pursued because the hazardous nature of DCM would
decrease the ease of use of the laser. The other dyes available in the desired spectral
range with high efficiency, good photostability [29] are Pyrromethene dyes.
Unfortunately, these dyes aren’t as photostable as the Rhodamine dyes but they have
shown higher efficiencies [9]. Mostly importantly, Pyrromethene dyes have
demonstrated a wide spectral response with a broadband dye laser [22] that includes the
desired spectral range for WIDECARS. A range of concentrations of PM 597 and PM
650 in ethanol were tested along with a range of concentrations of mixture of these dyes.

129
5.3.1 Concentration
Before attempting to reach the WIDECARS goal, baseline measurements of each
dye of interest were made to determine their broadband lasing characteristics with
varying concentration. To understand the dependence of the oscillator’s spectral
bandwidth (FWHM), range, wavelengths, and efficiency on concentrations of the
Rhodamine and pure-Pyrromethene dyes a detailed study was conducted. The results of
this study can be seen in Fig. 5.4 (a-d). Figure 5.4 (a) shows the trend of the FWHM of
R610 and R640 to increase slightly with concentration whereas the FWHM of the
Figure 5.4: Trends of the characteristics of the laser versus dye concentration. PM 597 was tested at two different excitation energy efficiencies (indicated as high efficiency and low efficiency). Plotted against concentration are (a) FWHM, (b) range (greater than 10% above maximum intensity), (c) peak and half maximum locations, and (d) percent efficiency.

130
Pyrromethene (PM) dyes and R590 decrease with concentration. This same trend is
shown for R590 (Rhodamine 6G) in Ref [30]. The bandwidth changes with
concentration because of the re-absorption processes (described in the following
paragraph) and quantum yield reduction (losses from nonradiative deexcitation [4]) [31]
which increase with concentration. PM 650 has the largest FWHM for the range of tested
concentrations and is the only dye able to reach the needed size of the FWHM for
WIDECARS, indicated by a green line in Fig. 5.4 (a). Off the scale in Fig. 5.4 (a), the
largest FWHM of tested concentrations of PM 650 was ~54 nm at 52.55 mg/L is shown
by black lines in Fig. 5.4 (c). PM 597 dyes have the second largest FWHM in Fig. 5.4 (a)
and are broader that the Rhodamine dyes. This was expected as the PM 597 shows a
larger tuning range in narrowband laser operation in Ref. [24]. The range of the laser
profiles versus the concentration shown in Fig. 5.4 (b) tells a similar story as the FWHM,
except that the desired range can also be reached with low concentrations of PM 597.
The peak wavelengths versus oscillator dye concentrations are plotted with markers
in Fig. 5.4(c), while the corresponding wavelength locations of the FWHM are plotted
with solid lines. The peak wavelengths of the spectra shift to the red with increasing
concentrations of R610, R640, PM 650, and PM 597. This is due to the singlet-singlet re-
absorption (self absorption and re-emission) process as discussed in Ref. [32] and [33].
This process is a result of the frequency overlap of the absorption and emission bands of
the dye. In the overlap the light that is emitted by the dye is self-absorbed and re-emitted
to longer wavelengths. These longer wavelengths of light have a lower fluorescence
emission cross-section (probability of emitting) which leads to a reduction in the FWHM
and range of the laser profile, as noted in the previous paragraph. The desired 592 and

131
610 nm half maximum locations for WIDECARS are indicated in Fig. 5.4 (c) with green
lines. PM 650 is the only dye shown that can reach the desired width of 18 nm, but the
wavelengths at which the spectrum is above its half maximum are not 592-610 nm. This
leads to the conclusion that none of these dyes alone can reach the WIDECARS spectral
profile goal.
In Fig. 5.4 (d), the oscillator efficiency of all the dyes increases until an optimum
concentration is reached and then the efficiency levels off and eventually begins to
decrease. This trend is caused by two competing effects. The concentration increases the
efficiency of the laser by increasing the number of molecules available for stimulated
emission. This trend continues until the number of molecules quenches the available
excitation energy. Concurrently, the same re-absorption/re-emission effects that cause
the red shift of the spectra with dye concentration [31], [34] also decrease the efficiency.
As the concentration increases, more of the light is self-absorbed and re-emitted to longer
wavelengths with lower and lower emission cross-sections, eventually causing the
efficiency of the laser to decrease. The concentration for most efficient energy
conversion in the oscillator depends on how well the excitation beam overlaps with the
area of gain medium stimulated by reflected light from the mirrors. This dependence is
shown by the two measurements of PM 597 in Fig 5.4 (d). The triangles in Fig. 5.4 (d)
were measured with low area overlap while the circles show the measurements of a
higher area overlap of the light. The increased area of overlap increases the overall
efficiency and decreases the concentration for optimum energy conversion. All other
dyes in Fig. 5.4(d) were taken with the lower area overlap of the pump and generated
laser beams. The PM 597 is the most efficient of all the dyes and PM 650 is the least

132
efficient. Pyrromethene dyes have higher efficiency than the Rhodamine dyes because of
their lower probability of losing energy to mechanisms that don’t produce stimulated
emission. These reduced mechanisms of loss include lower intersystem crossing rates
[29], reduced triplet-triplet absorption cross sections [35], and lower aggregation
formation, which all lead to a higher fluorescence quantum yield [36] (increased
efficiency). PM 650 has efficiency that is atypical of Pyrromethene dyes because of an
extra non-radiative deactivation process formed with an intramolecular charge transfer
which is prominent in polar solvents such as ethanol [29]. Also PM 650 has a relatively
small Stokes shift (difference between peak absorption wavelength and the peak
fluorescence wavelength) [37], which increases its self-absorption and therefore
decreases its efficiency in comparison to other dyes.
Figure 5.5 shows the effect that adding relatively small amounts of PM 650 to higher
concentrations of PM 597 has on spectrum of the oscillator. These relative
concentrations (high PM 597 and low PM 650) were chosen to imitate the concentrations
used in Ref. [22], where a spectrum with a FWHM from 565 nm to 610 nm was obtained.
This range encompasses the desired wavelength range for WIDECARS (592-610 nm).
While the spectra in Ref. [22] was too wide, it was hypothesized that similar but different
ratios of dye concentrations could reach the desired WIDECARS spectrum. The spectral
output of pure PM 597 is shown as a curve with squares in Fig. 5.5 with a peak near 580
nm. As very small amounts of PM 650 (in relation to the PM 597 concentration) is added
to the mix, a second peak centered near 605 nm begins to emit and slowly increases in
intensity and shifts to the red. Also, the peak from the PM 597 to shifts to the blue. In
the mid PM 650 concentration range, a mixture is reached where the two peaks are high

133
Figure 5.5: The effect of adding PM 650 to PM 597 in the oscillator dye cell on the spectrum emitted from the oscillator. Shown as a solid thick line is the goal for WIDECARS.
enough to create the large range as in Ref. [22]. As the PM 650 concentration increases
further, the second peak becomes higher that the first and the entire spectrum shifts
toward the red due to self-absorption. At the highest concentration of PM 650 the first
peak from PM 597 has completely disappeared. This behavior of the dyes led to the
discovery that there exist no mixtures of Pyrromethene dyes that can, by themselves,
reach the desired FWHM in the wavelength range for WIDECARS, which is indicated in
Fig. 5.5 as green thick curve. Therefore to achieve the WIDECARS spectral goal, further
control of the spectrum, beyond dye concentration alone, is required.
The behavior of a PM 597 and PM 650 mixture can be explained by the acceptor-
donor behavior of some dye mixtures. If fluorescence bands of a dye (PM 597) and the
absorption band of another dye (PM 650) overlap, then energy can be transferred between
the dyes. The fluorescence of the donor dye (PM 597) is absorbed by the acceptor dye

134
(PM 650) which then fluoresces. This relationship is concentration dependant, as the
absorbance by the acceptor dye increases with concentration, the emission from the donor
decreases and the emission from the acceptor increases [38]. The acceptor-donor
behavior of a PM 597 and PM 650 dye mixture was also reported in Ref. [39].
Figure 5.6 (a-d) shows the effect of the concentration of PM 650 on FWHM, range,
peak locations, and efficiency on different concentrations of PM 597. As the
concentration of PM 650 increases, the FWHM remains relatively constant until in the
concentration range of 2-3 mg/L where the second peak raises above the half maximum.
Figure 5.6: Trends of the characteristics of the laser versus dye concentration of PM 650 for relatively constant concentrations of PM 597. Some dye mixtures were tested with different excitation energy efficiency. In (a) the closed symbols represent half maximum ranges of the emission peak from PM 597 and the open symbols represent half maximum ranges of the emission peak from PM 650.

135
This is the concentration range at which the acceptor dye (PM 650) is absorbing just
enough energy from the donor dye to make the emission peaks from both dyes similar
intensities. Similar peak heights occur at low concentrations of the acceptor because of
the high efficiency of the energy transfer from the donor to the acceptor. In this
concentration range of PM 650 dye, the maximum peak changes from the PM 597
emission to the PM 650 emission. This change in maximum emission is shown in Fig. 5.6
(a) by plotting the range of emission above the half maximum versus the concentration of
PM 650. In Fig. 5.6 (a) the solid filled markers represent the half maximum ranges from
the PM 597 emission and open markers represent the half maximum ranges from the PM
650 emission. The maximum peak change is a result of the energy transfer of the donor
to the acceptor which acts as a filter [40] reducing the emission from the donor. The
concentration of PM 650 at which this transition occurs is relatively independent of the
concentration of PM 597. This is because the fluorescence emission is independent of
the donor concentration (PM 597) as demonstrated in Refs. [38] and [41]. The efficiency
at which the laser is pumped (fluence in mJ/mm2), determined by the pump beam energy
and the size of generated beam and pump beam overlap, is also a factor that affects the
donor-acceptor behavior of this dye mixture. Shown in blue diamonds, the FWHM for
the higher area overlap (higher efficiency) increases the acceptor concentration required
to create a large enough emission from PM 650 to exceed the half maximum. None of
the dye mixtures tested in Fig. 5.6(a) reach the WIDECARS goal, indicated by a green
horizontal line. The two emission profiles never merged to form the one large FWHM
that was reported in Ref. [22], although the exact same dye mixture was tested. This may
be due to the different fluence of the lasers, or perhaps different reflectivity of the laser

136
cavity mirrors. Even if the two curves were to merge, the FWHM would exceed the
WIDECARS goal, not meet it. In summary, the FWHM of a spectrum created from PM
597 and PM 650 is either less than the WIDECARS goal, has two separate half-
maximum ranges, or has a much larger FWHM (using a laser configured as in Ref. [22]).
Figure 5.6 (b) shows the effect increasing PM 650 dye concentration has on the
range. The range increases when the concentration of PM 650 is high enough to create a
spectrum profile that includes emission from both dyes, as seen in Fig. 5.5. Fig. 5.6 (b)
shows that the concentration at which two emission peaks are present is relatively
independent of the PM 597 as indicated from the behavior of the FWHM in Fig. 5.6 (a).
However, the range is smaller for larger concentrations of PM 597. This is due to self-
absorption of the PM 597, which shifts the laser emission from this dye towards the red at
higher concentrations, decreasing the distance between the emission peaks (seen in Fig.
5.6 (c)). In Fig. 5.6 (c) the locations of the peaks are shown for increasing concentrations
of PM 650 at a range of PM 597 concentrations. If the spectrum has two peaks, two
markers are shown at the same PM 650 dye concentration. Increasing the PM 650
concentration shifts the PM 597 emission peak to the blue as it is absorbed by the PM
650. The PM 650 peak emission shifts to the red as self-absorption increases with
increasing PM 650 dye concentrations. Figure 5.6 (c) shows that the distance between
the emission peaks decreases with increasing PM 597 dye concentration. This decrease
occurs not only because of self-absorption of the PM 597 dye but also because the
emission peak from the PM 650 dye is shifted toward the blue with increasing PM 597
dye concentration. This blue shift occurs because the energy available to transfer from
PM 597 to PM 650 increases with increasing PM 597 dye concentration.

137
The effect of the efficiency of excitation is seen in Fig. 5.6 (b) and (c). In Fig. 5.6
(b), ranges shown with the blue outlines diamonds have similar concentration of PM 597
as the yellow diamonds but higher efficiency pumping (increased over lap of pumping
area and generated laser beam). The higher efficiency pumping that causes the increase
in range occurs at a higher concentration of PM 650. This same effect is seen in Fig. 5.6
(c) as the first occurrence of the second peak occurs at a higher concentration of PM 650,
when the pumping efficiency is higher.
Figure 5.6 (d) shows that the efficiency of the laser decreases with increasing
concentration of PM 650. As the PM 650 concentration increases, the higher-efficiency
PM 597 dye increases its donation of energy to the lower-efficiency PM 650. The rate of
the decrease in efficiency depends on the concentration of PM 597 and on the pumping
efficiency. The high-efficiency pumping data show a smaller dependence on PM 597 dye
concentration than the low efficiency pumping. The trends of the peak locations and
efficiency (for high efficiency pumping) dependence on PM 650 led to the pursuit of a
design of the laser that would have the lowest concentration of PM 650 as possible. This
would give the laser the highest efficiency possible, while create a spectrum with the
desired red side location of the half maximum for WIDECARS.
5.3.2 Spectrally Selective Optics
Spectrally-selective optics are commonly placed within laser cavities to produce a
narrowed spectral output. These optics reject wavelengths depending on their
transmission curves, suppressing gain for the wavelengths at which the optics have no
transmittance. The transmitted wavelengths have preferential gain; therefore a laser with

138
a desired spectrum can be created more efficiently than if the light is filtered outside the
cavity. In the previous section it was discovered that although the desired spectrum for
WIDECARS (592-610 nm) was unreachable using a combination of laser dyes alone, a
larger range could be reached (565-610 nm). Therefore, it was reasoned that the desired
spectrum could be created using a combination of dyes and a spectrally selective optic.
After testing a range of optics, the TFP centered at 600 nm was found to have a
transmittance curve that could create the WIDECARS spectrum while also polarizing the
laser output (as required for CARS). The TFP transmittance curve depends on the angle
of incidence and therefore the spectral output of the laser can be tuned by changing in the
angle of incidence. Figure 5.7 shows the spectral locations of the edges of the FWHM
(location of half-maximums) for increasing concentrations of PM 650, for no optic and
the TFP at a range of angles. All measurements for Fig. 5.7 where taken with the higher
overlap of pump and generated laser beam (higher efficiency pumping). Trend lines have
been added to the figure for the reader to see the trend better but have no physical
meaning. The shaded regions represent where the spectral intensity is greater than half of
the maximum. The cavity with no optic (shown in triangles) has an almost constant
FWHM that shifts to the blue as the PM 650 concentration increases. The blue shift
occurs with increasing PM 650 dye concentration because more emission from the PM
597 is absorbed by the PM 650. The angle of incidence of the TFP shifts the entire
spectrum to the red as the angle increases. The location of the half-maximum on the blue
side of the spectrum is mostly dependant on the TFP transmittance curve and changes
~2.6 nm/deg. This is because the blue side of the spectrum is emitted from the PM 597
dye and the location of its emission is almost independent of the PM 650 concentration,

139
Figure 5.7: The half-maximum wavelengths versus concentrations of PM 650 added to a ~50mg/L solution of PM 597 in ethanol at different angles of incidence of the spectral selective optic, TFP. Fitted curves are added to show the general trends of the half-maximum. The shaded regions are the wavelengths of the spectra that are above the half-maximum. Wavelengths of the WIDECARS half-maximum goals are shown as thick lines.
as seen in Fig. 5.6 (c). The red side of the FWHM shifts to the red with increasing PM
650. The red side of the FWHM also shifts to the red with decreasing angle of incidence,
but the dependence decreases as the concentration of PM 650 increases. At the higher
concentrations of PM 650, the gain that would have been transferred to higher
wavelengths by selective optic suppression is transferred via the energy transfer from
donor to acceptor dye. Using these relationships of the angle of the TFP and PM 650 dye
concentration to the half-maximum locations, the blue side of the spectrum can be shaped
with the selective optic and the concentration of PM 650 can be used to control the red

140
side of the spectrum. In this way, a spectrum with any desired FWHM from 6-40 nm can
be created, within the wavelength range from 570 nm-610 nm. The WIDECARS goals
for the half-maximum locations are shown in Figure 5.7 by vertical green lines and the
goals are met with concentration of PM 597 of 49.08 mg/L and PM 650 of 4.6 mg/L and
the TFP at an angle of 53 degrees.
Figure 5.8 (a) shows the dependence of the efficiency on the angle of incidence of
the TFP for the same range of concentrations of PM 650 as shown in Fig. 5.7. The
efficiency has the greatest dependence on the angle of incidence for pure PM 597 where
the efficiency increases with the angle of incidence. As the concentration of PM 650
increases, the efficiency depends less on the angle of incidence of the TFP. The
dependence on the angle decreases as wavelengths of the spectrum become more
dependent on the donor-acceptor energy transfer than the transmittance suppression of
the optic. At a concentration of 4.6 mg/L of PM 650 the efficiency is almost independent
of the angle of incidence.
Figure 5.8: Efficiency of oscillator versus TFP angle of incidence at a range of PM 650 concentrations added to a ~50 mg/L solution of PM 597 in ethanol is shown in (a). FWHM of oscillator versus TFP angle of incidence at a range of PM 650 concentrations added to a ~50 mg/L solution of PM 597 in ethanol is shown in (b).

141
Figure 5.8 (b) is another representation of the data shown in Fig. 5.7, plotting the
FWHM dependence on the angle of incidence of the TFP at different concentrations of
PM 650. Pure PM 597 shows the least dependence on the angle of incidence. As the
concentration of PM 650 increases, the FWHM increases. Also, dependence of the
FWHM on the angle of incidence of the TFP increases with higher concentrations of PM
650. In general, the FWHM increases with the angle of incidence. The higher
concentrations show a leveling off or sudden decrease in the FWHM for higher angles of
incidence. This change in trend occurs when the spectrum has two peaks and has
intensity in-between these peaks that is below the half-maximum.
While the TFP centered at 600 nm was found to be the best optic for WIDECARS
other optics may prove useful for other desired spectral profiles. A yellow mirror
(transmission curve shown in Fig. 5.2) was also tested as the selective optic. The circles
in Fig. 5.9 show the effect a range of yellow mirror angles have on a double-peaked dye
mixture of 91.92 mg/L PM 597 and 10.58 mg/L of PM 650 (not the same as the
WIDECARS mixture). For easier viewing, the measured values in Fig. 5.9 are fitted with
trend lines: the thin lines represent the range, the thickest lines are the FWHM, and
dashed lines are the peak wavelength. The lines with no markers show the spectral
profile of the dye mixture with no optic in the cavity. Interestingly, at an angle of
incidence of 40 degrees the yellow mirror suppresses the emitted spectrum in such a way
that the space between the two peaks is filled, creating a much wider spectrum. The
triangles in Fig. 5.9 show the effect of the TFP on this same dye mixture; note its
narrower spectra. The effect created by the yellow mirror hasn’t been as fully
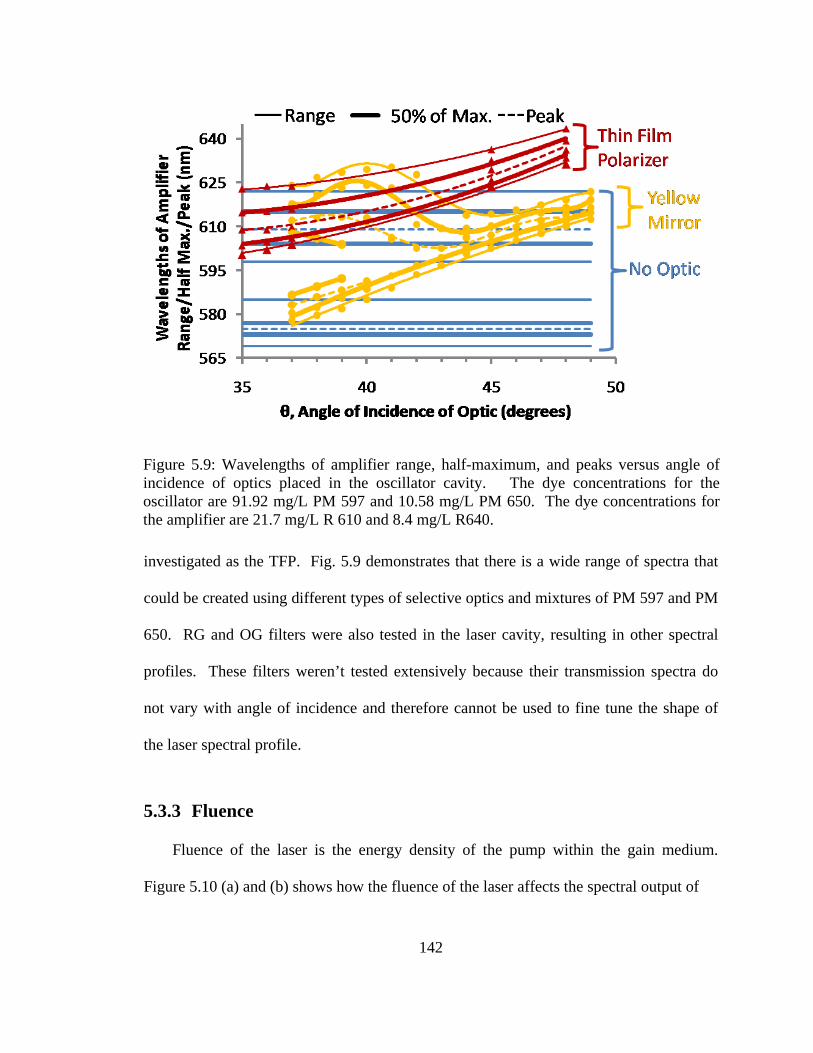
142
Figure 5.9: Wavelengths of amplifier range, half-maximum, and peaks versus angle of incidence of optics placed in the oscillator cavity. The dye concentrations for the oscillator are 91.92 mg/L PM 597 and 10.58 mg/L PM 650. The dye concentrations for the amplifier are 21.7 mg/L R 610 and 8.4 mg/L R640. investigated as the TFP. Fig. 5.9 demonstrates that there is a wide range of spectra that
could be created using different types of selective optics and mixtures of PM 597 and PM
650. RG and OG filters were also tested in the laser cavity, resulting in other spectral
profiles. These filters weren’t tested extensively because their transmission spectra do
not vary with angle of incidence and therefore cannot be used to fine tune the shape of
the laser spectral profile.
5.3.3 Fluence
Fluence of the laser is the energy density of the pump within the gain medium.
Figure 5.10 (a) and (b) shows how the fluence of the laser affects the spectral output of

143
Figure 5.10: Oscillator laser characteristics versus pumping efficiency measured as fluence (mJ/mm2). the laser. Increasing fluence increases the efficiency of the laser whether the gain
medium is pure PM 597 (triangles) or a mixture with PM 650 (the WIDECARS mixture
is shown in circles in Fig. 5.10). The fluence in Fig. 5.10 is controlled by changing the
power of the laser; where as in Fig. 5.4 above the fluence was controlled by a change in
the overlap of the pump and generated laser beams. The fluence used to pump the laser
has a minimal effect on the spectral profile of pure PM 597, as seen in Fig. 5.10 (b)
(triangles) and in Fig. 5.4 (a, b, and c) for concentrations ~50 mg/L. But when PM597 is
in a mixture with PM 650 its properties change as it becomes a donor for PM 650. The
effect of fluence on the spectral profile of a donor-acceptor mixture of PM 597 and PM
650 is shown in circles in Fig. 5.10 (b). The donor-acceptor energy transfer is highly
efficient therefore the acceptor dye emission quenched at a low fluence. As the fluence
increases, the remaining excitation energy, not transferred to the acceptor dye,
increasingly stimulates emission of the donor dye. The effect of this is shown in Fig.
5.10 (b) by a shift of the blue side of the spectrum further to the blue as the donor dye
emission begins to increase. As the donor dye increases it spectral output the acceptor

144
dye emission is consistent; therefore the FWHM and range of the spectrum increases.
This is the same as the effect seen in Fig. 5.6 (a-c) in the concentrations needed to create
emission peaks from the acceptor dye (PM 650). For example, in Fig. 5.6 (b), the lower
efficiency pumping required a smaller concentration of PM 650 to increase the range
because more of the donor’s emission was absorbed by the acceptor.
5.3.4 Amplifier
Rhodamine dyes were chosen as the gain medium for the amplifier because of their
good photostability [25]. Using dyes with good photostability reduces the need for
regular maintenance. Because this laser was designed to be used in an already high
maintenance CARS system, easy maintenance was included in the design goals. The
spectral profile of the light from the oscillator can be changed when passed through the
amplifier. This is demonstrated in Fig. 5.11 (a) and (b) which compare the wavelengths
Figure 5.11: Wavelengths of peak, half-maximums, and range from the amplifier for a range of concentrations of Rhodamine dyes. Shown in (a) are pure R640 solutions in methanol, while shown in (b) are mixtures of R610 and R640 in methanol.

145
of the peaks, half maximums, and ranges for spectra emitted from the oscillator to spectra
emitted from the amplifier. The oscillator dye mixture for the data presented in Fig. 5.11
is ~89 mg/L PM 597 and ~1 mg/L PM650 and was pumped in the low efficiency
configuration. Fig. 5.11 (a) compares spectra emitted from the oscillator with constant
concentration (open circles) to the amplifier (filled circles) for increasing concentrations
of R640 in methanol as the gain medium. When pure R640 dye was used in the
amplifier, the oscillator spectrum was narrowed. The amplified spectrum shifted to the
red with increasing R640 dye concentration. To reach the desired WIDECARS spectra
an amplifier gain medium was sought that would cause minimal narrowing. Mixtures of
R610 and R640 were found to cause less narrowing, and some results are shown in Fig.
5.11 (b). As a secondary consideration, the concentrations were also optimized for power
amplification. Using the dye mixture 49.08 mg/L PM 597 and 4.6 mg/L PM 650 with
high efficiency pumping in the oscillator the WIDECARS spectral profile was obtained
with the amplifier concentrations of 21.7 mg/L R610 and 8.4 mg/L R640. Compared to
the oscillator output, this mix creates a ~1 nm shift to the red with no narrowing. These
concentrations increased the oscillator energy output by ~2 times. Typical overall
efficiencies of the laser with the WIDECARS spectral profiles are 7-8%. These
efficiencies were calculated by finding the ratio of the overall output energy to the sum of
the pumping energy of the oscillator and the amplifier. Optimum concentrations for other
possible spectral profiles were not investigated.

146
5.3.5 Aging
The emission of lasers change with time (age), because of photodegradation when
exposed to light and because of chemical reactions in the dark. Photodegradation is a
reaction between a molecule and light that causes the molecule to breakdown (change in
structure). As the organic dye gain medium photodegrades, the concentration of
absorbing and emitting dye molecules decreases, changing the emission spectra just as a
change in concentration would. Pyrromethene dyes photodegrade faster than Rhodamine
dyes [25], [42]. Pyrromethene dyes’ predominant pathway of photodegradation is a
reaction with singlet oxygen [35]. When excited to the triplet state, Pyrromethene dyes
transfer energy to ground state oxygen (if present) and produce singlet oxygen [1]. The
dyes reaction with singlet oxygen leads to the breakdown of the dye molecular structure.
PM 650 dye tested in Ref. [29] and [44] showed a higher photostability than PM 597.
But Ref. [29] and [45] showed that in solvents with high electron-donor capacity, PM 650
decayed with age in the dark. Ethanol, the solvent used for this experiment, is not a high
capacity electron-donor, but there was a noticeable decay of the PM 650 dye emission
with age with only limited light exposure. Perhaps electrons are donated from another
source or another type of chemical reaction occurred. The decay observed may also be a
photodegradation as the solution was not stored in complete darkness.
In the mixture of the PM 650 and PM 597 dyes, the PM 650 photodegradation rate is
faster than PM 597, as observed by Ref. [39]. This faster rate is most likely caused by an
excited state electron energy transfer, as discussed for similar Pyrromethene dyes in Ref.
[46]. The electron energy transfer is from the excited state of the acceptor dye to the
ground state of the donor dye. The faster decay of the Pyrromethene acceptor dye may

147
be the cause of the decay of the PM 650 dye observed. This process could occur when
exposed to ambient light not just excitation light.
The change of photophysical attributes (laser emission spectra) was measured by
collecting the emission spectra of a solution of PM 597 and PM 650 over time for
multiple angles of the TFP. Using spectral attributes of the emission, such as locations of
the half maximums and range, the rate of their change in nm/day was collected. The
measured decay rates in nm/day were compared to the effect of varying the concentration
of PM 650 on the emission spectra (nm/(mg/L)) to obtain the rate of loss of emission
from the PM 650 dye in (mg/L)/day. The rate of loss of efficiency from
photodegradation, was not used for these measurements of PM 650 decay. This is
because the laser emission contains excited light from both dyes: the measured efficiency
is affected by both dyes. The efficiency of the laser increases as the PM 650 decays but
the efficiency from the PM 597 decreases with exposure.
The decay rate was measured under two conditions: one when the dye was measured
over a long period of time, 17 days, with minimal exposure to light and a second, where
the dye was exposed to excitation light continuously for a full testing day (~8 hours).
The first condition measured a loss of 0.19 (mg/L)/day of PM 650 concentration
emission. The second condition measured 1.13 (mg/L)/day decay of PM 650. Each of
these measurements includes the influence of the other. While the dye is exposed to
excitation light the mechanism causing decay without exposure to light excitation will
still occur. And the decay rate of dye without light exposure could not be measured
without exposing the dye to laser light. To minimize this effect the dye was exposed to

148
laser excitation light for as short as possible time periods when measuring the non-laser
light excitation decay rate.
These measured decay rates allow laser operators to estimate the amount of PM 650
to add to the solution to obtain a desired spectral output after the dye has decayed. For
example, if the dye mixture had the desired spectra output 2 days ago and was excited by
laser light for a total of 5 hours then to obtain the same spectral attributes 0.615 mg/L (2
days×0.19 (mg/L)/day + 5 hours×0.047 (mg/L)/hour) of PM 650 should be added.
The decay of PM 650 dye in the oscillator is also studied by measuring the change of
the lasers spectral profile after it passes through the amplifier. These amplified spectral
profiles are used to create CARS. Therefore the rates of change of these profiles
represent the rates of change experienced by the CARS spectra during an experiment.
The rate of change of the spectra from the amplifier in terms of decay of the PM 650 dye
in the oscillator are slower than from the oscillator. When minimally exposed to laser
excitation light decay rate of the spectrum was 0.16 (mg/L)/day. The decay rate
measured during exposure to excitation light continuously was 0.52 (mg/L)/day decay of
PM 650.
One of the goals of the WIDECARS laser was to have a spectral profile that was
constant for a typical testing day of 8 hours. To have accurate measurements with CARS,
the spectral profile of the broadband dye laser must be accurately characterized and
divided from the measured spectra. If changes of the broadband dye laser profile over
time are large, then the deconvolution will be lead to inaccurate CARS temperature and
concentration measurements. Small changes over time can be estimated to reduce errors
using the process discussed in Chapter 3. To assess if the spectral profile decay of the

149
WIDECARS laser is acceptable, the new laser’s non-resonant CARS spectra aging rates
have been compared to a non-resonant CARS spectra aging rates using the all-
Rhodamine broadband dye laser from Chapter 3. Because any change in the spectra is
important, including shifts in the spectra, the rate of decay was calculated using the shape
of the non-resonant spectra. The change in the shape of the spectra over time was
calculated by finding the average percentage difference of intensity per pixel between
normalized spectra taken at different times during a testing day. The rate of change in
shape for both types of lasers Rhodamine and WIDECARS were ~1% change per hour.
Although the rate of change of the WIDECARS is similar to the Rhodamine dye
laser which may be acceptable for some experiments, the more consistent the laser profile
over time the better the accuracy of the CARS measurement. The stability of the laser
profile could be improved by decreasing the photodegradation of the laser. Because the
photodegradation of the PM 650 dye is caused by singlet oxygen, it is possible to
decrease the rate of decay by adding singlet oxygen quenchers such as DABCO [42] and
[35]. No such additive was added to the laser described in the present work to avoid
decreasing the safety of the laser as DABCO is a chemical hazard. Another possible
solution to decrease the decay rate is to deoxygenate the dye mixture [42] and [25]. This
is less effective than chemical additive but still increases the half-life of the dyes [42].
While deoxygenating is hard to implement without any leaks in the large volume and
complicated circulation system [42], it would offer a less hazardous alternative. It was
mentioned earlier that lower Pyrromethene dye concentrations were chosen for the
WIDECARS laser because they lead to higher efficiency. Lower concentrations of

150
Pyrromethene dyes are also beneficial for photodegratation as the dyes will photodegrade
slower at lower concentrations as shown in Ref. [47].
5.3.6 Spectral Noise
The spectral noise (shot-to-shot variations) of a broadband dye laser profile can
affect the uncertainty of the measurement system in which it is applied. For CARS the
temperature and species concentration measurements uncertainties scale mainly with the
spectral noise in the broadband dye laser’s profile [48]. Change in the overall intensity of
the laser is not an issue when the CARS spectra are normalized during the data analysis
as they are for WIDECARS. The measured CARS spectrum includes shape of the
broadband dye laser. This shape is removed by first measuring gas that has no resonant
species in the CARS wavelength excitation range. The measured CARS spectrum is then
divided by this measured shape of the broadband dye laser. This shape is an averaged
spectrum and not measured for each laser pulse (camera shot). Therefore changes in the
shape of the laser shot-to-shot are not accounted for. This causes errors in the
deconvolution leading to shot-to-shot inaccuracy and increased uncertainty in the
measurements.
To assess the spectral noise (shot-to-shot variability) of this new laser, the standard
deviation in percent was calculated at each wavelength and is plotted in Fig. 5.12. The
spectrometer used to collect spectra used in the calculations for Fig. 5.12 is unable to
resolve the narrow mode structures of the dye laser. Therefore the modes in each
spectrum collected are averaged across many modes and the noise measured is decreased

151
from the actual noise. All measurements in 5.12 were made with the same resolution and
therefore offer accurate relative measurements of the spectral noise.
In Fig. 5.12 both the oscillator and amplifier averaged output and percentage
standard deviations are plotted. The amplifier has smaller deviations than the oscillator
output. To compare the standard deviations to a dye laser like the ones used in previous
chapters, a Rhodamine 610 broadband dye laser averaged output and relative standard
Figure 5.12: Relative standard deviation (standard deviation percentage) of a series of single-shot WIDECARS (Pyrromethene dye mixture in oscillator and Rhodamine dye mixture in amplifier) laser spectra and Rhodamine dye laser spectra. Relative standard deviation represents the spectral noise or shot-to-shot stability of the laser. Average spectral profiles of the dye laser are shown on a secondary axis.

152
deviation is shown. Comparing the standard deviations of the amplified WIDECARS
laser and the Rhodamine 610 laser at the peak of their spectrums, the WIDECARS laser
is more stable. The WIDECARS standard deviations minimum is just below 2%, where
the Rhodamine dyes lasers minimum standard deviations is just above 2%. Towards the
outside of the WIDECARS laser (590-595 nm and 605-610 nm) the standard deviations
are similar to the majority of the Rhodamine dye laser range (3-4%). Outside these
ranges the variation continues to gradually increase. These trends suggest that it is best to
use the peak of the spectrum and that WIDECARS laser will not introduce more
uncertainties than traditionally used Rhodamine dye lasers. The wavelength range of
reduced standard deviation for the WIDECARS is larger than for the narrower
Rhodamine dye laser. An unconventional “modeless” dye laser has shown to improve
precision of temperature measurements in single-pump CARS systems. These lasers
have reduced standard deviations in the peak of the dye laser profile down to ~1% as
reported in Ref. [19].
5.4 Conclusion In conclusion, a laser with the desired attributes for a WIDECARS system was
developed. A range of dyes for the gain medium were tested. The gain medium that
produced the desired results was a mixture of 49.08 mg/L PM 597 and 4.6 mg/L PM 650
for the oscillator and 21.7 mg/L R610 and 8.4 mg/L R640 for the amplifier. While this
mixture of PM 597 and PM 650 creates a laser output over the desired spectral range, the
profile created using these dyes does not have a FWHM of the desired width. Spectrally
selective optics were placed in the oscillator cavity to test if their transmission could

153
shape the broadband dye spectra to the desired laser profile. A TFP centered at 600 nm
and placed at an angle of incidence of 53 degrees was found to provide the desired
spectral shape, width and center wavelength. As a secondary consideration to the
desired laser spectral profile, oscillator and amplifier dye mixtures were chosen to have
maximum efficiency, though the resulting efficiency was lower than many other dye
lasers.
Other goals of the WIDECARS laser were achieved such as simple construction,
safety, and ease of maintenance. The laser has almost the same construction as a typical
broadband dye laser, only adding a selective optic in the cavity. The dye lasers offers no
more safety hazard than a typical broadband dye laser made with only Rhodamine dyes
because Pyrromethene dyes have similar safety guidelines. The PM 650 dye showed a
noticeable photodegradation rate over a testing day creating a change in the spectral
profile during the day. The rate of this change is similar to a broadband dye Rhodamine
dye laser. The PM 650 photodegradation rate has been quantified so the laser spectral
profile can be easy to maintain. A possible solution to make the photodegradation rate
slower is to deoxygenate the solution; this was not tested and could be pursued further.
The other components of the laser are identical to previously-used broadband dye lasers
and therefore will have similar maintenance requirements. The spectral noise was
slightly lower in comparison to Rhodamine broadband dye lasers predicting a similar
instrument uncertainty capability for CARS measurements.
While pursuing the WIDECARS laser spectral profile, other spectral profiles were
created. The results presented provide readers, who have different spectral requirements,
guidelines for reaching their goals within the capabilities of this general laser design.

154
Many other spectrally selective optics or dye combinations or fluences possible with this
laser setup were not tested but could be investigated in the future. For example, PM 597
and PM 650 were not tested as the amplifier gain mixture. While for WIDECARS this
may not be desirable, as it could lead to an increase in maintenance as these dyes
photodegrade faster, this may produce a new range of spectral profiles.
155
REFERENCES
[1] C. V. Shank, “ Physics of Dye Lasers”, Reviews of Modern Physics, 47, 649-657 (1975).
[2] G. Marowskey, “Principles of dye laser operation and dye laser tuning methods”, Optica Acta, 23, 855-872 (1976).
[3] W. T. Silfvast, Laser Fundementals 2nd ed.,Cambridge University Press, 2004. [4] J. P. Webb, “Tunable Organic Dye Lasers”, Analytical Chemistry, 44, 30-46 (1972). [5] A. C. Eckbreth, Laser Diagnostics for Combustion Temperature and Species
(Gordon & Breach, Amsterdam, Nederland, 1996. [6] W. D. Brobst and J. E. Allen, Jr. “Intracavity Absorption with a continuous wave
dye laser: quantification for a narrowband absorber”, Applied Optics, 26, 3663-3670 (1987).
[7] R. C. Spiker, Jr. and J. S. Shirk, “Quantitative Dye Laser Amplified Absorption Spectrometry”, Analytical Chemistry, 46, 572-574(1974).
[8] U. Platt, J. Meinen, D. Pohler, and T. Leisner, “Broadband Cavity Enhanced Differential Optical Absorption Spectroscopy (CE-DOAS) – applicability and corrections” Atmos. Meas. Tech. 2, 713-723 (2009).
[9] T. G. Pavlopoulos, “Scaling of dye lasers with improved laser dyes”, Progress in Quantum Electronics, 26, 193-224 (2002).
[10] R. R. Antcliff and O. Jarrett, Jr. "Multispecies coherent anti-Stokes Raman scattering instrument for turbulent combustion", Rev. Sci. Instrum., 58, 2075-2079 (1987).
[11] R. D. Hancock, K. E. Bertagnolli, and R. P. Lucht, "Nitrogen and Hydrogen CARS Temperature Measurements in a Hydrogen/ Air Flame Using a Near-Adiabatic Flat-Flame Burner", Combustion and Flame, 109, 323-331 (1997).
[12] S. R. Yang, J. R. Zhao, C.J. Sung, and G. Yu, "Multiplex CARS measurements in supersonic H2/air combustion", Applied Physics B, 68, 257-265 (1999).
[13] S. O'Byrne, P. M. Danehy, A. D. Cutler, "Dual-Pump CARS Thermometry and Species Concentration Measurements in a Supersonic Combustor", 42nd Aerospace Sciences Meeting and Exhibit, Reno, Nevada, Jan. 5-8, 2004.
[14] E. H. Veen and D. Roekaerts, "Thermometry for turbulent flames by coherent anti-Stokes Raman spectroscopy with simultaneous referencing to the modeless excitation profile", Applied Optics, 44, 6995-7004 (2005).
[15] F. Y. Yueh, and E. J. Beiting, "Simultaneous N2, CO, and H2 multiplex CARS measurements in combustion environments using a single dye laser", Applied Optics, 27, 3233-3243 (1988).
[16] F. Beyrau, T. Seeger, A. Malarski, and A. Leipertz, "Determination of temperatures and fuel/air ratios in an ethene-air flame by dual-pump CARS", J. Raman Spectrosc. 34, 946-951 (2003).
[17] K. Frederickson, S. P. Kearney, and T. W. Grasser, "Dual-Pump CARS Probing of Meter-Scale Turbulent Pool Fires", 45th AIAA Aerospace Sciences Meeting and Exhibit, Reno, NV, January, 7-10, 2008.

156
[18] F. Beyrau, A. Datta, T. Seeger, and A. Leipertz, "Dual-pump CARS for the simultaneous detection of N2, O2, and CO in CH4 flames", Journal of Raman Spectroscopy, 33, 919-924 (2002).
[19] J. Hult, "Construction of a modeless laser for applications in CARS spectroscopy", Master Thesis, Lund 1998.
[20] S. P. Kearney and M. N. Jackson, "Dual-Pump Coherent Anti-Stokes Raman Scattering Thermometry in Heavily Sooting Flames", AIAA Journal, 45, 2947-2956 (2007).
[21] A. Malarski, F. Beyrau, and A. Leipertz, "Interference effects of C2-radicals in nitrogen vibrational CARS thermometry using a frequency-doubled Nd:YAG laser", Journal of Raman Spectroscopy, 36, 102-108 (2004).
[22] D. V. Flores, "Analysis of Lean Premixed Turbulent Combustion Using Coherent Anti-Stokes Raman Spectroscopy Temperature Measurements", PhD dissertation, Chemical Engineering Department, Brigham Young University, 2003.
[23] J. K. Haslam and P. O. Hedman, “The Use of Two Pyrromethene Dyes in a Single Stokes Dye Laser to Make CARS Temperature and Multiple Species (CO, CO2, O2, and, N2) Concentration Measurements”, Fall Meeting of the Western States Section of the Combustion Institute, The University of Southern California, WSS/CI 96F-086, October 26-29, 1996.
[24] W. P. Partridge, N. M. Laurendeau, C. C. Johnson, and R. N. Seppel, “Performance of Pyrromethene 580 and 597 in a commercial Nd:YAG-pumped dye-laser system”, Opt. Letters, 19, 1630-1632 (1994).
[25] M. D. Rahn, T. A. King, A. A. Gorman, and I. Hamblett, “Photostability enhancement of Pyrromethene 567 and Perylene Orange in oxygen-free liquid and solid dye lasers”, Applied Optics, 36, 5862-5871 (1997).
[26] A. J. S. McGonigle, A. J. Andrews, G. P. Hogan, D. W. Coutts and, C.E. Webb, “A compact frequency-doubled 10-kHz PRF copper-vapour-laser-pumped dye laser”, Appl. Phys. B, 76, 307-311 (2003).
[27] S. Sinha, A. K. Ray, S. Kundu, Sasikumar, T. B. Pal, S. K. S. Nair, and K. Dasgupta, “Spectral characteristics of a binary dye-mixture laser”, Applied Optics, 41, 7006-7011 (2002).
[28] R. Khare and S. R. Daulatabad, “A non-mixing technique for enhancement of the tuning range of Rhodamine 6G using Rhodamine B”, Optics and Laser Technology, 36, 27-30 (2004).
[29] F. Lopez Arbeloa, J. Banuelos Prieto, V. Martinez Martinez, T. Arbeloa Lopez, and I. Lopez Arbeloa, “Intramolecular Charge Transfer in Pyrromethene Laser Dyes: Photophysical Behavior of PM 650”, Chem. Phys. Chem., 5, 1762-1771 (2004).
[30] P. Juramy, P. Flamant, and Y. H. Meyer, “Spectral Properties of Pulsed Dye Lasers”, IEE Journal of Quantum Electronics, 13, 855-865 (1977).
[31] P. Burlamachhi, R. Pratesi, and U. Vanni, “Tunable superradiant emission from a planar dye laser”, Applied Optics, 15, 2684-2689 (1976).
[32] G. I. Farmer, B. G. Huth, L. M. Taylor, and M. R. Kagan, “Concentration and Dye Length Dependence of Organic Dye Laser Spectra”, 8, 363-366 (1969).
[33] F. P. Schafer, Dye Lasers Second Revised Edition, Springer-Verlag, 1977.

157
[34] A. Costela, I. Garcia-Moreno, C. Gomez, F. Amat-Guerri, M. Liras, and R. Sastre, “Efficient and highly photostable solid-state dye lasers based on modified dipyrromethene.BF2 complexes incorporated into solid matrices of poly(methyl methacrylate)”, App. Phys. B., 76, 365-369 (2003).
[35] S. Mula, A. K. Ray, M. Banerjee, T. Chaudhuri, K. Dasgupta, and S. Chattopadhyay, “Design and Development of a New Pyrromethene Dye with Improved Photostability and Lasing Efficiency: Theoretical Rationalization of Photophysical and Photochemical Properties”, J. Org. Chem., 73, 2146-2154 (2008).
[36] T. Lopez Arbeloa, F. Lopez Arbeloa, I. Lopez Arbeloa, I. Garcia-Moreno, A. Costela, R. Sastre, and F. Amat-Guerri, “Correlations between photophysics and lasing properties of dipyrromethene-BF2 dyes in solution” Chemical Physics Letters, 315-321 (1999).
[37] M. F. Koldunov, Y. V. Kravchenko, A. A. Manenkov, and I. L. Pokotilo, “Relation between spectral and lasing properties for dyes of different classes”, Quantum Electronics, 34, 115-119 (2004).
[38] L. Liu, N. N. Barashkov, C. P. Palsule, S. Gangopadhyay, and W. L. Borst, “Intermolecular energy transfer in binary systems of dye polymers”, Journal of Applied Physics, 88, 4860-4870 (2000).
[39] M. Alvarez, F. Amat-Guerri, A. Costela, I. Garcia-Moreno, M. Liras, and R. Sastre, “Laser emission from mixtures of dipyrromethene dyes in liquid solution and in solid polymeric matrices”, Optics Communications, 267, 469-579 (2006).
[40] B. B. Raju and T. S. Varadarajan, “Energy transfer dye laser characteristics of a dye mixture using a new couramin dye as an acceptor”, Journal of Luminescence, 55, 49-54 (1993).
[41] Y. Kusumoto, H. Sato, K. Maeno, and S. Yahiro, “Energy Transfer Dye Laser: Confirmation of Energy Transfer by Reabsorption effect”, Chemical Physics Letters, 53, 388-390 (1978).
[42] A. K. Ray, S. Kundu, S. Sasikumar, C. S. Rao, S. Mula, S. Sinha, and K. Dasgupta, “Comparative laser performances of Pyrromethene 567 and Rhodamine 6G dyes in copper vapour laser pumped dye lasers”, Applied Physics B, 87, 483-488 (2007).
[43] G. Jones II, S. Kumar, O. Klueva, and D. Pacheco, “Photoinduced Electron Transfer for Pyrromethene Dyes”, J. Phys. Chem. A, 107, 8429-8434 (2003).
[44] G. Jones II, O. Klueva, S. Kumar, and D. Pacheco, “Photochemical and Lasing Properties of Pyrromethene Dyes”, Solid State Lasers X, SPIE, 4267 (2001)
[45] J. Banuelos Preito, T. Arbeloa, M. Liras, V. Martinez Martinez, and F. Lopez Arbeloa, “Concerning the color change of Pyrromethene 650 in electron-donor solvents”, J. of Photochem. and Photobio. A: Chemister, 184, 298-305 (2006).
[46] N. Tanaka and W. N. Sisk, “The photodegradation of Pyrromethene 567 and Pyrromethene 597 by Pyrromethene 546”, Journal of Photochemistry and Photobiology A: Chemistry, 172, 109-114 (2005).
[47] W. N. Sisk and W. Sanders, “The concentration dependence of the normalized photostability of 1,3,5,7,8-pentamethyl-2,6-di-t-butylpyrromethene-difluoroborate complex (PM 597) methanol solutions”, Journal of Photochemistry and Photobiology A: Chemistry, 167, 185-189 (2004).

158
[48] M. Pealat, P. Bouchardy, M. Lefebvre, and J.-P. Taran, “Precision of multiplex CARS temperature measurements”, Applied Optics, 24, 1012-1022 (1985).

159
CHAPTER 6
Width-Increased Dual-Pump Enhanced Coherent Anti-Stokes Raman Spectroscopy (WIDECARS)
6.1 Introduction Studies of hydrogen-fueled supersonic combustion free jet flows were measured with
a dual-pump broadband CARS system design by O’Byrne et al [1] to provide data for
CFD modelers, as discussed in Chapters 2 and 3. The CARS system developed by
O’Byrne et al. can measure temperature and species mole fractions of nitrogen, oxygen,
and hydrogen. Typically, CARS systems can only measure relative species
concentrations, but because all the major species present in the combustion flow (except
water, which is found by difference) were measured, absolute concentration
measurements could be made as discussed in Ref. [1].
Future studies are planned to revisit supersonic combustion flow with hydrogen fuel
and a mixture of ethylene and hydrogen fuel. Measurements of the major species in these
flows are desired to verify CFD models as in Ref. [2]. Ethylene combustion is

160
considered a method of obtaining understanding the more complicated chemistry of
combustion fueled with cracked JP-type fuels [1].
To fully characterize hydrogen and ethylene fueled flows, it is desirable to make
measurements of as many properties as possible for the full range of conditions within the
flow. In these flows, pure, room-temperature fuel is injected into the flow; therefore
some regions of the flow will contain only room temperature fuel (hydrogen and/or
ethylene). As discussed in Chapter 2, the O’Byrne et al. CARS system is incapable of
making measurements in pure, room temperature hydrogen. The O’Byrne et al. system
also is not ideal for measuring combustion of an ethylene-hydrogen fuel mixture because
it does not have the capability to measure any of the carbon species present in the flow
(CO2, C2H4, and CO).
Others have designed CARS systems that are closer to the desired measurement
attributes for these flows. The dual-pump CARS systems designed by Kearney et al. [4]
and Beyrau et al. [5] have measured many of the major species present in ethylene- and
hydrogen-fueled combustion. Additionally, the Kearney et al. system is capable of the
needed dynamic temperature range in pure hydrogen. Flores [6] designed a single pump
CARS system that can measure all major species in ethylene and hydrogen combustion
except water and that can also measure pure hydrogen from room temperature to flame
temperatures. In the present work, a new CARS system called Width Increased Dual-
pump Enhanced CARS (WIDECARS) [7] has been designed to improve on the Flores
system by using the dual-pump CARS technique [8]. The dual-pump CARS technique
simultaneously probes two spectral regions and produces a spectrally overlapped signal.
As a result, WIDECARS improves on the Flores system by increasing the possible

161
spectral resolution and the efficiency of phase matching, while maintaining the same
spectral coverage and similar signal intensity. A more detailed discussion of all these
above-mentioned systems and their comparison to WIDECARS will be included in the
following section.
WIDECARS is a dual-pump CARS method that employs a broadband dye laser with
a full width half maximum (FWHM) of ~18 nm. This spectral range is twice as wide as a
typical CARS broadband dye laser with a gain medium of Rhodamine dyes [1],[4],[5]
[8]-[10]. With WIDECARS, all probed species (N2, O2, H2, C2H4, CO, and CO2) are
measured simultaneously. This allows for a more complete characterization of the flow.
Because WIDECARS measures all the major species (besides water) present in
hydrogen-ethylene combustion, absolute species mole fractions can be measured, as
demonstrated by O’Byrne et al.
To demonstrate the measurement potential of WIDECARS, measurements were
made of gas mixtures containing the species WIDECARS was designed to measure. This
chapter includes a discussion of the design of WIDECARS, a comparison of the system’s
capabilities to those of the other existing CARS systems mentioned above, a description
of the experimental setup of WIDECARS, the results of measurements made with a
WIDECARS system in various gas mixtures, and the results of spectral fits to the
experimental data.
6.2 The Design of WIDECARS This section discusses how and why WIDECARS was designed. To better
understand the capabilities and limitations of WIDECARS, comparisons are made with
162
other similar CARS systems. WIDECARS has been designed to measure mole fractions
of all the major species (besides water) of supersonic combustion fueled with either pure
hydrogen or hydrogen mixed with ethylene. This design allows WIDECARS to make
absolute mole fraction measurements in these types of flows. The major species present
in these flows are nitrogen, oxygen, water, hydrogen, ethylene, carbon monoxide, and
carbon dioxide. Additionally, the system has been designed to be capable of making
these measurements at all conditions expected in the flow.
Traditionally, the CARS technique is performed with two pump lasers of the same
frequency and a third probing (Stokes) laser of a different frequency. This is sometimes
called single-pump CARS. The spectral region that CARS probes is determined by the
difference between the pump and probe frequencies. If the Stokes laser is broadband,
then a range of frequencies are probed. The dual-pump technique [8] uses lasers of three
different frequencies. This allows for two frequency combinations of pump and probe.
Therefore, dual-pump CARS simultaneously probes two spectral regions. This design
doubles the spectral range probed as compared to a single-pump system. WIDECARS is
a simple extension of the dual-pump CARS technique in which the bandwidth of the
Stokes laser is increased in order to expand the spectral coverage. More complicated
CARS techniques exist such as triple-pump CARS [10], dual-pump dual-broadband
CARS [11], and others [12], [13]. These techniques could possibly reach the design
requirements of WIDECARS, but the design of WIDECARS avoids the complexity of a
fourth laser beam and/or an additional or complicated detection system as required in
these CARS techniques.

163
Figure 6.1 shows the spectral region probed by WIDECARS (red solid and dashed
lines) and compares it to other similar CARS systems. The solid lines show the spectral
region probed by the broadband dye (Stokes) laser and Nd:YAG (pump) laser frequency
combination. For dual-pump techniques, the dashed lines represent the regions probed
by the broadband dye laser (Stokes) and narrowband dye laser (pump) frequency
combination. The Flores system, shown in black (circles), is not a dual-pump system, and
therefore only has one excitation region. The probed regions are drawn in the shape of
the spectral profile of the broadband dye laser from each CARS system and are plotted as
Figure 6.1: Other CARS techniques spectral probing regions compared to WIDECARS. The solid lines show the spectral region probed by the broadband dye (Stokes) laser and Nd:YAG (pump) laser frequency combination. For dual-pump techniques, the dashed lines represent the regions probed by the broadband dye laser (Stokes) and narrowband dye laser (pump) frequency combination. Flores did not use dual-pump CARS.

164
normalized probing energy versus wave number (Raman shift). The broadband dye laser
spectrum for each system was created using the dye solutions indicated in the legend of
Fig. 6.1 as the oscillator gain medium. Shown in Fig. 6.1 by green solid and dashed lines
(triangles), the CARS system used by Kearney et al. could have probed the same species
as WIDECARS except carbon monoxide. Although the C2H4 v(3) band is in the
detection range of the Kearney et al. system, it cannot be accurately measured due to
interference from the N2 line. As seen in Fig. 6.1, the relevant transitions of C2H4 v(3)
and N2 are associated with different Raman shifts. However, the frequency of the signal
associated with a given probed transition is a function of both this Raman shift and the
third laser’s frequency. For the Kearney et al. system, these frequency combinations
result in spectrally overlapped signals for these two transitions.
The blue solid and dashed lines with squares in Fig. 6.1 show the regions probed by
the CARS dual-pump system of Beyrau et al. While the Beyrau et al. system can
simultaneously detect all the same species as WIDECARS, it only detects half as many of
the vibrational spectral lines of carbon dioxide. Like the Kearney et al. system for the
C2H4 v(3) line, in the Beyrau et al. system the signal from the C2H4 v(2) band is directly
overlapped with the signal from the lowest energy nitrogen vibrational band and therefore
cannot be measured accurately.
The O’Byrne et al. dual-pump system probes the same region as the Kearney et al.
system depicted in Fig. 6.1 by the solid green curve with triangles. This region is probed
by the frequency combination of the Stokes laser and the Nd:YAG pump laser. However,
its probing region formed by the combination of the Stokes laser and the narrowband dye

165
pump laser frequencies is the same as the Beyrau et al. system (dashed blue with
squares).
In fuel-injected flows which WIDECARS is designed to measure, parts of the flow
contain pure fuel (hydrogen or a mixture of hydrogen and ethylene). These fuels are
injected at room temperature and therefore the system must be able to measure in pure
fuels at room temperature. In Fig. 6.2, the square root of the theoretical CARS signal
peak heights (signal strengths) of H2 S(3), H2 S(4), H2 S(5) and H2 S(6) in pure hydrogen
are plotted as a function of temperature (where the number in parentheses is the rotational
quantum number). The signal strengths of these S-branch lines were computed in a
Figure 6.2: Plot of the square root of the theoretical CARS signal peak height of rotational S-branch H2 lines as a function of temperature. The square root of the theoretical CARS signal peak heights were calculated in CARSFT with 100% hydrogen. The vertical black lines indicate the lowest temperature at which the H2 S(5) and H2 S(6) lines can be detected.

166
CARSFT code [14] that was modified as described in Ref. [1]. These S-branch spectral
lines are the most populated in the probing region of WIDECARS (shown in Fig. 6.1) for
the temperature range in which measurements will be made. Below ~450 K, as the
hydrogen gas temperature decreases towards room temperature, all these rotational
energy levels become less and less populated. This is indicated in Fig. 6.2 by a decrease
in the signal strength below ~450 K.
As the populations of the H2 rotational energy states decrease, the CARS signal
decreases and will eventually fall below the measurement limit of the CARS system.
This measurement limit is the level of signal below which the data analysis software
(CARSFT) cannot distinguish the signal from the noise. The measurement limit for
different CARS systems will vary with the amount of energy used to probe spectral lines
and with other attributes of each system such as detector sensitivity and noise, data
analysis method, etc. When the O’Byrne et al. system was used to make measurements in
supersonic combustion flow in Chapter 2, it showed a measurement limit lower bound of
peak height of 3 (square root of the theoretical signal in CARSFT). Square root of the
theoretical signal is used in CARSFT because species mole fractions typically scale with
the square root of the CARS signal. Using this measurement limit, the corresponding
lower bound of temperature of the H2 S(6) line is indicated by a vertical black dashed line
in Fig. 6.2. The H2 S(6) line is not populated enough to measure a CARS signal at
temperatures lower than 500 K.
Because of this lack of CARS signal at low temperatures, the O’Byrne et al.-design
system was unable to measure mole fractions or temperature in regions of the flow
containing nearly pure hydrogen fuel injected at around room temperature in Chapter 2.

167
The lowest rotational lines detected by the O’Byrne et al. system are H2 S(5) and H2 S(6).
In the regions of the flow below 500 K, the one detected spectral line of H2 S(5) was not
enough for the CARS signal analysis software (a modified CARSFT code) [1], [14] to
distinguish between temperature and concentration. Therefore, to make measurements of
temperature and mole fraction in pure hydrogen, a CARS spectrum must contain signal
from two H2 rotational spectral lines. In gas mixtures that contain more than just
hydrogen, the minimum requirements for measurements of temperature and mole fraction
of hydrogen are signal from one H2 rotational spectral line and a vibrational spectral band
from at least one other species.
The Beyrau et al. system has the same measurement limitation as the O’Byrne et al.
system: its two lowest energy H2 S branch lines detected are also H2 S(5) and H2 S(6).
The lowest energy rotational H2 lines detected by Kearney et al. are H2 S(4) and H2 S(5),
which allows for measurements in pure hydrogen down to ~275 K (below room
temperature). This is shown in Fig. 6.2 by the vertical solid black line indicating the
lower bound temperature measurement limit of the H2 S(5) line. However, with this
scheme at room temperature, measurements are just above the measurement limit, which
may result in noisy data.
The two lowest energy rotational hydrogen lines probed with WIDECARS are H2
S(3) and H2 S(4). The inclusion of H2 S(3) and H2 S(4) lines guarantees concentration
and temperature measurements down to room temperature in pure hydrogen. It also
allows for hydrogen detection in mixes of room temperature hydrogen and ethylene fuel.
In Fig. 6.3, the square root of theoretical CARS signal peak height at room temperature of
hydrogen S branch lines are plotted against hydrogen mole fraction where the balance

168
species is ethylene. The peak heights were calculated in CARSFT, using hydrogen as the
only resonant species and ethylene as the nonresonant background [15]. Estimating the
same lower bound measurement limit from the O’Byrne et al. system (i.e. square root of
the theoretical signal of 3), a black horizontal line is used to indicate the measurement
limit in Fig. 6.3. This estimate does not account for any changes in noise or other effects
that may raise or lower the measurement limit. The H2 S(4) line height is below the
measurement limit for mole fractions less than 0.50. Therefore, H2 S(3) is included in the
WIDECARS probing region to allow measurement of hydrogen concentrations down to
0.03 mole fraction in ethylene at room temperature.
A spectral or empirical model of the vibrational C2H4 v(3) band has not yet been
Figure 6.3: The square root of theoretical CARS signal peak height from CARSFT plotted as a function of the hydrogen mole fraction. This relationship is plotted for H2 S-branch lines at room temperature with a balance gas of ethylene. The measurement limit is a lower bound on the detectable peak height and was obtained from the application of the O’Byrne et al. system in a hydrogen fueled supersonic combustion flow.

169
developed for the CARSFT code to be used to analyze spectra measured with
WIDECARS. Because of the lack of an ethylene model it is possible that, in regions of
the flow containing room temperature fuel mix, the hydrogen rotational lines will be
needed to determine temperature. As shown in Fig. 6.3, the H2 S(3), H2 S(4) line
combination will be needed to measure temperature for mole fractions of hydrogen below
0.95. This line combination is predicted to work as a temperature gauge down to
hydrogen mole fractions of 0.50 in ethylene.
Shown in black (circles) in Fig. 6.1 is the probing region of the Flores system. This
system has the capability to detect the same spectral lines as WIDECARS. The Flores
system uses a ~40 nm FWHM dual-dye single-Stokes laser to cover the desired spectral
region. The Flores system does not use the dual-pump technique and therefore the
spectral range of the CARS signal is the same as that of the probed region. A feature of
dual-pump CARS is that signals originating from probing two spectral ranges are
overlapped on the CCD camera, resulting in wide spectral coverage simultaneous with
higher resolution. A disadvantage of this feature is that spectral lines can overlap, in
which case the difficulty of data analysis may be increased. If the same collection setup
used for WIDECARS were used for the Flores system, a grating with half the dispersion
would be required to disperse the full spectral range of the CARS signal on the CCD.
Therefore WIDECARS would have twice the spectral resolution as the Flores system.
On the other hand, WIDECARS’ increased broadband dye spectral range would mean a
decrease in its spectral resolution compared to the other dual-pump systems in Fig. 6.1.
Higher spectral resolution allows for increased accuracy of temperature measurements at

170
temperatures for which only the first energy level of the nitrogen vibrational spectrum is
populated.
Another limitation of the Flores system is the broadness of the spectral region
covered by the dual-dye single-Stokes laser, which reduces the efficiency of phase
matching for its full spectral probing region [6]. If phase matching is optimized for the
center wavelength of the broadband dye laser, then the efficiency of CARS signal
generation decreases with increasing difference from the center wavelength. Therefore,
the maximum losses of CARS signal occur for the spectra probed with the wavelengths
farthest from the center wavelength of the broadband dye laser. The largest losses of the
spectra probed by the Flores system are 21% for H2 S(3) and 14% for N2 . These losses
were calculated using the proportionality of the CARS signal intensity to:
�sin ∆𝑘𝑘𝑙𝑙
2∆𝑘𝑘𝑙𝑙
2
�2
6.1
as defined in Ref. [16], where Δk is the phase mismatch and ℓ is the length of the probe
volume (assumed to be 1.5 mm). The WIDECARS Stokes beam has half the spectral
width and therefore increases the efficiency of phase matching compared to the Flores
system. The maximum losses of signal due to phase mismatch for the spectra probed by
WIDECARS are 4.5% for H2 S(3) and 3% for O2, about 5 times lower than for the Flores
system. In comparison to the other dual-pump systems in Fig. 6.1, WIDECARS has a
larger spectral width; however, its phase matching efficiency at FWHM of the Stokes
laser is only ~2 % less.
Because WIDECARS uses the dual-pump technique, its potential signal strength is
decreased by a factor of four compared to the Flores system. But WIDECARS reduces

171
the spectral range of the broadband dye laser in comparison to the Flores system;
therefore, the energy available for probing each line is increased. Using the same
reasoning, the increased spectral range of WIDECARS over the other dual-pump systems
decreases its available probing energy by the ratio of the Stokes beams’ bandwidths. So
overall, WIDECARS has a similar signal strength potential as the Flores system and less
than the other dual-pump systems.
In summary, compared to the other dual-pump techniques featured in Fig. 6.1,
WIDECARS has the potential capability to more fully characterize hydrogen and
ethylene fueled supersonic combustion flows. This capability is achieved by increasing
the width of the broadband dye laser to include the measurement of all the desired species
concentrations and to increase the dynamic temperature range, enabling measurements in
room temperature fuel. However, the doubled spectral range of WIDECARS reduces the
possible resolution, the phase matching efficiency, and the overall signal strength when
compared to typical dual-pump systems. Compared to Flores’ single-pump CARS
system, WIDECARS has the same spectral coverage and similar signal strength, but
offers increased spectral resolution and improved phase matching efficiency. Other more
complicated CARS techniques [10]-[13] are available that could possibly measure the
same spectral lines as WIDECARS. WIDECARS offers an advantage over these systems
by maintaining a simpler optical setup. In conclusion, WIDECARS is a relatively simple
system that overcomes the limited spectral coverage offered by typical dual-pump
systems and the disadvantages of the Flores system.

172
6.3 Experimental Setup The experimental setup of WIDECARS is shown in Fig. 1.4 and consists of a
frequency doubled Nd:YAG laser (Spectra Physics DCR-4) (532 nm), a narrowband dye
laser (Spectra Physics PDL-2), and an in-house built broadband dye laser. The Nd:YAG
(green) laser serves as the pump energy for the narrowband dye and the broadband dye
laser. The Nd:YAG laser used for measurements presented in this chapter has a 10 Hz
repetition rate and produces 10 ns pulses with an output of 370 mJ. The narrowband dye
laser is centered at 556.8 nm (yellow) with a FWHM of 0.07 cm-1. The broadband dye
laser spectrum, shown by a red solid line in Fig. 6.4, is centered at 602.3 ± 0.1 nm (red)
and has a FWHM of 17.4 ± 0.1 nm with a range (10%-10% of maximum) of 26.6 ± 0.1
nm as measured with a spectrometer with a resolution of 0.48 nm.
The spectrum of the broadband dye laser is produced by using a mixture of
Pyrromethene dyes as oscillator gain medium, a mixture of Rhodamine dyes as the
amplifier gain medium, and a spectrally selective optic (thin film polarizer) within the
oscillator cavity. In the oscillator gain medium, the concentrations of Pyrromethene dyes
dissolved in ethanol are 49.08 mg/L PM 597 and 4.60 mg/L PM 650. This dye mixture
produces a spectrum that is shown in green circles in Fig. 6.4. A thin film polarizer (part
TP2607K060 from Rocky Mountain Instruments) placed inside the oscillator cavity
creates a spectrum of the desired shape, shown in orange squares in Fig. 6.4. The
polarizer is positioned between the back mirror and the gain medium at an angle of
incidence of 53 degrees. The thin film polarizer coating is centered at 600 nm. Its
transmission curve of unpolarized white light at 53 degrees is shown as a dashed blue line
in Fig. 6.4. The polarizer not only helps to shape the spectral output of the laser to the

173
desired spectrum but also rejects the unwanted polarization. The rectangular oscillator
dye cell is side pumped by the Nd:YAG laser with a fluence of 0.41 mJ/mm2. The energy
efficiency of the oscillator cavity is 21%. The amplifier gain medium is a mixture of
Rhodamine dyes with concentrations of 21.7 mg/L R610 and 8.4 mg/L R640 dissolved in
methanol. The amplifier shifts the spectral output of the oscillator ~1 nm to the red
producing the spectrum shown as a red solid line in Fig. 6.4. When the rectangular
amplifier dye cell is pumped longitudinally, with fluence of 1.6 mJ/mm2, the overall
energy efficiency of the laser is 8%.
The spectral output of the laser changes by < 1 nm in shape and location during a
Figure 6.4: The normalized amplitude of laser output versus wavelength. The green circle dotted line shows the spectral output of the oscillator of the broadband dye laser with no polarizer in the oscillator cavity. The orange square dotted line is the spectral output of the oscillator cavity containing the polarizer. The red solid line shows the spectral output of the broadband laser after amplification. The polarizer transmittance of unpolarized white light is shown in with a dashed blue line.

174
testing day (~8 hours). The spectral output from the PM 650 in the dye mixture slowly
decreases after several days whether or not the mixture is exposed to pump light. To
maintain the spectral output shown in red in Fig. 6.4, a small amount of PM 650
concentrate is added to the oscillator solution at the beginning of each testing day.
The three lasers are crossed in folded BOXCARS phase matching regime [16] to
create the CARS signal. The energies of the lasers, measured directly before the 400 mm
focal length beam-crossing lens, are 34 mJ from the Nd:YAG, 12 mJ from the
narrowband dye, and 17 mJ from the broadband dye. To demonstrate the detection range
of WIDECARS, a glass cell 100 mm in length and 1 inch in diameter was centered at the
measurement volume. Through the glass cell, room temperature gas mixtures (with
known concentrations) were flowed at 0.1 slpm flow rate. These commercially
purchased gas mixtures were chosen to contain as many of the species measurable by
WIDECARS as possible. The concentrations of the species in the mixtures where chosen
to test the predicted measurement limits. The concentrations in the mixtures were
certified to 1% of their measured value to verify the accuracy of the CARS system.
The CARS signal, generated in the glass cell, is reduced by a neutral density filter of
appropriate strength to prevent saturation on the CCD camera. Then the signal is
dispersed by a ¾ m spectrometer with an 1800 line/mm grating which offers half the
resolution and the spectrometers used in Chapters 2 and 3. The CARS signal is then
collected on to a 1 inch PixelVision (1100 × 300 pixel) CCD, producing a detector range
of ~20 nm or ~600 cm-1. This range is shown in Fig. 6.4 by vertical black lines. Black
diamonds in Fig. 6.4 show the frequencies of the broadband dye laser that will excite
resonant CARS transitions (spectral lines) when combined with the green laser

175
frequency. Black triangles in Fig. 6.4 represent the frequencies of the broadband dye
laser that will probe resonant CARS transitions when combined with the yellow
frequency laser. The detector range allows for collection of the species probed from O2 to
H2 S(3), but excludes the probed C2H4 v(2), H2 S(6), and H2 S(7) lines. All species
collected are within the FWHM of the broadband dye laser profile except H2 S(3), which
is placed at 40% of the maximum. Spectral lines are probed within the FWHM so that
the probing intensities are larger than the shot-to-shot spectral shape fluctuations of the
laser. These spectral shape fluctuations contribute to noise in the collected CARS
spectra, keeping the probing intensity large, in relation, increases the signal to noise ratio.
The H2 S(3) spectral line is placed slightly outside the FWHM as a strategy to
increase the dynamic range of WIDECARS. The H2 S(3) spectral line has a much larger
signal intensity than all other probed the spectral lines, especially at cold fuel conditions.
Probing the H2 S(3) line with less intensity reduces its signal intensity, which will reduce
the conditions at which this line will saturate the CCD. Also, this probing intensity
reduction will allow the other species to be collected with higher signal intensities,
increasing their signal-to-noise ratio. Because H2 S(3) has such a large signal intensity,
the slightly increased noise from probing it at 40% of the Stokes laser profile is predicted
to be minimal.
The spectra presented in the results have been processed by the following steps.
After collection on the CCD, the background is then subtracted from the signal. Then it
is divided by an averaged nonresonant spectrum, collected with argon gas in the glass
cell. This removes the spectral profile of the broadband dye laser from the CARS signal.
The square root of the data is taken, which makes the scale of the spectral lines

176
approximately proportional to their mole fraction. The spectra are then fit in a new code
and methodology developed by Cutler et al. [17]. The new code uses a library of
theoretical CARS spectra calculated in CARSFT. The fitting mode of CARSFT was not
used because it converges to results that depend on the initial conditions when fitting for
more than three species. The Cutler et al. code has demonstrated the capability to fit four
species at once. The ethylene spectral line is not fitted because, as previously mentioned,
a Raman spectral model for ethylene does not exist. In these fits, the ethylene spectral
line has been blocked and an estimated value of the nonresonant background
susceptibility was used from Ref. [15]. The addition of an empirical model of ethylene to
this code may be conducted in future work.
6.4 Results and Discussion A demonstration of the species detection capability of WIDECARS was performed
by taking measurements of gases slowly flowing through a glass cell. Sample results
from the demonstration are shown in Fig. 6.5 and Fig. 6.6. All measurements for this
demonstration were taken at room temperature.
The gas measured in Fig. 6.5 has a composition of 40% hydrogen, 1% carbon
dioxide, 1% carbon monoxide, 1% ethylene, and 57% nitrogen. The spectral lines visible
in Fig. 6.5 from left to right are: H2 S(3), H2 S(4), CO2 v(1), CO, C2H4 v(3), CO2 2 v(2)
and N2. This spectrum is a single-shot sample from a series of ~100 spectra. The fitted
compositions for this single-shot spectrum are 28% hydrogen, 1.7% carbon dioxide, 1.4%
carbon monoxide, and 67% nitrogen. Note that the ethylene composition cannot be fit

177
because of the lack of a theoretical model and so the ethylene resonant part of the
spectrum is omitted from the fitting. The mean value fitted results for a series of ~100
shots are 321±23 K, 30±6% hydrogen, 1.4±0.3% carbon dioxide, 1.1±0.6% carbon
monoxide, and 66±5% nitrogen. The uncertainties quoted with the means are the
standard deviations, given as a representation of the single-shot uncertainty in the
instrument. The mean composition fit to hydrogen is 25% low because of the same
modeling error as reported in Ref. [1], Chapter 2, and Chapter 3 (most likely incorrect H2
linewidths). Because the species mole fractions add to one (including nonresonant
species), the error in the hydrogen model creates errors in the concentration fits of all the
species. This is most notable in the species with the largest concentration (nitrogen)
which has a mean that is high by 14%. The standard deviation of the mole fraction of
Figure 6.5: Single-shot CARS spectrum of gas mixture 40% H2, 1% CO2, 1% CO, 1% C2H4, and 57% N2 at room temperature. The fit does not include C2H4.

178
hydrogen (6%) is larger than those reported in Ref. [1] of the O’Byrne et al. system
(~3%). This could be a result of noise from large variations of the broadband dye laser
intensity when probing the H2 S(3) line. As discussed in the previous section, the H2 S(3)
line is placed slightly outside the FWHM of the broadband dye laser. Just as the
hydrogen mean fit affects the means of the other species, it is expected to affect their
standard deviations, explaining the high nitrogen standard deviation of 5%.
In the CARS spectra, the nitrogen spectral line has the maximum intensity, which
was just below saturation when a neutral density filter of 47% intensity reduction was
used. This single-shot spectrum shows that H2 S(4) is detectable at 0.40 mole fraction,
which is slightly lower than the theoretical measurement limit of 0.50 mole fraction
predicted in Fig. 6.3. This spectrum also demonstrates that at room temperature, ethylene
will be detectable down to a 0.01 mole fraction.
In Fig. 6.6, another single-shot WIDECARS spectrum is shown measured in a gas
mixture with a composition of 3% hydrogen, 20% carbon dioxide, 8% carbon monoxide,
10% ethylene, and 59% nitrogen. The spectral lines visible in Fig. 6.6 from left to right
are: H2 S(3), CO2 v(1), CO, C2H4 v(3), CO2 2 v(2), and N2. When a neutral density filter
with 1% transmittance was used to reduce the CARS signal, the CO2 2 v(2) spectral line
was just below saturation. The fitted concentration results for this single-shot spectrum
are 2.9% hydrogen, 21% carbon dioxide, 8.6% carbon monoxide, and 59% nitrogen. The
fitted mean temperature from a series of ~100 shots is 276±34 K. The mean values of the
fitted concentrations are 1.8±3% hydrogen, 19±2% carbon dioxide, 9.4±1% carbon
monoxide, and 61±3% nitrogen. Because of the low concentration of hydrogen in this
gas mixture, the inaccuracy of the hydrogen mole fraction model has less effect on the

179
other species than in the previous gas mixture. Therefore, the mean values fitted for this
gas mixture are more accurate than the previous gas mixture presented. The mole
fraction standard deviations representing the single-shot uncertainties are comparable
(near 3%) to those reported in Ref. [1] of the O’Byrne et al. system.
This gas mixture contains a concentration of hydrogen at the previously predicted
measurement limit of H2 S(3) in Fig. 6.3. This measurement limit appears to be accurate:
Fig. 6.6 indicates that the H2 S(3) is almost indistinguishable from the noise. But the
measurement limit may actually be at a lower mole fraction, because the hydrogen mole
fraction fits to a value greater than a gas containing no hydrogen. Whether the hydrogen
mole fraction fit is to noise or to signal is difficult to assess. To further verify the
Figure 6.6: Single-shot CARS spectrum of gas mixture 3% H2, 20% CO2, 8% CO, 10% C2H4, and 59% N2 at room temperature. The fit does not include C2H4.

180
measurement limit, gases containing decreasing amounts of hydrogen mole fractions
could be measured and fit.
Figure 6.7 shows a single-shot measurement made at room temperature in a jet of
hydrogen and oxygen produced by a unlit water welder mixing with ambient air; detected
are the spectral lines H2 S(3), N2 , and O2 . To prevent an explosion, the measurements of
the water welder gases were made in the open air and not in the glass cell. Because these
measurements were made in open air, the concentrations of the shown spectrum are
unknown. The fitted results are 291 K for temperature and concentrations of 14% for
oxygen 42% for nitrogen, and 31% for hydrogen. Figures 6.5, 6.6, and 6.7 in
combination show all the species detectable with WIDECARS: nitrogen, oxygen,
hydrogen, ethylene, carbon monoxide, and carbon dioxide.
Figure 6.7: Single-shot CARS spectrum of unlit water welder gases mixing in air, concentrations unknown.

181
Higher temperature spectra of these gas mixtures were not collected because of
ventilation limitations of the laboratory in which this testing was performed. At higher
temperatures, there are other spectral lines that WIDECARS can detect that are not
shown in these results. These lines include H2 S(5) and higher energy lines from
vibrational bands of the other molecules. As the temperature of the gas species
increases, higher energy levels of the molecules will become increasingly populated.
Because the species’ spectra are tightly spaced, when the higher energy levels
become more populated, spectra of some species will become overlapped. Most species
combinations that have the potential to overlap, such as N2 and O2, C2H4 and CO, do not
coexist at high temperatures in combustion flows. N2 and CO2 2 (v2) spectra coexist at
high temperatures and therefore can have spectral overlap of their higher energy levels.
This overlap of spectra has the potential to increase the difficulty for a fitting code to
distinguish between the different species’ spectra. But Refs. [10], [18], and [19] mention
no difficulties in fitting this spectral overlap, perhaps because the spectral shapes of N2
and CO2 2 (v2) differ vastly.
If fits of higher temperature measurements with WIDECARS show that the conflict
of the N2 and CO2 2 (v2) spectra at higher temperatures is a problem, then a possible
solution is to change the placement of N2 and CO2 2 (v2) spectra. This can be done by
tuning the narrowband dye and the broadband dye to a different combination of
wavelengths that will place the N2 spectra in-between H2 S(3) and H2 S(4). This
alternative spectral arrangement places the CO spectra at the edge of the broadband dye
spectrum and may cause the loss of the capability to measure carbon monoxide.

182
Another potential problem with the current wavelength combination is the possible
interference between the spectral response of the C2 Swan band and N2 as seen in Ref.
[20]-[22]. Soot can be present in ethylene combustion. If soot is present in significant
quantities, a signal from the C2 Swan band will interfere with the nitrogen vibrational
signal. This will cause incorrect temperature fitting as shown in Ref. [22]. If significant
amounts of soot are present in the flow, this problem could be mitigated by using the
same previously mentioned alternative spectral arrangement. Unfortunately, the soot
signal is probed by the same frequency combination as oxygen. So while this alternative
arrangement would avoid overlap of the soot signal for all other spectra, oxygen
measurement would be confounded.
6.5 Conclusion WIDECARS can detect all major species in ethylene and hydrogen combustion
except water, which can be inferred by difference. This allows for absolute measurement
of species concentrations in these types of flows. WIDECARS’s inclusion of H2 S(3) and
H2 S(4) allows temperature measurement in pure hydrogen for the full temperature range
(room to flame temperature) and detection of hydrogen at room temperature for hydrogen
mole fractions as low as ~0.03. This allows for temperature and concentration
measurement in fuel injection zones. The measurement limits of WIDECARS for
hydrogen have currently only been approximated using theoretical signal levels from
CARSFT and the measurement limit from the O’Byrne et al. CARS system. The slowly
flowing glass cell measurements did not fully verify the lower bound limit of the
system’s ability to measure hydrogen concentration at room temperature. The actual

183
measurement limits need to be assessed using more gas mixtures with known small
concentrations of hydrogen and fitting the measured spectra. For WIDECARS to make
absolute measurements in ethylene combustion, a theoretical or empirical model for
ethylene must be developed and incorporated into the fitting code.
WIDECARS has currently only been tested on room temperature gases. Next,
WIDECARS must be tested for the full range of temperatures in a calibration flame (e. g.
a Hencken burner). If the spectral overlap of nitrogen and carbon dioxide causes poor
fitting at high temperatures or signal from soot causes interference with the nitrogen
signal, a slightly different arrangement of wavelengths of the lasers may be
advantageous. WIDECARS has been demonstrated to have the capability to detect
nitrogen, oxygen, hydrogen, ethylene, carbon monoxide, and carbon dioxide
simultaneously; therefore, this system has the potential to be very useful for
measurements of supersonic ethylene and hydrogen combustion flows.

184
REFERENCES
[1] S. O'Byrne, P. M. Danehy, A. D. Cutler, and S. A. Tedder, "Dual-Pump Coherent Anti-Stokes Raman Scattering Measurements in a Supersonic Combustor " AIAA J. 45, 922-933 (2007).
[2] P. Keistler and H. A. Hassan, “Simulation of Supersonic Combustion Involving H2/Air and C2H4/Air” AIAA-2009-28, 47th AIAA Aerospace Sciences Meeting, Orlando, Florida, Jan. 5-8, 2009.
[3] R. W. Pitz, N. R. Grady, S. W. Shopoff, and S. Hu, “UV Raman Scattering Measurement of a Mach 2 Reacting Flow over a Piloted Cavity”, 46th AIAA Aerospace Sciences Meeting and Exhibit, Reno, NV, Jan., 2008.
[4] S. P. Kearney, K. Frederickson, and T. W. Grasser, "Dual-pump coherent anti-Stokes Raman scattering thermometry in a sooting turbulent pool fire" Proceedings of the Combustion Institute. 32, 871-878 (2009).
[5] F. Beyrau, A. Datta, T. Seeger, and A. Leipertz, "Dual-pump CARS for the simultaneous detection of N2, O2 and CO in CH4 flames" J. of Raman Spec. 33, 919-924 (2002).
[6] D. V. Flores, "Analysis of Lean Premixed Turbulent Combustion Using Coherent Anti-Stokes Raman Spectroscopy Temperature Measurements" PhD dissertation, Chemical Engineering Department, Brigham Young University, 2003.
[7] S. A. Tedder, J. L. Wheeler, A. D. Cutler, and P. M. Danehy, "Width Increased Dual-pump Enhanced CARS", Applied Optics, 49, 1305-1313, 2010.
[8] R. P. Lucht, "Three-laser coherent anti-Stokes Raman scattering measurements of two species" Opt. Lett. 12, S. 78-80 (1987).
[9] F. Y. Yueh and E. J. Beiting, "Simultaneous N2, CO, and H2 multiplex CARS measurements in combustion environments using a signal dye laser", Applied Optics, 27, 3233-3243 (1988).
[10] S. Roy, M. S. Brown, V. N. Velur, R. P. Lucht, and J. R. Gord, "Triple-pump coherent anti-Stokes Raman scattering (CARS): temperature and multiple-species concentration measurements in reacting flows" Opt. Comm. 224, 131-137 (2003).
[11] M. C. Weikl, “Development of a simplified dual-pump dual-broadband coherent anti-Raman scattering system" Applied Optics. 48, 43-50 (2008).
[12] T. J. Anderson and A. C. Eckbreth, "Simultaneous Coherent Anti-Stokes Raman Spectroscopy Measurements in Hydrogen-Fueled Supersonic Combustion", J. Propulsion. 8, 7-15 (1992).
[13] A. C. Eckbreth, T. J. Anderson, and G. M. Dobbs, "Multi-Color CARS for Hydrogen-Fueled Scramjet Applications" Applied Physics B. 45, 215-223 (1988).
[14] R. E. Palmer, "The CARSFT computer code for calculating coherent anti-Stoke Raman spectra: user and programmer information", Report SAND89-8206, Sandia National Laboratories, Livermore, CA (1989).
[15] D. R. Snelling, A. A. Sawchuck, and T. Parameswaran, "Measurements of the total third-order nonresonant susceptibilities of C3H8, CO2, and C2H4, and their application to N2 CARS thermometry", Applied Optics, 32, 7546-7550 (1993).

185
[16] A. C. Eckbreth, Laser Diagnostics for Combustion Temperature and Species (Gordon & Breach, Amsterdam, Nederland, 1996).
[17] A. D. Cutler and G. Magnotti, "CARS Spectral Fitting of Multiple Resonant Species Using Sparse Libraries", 48th AIAA Aerospace Sciences Meeting Including the New Horizons Forum and Aerospace Exposition, Orlando, Florida, Jan. 4-7, 2010.
[18] S. Roy, T. R. Meyer, R. P. Lucht, V. M. Belovich, E. Corporan, and J. R. Gord, "Temperature and CO2 concentration measurements in the exhaust stream of a liquid-fueled combustor using dual-pump coherent anti-Stokes Raman scattering (CARS) spectroscopy", Combustion and Flame. 138, 273-274 (2004).
[19] T. R. Meyer, S. Roy, R. P. Lucht, and J. R. Gord "Dual-pump dual-broadband CARS for exhaust-gas and CO2-O2-N2 mole-fraction measurements in model gas-turbine combustors", Combustion and Flame. 142, 52-61 (2005).
[20] S. Kearney and M. N. Jackson, "Dual-Pump Coherent Anti-Stokes Raman Scattering Thermometry in Heavily Sooting Flames", AIAA Journal. 45, 2947-2956 (2007).
[21] C. Brackmann, J. Bood, P. Bengtsson, T. Seeger, M. Schenk, and A. Leipertz, "Simultaneous vibrational and pure rotational coherent anti-Stokes Raman spectroscopy for temperature and multispecies concentration measurements demonstrated in sooting flames", Applied Optics, 41, 564-572 (2002).
[22] A. Malarski, F. Beyrau, and A. Leipertz, "Interference effects of C2-radicals in nitrogen vibrational CARS thermometry using a frequency-doubled Nd:YAG laser", J. Raman Spectrosc., 36, 102-108 (2005).

186
CHAPTER 7
Conclusion and Recommendations
7.1 Conclusion
Advancements in CARS instrumentation have been made by developing solutions to
problems identified when measuring in supersonic combustion flows. More specifically,
resolutions to issues relevant to measurement of open flame hydrogen supersonic
combustion have been found. Further advancements have been made by indentifying a
new goal: measuring the concentration of the species present in ethylene and hydrogen
fueled supersonic combustion (surrogate fuel mixture that represents cracked JP-type
fuels [1]). This new goal is met by a newly designed dual-pump broadband CARS
system, WIDECARS. This CARS system can measure the absolute concentration all of
the major species (except water) in ethylene and/or hydrogen combustion. In a single-
shot spectrum, this system can simultaneously measure the vibrational bands of N2, O2,
CO, CO2, and C2H4 and the rotational lines of H2. Using the low-energy rotational lines
H2 S(3) and H2 S(4), WIDECARS can measure down to ~275 K in pure hydrogen,
resolving the previous system’s inability to measure in less than ~500 K pure hydrogen.

187
Although designed for supersonic hydrogen and ethylene combustion flows, WIDECARS
could be used to further the understanding of other types of combustion flows fueled with
hydrogen and/or ethylene, or even carbon monoxide. WIDECARS can offer relative
species measurement of combustion of other carbon fuels. Like other CARS systems,
WIDECARS will be the most advantageous measurement technique for ducted flows
with limited optical access, such as jet engines, supersonic combustors, and scramjet
engines. A WIDECARS system offers the novel capability to characterize the species
and temperature means, variances and co-variances in all locations of ducted or open
hydrogen and/or ethylene combustion flows. For flow containing only high temperature
hydrogen combustion gases, the CARS system as used in Chapter 2 and 3 is
recommended because this system offers twice the resolution as the WIDECARS system,
potentially improving the precision of the temperature measurement.
While building the WIDECARS system, a new laser was developed to cover a
previously unattainable spectral profile with a FWHM from 592 nm - 610 nm. The
maintenance, construction, safety, and spectral variance of this new laser are similar to
the commonly used Rhodamine broadband dye lasers. This indicates the WIDECARS
laser will not increase the practical difficulties of application nor decrease the accuracy or
precision of the measurements. A variety of configurations (optics and dyes) were tested
to reach the desired laser spectral profile, leading to the discovery of other possible
profiles. These other laser profiles may be used for other CARS systems or other
measurement techniques needing a laser with a broad profile. One of the interesting
features of the laser was the creation of double-peaked spectra that may prove useful for
other applications of CARS or other spectroscopic techniques.

188
7.2 Recommendations
7.2.1 Supersonic Combustion CARS Instrumentation
Using the lessons learned and strategies applied in these measurements, a picture of
the best CARS system for measurements in supersonic combustion was developed.
Following is a list of recommendations for a CARS system for applications to supersonic
combustion:
• Use the WIDECARS technique for ethylene and combined
ethylene/hydrogen fueled flows and hydrogen fueled flows containing low
temperature (<~500 K) pure hydrogen. This will allow measurement of all
major species in the flows, except water, in all locations and conditions of the
flow.
• As much as possible, move the instrumentation away from the harsh
environment of the flow facility to reduce changes to the system during the
experiments.
• Make instrumentation exposed to harsh testing environments rigid and robust
to reduce susceptibility to vibrations.
• Automate or enable remote control of as many optical adjustments as
possible for limited access experiments.
• Use the planar BOXCARS phase matching regime combined with the beam
shaping technique [2] to increase the measurement yield while maintaining a
high spatial resolution for applications with two types of issues. Planar
BOXCARS will be most useful for applications in which the flow field

189
passes through the laser beams far from their focus and applications in which
the optics and structures are exposed to large vibrations.
• Reduce the path length of the CARS signal to combat decreases in accuracy
and precision owing to beam steering/defocusing or vibrations.
• Spread the signal over two or more bins of the CCD camera to increase
dynamic temperature range.
• Eliminate background luminosity from the combustion by using a polarizer
and a shutter in the CARS signal path. The shutter should have a small gate
(on the order of the laser pulse duration) and run at the same repetition rate as
the laser.
The following list includes recommendations that are not only useful for CARS
system designed for supersonic combustion measurement, but for all CARS systems:
• Use the newly written sparse library data analysis method [3] for accurate
results with reduced processing time.
• Increase accuracy by sampling the nonresonant spectrum as often as possible.
For resonant spectra collected between nonresonant spectra, correct for drift
of the nonresonant using an interpolated estimate from nonresonants taken
some time before and after the measurement. Prior to removing the
nonresonant profile from the spectra, first shift all CARS spectra so that they
are aligned in wave numbers.
• Use a linear polarizer placed in the path of each of the input beams near the
focusing lens and the CARS signal beam to assure accurate mole fraction
measurements.

190
• Use a broadband dye laser with adequate energy and frequency width for
adequate signal-to-noise for accurate measurements of all species.
• Modeless dye lasers do not offer reduced spectral variations for the full
spectral range. Therefore, use of a modeless dye laser may not be
advantageous for all species of multiplex systems.
7.2.2 Future Development of CARS Instrumentation
Although many issues and developments were discussed and resolved in this work,
there are still issues to investigate and improvements that can be made. Further
development and testing of the WIDECARS system is required before application to a
full-scale supersonic flow is made. To date, WIDECARS has only been performed at
room temperature. The next step to validate WIDECARS as an instrument is to apply the
system to a predictable flat flame burner such as a Hencken burner. Application of such a
flame will verify the system’s capability to measure temperature and mole fractions in
high temperature environments. Hydrogen and possibly carbon monoxide fuel flames
could then be tested. The capability of WIDECARS in a hydrogen flame should be tested
in series with the previous dual-pump CARS system, offering a one-to-one comparison of
overall system performance.
Before testing in an ethylene flame, an empirical model of ethylene band v(3) must be
developed. The empirical model development can be accomplished by the measuring
C2H2 v(3) spectral band in a heated test cell over a range of concentrations and
temperatures. Also needed for ethylene measurements is an accurate measurement of the
nonresonant background susceptibility of ethylene. After acquiring measurements of the

191
ethylene spectral attributes and nonresonant contributions, WIDECARS can be tested in
an ethylene fueled calibration flame.
After initial testing in an ethylene mixture, the presence of soot and its contribution to
the signal should be investigated. If signal from the soot interferes with the signal
significantly, alternative spectral arrangements of the WIDECARS system should be
explored. Other background light reaching the CCD due to luminosity of the ethylene or
hydrogen flames should be checked. Schemes to eliminate such background light from
the collected signal should be explored.
Even before the ethylene model is created, WIDECARS could be tested in a
hydrogen fueled laboratory-scale supersonic combustion flow. This will test the system’s
capability to measure in low temperature pure hydrogen. During this test, the effects of
combining WIDECARS with the beam shaping technique [2] could be explored. Further
testing in a laboratory-scale flame should be done with ethylene fuels to test for any soot
signal or other luminosity not seen in Hencken flame tests. After preliminary testing,
experiments could be performed in the flow of the full-scale axi-symmetric open jet
supersonic combustion nozzle fueled with an ethylene/hydrogen mixture to obtain means,
variances, and covariances of temperature and species concentrations. These
measurements could be made in parallel with the IRS system to measure up to three
components of velocity. These measurements would provide CFD modelers with data
for validating, verifying and creating new models of the flow’s chemistry and mixing
properties.
The WIDECARS broadband dye laser’s capabilities should be further explored.
Testing additional Rhodamine dye concentrations and combinations in the amplifier

192
could lead to a more efficient laser. The photodegradation of the Pyrromethene dyes is
faster than Rhodamine dyes; therefore ways of decreasing the decay rate should be
explored. The Pyrromethene dyes might be stabilized by adding oxygen absorbers to the
dye solvent or purging oxygen from the dye circulation system.
An error in the modeling of the hydrogen has lead to a 10-15% low measurement of
the concentration of hydrogen for all presented experiments. This modeling error is
believed to be from the use of incorrect linewidths within CARSFT. CARSFT currently
uses only the hydrogen line width measured from the Q branch lines. This should be
replaced with S branch measured linewidths to see if this corrects the error.
Considering possible future needs for measurement of supersonic combustion, other
spectral arrangements of the CARS system’s lasers could be used to measure other
desired species. If hydrogen-only combustion is a focus, an alternative spectral
arrangement to measure water and the vibrational band of hydrogen, along with nitrogen
and oxygen, could be used to measure all the present major species. This new spectral
arrangement could be achieved by using a narrowband dye laser near 485 nm and a
broadband dye laser from 580-610 nm (achievable with Pyrromethene dyes). Other
spectra lines of interest that lie within the WIDECARS spectral range could be explored
for future applications. These spectral lines include: CH4 (v2), C2H6 (v6), (v8), and (v11),
C3H6 v10 , C3H8 (v11+v5) and SO2 (v3),(v1).
Other improvements that could be explored are ways to decrease the beam focusing
effects due to density gradients in the flow, increase the dynamic temperature range, and
to increase the resolution of the spectra (to increase the temperature accuracy at low
temperatures). Delivering the input laser beams to the measurement volume with fiber

193
optics could reduce the optics and structures required. The use of fiber optics could avoid
beam movements caused by vibrations of the structures holding the optics. Collecting the
signal through a fiber optic could decrease variations in the focus of the signal caused by
beam steering or structural changes [4].

194
REFERENCES
[1] R. W. Pitz, N. R. Grady, S. W. Shopoff, and S. Hu, “UV Raman Scattering Measurement of a Mach 2 Reacting Flow over a Piloted Cavity”, 46th AIAA Aerospace Sciences Meeting and Exhibit, Reno, NV, Jan., 2008.
[2] G. Magnotti, A. D. Cutler, and P. M. Danehy, “Beam Shaping for CARS Measurements in Turbulent Environments”, 48th AIAA Aerospace Sciences Meeting Including the New Horizons Forum and Aerospace Exposition, Orlando, Florida, Jan. 4-7, 2010.
[3] A. D. Cutler and G. Magnotti, "CARS Spectral Fitting of Multiple Resonant Species Using Sparse Libraries", 48th AIAA Aerospace Sciences Meeting Including the New Horizons Forum and Aerospace Exposition, Orlando, Florida, Jan. 4-7, 2010.
[4] M. W. Smith, O. Jarrett, Jr., R. R. Antcliff, G. B. Northam, A. D. Cutler, and D. J. Taylor, “Coherent Anti-Stokes Raman Spectroscopy Temperature Measurements in a Hydrogen-Fueled Supersonic Combustor”, Journal of Propulsion and Power, 9, 163-168 (1993).

195
APPENDIX A
Determination of Probe Volume Dimensions in Coherent Measurement Techniques
The following was published in Applied Optics, Vol. 47, Issue 35, pp.6601-6605 in
2008 with coauthors Markus C. Weikl, Thomas Seeger, and Alfred Leipertz.
Abstract
When investigating combustion phenomena with pump-probe techniques, the spatial
resolution is given by the overlapping region of the laser beams and thus defines the
probe volume size. The size of this probe volume becomes important when the length
scales of interest are on the same order or smaller. In this work, we present a new
approach to measure the probe volume in three dimensions (3-D), which can be used to
determine the probe volume length, diameter, and shape. The optical arrangement and
data evaluation are demonstrated for a dual-pump dual-broadband coherent anti-Stokes
Raman scattering (CARS) setup which is used for combustion diagnostics. This new
approach offers a simple, quick alternative with more capabilities than formerly used
probe volume measurement methods.

196
Introduction
Coherent nonlinear laser based measurement techniques such as coherent anti-Stokes
Raman scattering (CARS) [1-3], laser-induced gratings (LIGS) [4, 5], degenerate four
wave mixing (DFWM) [6, 7], polarization spectroscopy (PS) [6, 8] and others usually
generate their signal in a region defined by the overlapping region of two or more laser
beams. The beam overlap, commonly referred to as the probe volume, is an elongated
ellipsoid and in theoretical calculations is normally approximated by a cylinder of length
L and diameter d. The size of this probe volume defines the spatial resolution of the
measurement technique and becomes important when the length scales of interest are on
the same order or smaller, e.g. in turbulent combustion. Most of the following
descriptions are derived from the CARS technique but are mostly also true for other
nonlinear techniques.
There exist several methods to measure the probe volume including:
a) Traversing a glass slide with thickness t<L and monitoring the level of the non-
resonant signal generated in the glass plate in order to measure the probe volume
length [9, 10].
b) Moving a knife-edge at different positions along the focus and monitoring the
intensity of the transmitted laser beams.
c) Traversing a thin gas jet along the probe volume [1].
Each of these methods has limitations. For the first two listed methods the probe
volume determination cannot be performed at full laser power used during measurements.
This is due to destruction of the object, i.e. glass plate or knife edge, which is moved

197
along the focused beams. Hence, either lower laser power needs to be used or a part of
the beams has to be sampled which, for method a) involves guiding the generated signal
along a different path to the detection system. For the third listed method the thin gas jet
is practically hard to achieve, especially when matching the size of small probe volumes
on the order of 1 mm. The most often used method is a) which is not applicable in stray-
light sensitive techniques like LIGS, PS, DFWM or pure rotational CARS.
In this work we present a new method to determine the probe volume dimensions.
This method has more capabilities than the previous mentioned methods, including probe
volume determination at full measurement laser power and three-dimensional (3-D)
modeling of the probe volume. Additionally this method is useful for combined
measurement techniques where the overlap of the two probe volumes has to be verified.
A disadvantage of this new method is that an online probe volume determination during
the CARS measurements is not possible, because the beam sampler slightly changes the
positions of the transmitted beams and therefore the overlap. The beams could also be
focused and sampled after the collimating lens allowing for online measurement.
However, the aim of accurate probe volume dimension measurement is hindered by a
variation of the beam positions due to the additional optics and beam steering from the
measured combustion gases.
In order to demonstrate all the capabilities of the new method it was applied to a
combined dual-pump vibrational and dual-broadband pure rotational CARS system.
Based on this example we will describe the optical setup, the data acquisition and the
evaluation procedure. Finally, we will present the resulting 3-D model of the probe
volume and probe volume length measurements. One of these probe volume length

198
measurements will be compared to a glass slide measurement, to assess the accuracy of
this new method.
Optical Setup, Phase-Matching, and Data Collection
A visualization of the radial intensity distribution of the beam overlap region using a
CCD camera has been demonstrated by Doerk et al. [11] and recently a beam viewing
system for the alignment and real-time monitoring of a simultaneous CARS-Rayleigh
experiment was presented [12]. These approaches were used as a base for the optical
setup of the probe volume measurement method. This setup differs from the beam
viewing system with respect to the beam sampling location. Since we do not use the
system for real-time monitoring, we only sample the beams during the time the probe
volume measurement is conducted
The optical setup is shown in Fig. A.1. A beam sampler, placed directly after the
focusing lens, directs ~7% of the energy of the laser beams to a common intersection
point. The beam sampler has no coating on the front surface, is wedged at an angle of
30 arcmin to eliminate internal interference fringes, and is anti-reflective coated on the
backside to reduce ghosting. Furthermore, its front surface is specified with a flatness of
λ/10 to minimize changes to the wave front characteristics. To further reduce the intensity
of the light, the beams collected with the beam sampler are passed through neutral
density filters which are selected to avoid saturation on the camera. Next, in the optical

199
setup near the focus, the beams are passed through an achromatic 4X-microscope
objective which magnifies the beams on a CCD camera which was timed to collect one
laser pulse per image. The CCD camera is mounted on a micrometer slide which allows
movement along the beam path, indicated in Fig. A.1 as the z-direction, so that images
can be collected throughout the length of the focus. The images were verified to have
minimal changes to wave front characteristics due to the beam sampler and neutral
density filters. This was done by correspondence of optimum beam overlap in the images
with maximum CARS signal with the beam sampler removed.
In order to demonstrate the advantages of this system, it was applied to a dual-pump
dual-broadband CARS setup using a folded BOXCARS phases matching geometry
shown in Fig. A.2. The distance of the beams from the center of the lens was 7 mm
(2xNd_YAG, green, 532 nm), 8.85 mm (broadband dye-laser, red, 683 nm) and 7.75 mm
(narrowband dye-laser, orange, 589 nm). A focusing lens of f=400 mm is used. In this
Figure A.1: Experimental setup of probe volume measurement technique.

200
phase matching arrangement a pure rotational CARS signal (generated by both red and
green beams) is collected along with a vibrational CARS signal (generated by the top red,
orange, and green beams). An additional CARS signal is also generated in a planar phase
matching regime (generated by red aligned with orange and green beams). Although this
signal is not collected, its probe volume can be measured for comparison to folded
BOXCARS phase matching.
The data are collected, at full measurement power, by taking an image of each beam
(while other beams are blocked) at z locations along the beam path. To illustrate the
variation of the laser beams in Fig. A.3 images near the focus at 0mm, and far away at
+10 mm and -9 mm are shown. Normally, only imaging in a region of 4 mm around the
focal point is necessary.
Figure A.2: Illustration of the dual-pump dual-broadband folded BOXCARS phase matching scheme used to demonstrate the new technique for probe volume measurements.

201
Images are collected at equally spaced locations along the z direction at least 0.25
mm apart. To ensure that the entire probe volume is measured the collection of data
begins at a location where no overlap of the beams is visible and continues in the z
direction until the same condition is met again. These images are then used in the
processing steps presented in the next 2 paragraphs.
First the images are preprocessed to identify the beam locations within the images.
The images are corrected with regard to background noise and then a threshold of 5% is
applied to the individual beam images in order to discriminate the beam location against
noise in the images. It was verified that the thresholding at this level has no remarkable
influence in the final results.
Figure A.3: For each individual beam images at z-locations along the focus spaced by 0.25 mm are taken. For better visibility only images of z-locations -9 mm/0 mm/+10 mm are shown in this figure.
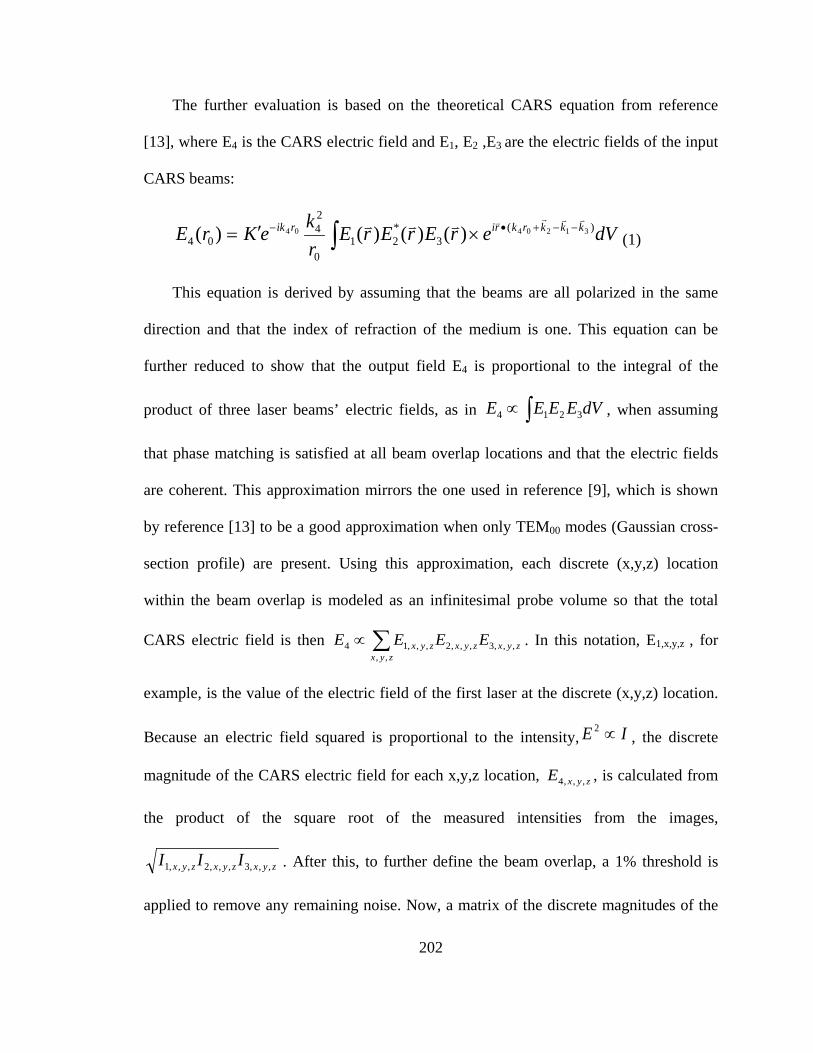
202
The further evaluation is based on the theoretical CARS equation from reference
[13], where E4 is the CARS electric field and E1, E2 ,E3 are the electric fields of the input
CARS beams:
dVerErErErkeKrE kkkrkririk )(
3*21
0
24
043120404 )()()()( −−+•− ×′= ∫ (1)
This equation is derived by assuming that the beams are all polarized in the same
direction and that the index of refraction of the medium is one. This equation can be
further reduced to show that the output field E4 is proportional to the integral of the
product of three laser beams’ electric fields, as in dVEEEE ∫∝ 3214 , when assuming
that phase matching is satisfied at all beam overlap locations and that the electric fields
are coherent. This approximation mirrors the one used in reference [9], which is shown
by reference [13] to be a good approximation when only TEM00 modes (Gaussian cross-
section profile) are present. Using this approximation, each discrete (x,y,z) location
within the beam overlap is modeled as an infinitesimal probe volume so that the total
CARS electric field is then ∑∝zyx
zyxzyxzyx EEEE,,
,,,3,,,2,,,14 . In this notation, E1,x,y,z , for
example, is the value of the electric field of the first laser at the discrete (x,y,z) location.
Because an electric field squared is proportional to the intensity, IE ∝2, the discrete
magnitude of the CARS electric field for each x,y,z location, zyxE ,,,4 , is calculated from
the product of the square root of the measured intensities from the images,
zyxzyxzyx III ,,,3,,,2,,,1 . After this, to further define the beam overlap, a 1% threshold is
applied to remove any remaining noise. Now, a matrix of the discrete magnitudes of the

203
CARS electric field zyxzyxzyxzyx EEEE ,,,3,,,2,,,1,,,4 ∝ at each x,y,z within the beam overlap
is available. This information can be used for 3D-modelling.
Results
A 3-D model of a CARS probe volume including the discrete magnitudes of the
CARS electric field is shown in Fig. A.4. The surfaces of the model are shown
transparent with iso-surfaces of 40%, 60% and 90% of the maximum value of generated
CARS- signal. The surfaces are darker towards the center of the volume indicating a
higher magnitude for the CARS signal. The 3-D model shows that the shape of the probe
Figure A.4: Representation of the 3-D model of the dual-pump CARS probe volume, (E1E2E3) as a function of x,y,z or zyxE ,,,4 .

204
volume is an elongated ellipsoid and supports the approximation of a cylinder made by
other assessments of the probe volume [1].
To obtain a value for the probe volume length, which is comparable to the glass slide
method, the analysis is taken one step further. The discrete magnitudes of the CARS
electric field are summed at all x and y locations in each z plane to generate an
accumulated magnitude per plane, zzzz EEEE ,3,2,1,4 ∝ . A summation of these
accumulated magnitudes over all z planes produces a sum-curve, )(4 zE . This curve is
then squared to find the CARS signal intensity sum-curve, shown in Fig. A.5. Finally, the
5% and 95%-values of the maximum integrated intensity are applied to the sum-curve to
determine the length of the probe volume.
Figure A.5: Integrated magnitude plot giving the length of the probe volume defined as 5%-95% of the accumulated intensity.

205
The optical setup presented in this work allows spatial resolution comparisons of
different CARS phase-matching geometries. The results are shown in Fig. A.6 and
demonstrate the probe volume length measurement ability of this new approach. Two
folded BOXCARS probe volumes, ro-vibrational and pure rotational, from dual-pump
dual-broadband CARS are compared to a planar phase matching scheme of dual-pump
CARS. In the planar phase matching case, the length of the probe volume is 47% larger
than the folded BOXCARS vibrational probe volume (L=1.72 mm), similar to predictions
of theory and measurements with other probe volume length measurement planar and
folded techniques [3, 10]. For further comparison, the folded BOXCARS pure rotational
Figure A.6: Comparison of probe volume lengths of different phase-matching geometries, BOXCARS, from a dual-pump dual-broadband CARS setup.

206
probe volume (L=1.80 mm) is also plotted. This small difference in the two folded
BOXCARS probe volumes can be attributed to the combination of different laser profiles
used in the respective cases.
The results achieved for the folded BOXCARS geometry were compared to a
measurement using the glass slide technique. The laser beams were attenuated using
beam attenuators. A glass slide with thickness 0.1 mm was traversed through the focus
while monitoring the level of non-resonant signal. Due to high scattering from the
Nd:YAG laser beam, this measurement could not be performed for pure rotational CARS.
The glass slide technique obtained a length of about 1.6 mm for the vibrational CARS
probe volume which is similar to the 1.72 mm measurements made with the new
approach.
Another possible application of this method is the verification of the overlap of two
probe volumes being measured simultaneously as is the case with dual-pump dual-
broadband CARS. In this CARS phase matching, shown in Fig. A.2, a rotational CARS
volume and vibrational CARS volume are measured simultaneously using two
combinations of three of the four laser beams available. In Fig. A.7 the two CARS probe
volumes, rotational CARS in red and the vibrational CARS in green indicating that the
two CARS signals are measuring the same volume of gas.

207
Summary
In summary, a new less-intrusive approach to measure probe volume dimensions in
nonlinear optics experiments was presented. This new approach has several advantages
above conventional techniques. From the data acquired with this method, it is possible to
model the 3-D probe volume, to verify coincidence of multiple probe volumes, and to
measure probe volume length, diameter and shape. Additionally, problems due to
scattering from a narrowband laser in glass slide measurements are not an issue. Hence,
the approach is also very useful for stray-light sensitive methods like rotational CARS.
Furthermore, the technique allows measurements to be taken at the same laser power as
the measurements for the experiment and assist in aligning the signal by optimizing beam
overlap. The time needed for this measurement was comparable if not quicker than with
other methods. The images used to demonstrate this technique’s abilities were taken in
less than 15 minutes. This collection time can be of course be significantly reduced by
automating the process. From the same set of images, the rotational and vibrational probe
Figure A.7: Verification of overlap of the rotational and vibrational dual-pump dual-broadband CARS 3-D probe volumes. The scale of x and y to z is four to one.

208
volume overlap was verified along with interpretation of spatial resolution. The presented
approach is a quick, simple and precise probe volume measurement method. Finally, this
experimental approach can be used for other pump-probe techniques, not only for CARS.
Acknowledgements
The authors gratefully acknowledge funding of the Erlangen Graduate School in
Advanced Optical Technologies (SAOT) by the German National Science Foundation
(DFG) in the framework of the excellence initiative. The authors would also like to thank
Greg Herring and Dimitrii Kozlov for advice and direction regarding CARS probe
volume theory.

209
REFERENCES
[1] A. C. Eckbreth, Laser Diagnostics for Combustion Temperature and Species (Gordon & Breach, Amsterdam, Nederland, 1996).
[2] S. O'Byrne, P. M. Danehy, A. D. Cutler, and S. A. Tedder, "Dual-Pump Coherent Anti-Stokes Raman Scattering Measurements in a Supersonic Combustor " AIAA J. 45, 922-933 (2007).
[3] M. C. Weikl, T. Seeger, R. Hierold, and A. Leipertz, "Dual-pump CARS measurements of N2, H2 and CO in a partially premixed flame," J. Raman Spectrosc. 38, 983-988 (2007).
[4] H.-J. Eichler, P. Günter, and D. W. Pohl, Laser-Induced Dynamic Gratings (Springer-Verlag, Berlin, 1986).
[5] T. Seeger, J. Kiefer, M. C. Weikl, A. Leipertz, and D. N. Kozlov, "Time-resolved measurement of the local equivalence ratio in a gaseous propane injection process using laser-induced gratings," Opt. Express 14, 12994-13000 (2006).
[6] T. Dreier, and P. Ewart, "Coherent Techniques for Measurements with Intermediate Concentrations," in Applied Combustion Research, K. Kohse-Höinghaus, and J. B. Jeffries, eds. (Taylor and Francis, New York, 2002).
[7] T. Dreier, and D. J. Rakestraw, "Measurement of OH rotational temperatures in a flame using degenerate four-wave mixing," Opt. Lett. 15, 72-74 (1990).
[8] J. Kiefer, Z. S. Li, J. Zetterberg, M. Linvin, and M. Aldén, "Simultaneous laser-induced fluorescence and sub-Doppler polarization spectroscopy of the CH radical," Opt. Commun. 270, 347-352 (2007).
[9] D. A. Greenhalgh, "Comments on the use of BOXCARS for gas-phase CARS spectroscopy," J. Raman Spectrosc. 14, 150-153 (1983).
[10] T. Seeger, and A. Leipertz, "Experimental comparison of single-shot broadband vibrational and dual-broadband pure rotational coherent anti-Stokes Raman scattering in hot air," Appl. Opt. 35, 2665-2671 (1996).
[11] T. Doerk, J. Ehlbeck, P. Jauernik, J. Stancot, J. Uhlenbusch, and T. Wottka, "Diagnostics of a microwave CO2 laser discharge by means of narrow-band BOXCARS," J. Phys. D 26, 1015-1022 (1993).
[12] D. Bivolaru, and G. C. Herring, "Focal-plane imaging of crossed beams in nonlinear optics experiments," Rev. Sci. Inst. 78, 056102 (2007).
[13] R. E. Teets, "CARS signals: phase matching, transverse modes, and optical damage effects," Appl. Opt. 25, 855-862 (1986).