Embed Size (px)
Citation preview

Advanced Wood-based Solutions for Mid-rise and High-rise Construction: Analytical Models for Balloon-Type CLT Shear Walls
Date: July 2018
By:
Zhiyong Chen, Ph.D., P.Eng., Scientist, Building Systems
Samuel Cuerrier-Auclair, M.Sc., P.Eng., Scientist, Building Systems
Marjan Popovski, Ph.D., P.Eng., Principal Scientist, Building Systems
Natural Resources Canada
Canadian Forest Service
Ressources naturelles Canada
Service canadien des forêts
fpinnovations.ca

FPInnovations is a not-for-profit world-
leading R&D institute that specializes in
the creation of scientific solutions in
support of the Canadian forest sector’s
global competitiveness and responds to
the priority needs of its industry members
and government partners. It is ideally
positioned to perform research, innovate,
and deliver state-of-the-art solutions for
every area of the sector’s value chain,
from forest operations to consumer and
industrial products. FPInnovations’ staff
numbers more than 430. Its R&D
laboratories are located in Québec City,
Montréal and Vancouver, and it has
technology transfer offices across
Canada. For more information
about FPInnovations, visit:
www.fpinnovations.ca.
Follow us on:
© 2018 FPInnovations. All rights reserved. Unauthorized copying or redistribution prohibited.
Disclosure for Commercial Application: If you require assistance to implement these research findings, please contact FPInnovations at [email protected].
Project 301012205: Performance of
Platform and Balloon Types of CLT
Buildings
ACKNOWLEDGEMENTS
This project was financially supported by the
National Resources Canada (NRCan) under
the Contribution Agreement existing between
the Government of Canada and FPInnovations.
REVIEWERS
Chun Ni, Ph.D., P.Eng., Principal Scientist,
Building Systems
CONTACT
Marjan Popovski, Ph.D., P.Eng.
Principal Scientist
Building Systems
604-222-5739

FPInnovations Page 3
SUMMARY
Lack of research and design information for the seismic performance of balloon-type CLT shear walls
prevents CLT from being used as an acceptable solution to resist seismic loads in balloon-type mass-
timber buildings. To quantify the performance of balloon-type CLT structures subjected to lateral loads
and create the research background for future code implementation of balloon-type CLT systems in
CSA O86 and NBCC, FPInnovations initiated a project to determine the behaviour of balloon-type CLT
construction. A series of tests on balloon-type CLT walls and connections used in these walls were
conducted. Analytical models were developed based on engineering principles and basic mechanics to
predict the deflection and resistance of the balloon-type CLT shear walls. This report covers the work
related to development of the analytical models and the tests on balloon-type CLT walls that the models
were verified against.
The developed analytical models incorporate the contribution of the wall bending and shear
deformation, as well as contribution from the wall rocking and sliding, and the slip of the vertical joints
between panels, on the overall wall deformation. The resistance of this system was assumed to be
governed by the hold-downs, shear connectors, and vertical joints, if present. The analytical models
were validated against the structural performance of balloon-type CLT shear walls without or with
vertical joints under lateral loading. Comparison of the test data and simulated results using the models
results has shown that the developed models were capable of predicting the deflection and resistance
of the balloon-type CLT shear walls.
The influence of specific key parameters on the structural performance of balloon-type CLT shear walls
were also investigated using the verified analytical models. Due to the single-point load at the top
produced the highest over-turning moment to the shear wall than multiple point-loads with an amount
equal to the single point load, the analyses using single point load yield the most conservative
estimation on the stiffness and resistance for balloon-type CLT shear walls. The structural performance
of wall finite element (FE) models increased with an increased in vertical load applied to the balloon-
type CLT shear walls, while the stiffness and resistance of the FE models decreased with an increase
in the wall aspect ratio (height to length). The lateral stiffness of the coupled-panel balloon-type CLT
shear wall descended with a decrease in the stiffness of vertical joints between two panels.
The developed analytical models were programmed into Mathcad to make them easily accessible for
structural engineers in developing and designing appropriate balloon-type CLT shear wall for timber
structures. The developed numerical models will be refined further in the future to be able to predict the
non-linear response of balloon-type CLT shear walls subjected to seismic loads. Using these refined
models the seismic response of balloon-type CLT structures subjected to lateral loads will be
evaluated, creating the research background for future implementation of balloon-type CLT systems in
CSA O86 and NBCC.

FPInnovations Page 4
Table of contents
Summary ............................................................................................................................................... 3
1. Introduction ..................................................................................................................................... 9
2. Objectives ..................................................................................................................................... 11
3. Staff .............................................................................................................................................. 11
4. Derivation of AnalYtical Models .................................................................................................... 11
4.1 General .................................................................................................................................. 11
4.2 Bending Deformation ............................................................................................................. 15
4.3 Shear Deformation................................................................................................................. 17
4.4 Deformation Due to Rotation ................................................................................................. 18
4.4.1 Rigid Panel Base ................................................................................................................. 18
4.4.2 Elastic Panel Base ............................................................................................................... 20
4.5 Deformation Due to Wall Sliding ............................................................................................ 31
4.6 Deformation Due to Vertical Slip between Wall Panels .......................................................... 33
4.7 Lateral Deformation ............................................................................................................... 35
4.8 Lateral Resistance ................................................................................................................. 38
5. Validation of Analytical Models ..................................................................................................... 43
5.1 Connection Test .................................................................................................................... 43
5.2 Shear Wall Test ..................................................................................................................... 47
5.2.1 Material and Methods ..................................................................................................... 47
5.2.2 Results and Discussion .................................................................................................. 53
5.3 FE Simulation ........................................................................................................................ 58
5.3.1 FE Model Development and Validation ........................................................................... 58
5.3.2 Structural Response under Multiple Point Loads ............................................................ 64
5.4 Analytical Model Validation .................................................................................................... 66
5.4.1 Single Point Load ........................................................................................................... 66
5.4.2 Multiple Point Loads ....................................................................................................... 69
6. Influence of Key Parameters ......................................................................................................... 71
6.1 Lateral Load Pattern .............................................................................................................. 71
6.2 Vertical Load.......................................................................................................................... 73
6.3 Wall Aspect Ratio .................................................................................................................. 75
6.4 Connections .......................................................................................................................... 77
7. Summary and Conclusions ........................................................................................................... 78

FPInnovations Page 5
8. Benefit to Members and Industry .................................................................................................. 79
9. List of Symbols ............................................................................................................................. 79
10. References ................................................................................................................................ 82
FPInnovations Page 6
List of figures
Figure 1. Simplified schematic of (a) platform- type and (b) balloon-type CLT construction ................... 9
Figure 2. Balloon-type CLT shear walls: (a) Single panel; and (b) Coupled panel ................................ 10
Figure 3. Lateral deflection of single-panel balloon-type CLT shear wall .............................................. 12
Figure 4. Components contributing to the lateral deflection of balloon-type walls: (a) bending; (b) shear;
(c) rotation; (d) sliding; and (e) slip ....................................................................................................... 13
Figure 5. Lateral deflection of coupled-panel balloon-type CLT shear wall ........................................... 14
Figure 6. Bending (a) and shear (b) deflection of balloon-type CLT shear wall ................................... 15
Figure 7. Deflection due to rotation of a balloon-type CLT shear wall with a rigid base ....................... 18
Figure 8. Deflection due to rotation of a balloon-type CLT shear wall with an elastic base (Case I) .... 21
Figure 9. Deflection due to rotation of a balloon-type CLT shear wall with elastic base (Case II) ........ 23
Figure 10. Deflection due to rotation of a balloon-type CLT shear wall with an elastic base (Case III) 25
Figure 11. Deflection due to rotation of a balloon-type CLT shear wall with an elastic base (Case IV) 27
Figure 12. Deflection due to rotation of a balloon-type CLT shear wall with an elastic base (Case V) . 29
Figure 13. Deflection due to sliding of a balloon-type CLT shear wall at the base ............................... 31
Figure 14. Deflection due to vertical slip between wall panels in coupled balloon-type CLT wall ......... 33
Figure 15. Failure scenario I – shear failure of connections at the wall bottom .................................... 38
Figure 16. Failure scenario II – over-turning failure of single-panel walls: (a) Rigid panel base; and (b)
Elastic panel base ................................................................................................................................ 39
Figure 17. Failure scenario III – over-turning failure of coupled-panel walls: (a) Rigid panel base; and
(b) Elastic panel base .......................................................................................................................... 40
Figure 18. Self-tapping screw .............................................................................................................. 43
Figure 19. Test setup for the STS connections: (a) Sketched specimen and test setup, and (b)
Specimen ready for testing .................................................................................................................. 44
Figure 20. Load-displacement curves of the STS connections ............................................................. 45
Figure 21. Deformed STS after testing ................................................................................................. 45
Figure 22. Shear walls configurations: (a) W1 with single panel; (b) W2 with semi-rigid vertical joints;
and (c) W3 with rigid vertical joints ....................................................................................................... 47
Figure 23. Test setup with wall configuration W2 ready for testing ....................................................... 49
Figure 24. Location and orientation of measurement apparatus for configuration W1: (a) Front and (b)
Back .................................................................................................................................................... 50
Figure 25. Location and orientation of measurement apparatus for configurations W2 and W3: (a) Front
and (b) Back ........................................................................................................................................ 51
Figure 26. ISO 16670 loading protocol for shear walls ......................................................................... 52
FPInnovations Page 7
Figure 27. Hydraulic actuator without (a) or with (b) spacers................................................................ 52
Figure 28. Load-displacement curves of wall configuration W1 ............................................................ 53
Figure 29. Load-displacement curves of wall configuration W2: (a) W2CYCa; and (b) W2CYCb ......... 54
Figure 30. Load-Displacement curves of wall configuration W3 ........................................................... 55
Figure 31. Failure mode for wall configurations W1 and W3 (a) and W2 (b) ......................................... 55
Figure 32. Load-displacement curves of the tested balloon-type CLT shear walls ............................... 56
Figure 33. FE models for single- (a) and coupled- (b) panel balloon-type CLT shear walls .................. 58
Figure 34. Cartesian connector element .............................................................................................. 59
Figure 35. Load-displacement curves for hold-downs (a) and vertical joints (b) ................................... 60
Figure 36. Load-displacement curves obtained from cyclic tests and simulation: (a) Wall configuration
W1; and (b) Wall configuration W2....................................................................................................... 61
Figure 37. Displacement along the wall height obtained from cyclic tests and simulation: (a) Wall
configuration W1; and (b) Wall configuration W2 ................................................................................. 62
Figure 38. Deformation shapes for wall configurations W1 (a) and W2 (b) obtained from FE simulation
............................................................................................................................................................ 63
Figure 39. Load-displacement curves for wall configurations W1 (a) and W2 (b) under single or multiple
point load(s) ......................................................................................................................................... 64
Figure 40. Displacement along the wall height under single or multiple point load(s) (40% maximum
load): (a) Wall configuration W1; and (b) Wall configuration W2 .......................................................... 65
Figure 41. Load-displacement curves of walls under single point load: (a) Wall configuration W1; and
(b) Wall configuration W2 ..................................................................................................................... 67
Figure 42. Displacement along the wall height under single point load (40% maximum load): (a) Wall
configuration W1; and (b) Wall configuration W2 ................................................................................. 68
Figure 43. Load-displacement curves of walls under multiple point loads: (a) Wall configuration W1; and
(b) Wall configuration W2 ..................................................................................................................... 69
Figure 44. Displacement along the wall height under multiple point loads (40% maximum load): (a) Wall
configuration W1; and (b) Wall configuration W2 ................................................................................. 70
Figure 45. Load-displacement curves for single-panel wall under different lateral loading patterns: (a)
Analytical model I; and (b) Analytical model II ...................................................................................... 71
Figure 46. Load-displacement curves for coupled-panel wall under different lateral loading patterns: (a)
Analytical model I; and (b) Analytical model II ...................................................................................... 72
Figure 47. Influence of vertical load on the lateral stiffness and resistance of single- (a) and coupled- (b)
panel balloon-type shear walls ............................................................................................................. 73
Figure 48. Influence of wall aspect ratio on the load-displacement curve of single-panel balloon-type
CLT shear walls ................................................................................................................................... 75
Figure 49. Influence of wall aspect ratio on the structural performance of single-panel balloon-type CLT
shear walls ........................................................................................................................................... 75

FPInnovations Page 8
Figure 50. Influence of wall aspect ratio on the deflection components in single-panel balloon-type CLT
shear walls ........................................................................................................................................... 76
Figure 51. Influence of stiffness of vertical joints on the stiffness of coupled-panel balloon-type CLT
shear walls ........................................................................................................................................... 77
List of tables
Table 1. Methods for calculating the five deflection components in the analytical models .................... 35
Table 2. Loading protocol for the repeated loading in one-way ............................................................ 44
Table 3. Structural performance of STS connections ........................................................................... 46
Table 4. Tested CLT shear walls ......................................................................................................... 48
Table 5. ISO 16670 loading protocol .................................................................................................... 52
Table 6. Structural properties of the tested balloon-type CLT shear walls ............................................ 57
Table 7. Dimensions of balloon-type CLT shear walls .......................................................................... 66
Table 8. Physical and mechanical properties of CLT panels ................................................................ 66
Table 9. Mechanical properties of connections .................................................................................... 66

FPInnovations Page 9
1. INTRODUCTION
Cross Laminated Timber (CLT) buildings can be constructed using either platform-type or balloon-type
method (Figure 1). In platform-type CLT construction, the floor at each storey is used as a base for
erection of the CLT walls of the next storey above. The height of the CLT walls is therefore equal to the
storey height. At each storey, the gravity loads are transferred through the CLT floor panels. Because
gravity loads are cumulative, the maximum height of these buildings is therefore usually limited by the
perpendicular-to-grain compression resistance of the CLT floor panels at the lowest floor where the
cumulated gravity load is the highest. In balloon-type construction, the walls are continuous over two or
more storeys or even for the entire height of the building, and the floor panels are framed onto the sides
of the walls at each storey. This method would therefore prevent the issue of high accumulated
compression perpendicular to grain stress; it also takes advantage of CLT panels being manufactured
with a length up to 20 m. Several buildings of this type have already been built in Canada. Examples
include the 13-storey Origine building in Quebec City, QC, the 8-storey building of the Arbora complex
in Montreal, QC, and the 29.5 m high Wood Innovation and Design Centre in Prince George, BC.
(a) (b)
Figure 1. Simplified schematic of (a) platform- type and (b) balloon-type CLT construction
Most of the research conducted so far around the world has been related to platform-type CLT
construction. Very limited studies have been done on balloon-type CLT construction. FPInnovations
initiated a project to determine the behaviour of balloon-type CLT construction, and a series of tests on
balloon-type CLT walls was conducted at FPInnovations’ Quebec Laboratory in 2016-2017. Results
from these tests are included in Chapter 5 of this report.
Analytical studies were carried out following the experimental study. Mechanics-based analytical
models for predicting the deflection and resistance of balloon-type CLT shear walls under lateral loads,

FPInnovations Page 10
with consideration of vertical loads, were developed. The developed models were verified against the
conducted tests on single and coupled balloon-type CLT shear walls (Figure 2). Numerical simulations
on identical CLT shear walls under multiple point loads were conducted to further verify the developed
analytical models. Results from connection tests were also used as an input for the numerical models
and analytical models. The influence of key parameters on the structural performance of balloon-type
CLT shear walls was investigated using the verified analytical models. The analytical models were
developed using a Mathcad platform, such that they can be used by designers. This report presents
the results of all of these analytical studies.
(a) (b)
Figure 2. Balloon-type CLT shear walls: (a) Single panel; and (b) Coupled panel
Note: L and Lhd represent the length of the wall and the distance between the center of the hold-down and the
edge of the wall, respectively, [mm]; H represents the height of the wall [mm]. For single panel shear wall,
shear connector(s), shear keys, or both can be used depending on the structural design.

FPInnovations Page 11
2. OBJECTIVES
The main objectives of the research work presented in this report were to:
Develop analytical models based on engineering principles and mechanics to predict the
deflection and resistance of balloon-type CLT shear walls;
Verify the developed models based on the conducted tests on balloon type CLT shear walls;
Investigate the influence of specific key parameters on the structural performance of balloon-
type CLT shear walls using the verified analytical models.
The developed analytical models were programmed into Mathcad to make them easily accessible for
structural engineers in developing design solutions that utilize balloon-type CLT construction.
For future, the developed numerical models will be refined further to be able to predict the non-linear
response of balloon-type CLT shear walls subjected to seismic loads, which would provide the technical
background for implementation of balloon-type CLT systems in the CSA O86 standard (CSA 2014) and
the National Building Code of Canada (NBCC) (NRC 2015).
3. STAFF
Marjan Popovski, Ph.D., P.Eng., Principle Scientist, Building Systems
Sylvain Gagnon, P.Eng., Manager, Building Systems
Zhiyong Chen, Ph.D., P.Eng., Scientist, Building Systems
Samuel Cuerrier-Auclair, M.Sc., P.Eng., Scientist, Building Systems
Olivier Baës, Principal Technologist, Building Systems
Anes Omeranovic, Principal Technologist, Building Systems
4. DERIVATION OF ANALYTICAL MODELS
4.1 General The total lateral deflection of a single-panel balloon-type CLT shear wall at any height level i,, ∆ℎ𝑖, (Figure 3) is comprised of four deflection components: wall bending, ∆ℎ𝑖,𝑏 , shear, ∆ℎ𝑖,𝑠 , rotation
(anchorage deformation), ∆ℎ𝑖,𝑟𝑜𝑡 , and sliding, ∆ℎ𝑖,𝑠𝑙𝑑 , as illustrated in Figure 4a to d, and can be
calculated using the Equation (1).
∆ℎ𝑖= ∆ℎ𝑖,𝑏 + ∆ℎ𝑖,𝑠 + ∆ℎ𝑖,𝑟𝑜𝑡 + ∆ℎ𝑖,𝑠𝑙𝑑 (1)
For coupled-panel balloon-type CLT shear walls (Figure 5), the slip in vertical joints at any height level i,
∆ℎ𝑖,𝑠𝑙𝑝, (Figure 4e) also contributes to the lateral deflection; hence for these walls, deflections can be
calculated using Equation (2).
∆ℎ𝑖= ∆ℎ𝑖,𝑏 + ∆ℎ𝑖,𝑠 + ∆ℎ𝑖,𝑟𝑜𝑡 + ∆ℎ𝑖,𝑠𝑙𝑑 + ∆ℎ𝑖,𝑠𝑙𝑝 (2)

FPInnovations Page 12
Calculation of each deformation component is discussed below.
Figure 3. Lateral deflection of single-panel balloon-type CLT shear wall
Note: Fi and Ni represent the lateral load [kN] and the vertical load [kN] on the wall at a height level i, respectively;
hi represents the height level of the lateral and vertical load (Fi and Ni) [m]; The deflection of the wall at the
top (level ℎ𝑛 = 𝐻) and at any level i is designated as ∆𝐻 and ∆ℎ𝑖, respectively, [mm]; where 𝑛 indicates the
number of load levels.

FPInnovations Page 13
(a) (b)
(c) (d) (e)
Figure 4. Components contributing to the lateral deflection of balloon-type walls: (a) bending; (b) shear; (c) rotation; (d) sliding; and (e) slip

FPInnovations Page 14
Figure 5. Lateral deflection of coupled-panel balloon-type CLT shear wall

FPInnovations Page 15
4.2 Bending Deformation A balloon-type CLT shear wall acts similar to a vertical cantilevered beam in which the wall panels
generally behave elastically and the connections behave elastic-plastically. Therefore the bending
deflection, ∆ℎ𝑖,𝑏 , at any height, ℎ𝑖 , (Figure 6a) for a CLT panel under a number of lateral loads at
different height levels can be calculated using Equation (3) that is derived through structural mechanics
(Hibbeler, 2012).
(a) (b)
Figure 6. Bending (a) and shear (b) deflection of balloon-type CLT shear wall

FPInnovations Page 16
n
ij
ijij
i
j
jijj
eff
bhi hhhFhhhFEI )1(
2
1
2
, 336
1 (3)
where effEI is the effective bending stiffness [N·mm2] of the CLT panel which can be calculated using
the k method (composite theory) provided by Blass and Fellmoser (2004), or using the simplified design
method given below. The simplified design method assumes that only parallel layers contribute to
resisting the bending deflection and all the lumber in the same parallel layer behave as a whole layer
due to the bonding effect provided by the perpendicular layer(s):
effeff IEEI 0 (4)
where 0E is the modulus of elasticity (MOE) of the lumber in the parallel layer of CLT panel [MPa]; effI
is the effective moment of inertia [mm4]:
12
21
1
12
3
ln
i
i
eff
tL
I (5)
where L is the length of the shear wall [m]; it is the thickness of the ith layer of CLT panel [mm]; and ln
is the number of layers in CLT panel.
For the k method, a k factor is used to modify the MOE value:
IEkEI eff 03 (6)
where I is the moment of inertia [mm4]:
12
3tLI (7)
where t is the thickness of the CLT panel [mm]; 3k is a composition factor for solid wood panels with
cross layers (Blass and Fellmoser, 2004):
t
t
E
Ek
ln
i
i
21
1
2
0
90
3 11
(8)
where 90E is the MOE value of the lumber in the transverse layer of CLT panel [MPa].

FPInnovations Page 17
4.3 Shear Deformation Similarly to the deflection due to bending, the shear deflection, ∆ℎ𝑖,𝑠, at any height, ℎ𝑖, (Figure 6b) for a
CLT panel under lateral loads can be calculated using Equation (9) derived through structural
mechanics (Hibbeler, 2012).
n
ij
ij
i
j
jj
eff
shi hFhFGA )1(1
,
(9)
where is the shape reduction factor for shear deformation, also called Timoshenko shear coefficient
(Gere and Timoshenko, 1997), depending on the geometry, normally, = 6/5 for a rectangular section.
effGA is the effective shear stiffness [N] which can be calculated using simplified design method
(Gavric, Fragiacomo and Ceccotti, 2015) or Representative Volume Element (RVE) method
(Moosbrugger, Guggenberger and Bogensperger, 2006). The simplified design method assumes that
only parallel layers contribute to resisting the shear deformation and all the lumber in the same parallel
layer behave as a whole layer due to the bonding effect provided by the perpendicular layer(s):
effeff AGGA 0 (10)
where 0G is the shear modulus of the lumber in the parallel layer of CLT panel [MPa]; effA is effective
cross-section area of CLT panel [mm2]:
21
1
12
ln
i
ieff tLA (11)
Moosbrugger et al. (2006) proposed a model based on the regular periodic internal geometry of CLT
wall elements, considering uniform shear loading on the boundaries. A complex internal structure of
CLT elements with a unit cell called RVE was developed. Total shear loading was broken down into
two basic mechanisms: pure shear in a single board, and torsional-like behavior in the glue interface
between two boards. The effective shear stiffness can be calculated as:
AGGA effeff (12)
where A is the cross-section area of CLT panel, tLA , [mm2]; effG is the effective shear modulus of
the CLT panel [MPa]:
12
061
mn
mneff
b
tGG (13)
Where 𝑡𝑚𝑛and mnb represent the mean thickness [mm] and the mean width [mm] of the lumber in CLT
panel (Moosbrugger et al., 2006).

FPInnovations Page 18
4.4 Deformation Due to Rotation The deflection due to rotation of CLT shear walls, ∆ℎ𝑖,𝑟𝑜𝑡, at any height, ℎ𝑖, can be derived in different
ways by assuming different behaviour of the base of the panel. In this study, “rigid panel base”
assumes that the bottom of CLT panel is non-deformable, while “elastic panel base” assumes that the
bottom of CLT panel deforms elastically under compression. The foundation in both cases is rigid.
4.4.1 Rigid Panel Base
In case of a rigid base, the CLT panel is free to rotate about its corner under lateral loads, as illustrated
in Figure 7.
Figure 7. Deflection due to rotation of a balloon-type CLT shear wall with a rigid base

FPInnovations Page 19
Before the lateral load overcomes the over-turning resistance provided by the vertical load,
n
j
jj
n
j
j NL
hF11 2
(14)
the wall will not rotate and the vertical reaction, cR , will be equal to the vertical load:
n
j
jc NR1
(15)
Once the lateral load overcomes the over-turning resistance induced by the vertical load, equilibrium of
vertical forces and moments can be achieved:
n
j
jhdrtscthdltc NRRRR1
,,, (16)
hdhdrtscthdhdlt
n
j
jj
n
j
j LRLRLLRNL
hF ,,,
11
22
(17)
where hdltR , , sctR , and hdrtR , represent the tension resisted by the left hold-down, shear connector, and
the right hold-down as shown below:
hdvhdlhdlt kR ,,
scvscsct kR ,,
hdvhdrhdrt kR ,,
hd
hdrsc
hd
hdl
rotLLLL
2tan
where hdvk , and scvk , represent the vertical stiffness [kN/mm] of hold-down and shear connector; hdl ,
sc and hdr represent the uplift [mm] that occurs in the left hold-down, shear connector and right hold-
down, respectively; rot indicates the rotation of the CLT panel under lateral load.
2
,
2
,
2
,
,,
11
4
22
hdhdvscvhdhdv
scthdt
n
j
jj
n
j
j
cLkLkLLk
kkNL
hFL
R
(18)
2
,
2
,
2
,
11
4
2)tan(
hdhdvscvhdhdv
n
j
jj
n
j
j
rotLkLkLLk
NL
hF
(19)
So,
FPInnovations Page 20
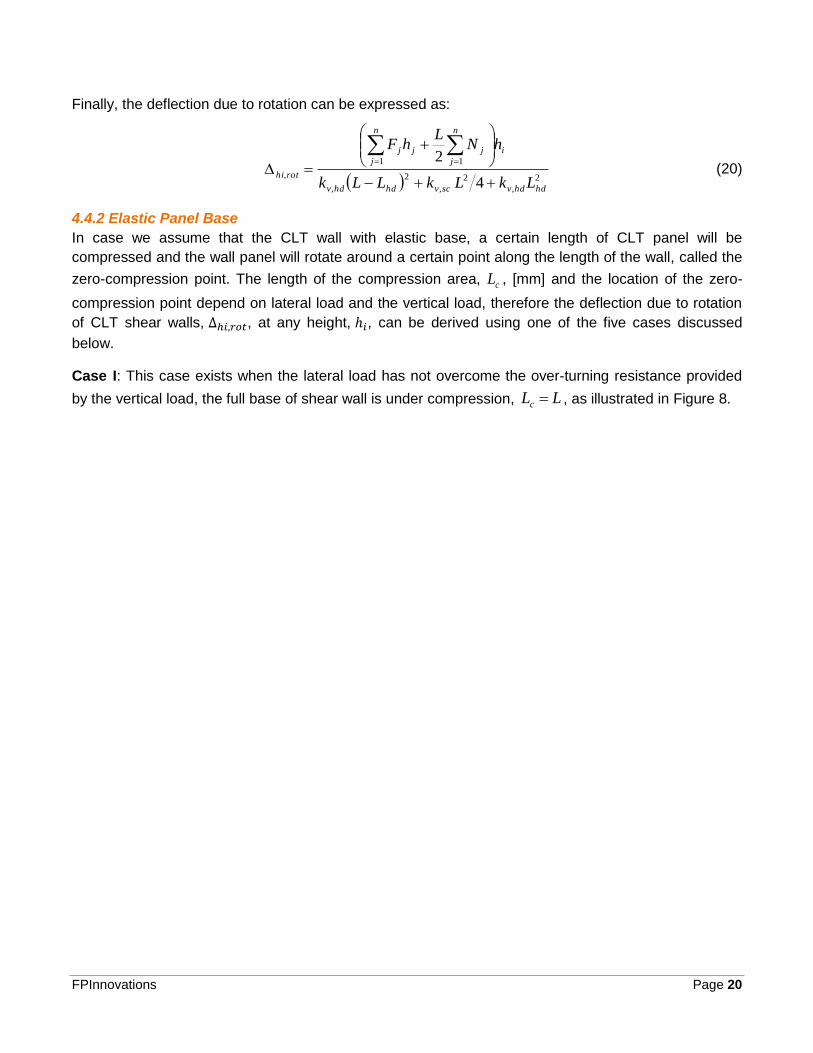
Finally, the deflection due to rotation can be expressed as:
2
,
2
,
2
,
11
,4
2
hdhdvscvhdhdv
i
n
j
jj
n
j
j
rothiLkLkLLk
hNL
hF
(20)
4.4.2 Elastic Panel Base
In case we assume that the CLT wall with elastic base, a certain length of CLT panel will be
compressed and the wall panel will rotate around a certain point along the length of the wall, called the
zero-compression point. The length of the compression area, cL , [mm] and the location of the zero-
compression point depend on lateral load and the vertical load, therefore the deflection due to rotation
of CLT shear walls, ∆ℎ𝑖,𝑟𝑜𝑡, at any height, ℎ𝑖, can be derived using one of the five cases discussed
below.
Case I: This case exists when the lateral load has not overcome the over-turning resistance provided
by the vertical load, the full base of shear wall is under compression, LLc , as illustrated in Figure 8.

FPInnovations Page 21
Figure 8. Deflection due to rotation of a balloon-type CLT shear wall with an elastic base (Case I)
Note: ∆𝑐 indicates the compression deformation occurring at the edge [mm].
The criterion for the lateral load to overcome the over-turning resistance provided by the vertical load is
n
j
jj
n
j
j NL
hF11 6
(21)
For assumed trapezoid stress distribution at the wall base (Figure 8), two equations can be derived
according to equilibrium of forces and moments:
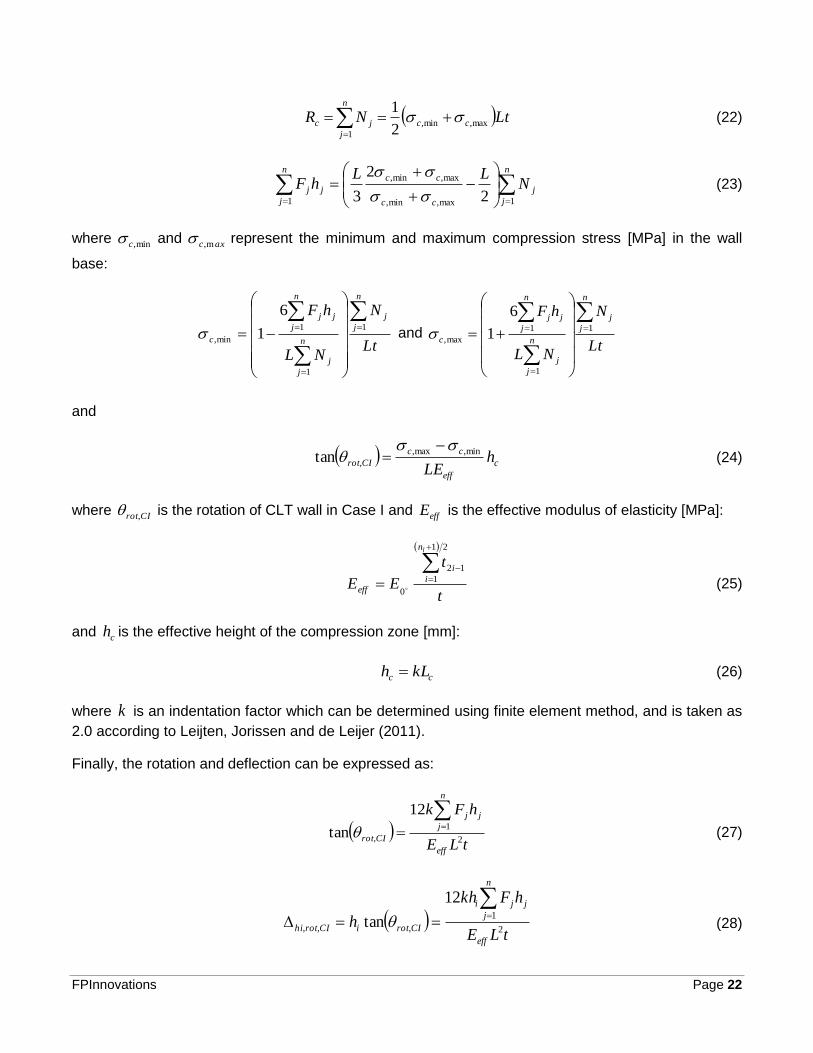
FPInnovations Page 22
LtNR cc
n
j
jc max,min,
1 2
1
(22)
n
j
j
cc
cc
j
n
j
j NLL
hF1max,min,
max,min,
1 2
2
3
(23)
where min,c and axc m, represent the minimum and maximum compression stress [MPa] in the wall
base:
Lt
N
NL
hFn
j
j
n
j
j
j
n
j
j
c
1
1
1
min,
6
1 and Lt
N
NL
hFn
j
j
n
j
j
j
n
j
j
c
1
1
1
max,
6
1
and
c
eff
cc
CIrot hLE
min,max,
,tan
(24)
where CIrot, is the rotation of CLT wall in Case I and effE is the effective modulus of elasticity [MPa]:
t
t
EE
ln
i
i
eff
21
1
12
0 (25)
and ch is the effective height of the compression zone [mm]:
cc kLh (26)
where k is an indentation factor which can be determined using finite element method, and is taken as
2.0 according to Leijten, Jorissen and de Leijer (2011).
Finally, the rotation and deflection can be expressed as:
tLE
hFk
eff
j
n
j
j
CIrot 2
1
,
12
tan
(27)
tLE
hFkh
heff
j
n
j
ji
CIrotiCIrothi 2
1
,,,
12
tan
(28)

FPInnovations Page 23
where CIrothi ,, is the rotation deflection [mm] of CLT wall in Case I.
Case II: This case exists when the lateral load overcomes the over-turning resistance provided by the
vertical load, but most of shear wall base is still under compression and no tension occurs in the hold-
down, L-Lhd( ) £ Lc < L , as illustrated in Figure 9.
Figure 9. Deflection due to rotation of a balloon-type CLT shear wall with elastic base (Case II)
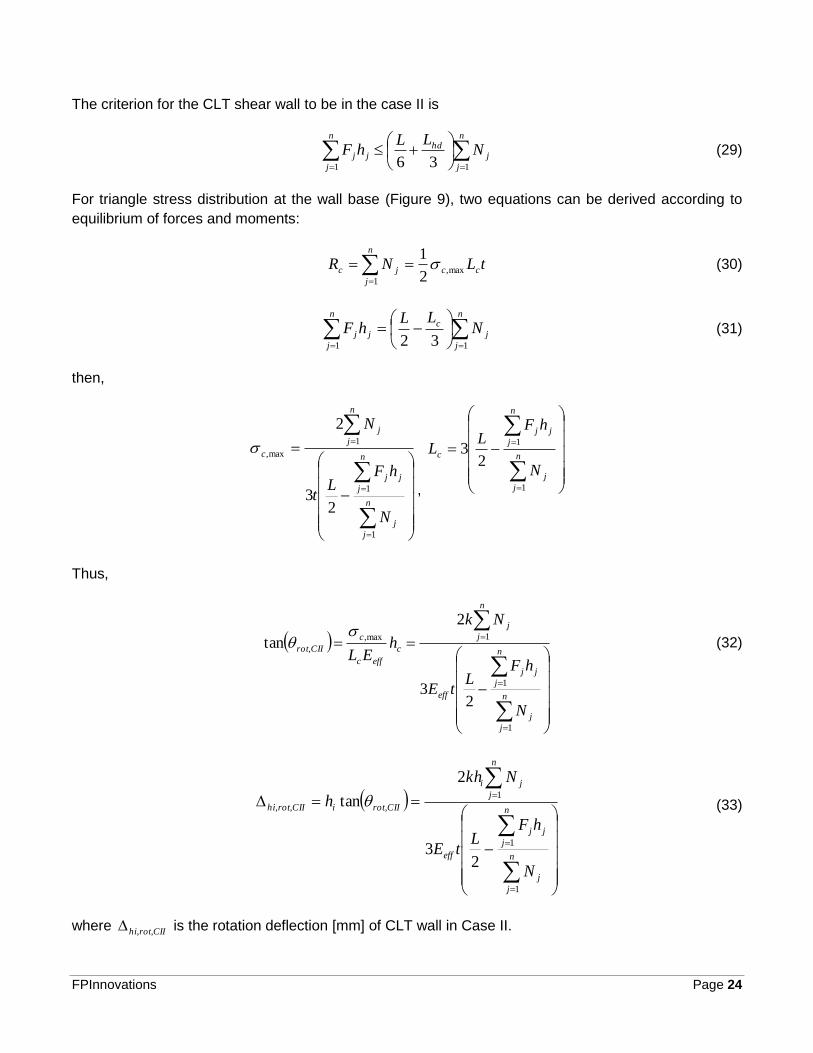
FPInnovations Page 24
The criterion for the CLT shear wall to be in the case II is
n
j
jhd
j
n
j
j NLL
hF11 36
(29)
For triangle stress distribution at the wall base (Figure 9), two equations can be derived according to
equilibrium of forces and moments:
tLNR cc
n
j
jc max,
1 2
1
(30)
n
j
j
c
j
n
j
j NLL
hF11 32
(31)
then,
n
j
j
j
n
j
j
n
j
j
c
N
hFL
t
N
1
1
1
max,
23
2
,
n
j
j
j
n
j
j
c
N
hFL
L
1
1
23
Thus,
n
j
j
j
n
j
j
eff
n
j
j
c
effc
c
CIIrot
N
hFL
tE
Nk
hEL
1
1
1max,
,
23
2
tan
(32)
n
j
j
j
n
j
j
eff
n
j
ji
CIIrotiCIIrothi
N
hFL
tE
Nkh
h
1
1
1
,,,
23
2
tan (33)
where CIIrothi ,, is the rotation deflection [mm] of CLT wall in Case II.

FPInnovations Page 25
Case III: As the lateral load increases, a part of the wall base lifts and the left hold-down is under
tension, L 2 £ Lc < L-Lhd( ), as illustrated in Figure 10.
Figure 10. Deflection due to rotation of a balloon-type CLT shear wall with an elastic base (Case III)
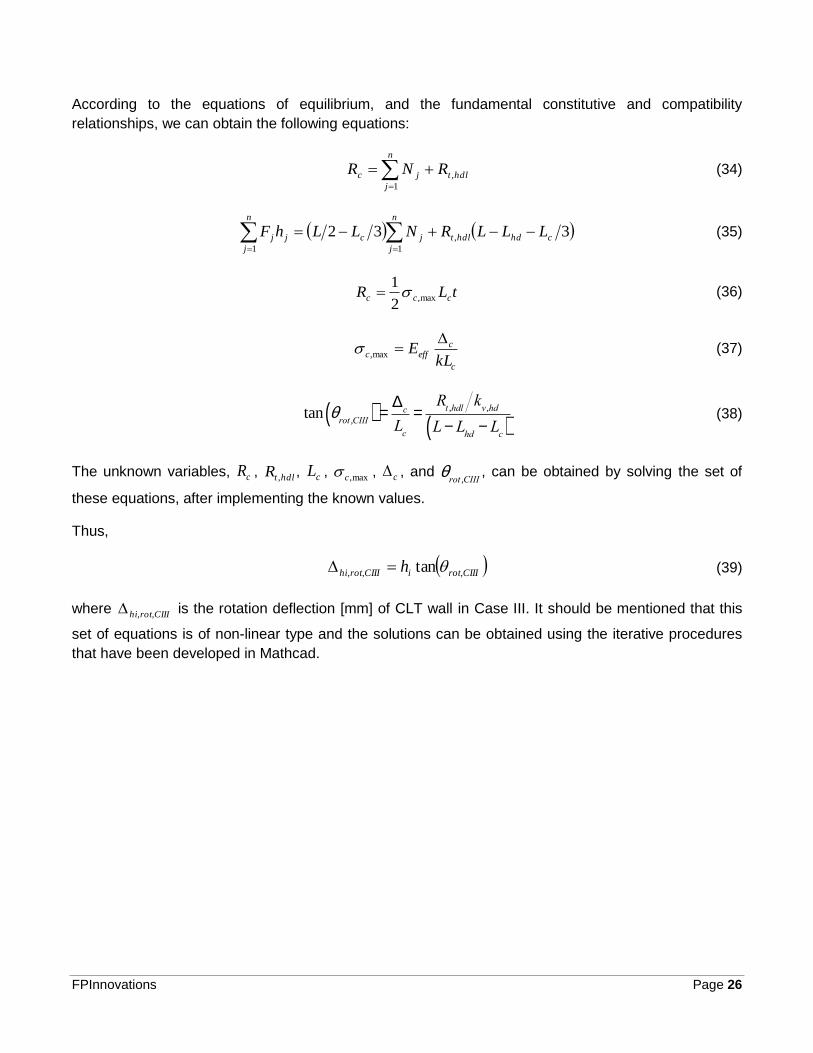
FPInnovations Page 26
According to the equations of equilibrium, and the fundamental constitutive and compatibility
relationships, we can obtain the following equations:
hdlt
n
j
jc RNR ,
1
(34)
332 ,
11
chdhdlt
n
j
jcj
n
j
j LLLRNLLhF
(35)
tLR ccc max,2
1 (36)
c
ceffc
kLE
max, (37)
tan qrot ,CIII( ) =
Dc
Lc
=Rt ,hdl
kv ,hd
L- Lhd
- Lc( )
(38)
The unknown variables, cR , hdltR , , cL , max,c , c , and qrot ,CIII
, can be obtained by solving the set of
these equations, after implementing the known values.
Thus,
CIIIrotiCIIIrothi h ,,, tan (39)
where CIIIrothi ,, is the rotation deflection [mm] of CLT wall in Case III. It should be mentioned that this
set of equations is of non-linear type and the solutions can be obtained using the iterative procedures
that have been developed in Mathcad.

FPInnovations Page 27
Case IV: This case applies when less of the half of the wall base is under compression, and only the
left hold-down and shear connector are under tension, Lhd £ Lc < L 2, as illustrated in Figure 11.
Figure 11. Deflection due to rotation of a balloon-type CLT shear wall with an elastic base (Case IV)

FPInnovations Page 28
According to the equations of equilibrium, and the fundamental constitutive and compatibility
relationships, we can obtain the following equations:
scthdlt
n
j
jc RRNR ,,
1
(40)
32332 ,,
11
csctchdhdlt
n
j
jcj
n
j
j LLRLLLRNLLhF
(41)
tLR ccc max,2
1 (42)
c
c
effckL
E
max, (43)
tan qrot ,CIV( ) =
Dc
Lc
=Rt ,hdl
kv ,hd
L- Lhd
- Lc( )
=Rt ,sckv ,sc
L 2- Lc( )
(44)
Similar to Case III, one is suggested to solve these equations after substituting known variables with
values to derive the unknown variables ( cR , hdltR , , Rt ,sc
, cL , max,c , c and qrot ,CIV
).
Thus,
CIVrotiCIVrothi h ,,, tan (45)
where CIVrothi ,, is the rotation deflection [mm] of CLT wall in Case IV. Similar to case III, this set of
equations is also non-linear and the solutions can be obtained using the iterative procedures that have
been developed in Mathcad.

FPInnovations Page 29
Case V: This case applies when relatively small length of the wall base is under compression, while the
hold-downs and the shear connector(s) are under tension, hdc LL , as illustrated in Figure 12.
Figure 12. Deflection due to rotation of a balloon-type CLT shear wall with an elastic base (Case V)
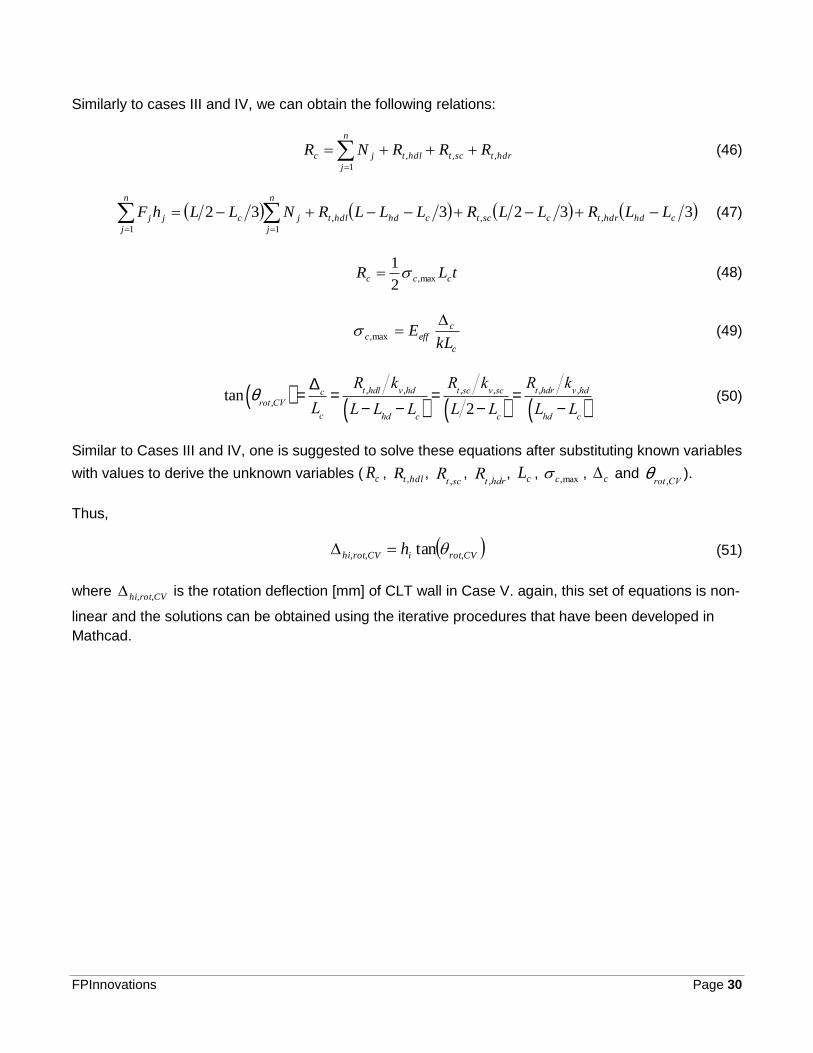
FPInnovations Page 30
Similarly to cases III and IV, we can obtain the following relations:
hdrtscthdlt
n
j
jc RRRNR ,,,
1
(46)
332332 ,,,
11
chdhdrtcsctchdhdlt
n
j
jcj
n
j
j LLRLLRLLLRNLLhF
(47)
tLR ccc max,2
1 (48)
c
c
effckL
E
max, (49)
tan qrot ,CV( ) =
Dc
Lc
=Rt ,hdl
kv ,hd
L- Lhd
- Lc( )
=Rt ,sckv ,sc
L 2- Lc( )
=Rt ,hdr
kv ,hd
Lhd
- Lc( )
(50)
Similar to Cases III and IV, one is suggested to solve these equations after substituting known variables
with values to derive the unknown variables ( cR , hdltR , , Rt ,sc
, Rt ,hdr
, cL , max,c , c and qrot ,CV
).
Thus,
CVrotiCVrothi h ,,, tan (51)
where CVrothi ,, is the rotation deflection [mm] of CLT wall in Case V. again, this set of equations is non-
linear and the solutions can be obtained using the iterative procedures that have been developed in
Mathcad.

FPInnovations Page 31
4.5 Deformation Due to Wall Sliding To determine the deflection induced by the sliding of shear wall at the base (Figure 13), it is assumed
that the friction along the bottom of the wall, the hold-downs, shear connector(s) and shear keys resist
the shear wall from sliding.
Figure 13. Deflection due to sliding of a balloon-type CLT shear wall at the base
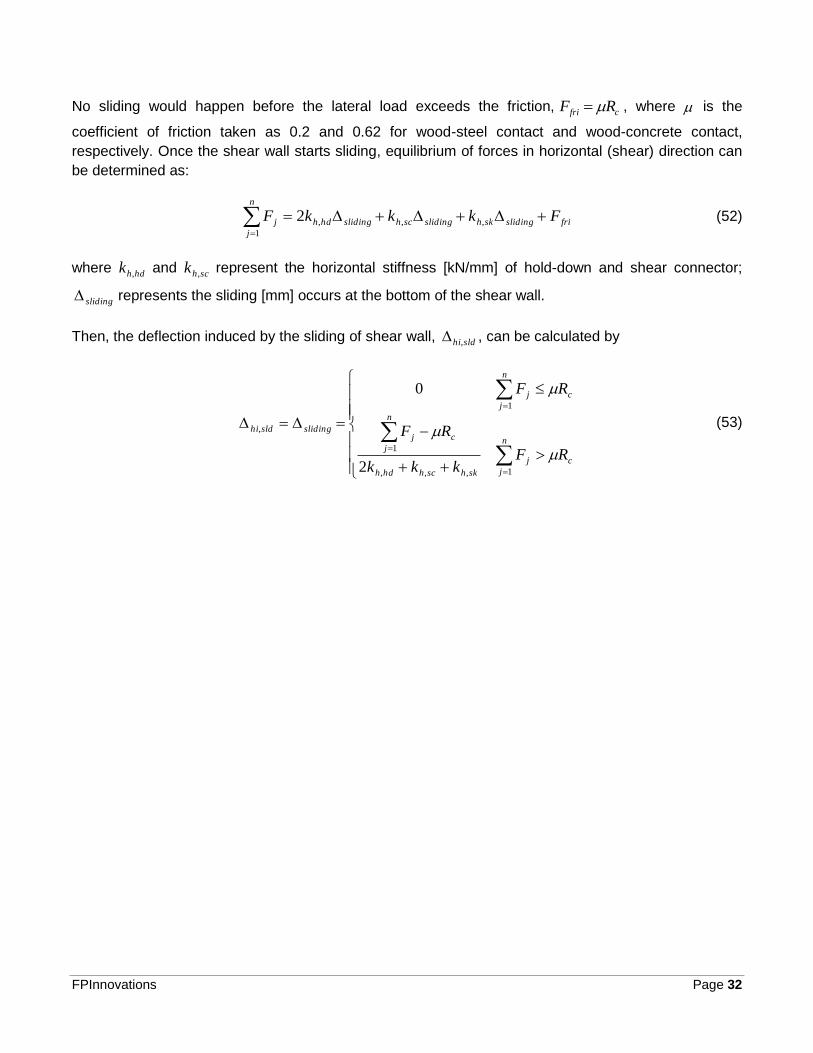
FPInnovations Page 32
No sliding would happen before the lateral load exceeds the friction, cfri RF , where is the
coefficient of friction taken as 0.2 and 0.62 for wood-steel contact and wood-concrete contact,
respectively. Once the shear wall starts sliding, equilibrium of forces in horizontal (shear) direction can
be determined as:
frislidingskhslidingschslidinghdh
n
j
j FkkkF
,,,
1
2 (52)
where hdhk , and schk , represent the horizontal stiffness [kN/mm] of hold-down and shear connector;
sliding represents the sliding [mm] occurs at the bottom of the shear wall.
Then, the deflection induced by the sliding of shear wall, sldhi, , can be calculated by
c
n
j
j
skhschhdh
c
n
j
j
c
n
j
j
slidingsldhi
RFkkk
RF
RF
1,,,
1
1
,
2
0
(53)

FPInnovations Page 33
4.6 Deformation Due to Vertical Slip between Wall Panels This component to the total deflection exists only in a coupled-panel wall configuration. It is induced by
the slip of vertical joints between panels in coupled-panel CLT shear walls. Each panel is assumed to
rotate about the corner on the side without vertical joints, e.g. the left corner for the panel on the left
while the right corner for the panel on the right, as illustrated in Figure 14.
Figure 14. Deflection due to vertical slip between wall panels in coupled balloon-type CLT wall

FPInnovations Page 34
According to the equilibrium of forces in vertical direction and the equilibrium of moments, we can get:
LRNL
hF t
n
j
jj
n
j
j 11 2
(54)
n
j
jtvj NRR12
1 (55)
where tR is the reaction [kN] that occurs at the left corner, and vjR is the total shear [kN] resisted by
the vertical joints:
vjn
k
vjvjvj kR1
(56)
where vjk and vj represent the stiffness of the vertical joints [kN/mm] and the slip occurs in the
vertical joints [mm]; and vjn indicates the number of vertical joints
Then,
Lvjslp tan (57)
where slp is the rotation of wall panels induced by the slip.
Therefore,
vjn
k
kvj
j
n
j
j
slp
kL
hF
1
,
2
1tan (58)
in
k
kvj
j
n
j
j
slphi h
kL
hF
vj
1
,
2
1
, (59)

FPInnovations Page 35
4.7 Lateral Deformation Two analytical models for estimating the lateral deflection of balloon-type CLT shear walls were
developed by combining the deflection components discussed in previous sections. Table 1 lists the
methods for calculating the five deflection components in the two analytical models. In the analytical
model I (AM I), simple methods for calculation of the deformation due to bending and shear were used,
while the rotation was calculated using the simple rigid panel base assumption, respectively. In
analytical model II (AM II), the three deflection components, bending, shear and rotation, are derived
using more sophisticated methods.
Table 1. Methods for calculating the five deflection components in the analytical models
Model Bending Shear Rotation Sliding Slipping
AM I Simple Design
(Parallel layers)
Simple Design
(Parallel layers) Rigid panel base Hold-downs, shear
connectors, shear keys and friction
resist the sliding
Panels rotate and vertical joints resist
the slipping AM II k method
(Composite Theory)
RVE method
(Shear + Rotation) Elastic panel base
Therefore, the five deflection components in model AM I for balloon-type CLT shear walls under lateral
loads can be calculated as follows:
n
ij
ijij
i
j
jijjn
i
i
MIbhi hhhFhhhF
tLEl
)1(
2
1
2
21
1
12
3
0
,, 332
(60)
n
ij
ij
i
j
jjn
i
i
MIshi hFhF
tLGl
)1(121
1
120
,,
(61)
2
,
2
,
2
,
11
,,4
2
hdhdvscvhdhdv
i
n
j
jj
n
j
j
MIrothiLkLkLLk
hNL
hF
(62)
c
n
j
j
skhschhdh
c
n
j
j
c
n
j
j
MIsldhi
RFkkk
RF
RF
1,,,
1
1
,,
2
0
(63)

FPInnovations Page 36
in
k
kvj
j
n
j
j
MIslphi h
kL
hF
vj
1
,
2
1
,, (64)
For the shear walls tested under a single point load at the top in this study (Chapter 5 of this report),
Equations (60) to (64) can be simplified into Equations (65) to (69).
21
1
12
3
0
2
,,
32
ln
i
i
iiMIbhi
tLE
hHFh
(65)
21
1
120
,,ln
i
i
iMIshi
tLG
Fh
(66)
2
,
2
,
2
,
,,4
2
hdhdvscvhdhdv
iMIrothi
LkLkLLk
hNLFH
(67)
c
skhschhdh
c
c
MIsldhi RFkkk
RF
RF
,,,
,,
2
0
(68)
vjn
k
kvj
iMIslphi
kL
FHh
1
,
2
,, (69)
Similarly, the five deflection components in model AM II for balloon-type CLT shear walls under lateral
loads can be calculated as follows:
n
ij
ijij
i
j
jijjn
i
i
MIIbhi hhhFhhhF
t
t
E
EtLE
l)1(
2
1
2
21
1
2
0
903
0
,, 33
11
2
(70)
n
ij
ij
i
j
jj
i
MIIshi hFhFtLG
b
t
)1(10
2
,,
61
(71)

FPInnovations Page 37
iCirotMIIrothi h,,, tan (72)
c
n
j
j
skhschhdh
c
n
j
j
c
n
j
j
MIIsldhi
RFkkk
RF
RF
1,,,
1
1
,,
2
0
(73)
in
k
kvj
j
n
j
j
MIIslphi h
kL
hF
vj
1
,
2
1
,, (74)
Equations (70) to (74) also can be simplified into Equations (75) to (79) for the shear walls tested under
a single point load at the top in this study (Chapter 5 of this report).
t
t
E
EtLE
hHFh
ln
i
i
ii
MIIbhi 21
1
2
0
903
0
2
,,
11
32
(75)
i
i
MIIshi FhtLG
b
t
0
2
,,
61
(76)
iCirotMIIrothi h,,, tan (77)
c
skhschhdh
c
c
MIIsldhi RFkkk
RF
RF
,,,
,,
2
0
(78)
vjn
k
kvj
i
MIIslphi
kL
FHh
1
,
2
,, (79)
Since the rotation of the shear wall with elastic panel base assumption, Cirot, , can only be derived
through an iterative procedure, a Mathcad program (LDofBalloonTypeCLTwall_MII.xmcd) was
developed for method II. For the user convenience, a Mathcad program (LDofBalloonTypeCLTwall_MI.
xmcd) was also developed for method I.

FPInnovations Page 38
4.8 Lateral Resistance It is recommended that the lateral resistance of the balloon-type CLT shear walls be governed by the
yielding of hold-down and/or vertical joints if exist, such that a ductile seismic resisting system can be
achieved. A practical model including three failure scenarios (Figures 15 to 17) was developed to
calculate the lateral resistance of this timber system. The model assumes that the lateral capacity of the
balloon-type CLT shear walls is governed by the strength of the hold-downs, shear connectors, wood
contacted with shear keys and vertical joints if exist, then the lateral resistance of this system can be
taken as the minimum resistance derived in the three scenarios discussed below.
Figure 15. Failure scenario I – shear failure of connections at the wall bottom

FPInnovations Page 39
(a) (b)
Figure 16. Failure scenario II – over-turning failure of single-panel walls: (a) Rigid panel base; and (b) Elastic panel base
FPInnovations Page 40
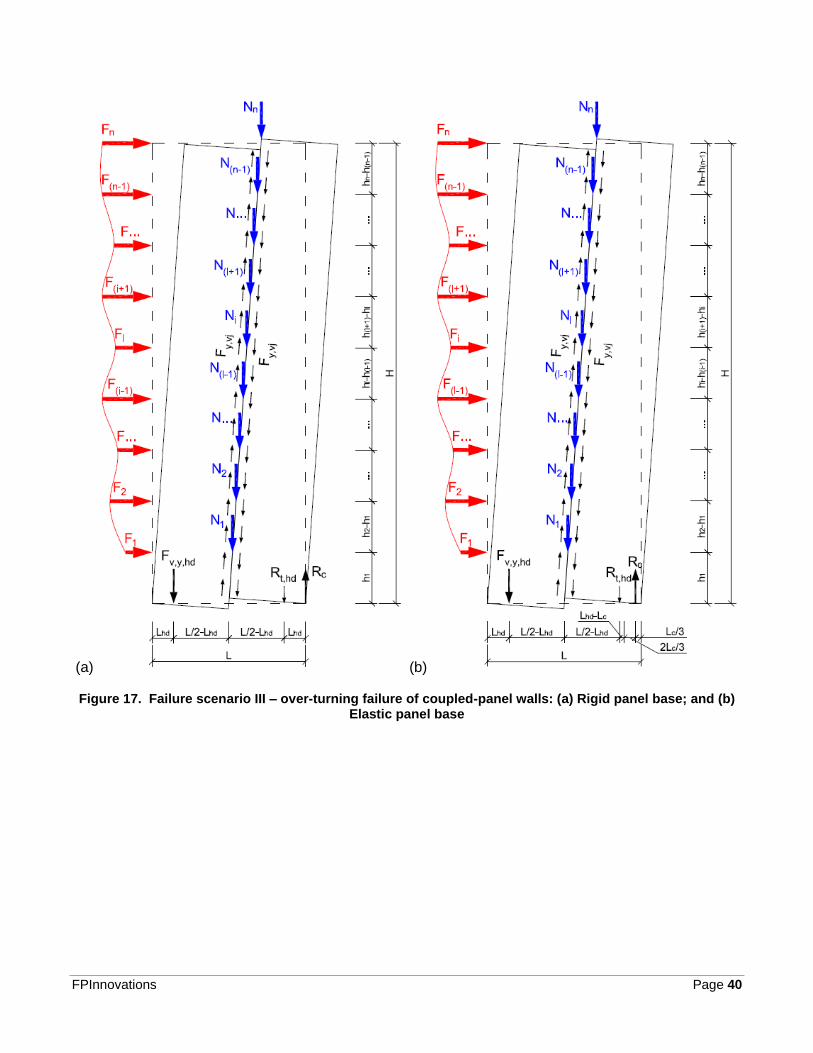
(a) (b)
Figure 17. Failure scenario III – over-turning failure of coupled-panel walls: (a) Rigid panel base; and (b) Elastic panel base

FPInnovations Page 41
Scenario I (Shear failure of connections at the wall bottom):
When the hold-downs and shear connector(s) yield horizontally, and the wood contacting with shear
key at one end crushes successively under base shear, the total lateral load would be
friwyscyhhdyh
n
j
jy FFFFF
,,,,,
1
, 2 (80)
where hdyhF ,, and scyhF ,, represent the horizontal yield load [kN] of the hold-down and shear connector,
respectively, while wyF , represents the compression load of wood in contact with the shear key [kN].
Scenario II (Over-turning failure of single-panel walls):
When the hold-down at one end yields vertically, the over-turning moment induced by the lateral loads
would be
EPL
RLLRLL
RLLLFNLL
RPLRL
RLLFNL
hFc
cchdhdtcsctchdhdyv
n
j
jc
hdhdtscthdhdyv
n
j
j
j
n
j
jy
322
22
,,,,
1
,,,,
1
1
, (81)
where hdyvF ,, represents the vertical yield load of the hold-down [kN]; RP and EP indicate rigid and
elastic panel base assumption, respectively.
Scenario III (Over-turning failure of coupled-panel walls):
When the connectors in the vertical joints yield then followed by yielding of hold-down at one end
vertically, the over-turning moment induced by the lateral loads would be
EPL
RLLRLL
FLL
FNLL
RPLRL
FLL
FNL
hFc
cchdhdtcvjyhdhdyv
n
j
jc
hdhdtvjyhdhdyv
n
j
j
j
n
j
jy
3222
222
,,,,
1
,,,,
1
1
, (82)
where vjyF , indicates the yield load of the vertical joints [kN].
For the shear walls tested under a single point load at the top in this study (Chapter 5 of this report),
Equations (80) to (82) can be simplified into Equations (83) to (85).
friwyscyhhdyhy FFFFF ,,,,,2 (83)

FPInnovations Page 42
EPL
RLLRLL
RLLLFNLL
H
RPLRL
RLLFNL
HF
ccchdhdtcsctchdhdyvc
hdhdtscthdhdyv
y
322
1
22
1
,,,,
,,,,
(84)
EPL
RLLRLL
FLL
FNLL
H
RPLRL
FLL
FNL
HF
c
cchdhdtcvjyhdhdyvc
hdhdtvjyhdhdyv
y
3222
1
222
1
,,,,
,,,,
(85)
The forces resisted by the hold-downs, hdtR , , the shear connector, sctR , , the vertical reaction, cR , and
the friction, friF , can be derived using the trial and error method with the two analytical models for
lateral deflection discussed above. Thus, the two programs for calculating the lateral deflection,
LDofBalloonTypeCLTwall_MI.xmcd and LDofBalloonTypeCLTwall_MII.xmcd, were upgraded to
LPofBalloonTypeCLTwall_MI.xmcd and LPofBalloonTypeCLTwall_MII.xmcd, by adding a function for
calculating the lateral resistance of balloon-type CLT shear walls. The two Mathcad programs make the
developed analytical models easily accessible for structural engineers in developing and designing
solutions using balloon-type CLT construction.
FPInnovations Page 43
5. VALIDATION OF ANALYTICAL MODELS
Previous tests conducted on single- and coupled-panel balloon-type CLT shear walls under single point
load at FPInnovations Quebec lab in 2016 and numerical simulations carried out on identical CLT shear
walls under multiple point loads in this study were used to verify the developed analytical models for
estimating the structural performance of the balloon-type CLT shear walls. Previous connection test
conducted at FPInnovations Quebec lab in 2016 was used to derive connection input for the numerical
models and analytical models.
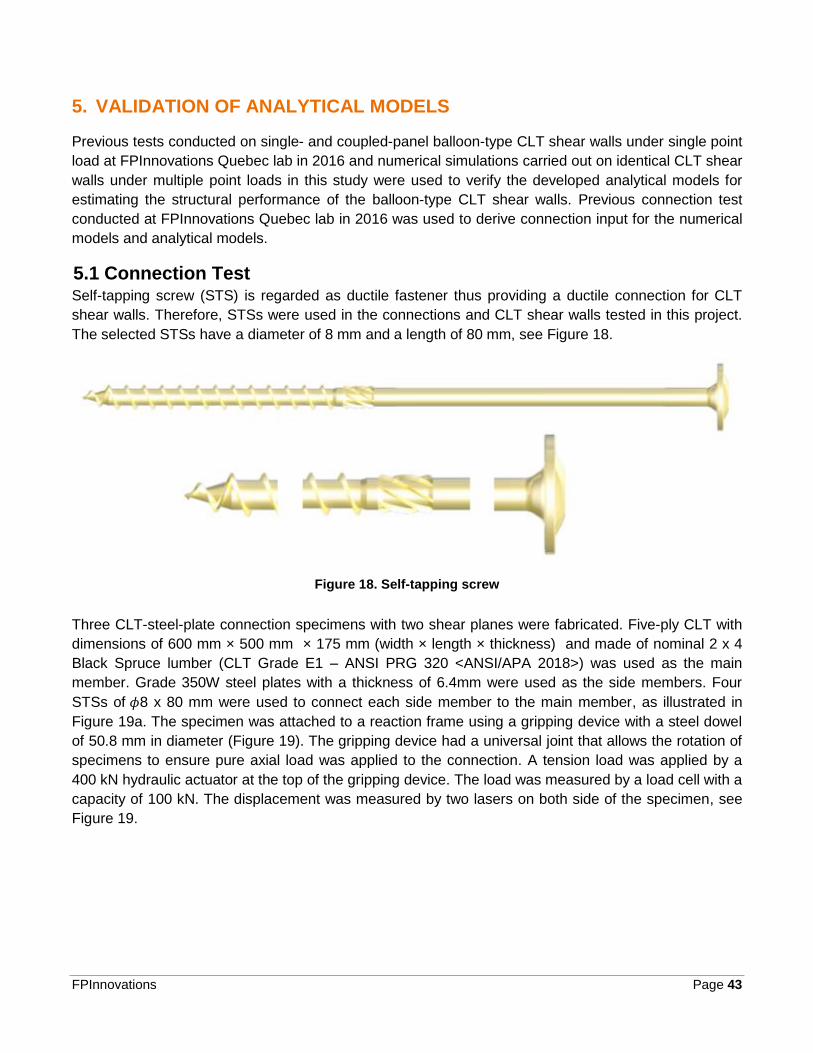
5.1 Connection Test Self-tapping screw (STS) is regarded as ductile fastener thus providing a ductile connection for CLT
shear walls. Therefore, STSs were used in the connections and CLT shear walls tested in this project.
The selected STSs have a diameter of 8 mm and a length of 80 mm, see Figure 18.
Figure 18. Self-tapping screw
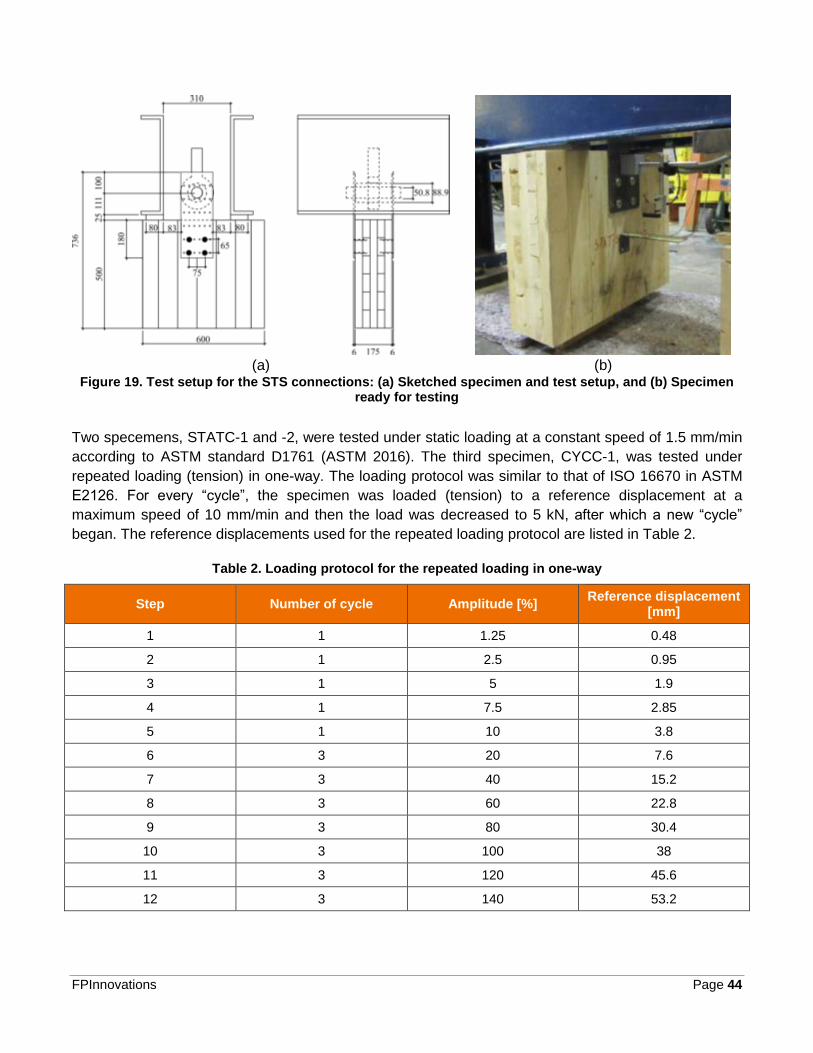
Three CLT-steel-plate connection specimens with two shear planes were fabricated. Five-ply CLT with
dimensions of 600 mm × 500 mm × 175 mm (width × length × thickness) and made of nominal 2 x 4
Black Spruce lumber (CLT Grade E1 – ANSI PRG 320 <ANSI/APA 2018>) was used as the main
member. Grade 350W steel plates with a thickness of 6.4mm were used as the side members. Four
STSs of 𝜙8 x 80 mm were used to connect each side member to the main member, as illustrated in
Figure 19a. The specimen was attached to a reaction frame using a gripping device with a steel dowel
of 50.8 mm in diameter (Figure 19). The gripping device had a universal joint that allows the rotation of
specimens to ensure pure axial load was applied to the connection. A tension load was applied by a
400 kN hydraulic actuator at the top of the gripping device. The load was measured by a load cell with a
capacity of 100 kN. The displacement was measured by two lasers on both side of the specimen, see
Figure 19.
FPInnovations Page 44
(a)
(b)
Figure 19. Test setup for the STS connections: (a) Sketched specimen and test setup, and (b) Specimen ready for testing
Two specemens, STATC-1 and -2, were tested under static loading at a constant speed of 1.5 mm/min
according to ASTM standard D1761 (ASTM 2016). The third specimen, CYCC-1, was tested under
repeated loading (tension) in one-way. The loading protocol was similar to that of ISO 16670 in ASTM
E2126. For every “cycle”, the specimen was loaded (tension) to a reference displacement at a
maximum speed of 10 mm/min and then the load was decreased to 5 kN, after which a new “cycle”
began. The reference displacements used for the repeated loading protocol are listed in Table 2.
Table 2. Loading protocol for the repeated loading in one-way
Step Number of cycle Amplitude [%] Reference displacement
[mm]
1 1 1.25 0.48
2 1 2.5 0.95
3 1 5 1.9
4 1 7.5 2.85
5 1 10 3.8
6 3 20 7.6
7 3 40 15.2
8 3 60 22.8
9 3 80 30.4
10 3 100 38
11 3 120 45.6
12 3 140 53.2

FPInnovations Page 45
The load-displacement curves of the three specimens are shown in Figure 20. It is noticed that the
response of connections under the repeated loading in one-way (CYCC) was similar to those under
static loading (STAC) within the expected deviation. In the tests, the STS yielded without shear-off.
Figure 21 shows the deformation of a STS after testing.
Figure 20. Load-displacement curves of the STS connections
Figure 21. Deformed STS after testing

FPInnovations Page 46
The load-displacement curves of the static loading tested specimens and the envelope curve of the
cyclic testing specimen were analysed using energy equivalent elastic plastic (EEEP) curve method
according to ASTM E2126. The structural performance of the STS connections are summarised in
Table 3. It can be found that the specimens in static loading and repeated loading in one-way test had
similar yield and peak strength with an average of 80.2 kN and 86.8 kN, respectively. Since the
specimen under repeated loading in one-way possessed a lower stiffness (16.3 kN/mm vs. 26.8
kN/mm) thus a lower ductility (9.0 vs. 12.7) compared to specimens under static loading.
Table 3. Structural performance of STS connections
Specimen # 𝑲𝒚𝒊𝒆𝒍𝒅
[kN/mm]
𝐏𝐲
[kN]
∆𝐲𝐢𝐞𝐥𝐝
[mm]
𝐏𝐩𝐞𝐚𝐤
[kN]
∆𝐏𝐩𝐞𝐚𝐤
[mm]
∆𝐮
[mm] ∆𝐮/𝚫𝒚𝒊𝒆𝒍𝒅
STATC-1 27.1 81.3 3.0 88.1 14.4 39.9 13.2
STATC-2 28.5 82.65 2.9 83.5 21.6 35.5 12.1
Average for Static 26.8 80.4 3.0 85.8 17.9 37.6 12.7
CYCC-1(Cyclic) 16.3 79.9 4.9 87.8 21.7 43.7 9.0
Conservatively, the stiffness and strength of specimen tested in repeated loading test were used to
estimate the structural performance of the connections in the balloon-type CLT shear walls tested and
modelled in this study. Assuming that every STS in the connection resisted the same amount of load
and behaved exactly the same in the tests, the stiffness and strength of the connection with one STS
can be taken as 2.0 kN/mm and 10.0 kN, respectively. For the analytical and FE models, the structural
performance of the STS connections is calculated by multiplying stiffness and yield strength of single
STS by the number of STS in the connections.

FPInnovations Page 47
5.2 Shear Wall Test
5.2.1 Material and Methods
A total of five (5) CLT shear walls with overall dimensions of 4125 mm x 840 mm was tested in three
configurations (Figure 22). Two replicates were tested from configuration W1, one subjected to static
loading and the other subjected to cyclic loading. Two replicates were tested under cyclic loading from
configuration W2, while only one replicate from configuration W3 was tested. The differences among
the three configurations are summarised in Table 4.
(a) (b) (c)
Figure 22. Shear walls configurations: (a) W1 with single panel; (b) W2 with semi-rigid vertical joints; and (c) W3 with rigid vertical joints

FPInnovations Page 48
Table 4. Tested CLT shear walls
Specimens Configuration Number of
Panel(s)
Dimensions of Panel(s)
(W x L x T) Vertical Joints Loading
W1STA W1 1 840 x 4125 x 170 None Static
W1CYC W1 1 840 x 4125 x 170 None Cyclic
W2CYCa W2 2 420 x 4125 x 170 Semi-Rigid Cyclic
W2CYCb W2 2 420 x 4125 x 170 Semi-Rigid Cyclic
W3CYC W3 2 420 x 4125 x 170 Rigid Cyclic
All specimens were manufactured using 5-ply CLT made of nominal 2 x 4 Black Spruce lumber (CLT
Grade E1 – ANSI/ PRG 320). Configuration W1 included only a single-panel thus no vertical
connections were needed. Each replicate of configurations W2 and W3 consisted of two panels with
half-length as that of W1. A total of ten semi-rigid vertical joints, half in the front side and the other half
at the back side, were used to connect the two panels in wall configuration W2. Each semi-rigid vertical
joint included a steel plate of 150 x 160 x 4.8 mm (width x length x thickness) and four (4) self-tapping
screws of 𝜙8 x 80 mm. Totally eight rigid vertical joints, aculally eight thick steel plates (170 x 200 x 19
mm), were used to connect the two panels in configuraion W3. All wall configuraions posessed four
hold-downs, two in the front and the other two at the back of the CLT walls. Every hold-down, a L-
shaped bracket consisted of a thick steel plate (25mm) at the bottom and a 6.4mm thick steel plate on
the side, was fastened to the CLT panel using twelel (12) self-tapping screws of 𝜙8 x 80 mm. All
specimens were stored in the laboratory until testing.
Figure 23 shows the test setup with wall configuration W2 ready for testing. The wall specimen was
bolted to the fixed base-beam at the bottom using two threaded rods of 𝜙25 x 125 mm for each hold-
down. Two shear keys, one at each end, were also used to restrain the in-plane movement of the
specimen at the bottom. Two L-shaped angle steel beams (L102 x 102 x 6.4mm) with rollers as lateral
supports were used near the top of the wall to prevent the out-of-plane movement of the specimen. The
lateral load was applied using a hydraulic actuator that was pinned to the steel frame and the loading
beams. The weight of the transfer beam and the hydraulic actuator was 805 N and 960 N, respectively,
which applied a very small vertical load of 1765 N to the tested wall.

FPInnovations Page 49
Figure 23. Test setup with wall configuration W2 ready for testing

FPInnovations Page 50
The instrumentation that was used to measure the load and deflections of the shear walls during the
tests and its location and orientation are illustrated in Figures 21 and 22. The load, Ch1, and the stroke,
Ch2, of the actuator, which are not shown, were measured using a load cell located between the
actuator and the loading beam and a linear potentiometer. The horizontal deflection along the wall
height (Ch3 to Ch6 and Ch17 to Ch19) were also measured. The uplifts at both bottom ends and the
top-left corner of the wall were measured using the linear potentiometers of Ch7 to Ch8 and Ch20. The
relative movement between the hold-down and the panel (Ch7a and Ch8a), and that between two
panels (Ch9 to Ch13) were also measured. Totally, fourteen (14) measurement apparatus were
installed to measure the load and deflection of the wall configuration W1 (Figure 24), while seventeen
(17) for the wall configurations W2 and W3 (Figure 25).
(a) (b)
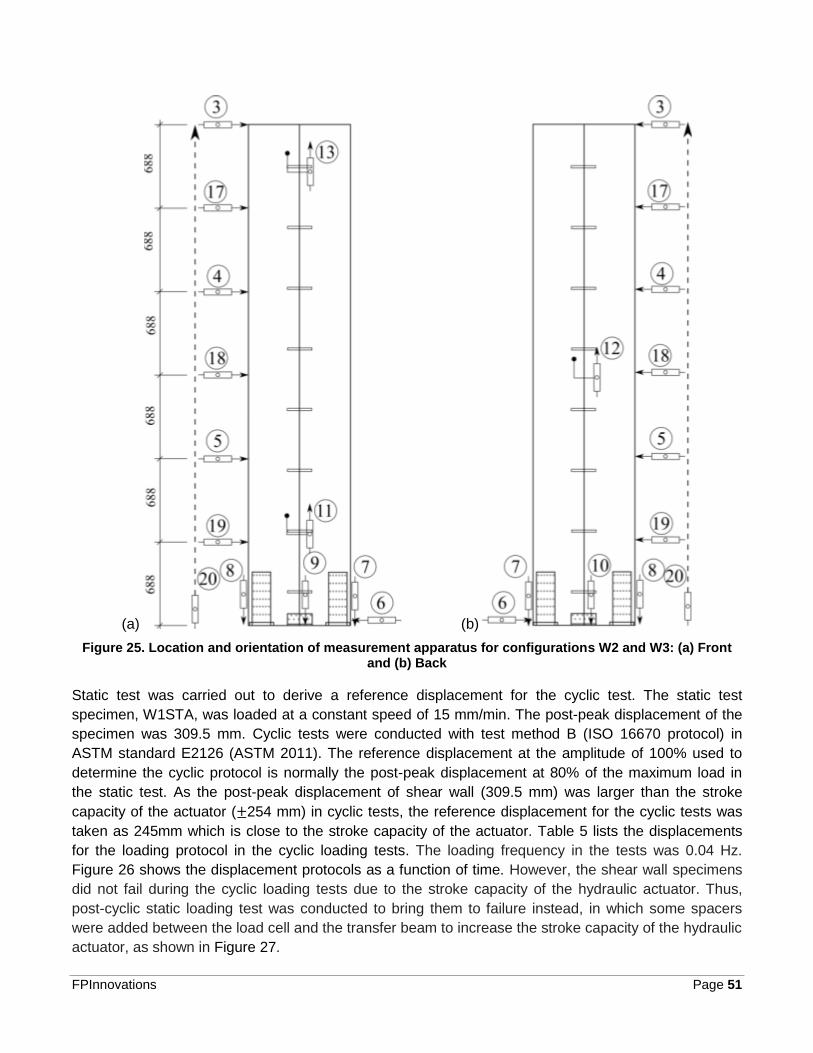
Figure 24. Location and orientation of measurement apparatus for configuration W1: (a) Front and (b) Back
FPInnovations Page 51
(a) (b)
Figure 25. Location and orientation of measurement apparatus for configurations W2 and W3: (a) Front and (b) Back
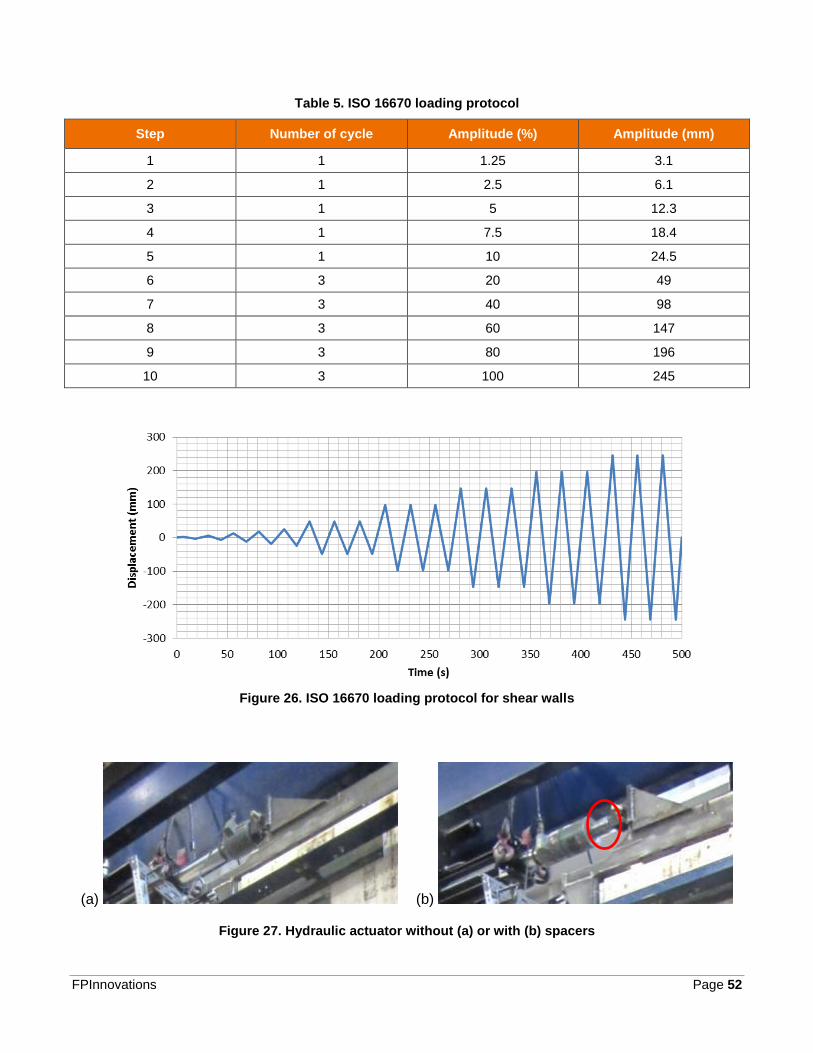
Static test was carried out to derive a reference displacement for the cyclic test. The static test
specimen, W1STA, was loaded at a constant speed of 15 mm/min. The post-peak displacement of the
specimen was 309.5 mm. Cyclic tests were conducted with test method B (ISO 16670 protocol) in
ASTM standard E2126 (ASTM 2011). The reference displacement at the amplitude of 100% used to
determine the cyclic protocol is normally the post-peak displacement at 80% of the maximum load in
the static test. As the post-peak displacement of shear wall (309.5 mm) was larger than the stroke
capacity of the actuator (±254 mm) in cyclic tests, the reference displacement for the cyclic tests was
taken as 245mm which is close to the stroke capacity of the actuator. Table 5 lists the displacements
for the loading protocol in the cyclic loading tests. The loading frequency in the tests was 0.04 Hz.
Figure 26 shows the displacement protocols as a function of time. However, the shear wall specimens
did not fail during the cyclic loading tests due to the stroke capacity of the hydraulic actuator. Thus,
post-cyclic static loading test was conducted to bring them to failure instead, in which some spacers
were added between the load cell and the transfer beam to increase the stroke capacity of the hydraulic
actuator, as shown in Figure 27.
FPInnovations Page 52
Table 5. ISO 16670 loading protocol
Step Number of cycle Amplitude (%) Amplitude (mm)
1 1 1.25 3.1
2 1 2.5 6.1
3 1 5 12.3
4 1 7.5 18.4
5 1 10 24.5
6 3 20 49
7 3 40 98
8 3 60 147
9 3 80 196
10 3 100 245
Figure 26. ISO 16670 loading protocol for shear walls
(a) (b)
Figure 27. Hydraulic actuator without (a) or with (b) spacers

FPInnovations Page 53
5.2.2 Results and Discussion
The load-displacement curves obtained from the static, cyclic and post-cyclic static tests on wall
configuration W1 are shown in Figure 28. It can be seen that this type of wall performed in elastic-
plasticity fashion during the tests. Compared the hysteresis loops of specimen W1CYC with the load-
displacement curve of W1STA, it can be found that the wall configuration W1 under cyclic loading
possessed similar maximum load, relatively higher stiffness and less plastic displacement than that
tested under static loading. The average maximum load of the two specimens obtained during these
tests was 47.4 kN.
Figure 28. Load-displacement curves of wall configuration W1
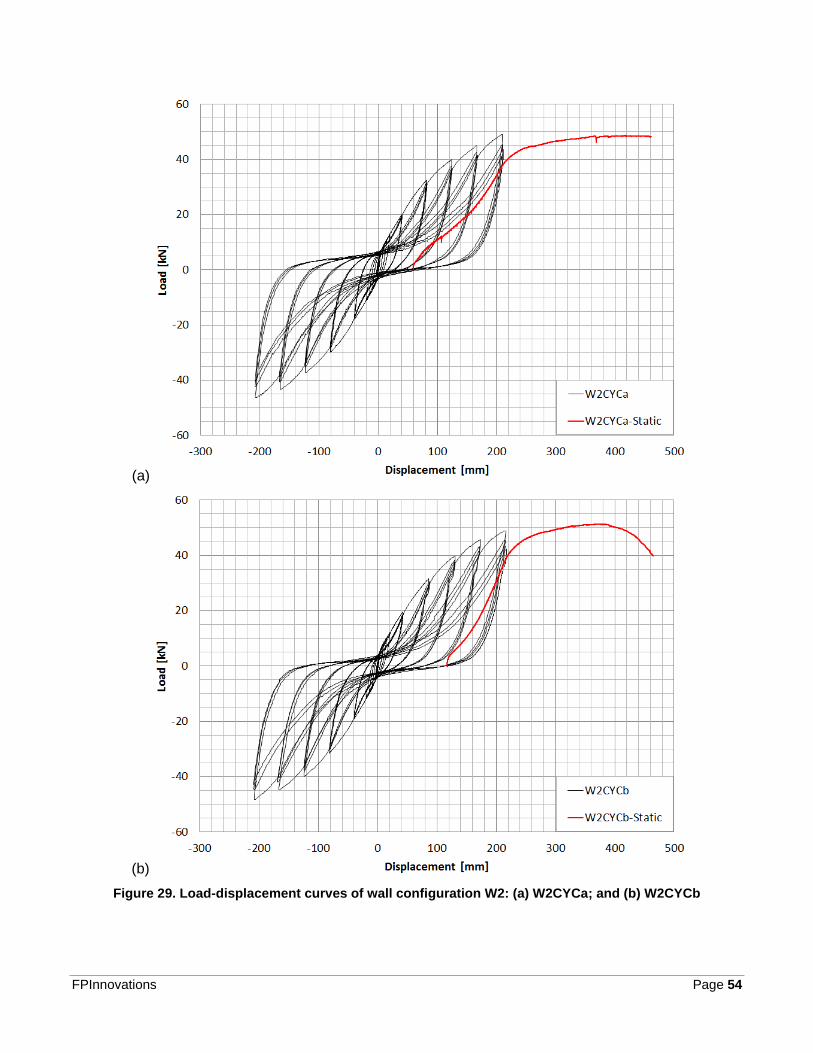
The hysteresis loops obtained from the cyclic test and the load-displacement curve obtained from post-
cyclic static test on the two specimens of wall configuration W2 were similar and shown in Figure 29.
Wall configuration W2 performed in elastic-plasticity fashion with larger plastic platform than wall
configuration W1. The average maximum load of the two specimens obtained during cyclic tests was
48.7 kN.
FPInnovations Page 54
(a)
(b)
Figure 29. Load-displacement curves of wall configuration W2: (a) W2CYCa; and (b) W2CYCb
FPInnovations Page 55
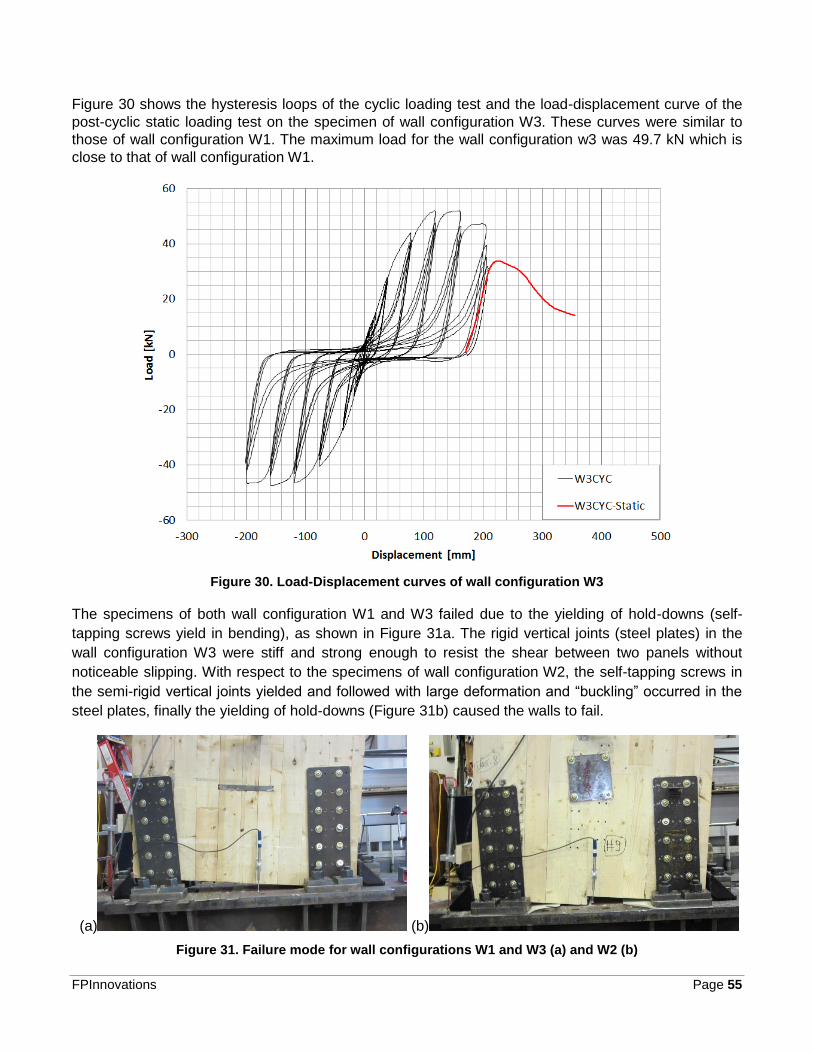
Figure 30 shows the hysteresis loops of the cyclic loading test and the load-displacement curve of the
post-cyclic static loading test on the specimen of wall configuration W3. These curves were similar to
those of wall configuration W1. The maximum load for the wall configuration w3 was 49.7 kN which is
close to that of wall configuration W1.
Figure 30. Load-Displacement curves of wall configuration W3
The specimens of both wall configuration W1 and W3 failed due to the yielding of hold-downs (self-
tapping screws yield in bending), as shown in Figure 31a. The rigid vertical joints (steel plates) in the
wall configuration W3 were stiff and strong enough to resist the shear between two panels without
noticeable slipping. With respect to the specimens of wall configuration W2, the self-tapping screws in
the semi-rigid vertical joints yielded and followed with large deformation and “buckling” occurred in the
steel plates, finally the yielding of hold-downs (Figure 31b) caused the walls to fail.
(a) (b)
Figure 31. Failure mode for wall configurations W1 and W3 (a) and W2 (b)

FPInnovations Page 56
Figure 32 shows the load-displacement curve of specimen in the static test and the envelop curves of
specimens in the cyclic tests. The positive envelope curves for specimens of wall configurations W2
and W3 were derived by combining the envelope in the 1st quadrant and the last part of the load-
displacement curve in post-cyclic static tests. It can be observed that specimens of wall configuration
W2 were more flexible with larger failure deformation than those of configuration W1 and W3. It was
because the vertical joints used in the wall configuration W2 were semi-rigid and ductile. A maximum
slip of 25 mm between two panels (Figure 31b) was measured in the specimens during the cyclic tests.
The specimen of wall configuration W3 possessed similar stiffness, strength and failure deformation as
those of wall configuration W1. It was due to the fact that the vertical joints with thick steel plates
between panels were stiff and strong enough to keep the two panels working together as a single panel
similar to the wall configuration W1.
Figure 32. Load-displacement curves of the tested balloon-type CLT shear walls
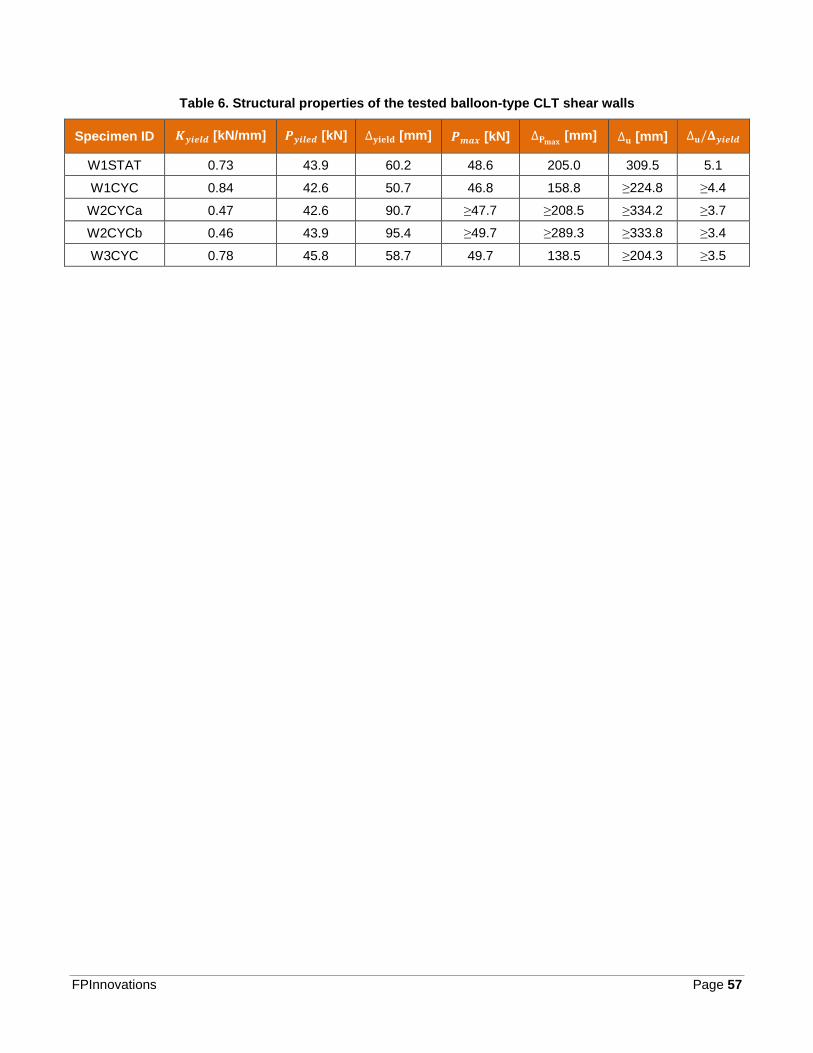
Table 6 lists the main structural properties of the balloon-type CLT shear walls which were obtained by
analysing the load-displacement curves shown in Figure 32 using the EEEP curve method according to
ASTM E2126. In the table, properties following “≥” were the maximum value derived in the tests
because of the limited stroke of the actuator. The actual values for these properties were expected to
be not less than these listed values. The tested specimens had similar yield and maximum load, with an
average of 43.8 kN and 48.5 kN, respectively. The wall configurations W1 and W3 possessed higher
stiffness and smaller failure displacement, compared to wall configuration W2. Wall configuration W2
was constructed with semi-rigid vertical joints thus being more flexible. However, the ductility of all
tested wall configurations was similar and larger than 3.4.
FPInnovations Page 57
Table 6. Structural properties of the tested balloon-type CLT shear walls
Specimen ID 𝑲𝒚𝒊𝒆𝒍𝒅 [kN/mm] 𝑷𝒚𝒊𝒍𝒆𝒅 [kN] ∆𝐲𝐢𝐞𝐥𝐝 [mm] 𝑷𝒎𝒂𝒙 [kN] ∆𝐏𝐦𝐚𝐱 [mm] ∆𝐮 [mm] ∆𝐮/𝚫𝒚𝒊𝒆𝒍𝒅
W1STAT 0.73 43.9 60.2 48.6 205.0 309.5 5.1
W1CYC 0.84 42.6 50.7 46.8 158.8 ≥224.8 ≥4.4
W2CYCa 0.47 42.6 90.7 ≥47.7 ≥208.5 ≥334.2 ≥3.7
W2CYCb 0.46 43.9 95.4 ≥49.7 ≥289.3 ≥333.8 ≥3.4
W3CYC 0.78 45.8 58.7 49.7 138.5 ≥204.3 ≥3.5
FPInnovations Page 58
5.3 FE Simulation
5.3.1 FE Model Development and Validation
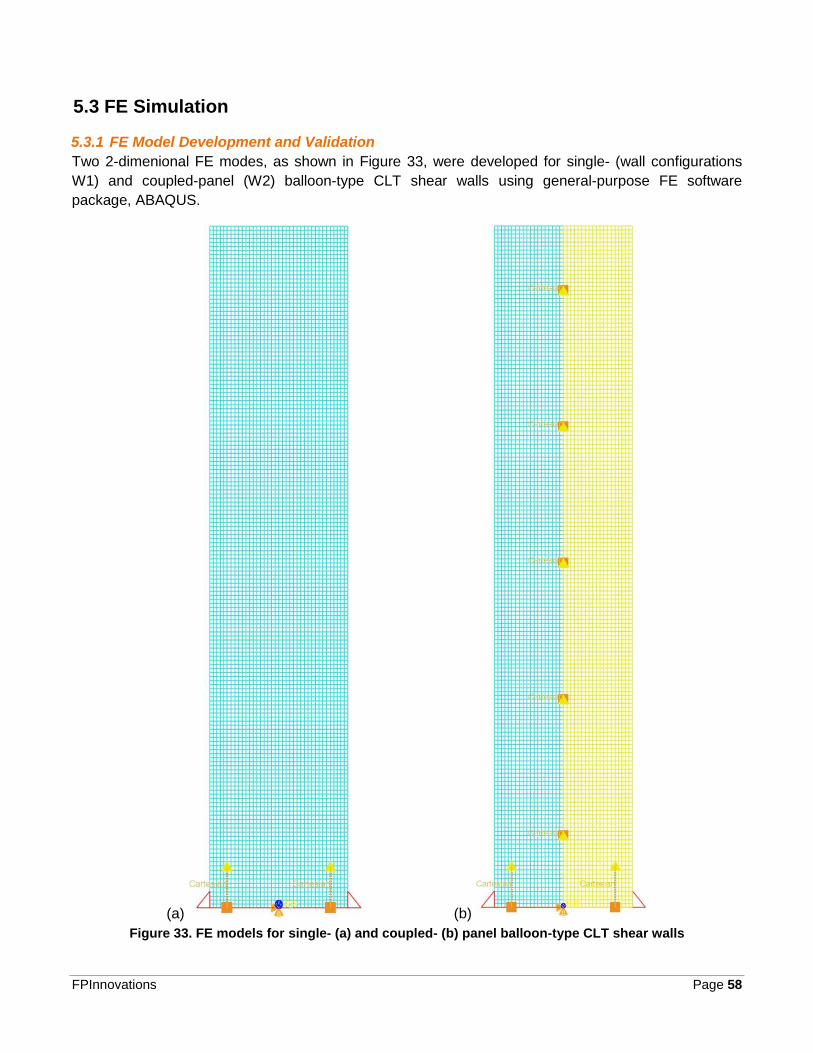
Two 2-dimenional FE modes, as shown in Figure 33, were developed for single- (wall configurations
W1) and coupled-panel (W2) balloon-type CLT shear walls using general-purpose FE software
package, ABAQUS.
(a) (b)
Figure 33. FE models for single- (a) and coupled- (b) panel balloon-type CLT shear walls
FPInnovations Page 59
The CLT panels in the shear wall models were mashed using 4-node bilinear plane stress quadrilateral
elements, CPS4, with typical dimensions of 25 x 25 mm. Two sets of MOE and shear modulus
calculated using analytical models I (7020 MPa and 438.75 MPa) and II (7176 MPa and 379 MPa) were
assigned to the CLT panel elements to investigate the influence of the stiffness properties of CLT
panel. As a result, four models were developed in total, with two models with different MOE and G for
the same wall configuration. A Poisson’s ratio of 0.3, a compressive strength of 30 MPa parallel to
grain, and a compressive strength of 15 MPa perpendicular to grain (Chen et al. 2018) were used for all
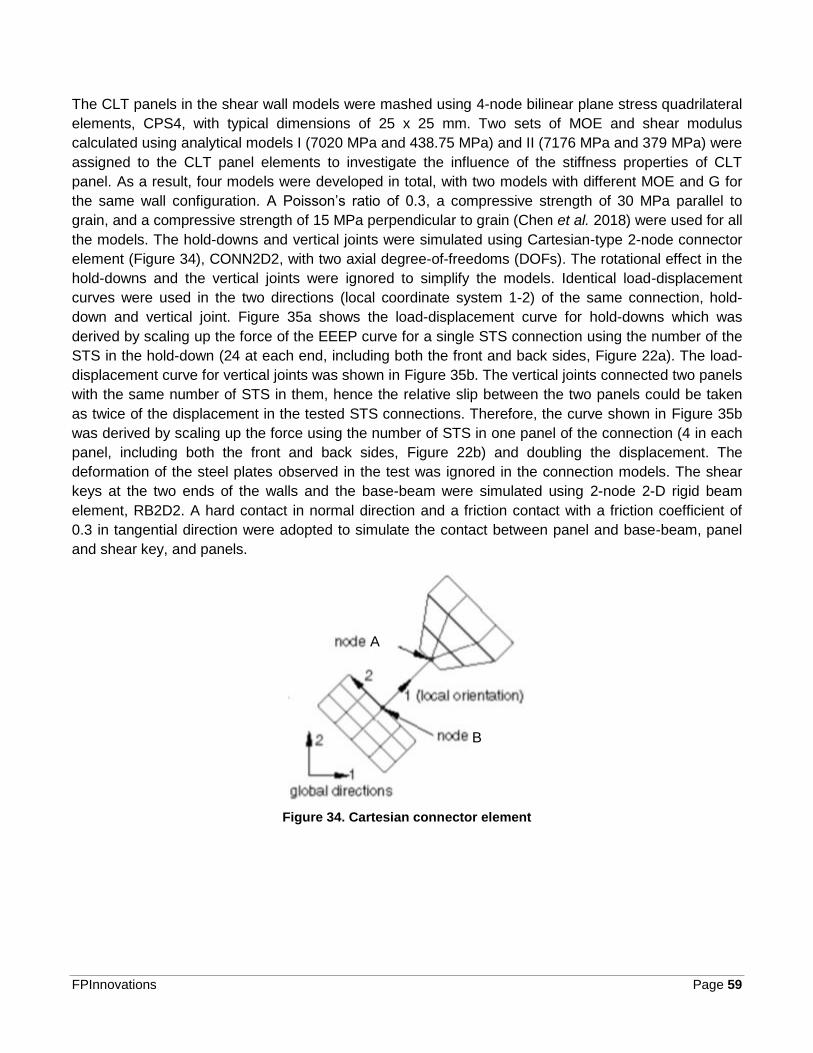
the models. The hold-downs and vertical joints were simulated using Cartesian-type 2-node connector
element (Figure 34), CONN2D2, with two axial degree-of-freedoms (DOFs). The rotational effect in the
hold-downs and the vertical joints were ignored to simplify the models. Identical load-displacement
curves were used in the two directions (local coordinate system 1-2) of the same connection, hold-
down and vertical joint. Figure 35a shows the load-displacement curve for hold-downs which was
derived by scaling up the force of the EEEP curve for a single STS connection using the number of the
STS in the hold-down (24 at each end, including both the front and back sides, Figure 22a). The load-
displacement curve for vertical joints was shown in Figure 35b. The vertical joints connected two panels
with the same number of STS in them, hence the relative slip between the two panels could be taken
as twice of the displacement in the tested STS connections. Therefore, the curve shown in Figure 35b
was derived by scaling up the force using the number of STS in one panel of the connection (4 in each
panel, including both the front and back sides, Figure 22b) and doubling the displacement. The
deformation of the steel plates observed in the test was ignored in the connection models. The shear
keys at the two ends of the walls and the base-beam were simulated using 2-node 2-D rigid beam
element, RB2D2. A hard contact in normal direction and a friction contact with a friction coefficient of
0.3 in tangential direction were adopted to simulate the contact between panel and base-beam, panel
and shear key, and panels.
Figure 34. Cartesian connector element
A
B

FPInnovations Page 60
(a)
(b)
Figure 35. Load-displacement curves for hold-downs (a) and vertical joints (b)
In an attempt to verify the FE models, static stress analyses were conducted on the four FE models for
the two wall configurations (W1 and W2) with different MOE and G. Gravity load was applied to the
panel(s) uniformly and the vertical load induced by the transfer beam and the hydraulic actuator was
applied to the top of the panel uniformly; while a single point lateral load was applied at the left-top
corner of the wall models. The load-displacement curves of the FE models along with those obtained
from tests were shown in Figure 36. The yield load of shear walls (Table 6) is also shown in the figures.
FEM I (II) represents the FE models with MOE and G calculated using analytical model I (II). It can be
found that FEM I and II for the same wall configuration yielded similar results. Thus, either analytical
model I or II can be used to calculate the MOE and G for the finite element models. It can be seen from
the figures that the FE models were able to reasonably predict the load and displacement of the tested
walls.

FPInnovations Page 61
(a)
(b)
Figure 36. Load-displacement curves obtained from cyclic tests and simulation: (a) Wall configuration W1; and (b) Wall configuration W2
The displacements of the walls at 40% maximum load along the height are shown in Figure 37. It can
be seen that the FE models can predict the displacement of shear wall(s) without or with vertical joints
with a good accuracy. Moreover, the deformation shapes of the two wall configurations (Figure 38)
obtained from FE modelling were similar to those observed in the tests (Figure 31). The FE models also
indicated that wall configuration W1 yielded due to the yielding of the left hold-down, while the yielding
of W2 was caused by the vertical joints and the left hold-down which yielded successively. Therefore,
the FE models developed in this study is capable of predicting the performance of the balloon-type CLT
shear walls. Since the difference between the simulation results of FEM I and FEM II was small enough
to be ignored, FEM II with MOE and G derived by analytical model II was used in the simulation below.

FPInnovations Page 62
(a)
(b)
Figure 37. Displacement along the wall height obtained from cyclic tests and simulation: (a) Wall configuration W1; and (b) Wall configuration W2
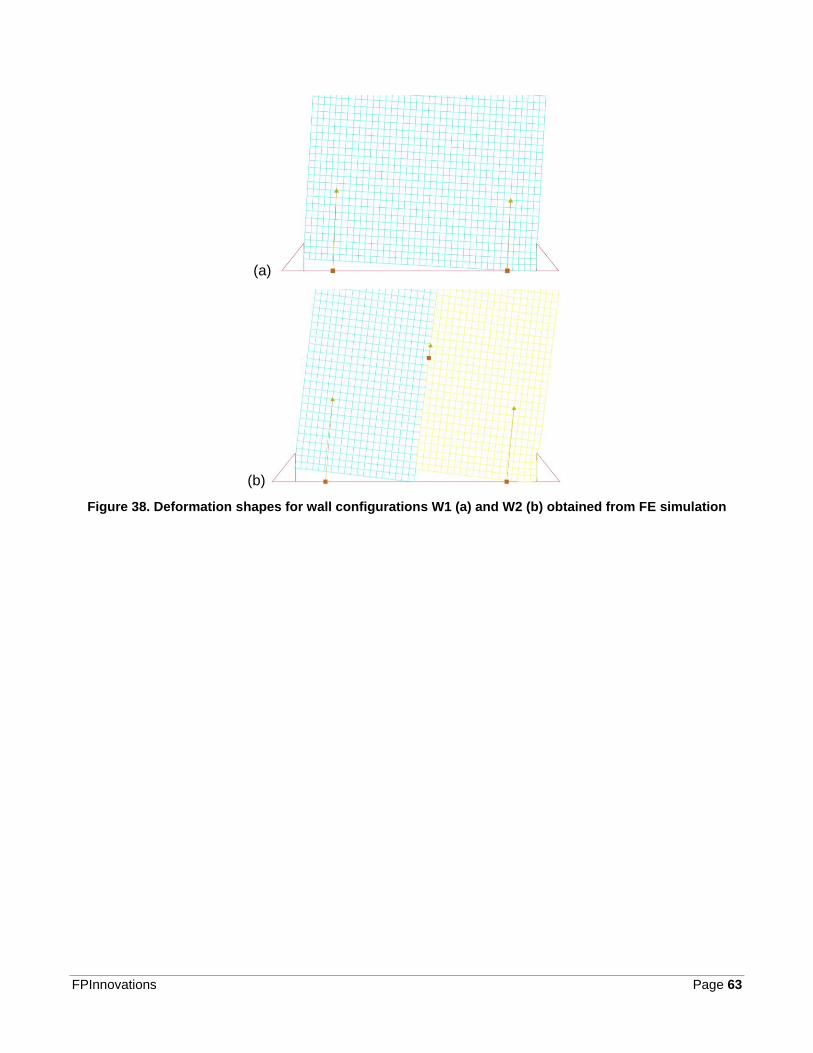
FPInnovations Page 63
(a)
(b)
Figure 38. Deformation shapes for wall configurations W1 (a) and W2 (b) obtained from FE simulation
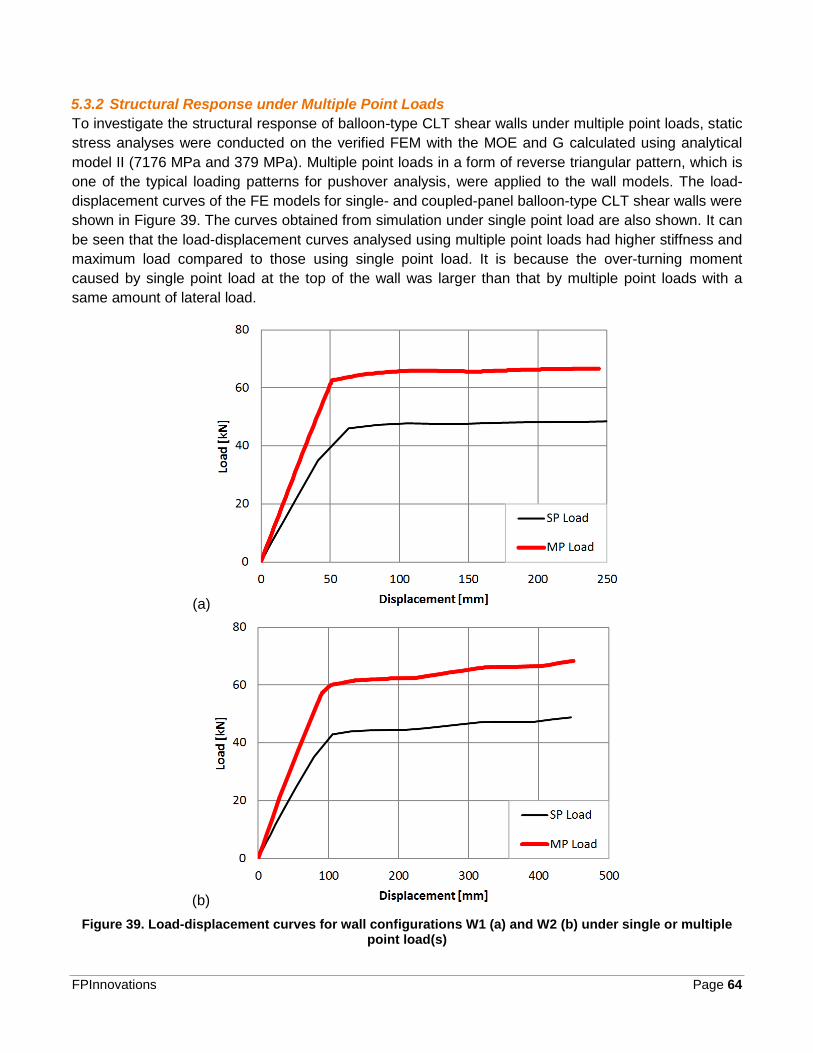
FPInnovations Page 64
5.3.2 Structural Response under Multiple Point Loads
To investigate the structural response of balloon-type CLT shear walls under multiple point loads, static
stress analyses were conducted on the verified FEM with the MOE and G calculated using analytical
model II (7176 MPa and 379 MPa). Multiple point loads in a form of reverse triangular pattern, which is
one of the typical loading patterns for pushover analysis, were applied to the wall models. The load-
displacement curves of the FE models for single- and coupled-panel balloon-type CLT shear walls were
shown in Figure 39. The curves obtained from simulation under single point load are also shown. It can
be seen that the load-displacement curves analysed using multiple point loads had higher stiffness and
maximum load compared to those using single point load. It is because the over-turning moment
caused by single point load at the top of the wall was larger than that by multiple point loads with a
same amount of lateral load.
(a)
(b)
Figure 39. Load-displacement curves for wall configurations W1 (a) and W2 (b) under single or multiple point load(s)

FPInnovations Page 65
The displacements of the FE models under 40% maximum loads along the wall height are shown in
Figure 40. The FE models under multiple point loads reached similar displacement as those under
single point load at the corresponding 40% maximum load. The failure models of the two wall
configurations under multiple point loads were similar to those under single point load (Figure 38).
(a)
(b)
Figure 40. Displacement along the wall height under single or multiple point load(s) (40% maximum load): (a) Wall configuration W1; and (b) Wall configuration W2

FPInnovations Page 66
5.4 Analytical Model Validation The developed analytical models for predicting the deflection and resistance of the balloon-type CLT
shear walls were verified using the test results of walls under single point load at the top and the FE
simulation results of walls under multiple point loads.
5.4.1 Single Point Load
The test results of single- (wall configuration W1) and coupled-panel (W2) balloon-type CLT shear walls
under single point load were used to verified the developed analytical models. Tables 7 to 9 list the
inputs for the analytical models. The dimensions of the shear walls (Table 7) and the mechanical
properties of connections (Table 9) were derived from the wall tests and connection tests in this study,
while the physical and mechanical properties of CLT panels (Table 8) were derived from the
compression tests on CLT panels by Chen et al. (2018).
Table 7. Dimensions of balloon-type CLT shear walls
𝑯 [mm] 𝒉𝒊 [mm] 𝑳 [mm] 𝑳𝒉𝒅 [mm] 𝒕 [mm] 𝒕𝐢 [mm] 𝒕𝟐 [mm] 𝒃𝒎𝒏 [mm]
4125 687.5 840 105.5 175 35 35 89
Table 8. Physical and mechanical properties of CLT panels
𝝆 [kg/m3] 𝝁 𝑬𝟎° [MPa] 𝑬𝟗𝟎° [MPa] 𝑮𝟎° [MPa] 𝒇𝒄,𝟎° [MPa] 𝒇𝒄,𝟗𝟎° [MPa]
0.45 0.3 11700 390 731 30 15
Table 9. Mechanical properties of connections
Connection Type
Stiffness [kN/mm] Yield Strength [kN]
Number Vertical Horizontal Vertical Horizontal
Hold-down 48 48 240 240 2
Shear key 0 10 0 263 2
Vertical joint 8 8 40 40 5
Figure 41 shows the load-displacement curves calculated using the analytical models I and II, along
with the envelope curves (in the 1st and 3rd quadrant) of wall configurations W1 and W2 and the yield
load of shear walls (Table 6). It can be seen that analytical model I provided a higher stiffness and
resistance for single- and coupled-panel shear walls than analytical model II. Analytical model I
relatively overestimated the yield load of the single-panel wall, while analytical model II relatively
underestimated the yield load of the coupled-panel walls. However, the yield load of the wall
configurations W1 and W2 did not exceed the range between the predictions by analytical model I and
II.
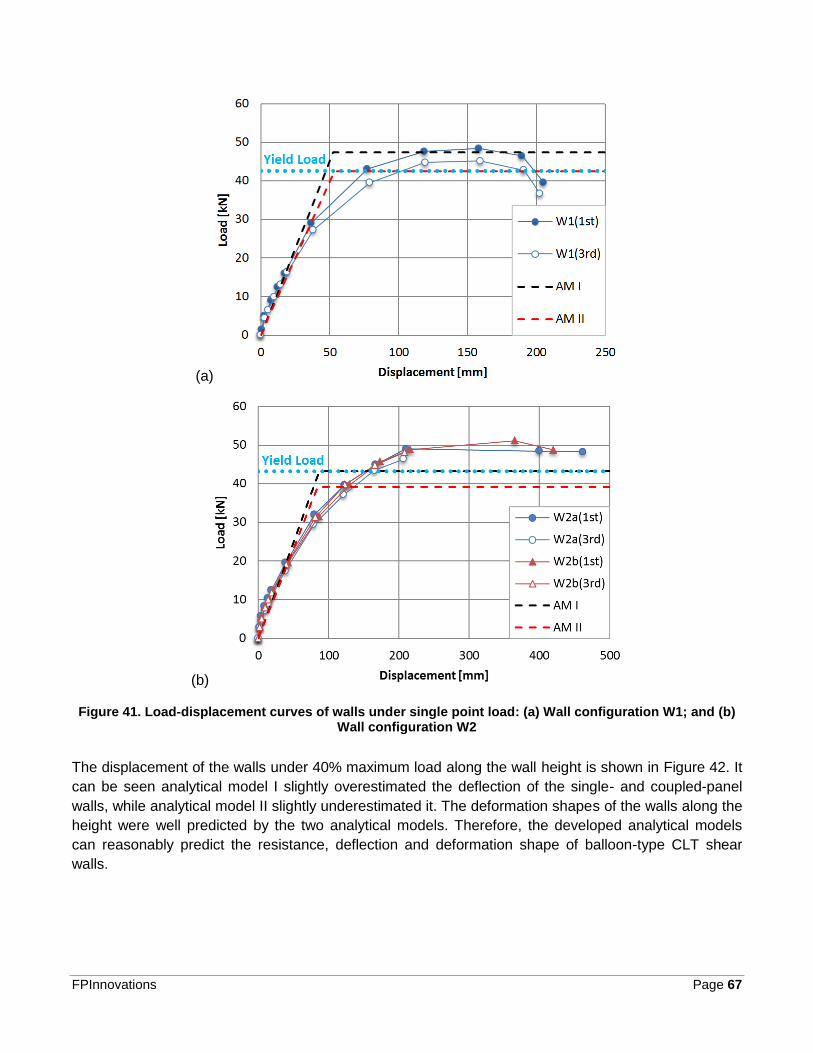
FPInnovations Page 67
(a)
(b)
Figure 41. Load-displacement curves of walls under single point load: (a) Wall configuration W1; and (b) Wall configuration W2
The displacement of the walls under 40% maximum load along the wall height is shown in Figure 42. It
can be seen analytical model I slightly overestimated the deflection of the single- and coupled-panel
walls, while analytical model II slightly underestimated it. The deformation shapes of the walls along the
height were well predicted by the two analytical models. Therefore, the developed analytical models
can reasonably predict the resistance, deflection and deformation shape of balloon-type CLT shear
walls.

FPInnovations Page 68
(a)
(b)
Figure 42. Displacement along the wall height under single point load (40% maximum load): (a) Wall configuration W1; and (b) Wall configuration W2

FPInnovations Page 69
5.4.2 Multiple Point Loads
The simulation results of single- (wall configuration W1) and coupled-panel (W2) balloon-type CLT
shear walls under multiple point loads were also used to verify the developed analytical models. The
model inputs given in Tables 7 to 9 were also used in this analysis using multiple point loads in a form
of reverse triangular pattern. The load-displacement curves of the wall configuration W1 (without
vertical joints) and W2 (with vertical joints) under multiple point loads predicted using analytical models
were shown in Figure 43, along with the FE modelling results. It can be seen that the two analytical
models can predict the displacement and yield load of the balloon-type CLT shear walls under multiple
point loads well.
(a)
(b)
Figure 43. Load-displacement curves of walls under multiple point loads: (a) Wall configuration W1; and (b) Wall configuration W2

FPInnovations Page 70
Figure 44 shows the displacement of the walls under 40% maximum loads along the wall height.
Similar to the walls under single point load, the two models can predict the deflection of wall along with
the height and deformation shape well. Therefore, the developed analytical models can be used to
predict the deflection and resistance of the single- and coupled-panel balloon-type CLT shear walls
under various lateral loads.
(a)
(b)
Figure 44. Displacement along the wall height under multiple point loads (40% maximum load): (a) Wall configuration W1; and (b) Wall configuration W2
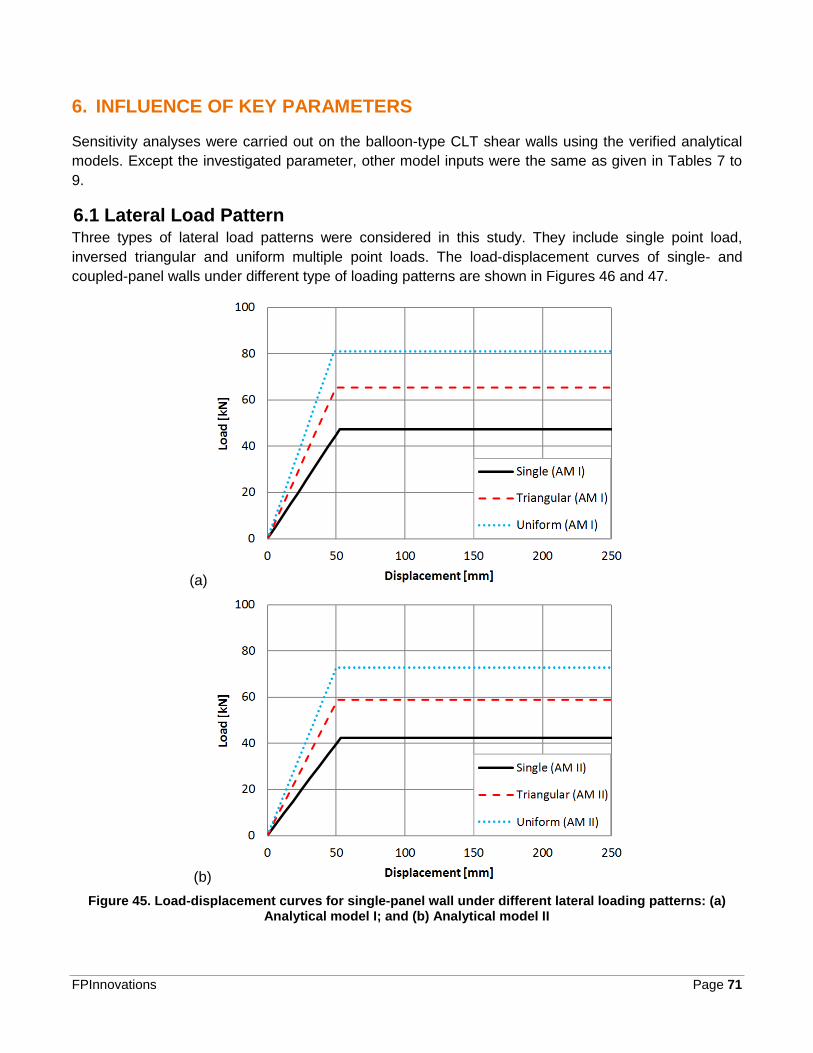
FPInnovations Page 71
6. INFLUENCE OF KEY PARAMETERS
Sensitivity analyses were carried out on the balloon-type CLT shear walls using the verified analytical
models. Except the investigated parameter, other model inputs were the same as given in Tables 7 to
9.
6.1 Lateral Load Pattern Three types of lateral load patterns were considered in this study. They include single point load,
inversed triangular and uniform multiple point loads. The load-displacement curves of single- and
coupled-panel walls under different type of loading patterns are shown in Figures 46 and 47.
(a)
(b)
Figure 45. Load-displacement curves for single-panel wall under different lateral loading patterns: (a) Analytical model I; and (b) Analytical model II
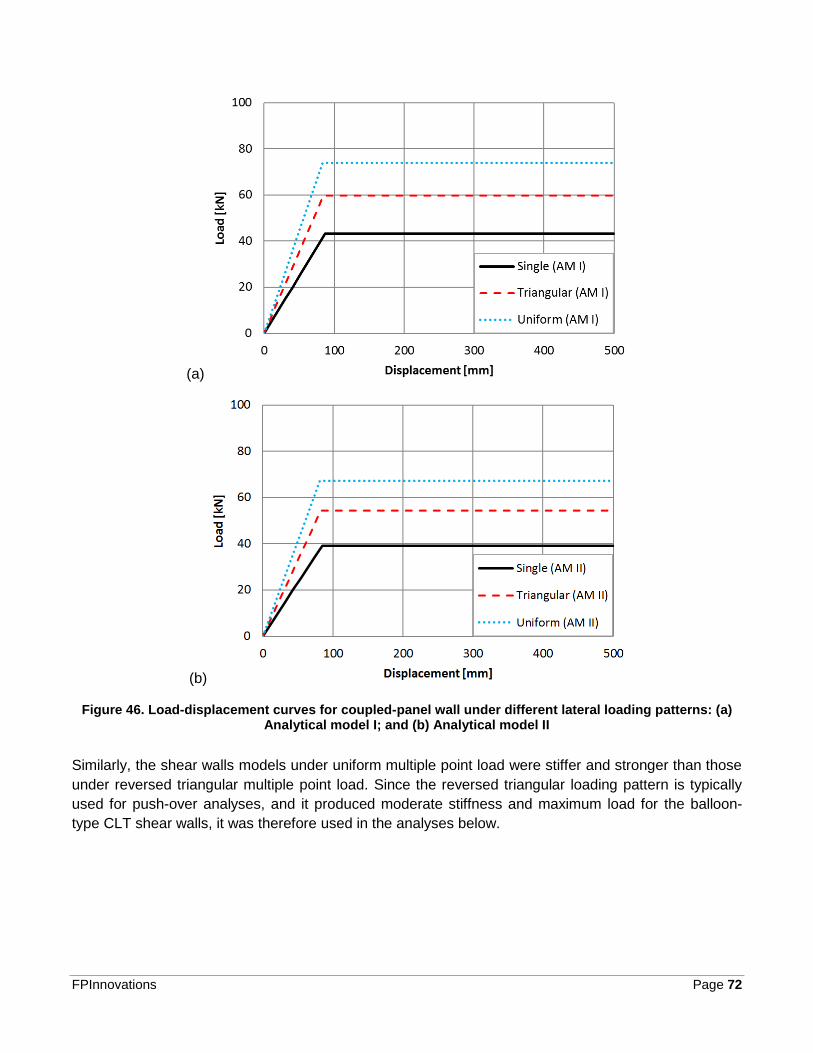
FPInnovations Page 72
(a)
(b)
Figure 46. Load-displacement curves for coupled-panel wall under different lateral loading patterns: (a) Analytical model I; and (b) Analytical model II
Similarly, the shear walls models under uniform multiple point load were stiffer and stronger than those
under reversed triangular multiple point load. Since the reversed triangular loading pattern is typically
used for push-over analyses, and it produced moderate stiffness and maximum load for the balloon-
type CLT shear walls, it was therefore used in the analyses below.

FPInnovations Page 73
6.2 Vertical Load Vertical load applied to the shear walls provides over-turning resistance to the walls, as a result, it
affects the lateral stiffness and load-carry capacity of the balloon-type CLT shear walls. Six vertical load
cases, 0%, 20%, 40%, 60%, 80% and 100% of a reference vertical load, were analysed using analytical
model II with elastic panel base assumption. The reference vertical load was taken as 500kN, which
can provide an overturning resistance roughly equalled to that possessed by the walls without vertical
load. The influence of vertical load on the lateral stiffness and resistance of the single- and coupled-
panel shear walls were shown in Figure 47.
(a)
(b)
Figure 47. Influence of vertical load on the lateral stiffness and resistance of single- (a) and coupled- (b) panel balloon-type shear walls
As shown in Figure 47a, the lateral stiffness of the single-panel shear wall increased 40% linearly
when the vertical load ratio increased from 0 to 100%. The resistance of this wall model also increased
FPInnovations Page 74
40%. However, the resistance increased significantly before the vertical load ratio reached to 60%,
beyond that the increase became very small. Because the horizontal distance (moment arm) between
the vertical load and the rotating point of wall became shorter with increase in the vertical load, the
contribution of increasing vertical load to the over-turning capacity became less. The influence of
vertical load on the resistance of the coupled-panel shear walls was similar to that on single-panel
shear walls, as shown in Figure 47b. The increase in the stiffness of coupled-panel shear walls (22%)
was less than that in single-panel shear wall. This is because the vertical load only affects the
deflection induced by the rotation and sliding which contributed less in the coupled-panel shear walls
with each panel having twice the panel aspect ratio (height to length) of single-panel walls.

FPInnovations Page 75
6.3 Wall Aspect Ratio The influence of wall aspect ratio (height to length) was studied on the single-panel shear wall under
multiple (four) point loads in reversed triangular pattern. The wall was regarded as a four-storey
building wall with a total height of 12m. The width of the wall was decreased from 3m to 1m such that
five wall aspect ratios of 4:1, 6:1, 8:1, 10:1 and 12:1 were achieved. Analytical model II was used for
analysis. The influenced of wall aspect ratio on the load-displacement curve, the stiffness and
resistance of the balloon-type CLT shear walls were shown in Figures 45 and 46. It can be seen that
the stiffness and resistance of the balloon-type CLT shear walls decreased logarithmically with an
increase in aspect ratio. It inducates that a wide wall possed higher stiffness and resistance compared
to a narrow wall.
Figure 48. Influence of wall aspect ratio on the load-displacement curve of single-panel balloon-type CLT
shear walls
Figure 49. Influence of wall aspect ratio on the structural performance of single-panel balloon-type CLT
shear walls
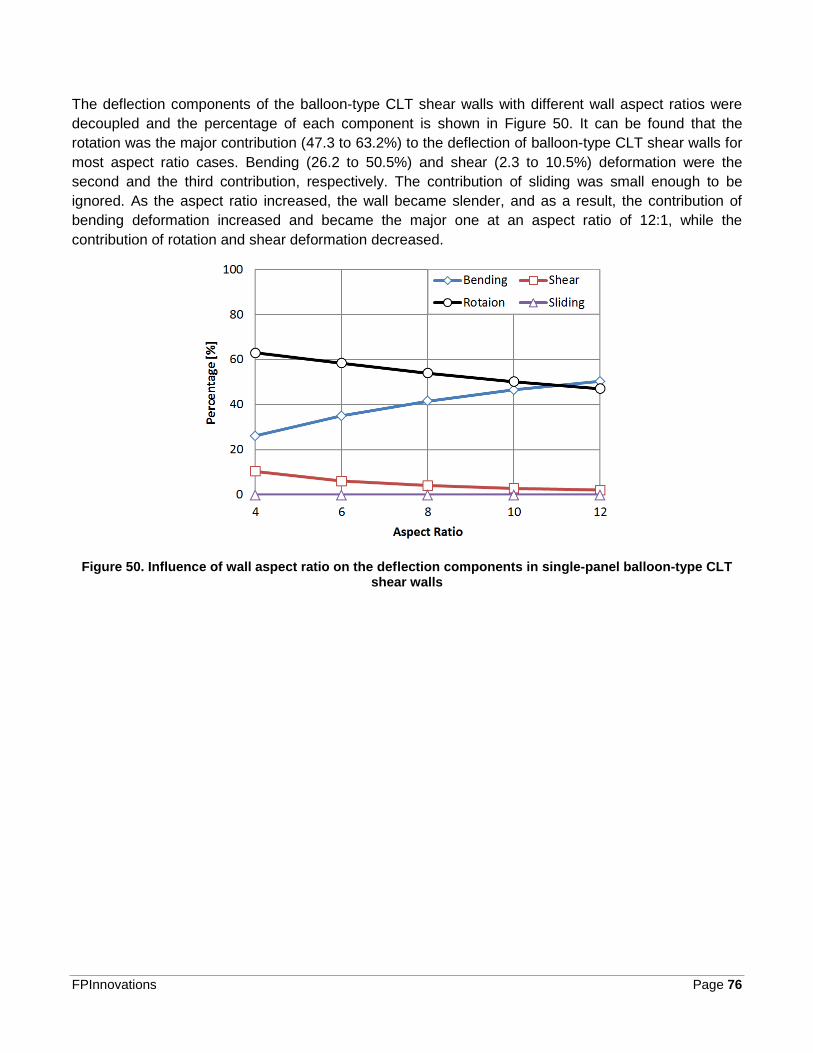
FPInnovations Page 76
The deflection components of the balloon-type CLT shear walls with different wall aspect ratios were
decoupled and the percentage of each component is shown in Figure 50. It can be found that the
rotation was the major contribution (47.3 to 63.2%) to the deflection of balloon-type CLT shear walls for
most aspect ratio cases. Bending (26.2 to 50.5%) and shear (2.3 to 10.5%) deformation were the
second and the third contribution, respectively. The contribution of sliding was small enough to be
ignored. As the aspect ratio increased, the wall became slender, and as a result, the contribution of
bending deformation increased and became the major one at an aspect ratio of 12:1, while the
contribution of rotation and shear deformation decreased.
Figure 50. Influence of wall aspect ratio on the deflection components in single-panel balloon-type CLT shear walls

FPInnovations Page 77
6.4 Connections The influence of the vertical joints on the lateral stiffness of the coupled-panel balloon-type CLT walls
was investigated using the analytical model II. The reference stiffness for the vertical joints was taken
as the shear stiffness of the wall along the height, about 80 kN/mm per connection for a total of five
vertical joints. The stiffness of the vertical joints was changed from 800 to 0.08 kN/mm such that five
different stiffness ratios, including 1/1000, 1/100, 1/10, 1, and 10, were derived. The influence of the
stiffness of vertical joins on the lateral stiffness of shear walls is shown in Figure 51.
Figure 51. Influence of stiffness of vertical joints on the stiffness of coupled-panel balloon-type CLT shear walls
The lateral stiffness of the balloon-type CLT shear walls decreased with a decrease in the stiffness of
vertical joints, as shown in Figure 51. It can be seen that the wall stiffness dropped rapidly from 93.7%
to 11.9% when the shear stiffness ratio changed from 1 to 1/100. This stiffness range can be regarded
as a semi-rigid zone. The stiffness of the semi-rigid connections used in the wall configuration W2 was
8kN/mm which was 1/10 the reference stiffness and in the semi-rigid zone. Thus, the analytical model II
can also be used to design the vertical joints during the structural design of coupled-panel balloon-type
CLT shear walls.
FPInnovations Page 78
7. SUMMARY AND CONCLUSIONS
Lack of design information and research on the balloon-type CLT construction prevents CLT from being
widely used as an acceptable solution to resist seismic loads for timber buildings. To quantify the
performance of balloon-type CLT structures subjected to lateral loads and to create research
background for future implementation of balloon-type CLT system in CSA O86 and NBCC,
FPInnovations initiated a project on a series of tests on balloon-type CLT walls conducted in
FPInnovations Quebec lab in 2016. Two analytical models were developed based on engineering
principles and mechanics to predict the deflection and resistance of the balloon-type shear walls in this
study. The developed models were programmed into two programs on the platform of Mathcad. The
following assumptions are implied in the models:
The lateral deflection of balloon-type CLT shear walls is contributed by five components:
deflection due to wall bending, shear, rotation (anchorage deformation), sliding, and slip in
vertical joints.
In the first (simple) analytical model, (i) the effective bending stiffness and the effective shear
stiffness for the shear wall are calculated using the simplified design method; (ii) the panel base
is assumed to be rigid for calculating the wall rotation; (iii) the sliding is resisted by hold-down,
shear connector, shear key and friction; and (iv) the slip between the two coupled panels is
assumed to be resisted by the vertical joints.
In the second (sophisticated) analytical model, (i) the effective bending stiffness for the shear
wall is calculated using K method (composite theory); (ii) the effective shear stiffness for the
shear wall is calculated using REV method; (iii) the panel base is assumed to be elastic for
calculating the wall rotation; (iv) the sliding and slip are calculated using the same methods for
the first analytical model.
The lateral resistance of balloon-type CLT shear walls is governed by the minimum of (i) the
sum of horizontal yield strength of hold-down, shear connector, shear key and friction; (ii) the
vertical yield strength of hold-down at one end; and (iii) the vertical yield strength of vertical
joints, if present, and hold-down at one end. It is recommended that the lateral resistance of the
balloon-type CLT shear wall be governed by the yielding of hold-down and/or vertical joints, if
exist, to derive a ductile seismic resisting system.
The developed analytical models were validated by analyzing the structural performance of balloon-
type CLT shear walls without or with vertical joints under single- or multiple-point load. Compared with
the previous test and current simulation results, it shows that the developed models were capable of
predicting the deflection and resistance of balloon-type CLT shear walls.
The influence of specific key parameters on the structural performance of balloon-type CLT shear walls
were also investigated using the verified analytical models. Because the single point load at the top
produced the highest over-turning moment in the shear wall, the analyses using single point load
yielded the most conservative estimation on the stiffness and resistance for balloon-type CLT shear
walls, compared with multiple point loads with a same amount of lateral load. The lateral stiffness and
resistance of the balloon-type CLT shear walls increased with increase in vertical load applied to the
walls, and decreased with increase in the wall aspect ratio (height to length). The lateral stiffness of the
coupled-panel balloon-type CLT shear wall descended with a decrease in the stiffness of vertical joints
between two panels.

FPInnovations Page 79
The developed analytical models will assist structural designers in developing and designing
appropriate balloon-type CLT shear wall for timber structures. The developed FE models will be refined
further to perform non-linear analysis to investigate the seismic response of balloon-type CLT shear
walls. The analytical models and the seismic response analysis will be used to quantify the
performance of balloon-type CLT structures subjected to lateral loads, thus creating research
background for future implementation of balloon-type CLT systems in CSA O86 and NBCC.
8. BENEFIT TO MEMBERS AND INDUSTRY
This project contributes directly to the introduction of CLT and Mass Timber systems in general in the
mid-rise and high-rise construction in Canada. The work will also be helpful to the NRCan’s GCWood
demonstration projects initiative, the Québec Government allowance for MT construction up to 12
storeys, as well as the recent Ontario Tall Wood Buildings Initiative. The technical information
developed this year, along with the work planned for the next few years, will develop the necessary
technical information for designers to secure approvals from respective authorities having jurisdictions
(AHJs) for use of CLT and MT systems as Alternative Solutions.
9. LIST OF SYMBOLS
A Cross-section area of CLT panel [mm2]
effA Effective cross-section area of CLT panel [mm2]
𝑏𝑚𝑛 Mean width of the lumber in CLT panel [mm]
0E Modulus of elasticity of the lumber in the parallel layer of CLT panel [MPa]
90E Modulus of elasticity of the lumber in the transverse layer of CLT panel [MPa]
effE Effective modules of elasticity [MPa]
effEI Effective bending stiffness [N·mm2]
friF Friction at the bottom of the CLT wall [kN]
hdyhF ,, Horizontal yield load of the hold-down [kN]
scyhF ,, Horizontal yield load of the shear connector [kN]
hdyvF ,, Vertical yield load of the hold-down [kN]
wyF , Yield load of wood contacting with the shear key [kN]
vjyF , Yield load of the vertical joints [kN]
𝑓𝑐,0° Yield stress of CLT panel in the major-axis [MPa]
𝑓𝑐,90° Yield stress of CLT panel in the minor-axis [MPa]

FPInnovations Page 80
0G Shear modulus of the lumber in the parallel layer of CLT panel [MPa]
effG Effective shear modulus [MPa]
effGA Effective shear stiffness [N]
𝐻 Height of the CLT shear wall [mm]
ch Effective height of the compression zone [mm]
ℎ𝑖 Height of the lateral load and vertical load [mm]
I Moment of inertia [mm4]
effI Effective moment of inertia [mm4]
k Indentation factor
3k A composition factor for solid wood panels with cross layers
hdhk , Horizontal stiffness of hold-down [kN/mm]
schk , Horizontal stiffness of shear connector [kN/mm]
hdvk , Vertical stiffness of hold-down [kN/mm]
scvk , Vertical stiffness of shear connector [kN/mm]
vjk Stiffness of the vertical joints [kN/mm]
𝐿 Length of the CLT shear wall [mm]
cL Length of the compression area [mm]
hdL Distance between the center of the hold-down and the edge of the wall [mm]
n Number of load
ln Number of layers in CLT panel
vjn Number of vertical joints
cR Reaction (compression) at the wall base [kN]
tR Reaction (tension) at the wall base [kN]
hdltR , Tension resisted by the left hold-down [kN]
sctR , Tension resisted by the shear connector [kN]
hdrtR , Tension resisted by the right hold-down [kN]
vjR Total shear resisted by the vertical joints [kN]

FPInnovations Page 81
𝑡 Thickness of the CLT shear wall [mm]
𝑡𝑖 Thickness of the ith layer of CLT panel [mm]
𝑡𝑚𝑛 Mean thickness of the lumber in CLT panel [mm]
∆𝑐 Compression deformation occurring at the edge [mm]
∆ℎ𝑖 Deflection of balloon-type CLT shear wall at a height of ℎ𝑖 [mm]
∆𝐻 Deflection of balloon-type CLT shear wall at the top of the wall [mm]
∆ℎ𝑖,𝑏 Deflection due to wall bending [mm]
∆ℎ𝑖,𝑠 Deflection due to wall shear [mm]
∆ℎ𝑖,𝑟𝑜𝑡 Deflection due to rotation [mm]
∆ℎ𝑖,𝑟𝑜𝑡,𝐶𝑖 Deflection due to rotation in Case i for elastic panel base assumption [mm]
∆ℎ𝑖,𝑠𝑙𝑑 Deflection due to sliding [mm]
∆ℎ𝑖,𝑠𝑙𝑝 Deflection due to slip in vertical joints [mm]
hdl Uplift occurs in the left hold-down [mm]
hdr Uplift occurs in the right hold-down [mm]
sc Uplift occurs in the shear connector [mm]
sliding Sliding occurs at the bottom of the shear wall [mm]
vj Slip occurs in the vertical joints [mm]
rot Rotation of the CLT panel
Cirot, Rotation of the CLT panel in Case i for elastic panel base assumption
slp Rotation induced by the slip
Shape reduction factor for shear deformation
Coefficient of friction
𝜌 Density [kg/m3]
axc m, Maximum compression stress in the wall base [MPa]
min,c Minimum compression stress in the wall base [MPa]

FPInnovations Page 82
10. REFERENCES
ANSI/APA. (2018). “PRG 320 Standard for performance-rated cross-laminated timber.” APA – The
Engineered Wood Association, Tacoma, USA.
ASTM. (2016). “D1761 Standard Test Methods for Mechanical Fastener in Wood.” American Society for
Testing and Materials (ASTM), West Conshohocken, United States.
ASTM. (2016). “D2126 Standard Test Methods for Cyclic (Reversed) Load Test for Shear Resistance of
Vertical Elements of the Later Force Resisting Systems for Buildings.” American Society for Testing
and Materials (ASTM), West Conshohocken, United States.
Blass, H.J., and Fellmoser, P. (2004). “Design of solid wood panels with cross layers.” In proceedings
of the 8th World Conference on Timber Engineering, Lahti, Finland.
Chen, Z., Popovski, M., Symons, P. (2018). “Advanced Wood-based Solutions for Mid-rise and High-
rise Construction: Structural Performance of Post-Tensioned CLT Shear Walls with Energy
Dissipators.” FPInnovations Project Report (301012204), Vancouver.
CSA (Canadian Standards Association). (2014). “Engineering design in wood.” CSA O86-14,
Mississauga.
Gagnon, S., and Pirvu, C. (2011). “CLT handbook: cross-laminated timber.” FPInnovations Special
Publication SP-528E, Quebec City.
Gavric, I., Fragiacomo, M., and Ceccotti, A. (2015). “Cyclic behavior of CLT wall systems: Experimental
tests and analytical prediction models.” ASCE J. Struct. Eng., 141(11): 04015034.
Gere, J.M., and Timoshenko, S. (1997). Mechanics of materials. PWS Pub Co., Boston.
Hibbeler, R.C. (2012). Structural analysis (8th edition). Prentice Hall, Boston.
Leijten, A.J.M., Jorissen, A.J.M., de Leijer, B.J.C. (2011). “The local bearing capacity perpendicular to
grain of structural timber eleemtns.” Construction and Building Materials, 27: 54-59.
Moosbrugger, T., Guggenberger, W., Bogensperger, T. (2006). “Cross-laminated timber wall segments
under homogenous shear with and without openings.” In Proc. Of World Conference on Timber
Engineering, Portland.
NRC (2015). National Building Code of Canada. National Research Council of Canada, Ottawa.

Head Office
Pointe-Claire
570, Saint-Jean Blvd
Pointe-Claire, QC
Canada H9R 3J9
T 514 630-4100
Vancouver
2665 East Mall
Vancouver, BC.
Canada V6T 1Z4
T 604 224-3221
Québec
319, rue Franquet
Québec, QC
Canada G1P 4R4
T 418 659-2647
© 2016 FPInnovations. All rights reserved. Copying and redistribution prohibited.
® FPInnovations, its marks and logos are trademarks of FPInnovations