Embed Size (px)
Citation preview

June 2018
Advanced Water Reclamation Feasibility Study


Flagstaff Advanced Water Reclamation: Feasibility Study Table of Contents
ii
P:\Flagstaff City of\151616 - Potable Reuse Feasibiltiy\Deliverables\Reports\Feasibility Study\Advanced Water Reclamation FS_FINAL.docx
4.8 Implementation .............................................................................................................................. 4-4 5. References ................................................................................................................................................ 5-1
List of Figures Figure 1-1. Direct Potable Reuse. .................................................................................................................. 1-3
Figure 2-1. Alternative 1: RO-Based AWTP Process Flow Diagram .............................................................. 2-2
Figure 2-2. RO-Based Treatment at Rio de Flag ........................................................................................... 2-4
Figure 2-3. RO-Based Treatment at Wildcat Hill ........................................................................................... 2-5
Figure 2-4. Alternative 2: O3/BAF-Based AWTP Process Flow Diagram ...................................................... 2-7
Figure 2-5. O3/BAF-Based Treatment at Rio de Flag .................................................................................. 2-10
Figure 2-6. O3/BAF-Based Treatment at Wildcat Hill .................................................................................. 2-11
Figure 3-1. ZLD Process Flow Diagram .......................................................................................................... 3-6
Figure 3-2. ZLD Site Layout ............................................................................................................................ 3-7
Figure 4-1. Schedule for Implementation of Potable Reuse System ........................................................... 4-5
List of Tables Table 1-1. Minimum Log10 Reduction for Potable Reuse. ............................................................................ 1-4
Table 2-1. RO-Based Advanced Treatment Performance ............................................................................. 2-2
Table 2-2. Alternative 1: RO-Based AWTP Design Criteria............................................................................ 2-3
Table 2-3. O3/BAF-Based Advanced Treatment Performance ..................................................................... 2-7
Table 2-4. Alternative 2: O3/BAF Based AWTP Design Criteria .................................................................... 2-8
Table 3-1. RO-Based Advanced Treatment Performance ............................................................................. 3-1
Table 3-2. ZLD Methods for RO Concentrate ................................................................................................ 3-2
Table 3-3. Evaporation Pond Sizing Criteria .................................................................................................. 3-3
Table 3-4. Final Concentrate Disposal Strategies ........................................................................................ 3-4
Table 3-5. Concentrate Management Alternatives Screening ..................................................................... 3-5
Table 3-6. ZLD Design Criteria Summary ...................................................................................................... 3-5
Table 3-7. Project Budget Estimate for AWTP with RO ................................................................................. 3-8
Table 3-8. Project Budget Estimate for ZLD .................................................................................................. 3-8
Table 3-9. Project Budget Estimate for AWTP without RO ............................................................................ 3-8
Table 3-10. O&M Costs for RO-Based AWTP ................................................................................................. 3-9
Table 3-11. O&M Costs for ZLD ..................................................................................................................... 3-9
Table 3-12. O&M Costs for O3/BAF-Based AWTP ......................................................................................... 3-9
Table 3-13. Life-Cycle Costs for AWTP with RO ........................................................................................... 3-10

Flagstaff Advanced Water Reclamation: Feasibility Study Table of Contents
iii
P:\Flagstaff City of\151616 - Potable Reuse Feasibiltiy\Deliverables\Reports\Feasibility Study\Advanced Water Reclamation FS_FINAL.docx
Table 3-14. Life-Cycle Costs for AWTP with RO and ZLD ............................................................................ 3-11
Table 3-15. Life-Cycle Costs for AWTP with O3/BAF .................................................................................... 3-11
List of Appendices
Appendix A – Stakeholder Meeting Summary Report
List of Acronyms
A.A.C. Arizona Administrative Code nm nanometer
AACE American Association of Cost Engineers NMW non-municipal waste
ADEQ Arizona Department of Environmental Quality NOM natural organic matter
ADWR Arizona Department of Water Resources NWRI National Water Resources Institute
AOP advanced oxidation process O&M operation and maintenance
ATW advanced treated water O3 ozone
AWTP Advanced Water Treatment Plant O3/BAF ozone/biologically active filtration
BAF biologically active filtration PDT pressure decay test
BC Brown and Caldwell PFOA perfluorooctanoic acid
BCC brine concentration/crystallization PPCPs pharmaceuticals and personal care products
CECs contaminants of emerging concern PR potable reuse
City City of Flagstaff RCRA Resource Conservation and Recovery Act
CUWA California Urban Water Agency RO reverse osmosis
DBP disinfection byproduct SDWA Safe Drinking Water Act
DDW Department of Drinking Water SIC Standard Industrial Code
DLD dedicated land disposal sVOCs semi-volatile organic compounds
DOC dissolved organic carbon SWTR Surface Water Treatment Rule
DPR direct potable reuse TCEQ Texas Commission of Environmental Quality
DWTF Drinking Water Treatment Facility TDS total dissolved solids
DWTP Drinking Water Treatment Plant TOC total organic carbon
EPA U.S. Environmental Protection Agency TOrCs trace organic compounds
FCC forced-circulation crystallizer TS total solids
FO forward osmosis UF ultrafiltration
GAC granular-activated carbon UV ultraviolet
HDPE high-density polyethylene UV/AOP ultraviolet advanced oxidation process
IPR indirect potable reuse UVT ultraviolet transmittance
IPWTF industrial process water treatment facility VMD vacuum membrane distillation
kWh kiloWatt hour V/C/G Virus/Cryptosporidium/Giardia
LRVs log removal values VOCs volatile organic compounds
MCLs maximum contaminant levels WAIV wind-assisted intensified evaporation
MD membrane distillation WMI Waste Management, Inc.
MF membrane filtration WRF WateReuse Foundation
mg/L milligrams per liter WTP Water Treatment Plant
mgd million gallons per day ZLD zero liquid discharge
mJ/cm2 millijoule per square centimeter µm micrometer
NDMA nitrosodimethylamine

1-1
P:\Flagstaff City of\151616 - Potable Reuse Feasibiltiy\Deliverables\Reports\Feasibility Study\Advanced Water Reclamation FS_FINAL.docx
Section 1
Introduction 1.1 Flagstaff Water Background The City of Flagstaff (City) is located in Northern Arizona, approximately 140 miles north of Phoenix and has a population of roughly 70,000 people (2016). The City’s current water supply is primarily surface water from upper Lake Mary, groundwater wells from the Coconino Aquifer (C-Aquifer), and direct-delivered reclaimed water. The City’s Water Services Division currently serves approximately 20,000 customers with water, wastewater, reclaimed water and stormwater needs, which is about half of the City’s buildout capacity. The City was issued a Designation of Adequate Water Supply under The Arizona Department of Water Resources (ADWR) in 2013 which included a groundwater model indicating that the City’s water supply would support up to a population of 106,000 before additional supply is needed. In response to the designation of water from ADWR, the City is evaluating its future water supply needs and identifying alternative sources to supplement the current water-supply sources for the City.
The City has identified alternative water-supply sources which include pumping water from an additional C-Aquifer wellfield at Red Gap Ranch, located roughly 40 miles east of town at an elevation of 5,000 feet, indirect potable reuse (IPR) via aquifer recharge, IPR via surface-water blending, direct potable reuse (DPR), and implementing additional water-conservation efforts. In August 2017, Carollo Engineers completed a technical memorandum investigating IPR via aquifer recharge, IPR via surface-water blending, DPR by raw-water augmentation ahead of the Lake Mary Water Treatment Plant (WTP), and additional water-conservation efforts, including high-level cost estimates of each alternative.
As a result of the findings, the City requested Brown and Caldwell (BC) to further investigate the feasibility of implementing an advanced water-treatment facility for DPR as a potential future water resource management option. This report will be incorporated into an overall City water/wastewater integrated master plan which will provide guidance in determining the most feasible alternative future water supply to secure additional water resources.
1.2 Scope This study includes a planning-level cost evaluation of implementing advanced water treatment plants necessary to treat tertiary effluent from the Wildcat Hill Water Reclamation Plant (WRP) or the Rio de Flag WRP to augment the City’s potable water supply through delivery directly to the distribution system. This study does not include improvements to the distribution system required to introduce advanced treated water. Two advanced water-treatment trains, one utilizing a reverse osmosis (RO) based process and the other an ozone-BAF (O3/BAF) (non-RO) based process were evaluated. Concentrate management solutions were also evaluated for managing brine discharge from the RO-based treatment alternative. An American Association of Cost Engineers (AACE) Class 4 cost estimate was prepared for each alternative, as well as operation and maintenance (O&M) costs. Life-cycle cost analyses, including $/acre-foot costs, are included to facilitate comparison with other water resource alternatives. In addition to the cost evaluation, the report includes a description of other actions and activities necessary for development of a direct potable reuse system. Additional information may also be found in the Guidance Framework for Direct Potable Reuse in Arizona prepared by the National Water Resources Institute (NWRI) completed in January 2018. Preliminary public outreach activities were also performed to gain an understanding of public acceptance and are summarized in this report.

Flagstaff Advanced Water Reclamation: Feasibility Study Section 1
1-2
P:\Flagstaff City of\151616 - Potable Reuse Feasibiltiy\Deliverables\Reports\Feasibility Study\Advanced Water Reclamation FS_FINAL.docx
1.2.1 Summary of Scenarios Two alternative treatment trains were evaluated for this study which include: • Alternative 1 – RO-based treatment train; and • Alternative 2 – O3/BAF (non-RO) based treatment train.
Each alternative was evaluated for design production rates determined by the City Water Services Division, which include the following phases: • Phase 1 - 6 million gallons per day (mgd); • Phase 2 – 10 mgd; and • Phase 3 – 14 mgd.
Phase 3 is the maximum buildout capacity of the facility. Each alternative treatment train was also evaluated at the two water reclamation plants, including Wildcat Hill and Rio de Flag. Individual treatment process design criteria were developed for each alternative under each phase and modeled on both sites to understand the spatial requirements of each alternative. This study focuses on the feasibility of implementing treated-water augmentation to supplement the City’s potable water supply.
1.3 Potable Reuse Definition and Methodology Potable reuse refers to recycled or reclaimed water that is safe for drinking and it includes two forms: IPR and DPR. IPR introduces reclaimed water into an environmental buffer such as groundwater aquifers or surface water (lakes, canals and reservoirs), and must be further treated in a water treatment facility to meet drinking water standards prior to being introduced into a municipal water supply. Arizona has longstanding experience with using IPR, specifically with aquifer recharge.
This study focuses on implementing DPR, which is defined as the planned introduction of advanced treated water (ATW) either into the raw water supply immediately upstream of a drinking water treatment facility (raw-water augmentation) or directly into a drinking water distribution system (treated-water augmentation). Figure 1-1 depicts a DPR schematic, including raw water and treated water.

Flagstaff Advanced Water Reclamation: Feasibility Study Section 1
1-3
P:\Flagstaff City of\151616 - Potable Reuse Feasibiltiy\Deliverables\Reports\Feasibility Study\Advanced Water Reclamation FS_FINAL.docx
Figure 1-1: Direct Potable Reuse (source: AWWA Potable Reuse 101, 2016)
1.4 DPR Approaches To produce purified reclaimed water, advanced treatment processes are required for microbial and chemical contaminant control. An advanced water treatment plant (AWTP) will incorporate multiple advanced water treatment processes in series to provide multiple barriers to microbial and chemical contaminants, producing a highly purified water. This approach provides additional protection should one process experience an upset. Microbial contaminants include bacteria, protozoa, and viruses; while chemical contaminants include those regulated under the Safe Drinking Water Act (SDWA) and unregulated contaminants of emerging concern (CECs). CECs collectively refer to pharmaceuticals and personal care products (PPCPs) and other trace organic compounds (TOrCs). Those chemicals regulated under the SDWA have maximum contaminant levels (MCLs) set by the United States Environmental Protection Agency (EPA). Most PPCPs and other TOrCs that are detected occur at extremely low levels (parts per trillion), are not currently regulated, and have no definitive evidence of harm to human health.
Microbial contaminant control is measured as log removal values (LRVs), which are determined by verifying required performance of the treatment methods used. LRVs were developed as a way to express a decrease in biological contamination by factors of 10. Log reduction is related to the percentage of microorganisms physically removed or inactivated by a process. For example, 2-log removal translates to 99 percent removal of contaminants; whereas 4-log removal equals 99.99 percent removal. LRVs are most commonly expressed for removal of viruses, Cryptosporidium, and Giardia (V/C/G), which are also used for the Surface Water Treatment Rule (SWTR) for drinking water systems. The goal is to achieve a risk of infection of less than 1 per 10,000 population.
Because specific federal guidance for DPR does not exist, states and institutions have created requirements for these DPR projects. Examples of these developing guidelines are listed below.

Flagstaff Advanced Water Reclamation: Feasibility Study Section 1
1-4
P:\Flagstaff City of\151616 - Potable Reuse Feasibiltiy\Deliverables\Reports\Feasibility Study\Advanced Water Reclamation FS_FINAL.docx
• California has adopted requirements for IPR projects and is in the process of developing requirements for DPR. California’s recommendations are based on raw wastewater as plant influent;
• In 2013, the NWRI published microbial reduction criteria recommendations based on the research of an Independent Expert Panel. The NWRI expert panel recommendations are based on raw wastewater as plant influent; and
• The Texas Commission on Environmental Quality (TCEQ) has already developed guidance for three DPR projects. TCEQ bases its requirements on advanced treatment starting from secondary effluent.
Table 1-1 summarizes the requirements for log10 reduction of viruses by NWRI, California State Water Resources Control Board, Division of Drinking Water (DDW), and TCEQ.
Table 1-1. Minimum Log10 Reduction for Potable Reuse
Group NWRIa California DDW, IPR Projectsa TCEQb
Enteric Virus 12 12 8
Total Coliform Bacteria 9 - -
Giardia - 10 6
Cryptosporidium spp. 10 10 5.5 aBased on beginning with raw sewage bBased on beginning with secondary treated wastewater
Additional factors should be considered prior to design of a DPR system. These factors, including total organic carbon (TOC), regulated disinfection byproducts (DBPs), salinity, RO, and water chemistry, are described below.
The methods through which organic matter concentrations are regulated has a significant impact on the selection of treatment technologies. TOC encompasses a broad range of chemical compounds, both natural and synthetic. The presence of TOC itself is not an accurate indicator of the level of human activity or human health risk, but has been used as a surrogate measure for other trace organic compounds as it is easy to measure. Natural organic matter (NOM) concentrations are usually higher in surface water than in groundwater and can persist through traditional wastewater-treatment and drinking water treatment. As discussed above, the California DDW requires a TOC level for IPR of not more than 0.5 milligrams per liter (mg/L), far below most natural surface waters. This approach effectively requires any AWTP to incorporate RO for the entire flow stream. O3/BAF-based treatment trains typically include (in series) ozonation (O3), biologically active filtration (BAF), ultrafiltration (UF), ultraviolet advanced oxidation process (UV/AOP), and may also include granular-activated carbon (GAC). These systems are typically capable of reducing TOC to 3 to 5 mg/L, and in some cases as low as 2 mg/L. Although TOC removal of an O3/BAF-based treatment train may be lower than provided by an RO-based train, this type of treatment train has been demonstrated to be protective of public health as well as highly effective at reducing the potential of DBP formation downstream in several water treatment facilities. Currently, this type of treatment has proven effectiveness at the Goreangab Plant in Windhoek, Namibia; Gwinnett County, Georgia; Gerringong, New South Wales Australia; in a pilot test in Reno Nevada; at the San Diego Pure Water Facility; and the DC Tilman Treatment Facility in Orange County, California.
DBPs may form through the downstream drinking water treatment facility (DWTF) process in the presence of some organic compounds. DBPs are currently regulated through the SDWA. Though unregulated, some PPCPs and TOrCs do have health advisory levels associated with them, and any DPR strategy should include reasonable steps to remove these compounds. PPCPs and TOrCs are indicators of human activity yet do not pose an acute risk to human health. Monitoring their presence through the

Flagstaff Advanced Water Reclamation: Feasibility Study Section 1
1-5
P:\Flagstaff City of\151616 - Potable Reuse Feasibiltiy\Deliverables\Reports\Feasibility Study\Advanced Water Reclamation FS_FINAL.docx
AWTP can help demonstrate effectiveness of the treatment process. Both the RO-based and O3/BAF-based treatment trains reduce concentrations of PPCPs and TOrCs.
Introduction of the ATW to either the raw water or the treated drinking water requires consideration of the blended water-quality impact. If purified water is introduced into the raw water immediately ahead of the DWTF, the change in water chemistry can impact treatment performance, particularly for coagulants. If the purified water is introduced to the treated drinking water, additional strategies will be necessary to maintain a stable and non-corrosive water in the distribution system.
1.5 Arizona Proposed Regulations Arizona Department of Environmental Quality (ADEQ) updated Arizona’s reclaimed water rules as stated in Arizona Administrative Code (A.A.C), which became effective January 1, 2018. The code maintains the current reclaimed water classes (A+, A, B+, B, and C) and removes the prohibition of providing reclaimed water for human consumption. However, under the new rules, reclaimed water that has undergone advanced treatment is classified as purified water and therefore suitable for potable use. Interim permitting criteria for an advanced reclaimed water treatment facility is provided in the updated A.A.C. and are effective until the final criteria are perfected.
The proposed rules for an advanced reclaimed water treatment facility require a Recycled Water Individual Permit, as well as a design report demonstrating that the advanced treatment provides multiple barriers of protection reliability; proof of pilot studies and results; a monitoring plan for public health; complete identification, description and analysis of the treatment stream; performance alerts; and corrective actions for noncompliant water. ADEQ criterion also recognizes credits for those plants producing secondary, denitrified effluents (Class B+) and those producing tertiary, denitrified effluents (Class A+).
Final permitting criteria for an advanced reclaimed water treatment facility are currently being developed and are based on guidance provided in the NWRI Guidance Framework for Direct Potable Reuse in Arizona finalized January 2018. NWRI guidance suggests a combination of California and Texas approaches to provide maximum flexibility for projects in Arizona. Arizona’s approach for LRV credits are assigned based on NWRI guidance, and will likely award credits for LRVs, including log removal credits of the downstream DWTF for raw-water augmentation. NWRI recommends that Arizona DPR regulations should address both raw-water and treated-water augmentation, and should be capable of being modified as required to cover surface-water augmentation involving augmenting reservoirs, lakes, and water-conveyance structures.
Other recommended guidelines include chemical control and monitoring, and source control. A three-tiered monitoring approach for chemical control is recommended by NWRI including: • Tier 1 – SWDA and state requirements (including DBPs and nitrates); • Tier 2 – Unregulated chemicals (including CECs) of interest as they apply to protection of public
health); and • Tier 3 – Unregulated chemicals that are useful for evaluating the effectiveness of organic chemical
removal by the treatment trains.

2-1
P:\Flagstaff City of\151616 - Potable Reuse Feasibiltiy\Deliverables\Reports\Feasibility Study\Advanced Water Reclamation FS_FINAL.docx
Section 2
AWTP Alternatives Development 2.1 Advanced Water-Treatment Process Requirements 2.1.1 Reverse Osmosis-Centered Treatment Train The first advanced treatment strategy, often referred to as ‘Full Advanced Treatment,’ includes membrane filtration, RO, UV/AOP, and final disinfection. Figure 2-1 below depicts a process flow diagram for this treatment train, with the critical monitoring points for each process. The general description of each unit process, its primary treatment objectives, and key process variables for monitoring compliance and performance verification are described in the following list: • Membrane Filtration. “Membrane filtration” refers globally to a low-pressure membrane process and
covers both microfiltration (MF) and UF. Functionally, MF and UF are the same, but UF membranes have smaller effective pore sizes (0.02 to 0.1 micron). UF removes particulate matter, including protozoa (e.g., Cryptosporidium) and bacteria (e.g., Giardia), but virus removal is limited. Log removal performance and membrane integrity are verified continuously and indirectly via filtered water turbidity and directly and once daily, typically using a pressure decay test (PDT). Log removal credit is generally limited by the PDT resolution such that 3-log removal of Cryptosporidium and Giardia can be verified, but no removal credits for viruses. Membrane filtration is not effective for removal of organic compounds or salinity.
• RO. Reverse osmosis, and its related high-pressure membrane process nanofiltration (NF), removes dissolved organic compounds, and minerals from water, including most CECs. As discussed above, RO creates a residual stream (brine or concentrate) that is commonly 10 to 20 percent of the feed stream volume and creates challenges for inland disposal. While RO can remove 99 percent of all dissolved matter, the lack of adequate on-line validation techniques generally limit the value of microbial contaminant removal credits granted to 0 to 2 for V/C/G. Technologies such as the TrasarTM additive may be used to demonstrate greater microbial log removal credits, up to 6-log each for V/C/G. Generally, for RO the key water-quality parameter is conductivity. On-line TOC analyzers may also be used to monitor TOC removal performance.
• UV/AOP. UV/AOP uses very high-intensity ultraviolet light combined with an oxidant such as chlorine or hydrogen peroxide for destruction of many CECs. UV/AOP is also highly effective for disinfection, providing up to 6-log inactivation of viruses, Cryptosporidium and Giardia. The UV doses used for UV/AOP are typically on the order of 800-900 millijoules per square centimeter (mJ/cm2) as compared to 100 mJ/cm2 for disinfection of wastewater, and significantly greater than the dose required in most drinking water applications. The key parameters for verifying UV/AOP system performance are UV intensity, flow rate, UV transmittance (UVT) at 254 nanometers (nm), and chemical dosing rate. RO permeate typically has a UVT between 97 and 99 percent. Studies have found that UV with chlorine is a highly-effective, cost-effective option for AOP due to the low pH of the permeate product. The typical chlorine dose is also relatively low at roughly 2-4 mg/L.
• Product Water Stabilization. Product water stabilization is necessary to prevent corrosion of the distribution system after RO treatment. There are different processes that can be used to accomplish product water stabilization, but a combination of decarbonation and lime addition is commonly used. Decarbonation reduces total alkalinity and helps minimize the quantity of lime or caustic necessary to reach a stable pH. Usually, only a portion of flow is decarbonated and then

Flagstaff Advanced Water Reclamation: Feasibility Study Section 2
2-2
P:\Flagstaff City of\151616 - Potable Reuse Feasibiltiy\Deliverables\Reports\Feasibility Study\Advanced Water Reclamation FS_FINAL.docx
blended. Lime provides hydroxide ions to raise pH and calcium to provide water stability. Critical control points include a variety of corrosivity indices such as the Langelier Saturation Index or Aggressiveness Index.
• Disinfection. Disinfection provides additional protection against microbes and viruses, as well as a residual for distribution. Final disinfection can be accomplished by one of several disinfectants such as chlorine, chloramines, chlorine dioxide or ozone. Dose and contact time may be based on EPA guidance for disinfection of drinking water. Generally, the chosen disinfectant will be free chlorine or chloramine (to provide a residual), which is also the process variable used to monitor performance.
Figure 2-1. Alternative 1: RO-Based AWTP Process Flow Diagram
Table 2-1 summarizes typical treatment goals for each unit process in the RO-based AWTP. LRVs are based on recommendations from NWRI’s framework documentation following the California approach to DPR providing 12-log removal of virus, 10-log removal of Giardia and 10-log removal of Crypto. The California approach assumes these log removal credits are to be met starting from untreated wastewater. The treatment train demonstrates the principle of the multi-barrier approach with no one unit process providing more than 6-log removal of any microbial contaminant. In like manner, TOC and CEC removals are handled by more than one process.
Table 2-1. RO-Based Advanced Treatment Performance
Unit Processes Microbiological Log Removal Credits
(typical) Organic Matter Removal Salinity
Viruses Giardia Cryptosporidium Bulk TOC CECs Secondary Effluent 1.9 0.8 1.2 Yes Yes No UF 0 3 3 No No No RO 2 2 2 Yes Yes Yes UV/AOP 6 6 6 No Yes No Disinfection 4 0 0 Yes Yes No
Total 13.9 11.8 12.2 Required 12 10 10 Yes Yesa Nob Balance 1.9 1.8 2.2
aNot all CECs require specific removal rates. The requirements can vary based on known or perceived human health risk. Typical removal rates range from >70% to over 99%. bManaging salinity is a long-term sustainability issue that must be considered in the treatment process selection. Not every system will require salinity removal.

Flagstaff Advanced Water Reclamation: Feasibility Study Section 2
2-3
P:\Flagstaff City of\151616 - Potable Reuse Feasibiltiy\Deliverables\Reports\Feasibility Study\Advanced Water Reclamation FS_FINAL.docx
Preliminary sizing for the RO-based AWTP was developed around the design criteria provided in Table 2-2. This sizing criteria was used to develop conceptual site layouts of the facility for each phase at the two alternate site locations. Figures 2-2 and 2-3 below show site layouts of the facility for Rio de Flag and Wildcat Hill. It is assumed that Phase 1 and Phase 2 will be constructed at one time, while Phase 3 will be built-out in the future.
Table 2-2 Alternative 1: RO-Based AWTP Design Criteria
Parameter Unit Phase 1 Phase 2 Phase 3 Membrane Filtration Feed/Unit MGD 2.0 2.0 2.0 Number of Trains (duty + standby) each 3+1 5+1 7+1
Backwash Waste gpd 182,100 303,500 424,900 Reverse Osmosis RO Feed/Unit MGD 1.0 1.0 1.0 Recovery % 85 85 85 Number of Trains each 6+1 9+1 12+1 Cartridge Filters Number Size
each
micron
6 5
6 5
6 5
UV/AOP Number of Units each 1+1 1+1 2+1 Feed per Unit MGD 4.8 8.1 8.1 Design UV Transmittance % 97 97 97 Peak Dose mJ/cm2 900 900 900 Average Dose mJ/cm2 850 850 850 Peak Hypochlorite Dose mg/L 4 4 4 Disinfection Primary Disinfectant -- Chlorine Chlorine Chlorine Number of Contact Basins each 1 1 1
Peak Hypochlorite Dose mg/L 5 5 5 CTa Required for 4-Log Reduction of Viruses min 6.0 6.0 6.0
aCT is the product of disinfectant residual and effective contact time.
The AWFT is assumed to receive reclaimed water from either Rio de Flag or Wildcat Hill. Each plant must be able to demonstrate Class A+ reclaimed water quality to provide source water for potable use.

Flagstaff Advanced Water Reclamation: Feasibility Study Section 2
2-4
P:\Flagstaff City of\151616 - Potable Reuse Feasibiltiy\Deliverables\Reports\Feasibility Study\Advanced Water Reclamation FS_FINAL.docx
Figure 2-2. RO-Based Treatment at Rio de Flag

Flagstaff Advanced Water Reclamation: Feasibility Study Section 2
2-5
P:\Flagstaff City of\151616 - Potable Reuse Feasibiltiy\Deliverables\Reports\Feasibility Study\Advanced Water Reclamation FS_FINAL.docx
Figure 2-3. RO-Based Treatment at Wildcat Hill

Flagstaff Advanced Water Reclamation: Feasibility Study Section 2
2-6
P:\Flagstaff City of\151616 - Potable Reuse Feasibiltiy\Deliverables\Reports\Feasibility Study\Advanced Water Reclamation FS_FINAL.docx
2.1.2 Ozone-BAF Centered Treatment Train The second advanced-treatment strategy is similar to the RO-based treatment train but uses ozone/biologically active filtration (O3/BAF), and GAC in place of RO. This treatment train allows for a significant reduction in organic contaminants, TOrC oxidation, and biodegradation of bulk and trace organics. Figure 2-4 below depicts a flow diagram of this treatment train. The general description of each unit process, its primary treatment objectives, and key process variables for monitoring performance are described in the following list: • Ozone. Ozone (O3) provides multiple treatment benefits, including disinfection and destruction of
many CECs. O3 does not target salinity and TOC is merely transformed, not removed. When used in tandem with BAF, TOC reduction of approximately 20 to 40 percent can be achieved, along with removal of disinfection byproduct precursors and a majority of TOrCs. O3 doses are established to achieve a certain log removal of microbial contaminants and for destruction of CECs. A contact vessel provides the necessary residence time for reaction, and O3 residuals are monitored at multiple points along the contactor vessel. Each residual monitoring point can be used for performance verification.
• BAF. Biologically active filtration can simultaneously reduce organic contaminants, such as dissolved organic carbon (DOC), taste, odor compounds, PPCPs, and DBPs. Biological filtration is considered a sustainable technology because it can reduce contaminants to innocuous end products that do not cause environmental harm. Biological filtration is typically designed with GAC media because GAC has a larger surface area to attract microorganisms to the particle surfaces. Pre-ozonation promotes biological oxidation and the breakdown of complex organic molecules to more readily biodegradable compounds. Biological filtration provides minimal microbial contaminant removal and does not reduce salinity. Performance can be monitored via TOC analyzers on the filtrate.
• Ultrafiltration. Ultrafiltration is a low-pressure membrane process and covers both MF and UF. Functionally, MF and UF are the same, but UF membranes have smaller effective pore sizes (0.02 to 0.1 micrometers (μm)). UF removes particulate matter, including protozoa (Cryptosporidium) and bacteria (Giardia), but virus removal is limited. Log-removal performance and membrane integrity are verified continuously and indirectly via filtered water turbidity as well as directly and once daily typically using a PDT. LRVs are generally limited by the PDT resolution such that 3-log removal of Cryptosporidium and Giardia can be verified, but no removal credits for viruses. MF is not effective for removal of organics or salinity.
• UV-AOP. Treated wastewater that has been further purified with ultrafiltration, O3, and BAF will typically have a UVT of 88 percent. While this does not appear to be substantially different than the UVT for RO permeate (97 to 99 percent), the implications for sizing of the system and power consumption are substantial, as lamp power requirements exhibit a non-linear relationship to the inverse of UVT. The UV doses used for UV/AOP in the O3/BAF-based train are typically on the order of 40-80 mJ/cm2 as compared to 800-900 mJ/cm2 for the RO-based train due to the upstream destruction of TOrCs provided in the ozone process. Unlike the RO-based treatment train, which produces a low-pH product prior to stabilization, this treatment train is most effective using hydrogen peroxide as the oxidant for AOP. Hydrogen peroxide requires a higher chemical dose than the RO-based system, at about 5-10 mg/L.
• GAC. Granular-activated carbon provides a polishing step for removal of TOC and can quench any residual peroxide. This is an optional step and its inclusion is dependent on the need for further TOC removal. Without GAC, O3 and BAF can typically reduce TOC to between 3 and 5 mg/L. With GAC, TOC can be reduced to 2 to 2.5 mg/L. Performance is monitored via filtrate turbidity and TOC.
• Disinfection. Final disinfection can be accomplished by one of several disinfectants such as chlorine, chloramines, chlorine dioxide or ozone. Dose and contact time may be based on EPA guidance for

Flagstaff Advanced Water Reclamation: Feasibility Study Section 2
2-7
P:\Flagstaff City of\151616 - Potable Reuse Feasibiltiy\Deliverables\Reports\Feasibility Study\Advanced Water Reclamation FS_FINAL.docx
disinfection of drinking water. Generally, the chosen disinfectant will be free chlorine or chloramine (to provide a residual), which is also the process variable used to monitor performance.
Figure 2-4. Alternative 2: O3/BAF-Based AWTP Process Flow Diagram
Table 2-3 summarizes typical treatment goals for each unit process in the O3/BAF-based AWTP. LRVs are based on recommendations from NWRI’s framework documentation following California’s approach, starting with raw sewage. The treatment train demonstrates the principle of the multi-barrier approach with no one unit process providing more than 6-log removal of any microbial contaminant. In like manner, TOC and CEC removals are handled by more than one process.
The O3/BAF process will not remove total dissolved solids (TDS). Recent analyses of the City’s reclaimed water indicate the TDS is 440 to 510 mg/l. The Federal secondary standard for TDS, which is not mandatory, is 500 mg/l and few communities in Arizona serve drinking water with TDS under 500 mg/l. The advantage of the O3/BAF process is that it does not require costly disposal of a concentrated waste stream.
Table 2-3. O3/BAF-Based Advanced Treatment Performance
Unit Processes Microbiological Log Removal Credits (typical) Organic Matter Removal
Salinity Viruses Giardia Cryptosporidium Bulk TOC CECs
Secondary Effluent 1.9 0.8 1.2 Yes Yes No
UF 0 3 3 No No No
O3/BAF 4 3 3 Yes Yes No
GAC 0 0 0 Yes Yes No
UV/AOP 4 4 4 No Yes No
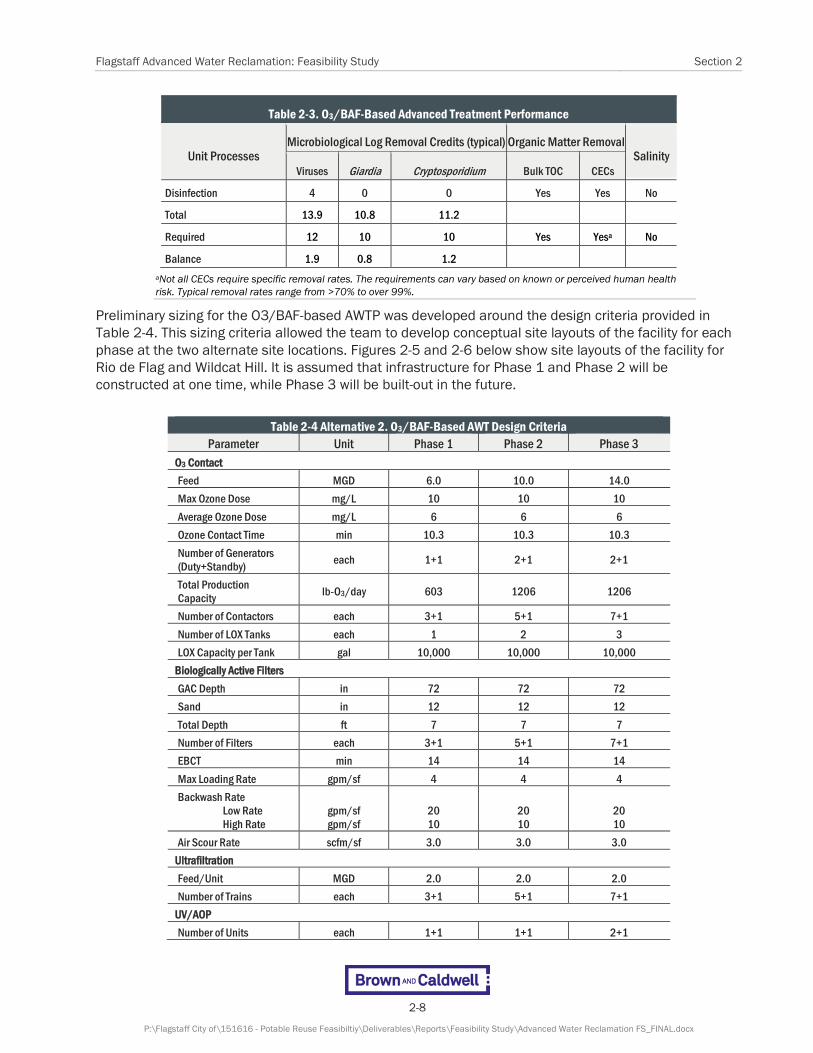
Flagstaff Advanced Water Reclamation: Feasibility Study Section 2
2-8
P:\Flagstaff City of\151616 - Potable Reuse Feasibiltiy\Deliverables\Reports\Feasibility Study\Advanced Water Reclamation FS_FINAL.docx
Table 2-3. O3/BAF-Based Advanced Treatment Performance
Unit Processes Microbiological Log Removal Credits (typical) Organic Matter Removal
Salinity Viruses Giardia Cryptosporidium Bulk TOC CECs
Disinfection 4 0 0 Yes Yes No
Total 13.9 10.8 11.2
Required 12 10 10 Yes Yesa No
Balance 1.9 0.8 1.2 aNot all CECs require specific removal rates. The requirements can vary based on known or perceived human health risk. Typical removal rates range from >70% to over 99%.
Preliminary sizing for the O3/BAF-based AWTP was developed around the design criteria provided in Table 2-4. This sizing criteria allowed the team to develop conceptual site layouts of the facility for each phase at the two alternate site locations. Figures 2-5 and 2-6 below show site layouts of the facility for Rio de Flag and Wildcat Hill. It is assumed that infrastructure for Phase 1 and Phase 2 will be constructed at one time, while Phase 3 will be built-out in the future.
Table 2-4 Alternative 2. O3/BAF-Based AWT Design Criteria
Parameter Unit Phase 1 Phase 2 Phase 3 O3 Contact Feed MGD 6.0 10.0 14.0 Max Ozone Dose mg/L 10 10 10 Average Ozone Dose mg/L 6 6 6 Ozone Contact Time min 10.3 10.3 10.3 Number of Generators (Duty+Standby) each 1+1 2+1 2+1
Total Production Capacity lb-O3/day 603 1206 1206
Number of Contactors each 3+1 5+1 7+1 Number of LOX Tanks each 1 2 3 LOX Capacity per Tank gal 10,000 10,000 10,000
Biologically Active Filters GAC Depth in 72 72 72 Sand in 12 12 12 Total Depth ft 7 7 7 Number of Filters each 3+1 5+1 7+1 EBCT min 14 14 14 Max Loading Rate gpm/sf 4 4 4 Backwash Rate Low Rate High Rate
gpm/sf gpm/sf
20 10
20 10
20 10
Air Scour Rate scfm/sf 3.0 3.0 3.0 Ultrafiltration Feed/Unit MGD 2.0 2.0 2.0 Number of Trains each 3+1 5+1 7+1
UV/AOP Number of Units each 1+1 1+1 2+1

Flagstaff Advanced Water Reclamation: Feasibility Study Section 2
2-9
P:\Flagstaff City of\151616 - Potable Reuse Feasibiltiy\Deliverables\Reports\Feasibility Study\Advanced Water Reclamation FS_FINAL.docx
Table 2-4 Alternative 2. O3/BAF-Based AWT Design Criteria Parameter Unit Phase 1 Phase 2 Phase 3
Feed per Unit MGD 6.0 10.0 7.0 Design UV Transmittance % 90 90 90 Peak Dose mJ/cm2 80 80 80 Average Dose mJ/cm2 40 40 40
Granular Activated Carbon Total Depth ft 6.5 6.5 6.5 Number of Filters each 3+1 5+1 7+1 EBCT min 11 11 11 Max Loading Rate gpm/sf 4.3 4.3 4.3 Backwash Rate gpm/sf 8 8 8
Disinfection Primary Disinfectant -- Chlorine Chlorine Chlorine Number of Contact Basins each 1 1 1
Peak Dose mg/L 5 5 5 Contact Time min 15 15 15

Flagstaff Advanced Water Reclamation: Feasibility Study Section 2
2-10
P:\Flagstaff City of\151616 - Potable Reuse Feasibiltiy\Deliverables\Reports\Feasibility Study\Advanced Water Reclamation FS_FINAL.docx
Figure 2-5. O3/BAF-Based Treatment at Rio de Flag

Flagstaff Advanced Water Reclamation: Feasibility Study Section 2
2-11
P:\Flagstaff City of\151616 - Potable Reuse Feasibiltiy\Deliverables\Reports\Feasibility Study\Advanced Water Reclamation FS_FINAL.docx
Figure 2-6. O3/BAF-Based Treatment at Wildcat Hill

3-1
P:\Flagstaff City of\151616 - Potable Reuse Feasibiltiy\Deliverables\Reports\Feasibility Study\Advanced Water Reclamation FS_FINAL.docx
Section 3
Concentrate Management 3.1 Challenges of Concentrate Management While RO is capable of removing a broad array of chemical compounds, the process generates a significant and difficult-to-manage waste stream. RO typically removes 98 to 99 percent of all dissolved solids in the process stream, concentrating it into the brine stream. The concentration of various minerals must be limited to prevent scale formation and fouling of the membranes. This is done by wasting or rejecting a portion of the water processed. The RO recovery, or the ratio of water produced to the water feeding the process, is typically between 80 and 85 percent for water-recycling projects; 85 percent recovery is common and is used for this feasibility study.
Recent samples of Flagstaff’s wastewater indicate the TDS averages 440 to 510 mg/l, which is moderate and lower than most water supplies in Arizona. This is consistent with many communities where the TDS of reclaimed water is 200-300 mg/l greater than the drinking water supply. At a level of 500 mg/l, the brine from the primary RO would be expected to have a concentration of 3,400 mg/l. The specific mineral makeup is very dependent upon the water sources.
Any process that incorporates RO or NF will produce a significant and continuous quantity of brine. Unlike coastal regions where brine may be discharged to the ocean, brine disposal for inland sites such as Flagstaff is difficult and costly. The brine also represents a loss of water available for beneficial use. The quantity of water lost and the cost of brine disposal must be factored into the process selection decision. With volume-reduction strategies, valuable water can be recovered and the costs for final disposal of brine or salts can be minimized. Table 3-1 summarizes the quantities of liquid brine and dried salts estimated for each phase of the RO-based treatment process.
Table 3-1 RO-Based Advanced Treatment Performance
Unit Phase 1 Phase 2 Phase 3
Treated Flow, mgd 6 10 14
Brine Volume, mgd acre-ft/year (af/y)
0.9 101
1.5 168
2.1 235
Mass of Salts, tons/yr 4,500 7,500 10,400
3.2 Volume Reduction Strategies Reducing the volume of concentrate prior to zero liquid discharge (ZLD) processes can improve the economics of brine disposal overall. There are a number of applicable proprietary processes of varying complexity. Among these technologies are: • Specialty Membrane Processes:
o High-Recovery RO o Closed-Circuit Reverse Osmosis (CCROTM) o Forward Osmosis (FO) o Membrane Distillation (MD)

Flagstaff Advanced Water Reclamation: Feasibility Study Section 3
3-2
P:\Flagstaff City of\151616 - Potable Reuse Feasibiltiy\Deliverables\Reports\Feasibility Study\Advanced Water Reclamation FS_FINAL.docx
o Vacuum Membrane Distillation (VMD) • Electrically-Driven Processes:
o Capacitive Deionization o Electrodialysis Metathesis o Electrodeionization o Electrodialysis
Electrodialysis Reversal AquaSelTM
• Hybrid Precipitative Softening and Membrane Processes: o High-Efficiency Reverse Osmosis (HEROTM) o Advanced Reject Recovery of Water (ARROWTM) o Slurry Precipitation and Reverse Osmosis (SPARROTM) o SAL-PROCTM
Two of these processes, CCROTM and HEROTM, have shown to be applicable to a broad variety of applications and were considered further for this feasibility evaluation. Based on experience with other facilities and knowledge of the composition of the reclaimed water in Flagstaff, the CCRO™ process could recover approximately 80 percent of the brine, while HERO™ could recover up to 90 percent.
3.3 ZLD Strategies Table 3-2 lists methods to achieve ZLD for RO concentrate. Evaporation ponds are the most common, as construction is relatively simple and operating costs are very low, but they require substantial land area. Thermal-mechanical brine concentrators and crystallizers require less land, but capital costs are very high due to the specialty alloys used in fabrication (to resist corrosion). Operating costs are quite high as well, primarily due to the energy required. Mineral recovery systems are less common, and generally only effective where there is enough valuable minerals and a suitable market for the recovered minerals. An example of a mineral recovery facility is the EWM facility in El Paso, Texas which recovers minerals from the brine generated at the Kay Bailey Hutchins Brackish Groundwater Desalting Facility. This method was not considered for this study as there does not appear to be sufficient minerals of value in the water or an enterprise willing to finance such a facility or market the recovered minerals.
Table 3-2. ZLD Methods for RO Concentrate
Zero Liquid Discharge Strategies Challenges
Mineral Recovery
• Complex processes • Must identify viable market for products • Value of marketable product recovered dependent on the
mineral content of the water
Evaporation Ponds Large land area required; moderate capital cost
Thermal-Mechanical Brine Concentration/Crystallization (BCC) Very high capital and operating costs
3.3.1 Evaporation Ponds With Arizona’s dry climate and abundant sunshine, evaporation ponds would appear to be an attractive option. However, even in the warm lower deserts where net evaporation rates exceed 70 inches per year, evaporation ponds are often not the least-cost alternatives. Evaporation ponds generally require robust liner systems to prevent leakage and contamination of the aquifer. This adds substantial cost to the

Flagstaff Advanced Water Reclamation: Feasibility Study Section 3
3-3
P:\Flagstaff City of\151616 - Potable Reuse Feasibiltiy\Deliverables\Reports\Feasibility Study\Advanced Water Reclamation FS_FINAL.docx
pond construction. In Arizona, liners, leak detection and monitoring wells will likely be required to acquire an Aquifer Protection Permit. Previous studies near Lake Mary and the Arboretum indicate the gross pan evaporation rate is approximately 54 inches per year. The effective precipitation rate, including snowmelt, averages approximately 23 inches per year. The net evaporation rate is approximately 2.6 feet per year. High salinity retards the evaporative rate and thus the size of the evaporation pond increases with increasing salinity. Staging ponds into low and high salinity helps optimize the size required to some degree.
Typically, ponds are constructed with sufficient storage for accumulated salts and for storage during cooler, wetter months when net evaporation is zero. Salts can be accumulated in a secondary pond for several years before removal. Table 3-3 summarizes evaporation pond sizes with and without brine volume reduction.
Table 3-3. Evaporation Pond Sizing Alternatives
Phase 1 Phase 2 Phase 3
Without Brine Volume Reduction, acres 70 117 164
With Brine Volume Reduction, acres 15 25 35
The cost and availability of land to provide evaporation ponds for the brine without further volume reduction make this alternative impractical. Even with brine volume reduction, only the Wildcat Hill WRP site has sufficient area for evaporation ponds. However, this would mean decommissioning the Dedicated Land Disposal (DLD) area currently used for disposal of biosolids. The DLD facility has been in service for approximately 40 years and is a cost-effective means of biosolids management for the City.
There are additional technologies that can be used with evaporation ponds to enhance evaporative rates. Mechanical mist operators operate much like snow-making equipment, spraying brine into the atmosphere in small droplets to increase the rate of evaporation rather than increasing the rate of freezing. While the potential surface area saving is great, there may be detrimental impacts from drift of brine droplets beyond the pond site. A more passive approach is the Wind-Assisted Intensified Evaporation (WAIV). This approach uses a wetted material like netting or geotextile suspended over the pond surface. Brine wicks into the fabric and wind enhances the evaporative effect.
3.3.2 Thermal-Mechanical Brine Concentration/Crystallization (BCC) Thermal-mechanical processes may be used to vaporize water from the brine to form a pure distillate and solid salt crystals that can be disposed in a landfill. This process consists of two parts: a thermal-mechanical brine concentrator and a crystallizer. The processes are proven in industrial applications, including power-generation sites. The brine concentrator removes water until the total solids (TS) of the brine is approximately 200,000 to 300,000 parts per million and recovers between 90 and 99 percent of the water as low TDS distillate. The concentrated brine is fed to the forced-circulation crystallizer (FCC) for final brine treatment to a slurry, which can be dewatered by mechanical means. Overall recovery of these systems is greater than 99 percent. The brines are very corrosive and, consequently, both processes are fabricated from special alloys for corrosion resistance. The processes also require substantial energy; the evaporator requires approximately 80 kilowatt-hours (kWhs) per 1,000 gallons of brine feed and the crystallizer requires approximately 250-kWhs per 1,000 gallons of brine feed.
Due to the cost of equipment, it is not typical to provide redundant systems. Rather, smaller ponds are provided for storage of salts and for periods of equipment maintenance. In speaking with representatives of Suez, the equipment itself may occupy an area of 7,500 square feet, but with emergency ponds and other support facilities, this may require several acres.

Flagstaff Advanced Water Reclamation: Feasibility Study Section 3
3-4
P:\Flagstaff City of\151616 - Potable Reuse Feasibiltiy\Deliverables\Reports\Feasibility Study\Advanced Water Reclamation FS_FINAL.docx
The closest example to Flagstaff is in Chandler, Arizona. This facility processes brine from the industrial process water treatment facility (IPWTF) near the Intel manufacturing plant. The Chandler site includes a HERO™ system to reduce the volume of brine from the primary RO prior to processing in the evaporator-crystallizer process. The system was constructed adjacent to existing brine disposal ponds which are used when the evaporator-crystallizer system is off line for maintenance. Total area of this site is approximately 7 acres. Due to the cost of operating the evaporator-crystallizer process, it is only used during the winter months. During the summer, all brine is pumped to a separate site for disposal in evaporation ponds.
3.4 Final Disposal Table 3-4 summarizes final concentrate disposal strategies and limiting features.
Table 3-4. Final Concentrate Disposal Strategies
Final Disposal Strategy Features
Ocean Outfall Economically infeasible for inland applications
Discharge to Surface Water (including wetlands) Inability to meet surface water-quality standards; environmental degradation.
Return to Sewer for Handling at Larger Wastewater Treatment Facility Downstream No downstream wastewater treatment plant available.
Deep Well Injection Not permissible in Arizona; high capital cost.
Land Application
Limited by salt tolerance of vegetation. Large land area required. The available lands would be Forest Service lands, which would not have salt-tolerant vegetation. Also, the climate would restrict any growing season to only a portion of the year.
Reuse Challenges matching demands with quality and quantity of concentrate. May still leave a residual liquid stream.
Landfill
Waste can be accepted only at non-municipal waste landfills, of which there are two within 80 miles of Flagstaff. Classified as a non-municipal waste with higher tipping fees. Potentially toxic concentrations of metals and organics could result in classification as hazardous waste.
Of these final disposal alternatives, only landfilling of the dried salts appears feasible. Depending on the source-water characteristics, the dried salts could contain high levels of certain metals or other compounds, requiring disposal at a hazardous waste facility. The City of Chandler periodically cleans the brine disposal ponds at the IPWTF and disposes of the residuals at the Butterfield Landfill operated by Waste Management Inc. (WMI). The tipping fees are for a special waste and are higher than for municipal solid waste, but the residuals are not considered hazardous. In addition to passing a paint filter test, which provides a determination of dryness of the material, the material must meet additional testing requirements. Testing for Resource Conservation and Recovery Act (RCRA) metals, total volatile organic compounds (VOCs) and total semi-volatile compounds (sVOCs) is required prior to disposal. Assuming the dried salts are determined to be non-hazardous, they could be disposed of in a non-municipal waste (NMW) landfill. There are two such facilities approximately equi-distant from Wildcat Hill WRP, the Pen-Rob Landfill in Joseph City, Arizona, 75 miles east of Flagstaff, and the Gray Wolf Landfill along State Route 169 between Flagstaff and Prescott (approximately 77 miles).
WMI operates both facilities and provided budgetary numbers for hauling and disposal of dried residuals from the evaporation ponds. WMI would contract hauling to a third party; something that the City could do on its own.

Flagstaff Advanced Water Reclamation: Feasibility Study Section 3
3-5
P:\Flagstaff City of\151616 - Potable Reuse Feasibiltiy\Deliverables\Reports\Feasibility Study\Advanced Water Reclamation FS_FINAL.docx
3.5 Preliminary Screening of Alternatives Table 3-5 summarizes preliminary screening of the concentrate management alternatives.
Table 3-5 Concentrate Management Alternatives Screening
Alternative Alternative Approximate Construction Cost for 10-mgd
Site Area Required for Phase 2,
acres
Energy Requirement, kWh/1000 gallons
A CCD + Ponds $32,850,000 25 <10 B HERO™ + Ponds $41,802,000 11 <10 C HERO™ +BCC $97,580,000 7 260 D CCD + BCC $97,629,000 7 260
Options C and D could possibly fit on the parcel north of the Rio de Flag WRP site. This requires purchase of the parcel, which is not included in the price above. Only Wildcat Hill WRP has sufficient land currently available for all options. For the purpose of this study, Option A is carried forward for further cost analysis and site layout. Option A has the lowest construction cost, the lowest energy requirement, but the highest land requirement.
3.6 ZLD Design Criteria The ZLD system chosen for this feasibility evaluation included the CCRO™ for volume minimization followed by two-stage evaporation ponds.
The CCRO™ system will be enclosed in a masonry building and includes the following major systems: transfer-pumping, CCRO™ units, clean-in-place system, permeate-flushing, and chemical storage and dosing. The CCRO™ system will require a moderate to high dose of sulfuric acid and scale inhibitor to control scale formation.
The evaporation pond system uses primary and secondary ponds. Most of evaporation takes place in the primary ponds. Secondary ponds are proportionally larger due to the retarded evaporation rates, resulting from higher salinity. Secondary ponds also provide storage for precipitated salts. An additional pond for both primary and secondary evaporation allows for operational flexibility, variability in evaporative rates due to weather changes, and drying of salts prior to disposal. Evaporation ponds will be built with a balance of cut and fill for economy. Ponds will include a double 60-mil liner of high-density polyethylene (HDPE) with a leak-detection system and two monitoring wells.
Assuming the dried salts do not contain sufficient quantities of toxic materials to be classified as hazardous, the dried salts will be hauled to a non-municipal waste landfill for final disposal.
General sizing criteria for the ZLD system are summarized in Table 3-6.
Table 3-6. ZLD Design Criteria Summary
Item Unit Phase 1 Phase 2 Phase 3
CCRO™ Units (duty + standby) each 3 duty+ 1 standby
5 duty+ 1 standby
7 duty+ 1 standby
CCRO™ Feed Capacity, each gpm 210 CCRO™ Recovery 70% CCRO™ Concentrate to Ponds mgd 0.272 0.454 0.635 Primary Evaporation Ponds each 3 5 7 Primary Evaporation Pond Area, each acres 3.1 Secondary Evaporation Ponds each 3 5 7

Flagstaff Advanced Water Reclamation: Feasibility Study Section 3
3-6
P:\Flagstaff City of\151616 - Potable Reuse Feasibiltiy\Deliverables\Reports\Feasibility Study\Advanced Water Reclamation FS_FINAL.docx
Table 3-6. ZLD Design Criteria Summary Item Unit Phase 1 Phase 2 Phase 3
Primary Evaporation Pond Area, each acres 2.0 Total Pond Area acres 15.3 25.5 35.7
Figure 3-1 depicts the general process flow for the ZLD system. Permeate from the CCRO™ may be returned to the inlet of the advanced water-purification process or the wastewater treatment plant.
Figure 3-1. ZLD Process Flow Diagram
The site layout concept for the ZLD facility located at the Wildcat Hill WRP DLD site is depicted on Figure 3-2 below. At full buildout, the ZLD facility would require complete abandonment and closure of the DLD facility. DLD facility closure costs and permitting have not been included in this feasibility study.

Flagstaff Advanced Water Reclamation: Feasibility Study Section 3
3-7
P:\Flagstaff City of\151616 - Potable Reuse Feasibiltiy\Deliverables\Reports\Feasibility Study\Advanced Water Reclamation FS_FINAL.docx
Figure 3-2. ZLD Site Layout
3.7 Cost Estimate 3.7.1 Capital Cost Estimate
3.7.1.1 Basis of Capital Cost Estimate
Capital costs include the construction cost and escalation factors to establish a project budgetary cost. Construction cost estimates are based on AACE Class 4 construction costs. Project costs include 10 percent design, 10 percent construction management, 10 percent city administration, and 10 percent contingency as defined in the Technical Memorandum – Water Supply Alternatives Costs, August 2017, prepared by Carollo Engineers. Project capital costs are expressed as $/acre-foot of water produced, amortized over 20 years at a 4.5 percent discount rate.
In accordance with the AACE criteria, this is a Class 4 estimate. A Class 4 estimate is defined as a Planning Level or Design Technical Feasibility Estimate. Typically, engineering is from 1 to 15 percent complete. Class 4 estimates are used to prepare planning-level cost scopes or to evaluate alternatives in design conditions and form the base work for the Class 3 Project Budget or Funding Estimate. This Class 4 estimate includes a 30 percent contingency to account for the level of design completion.
Expected accuracy for Class 4 estimates typically range from -30 to +50 percent, depending on the technological complexity of the project, appropriate reference information, and the inclusion of an appropriate contingency determination. In unusual circumstances, ranges could exceed those shown.
Tables 3-7, 3-8 and 3-9 below summarize the total project costs for the AWTP using the RO process, the AWTP using the 03/BAF (non-RO) process, and the ZLD facility. The ZLD facility costs are required for the AWTP process with RO, but not for the AWTP without RO.

Flagstaff Advanced Water Reclamation: Feasibility Study Section 3
3-8
P:\Flagstaff City of\151616 - Potable Reuse Feasibiltiy\Deliverables\Reports\Feasibility Study\Advanced Water Reclamation FS_FINAL.docx
Table 3-7. Project Budget Estimate for AWTP with RO
Item Phase 1 Phase 2 Phase 3 Total
Total Construction Cost $76,600,000 $17,780,000 $32,720,000 $127,100,000
Engineering Design $7,660,000 $1,778,000 $3,272,000 $12,710,000
Construction Administration $7,660,000 $1,778,000 $3,272,000 $12,710,000
City’s Project Management Costs $7,660,000 $1,778,000 $3,272,000 $12,710,000
City’s Contingency $7,660,000 $1,778,000 $3,272,000 $12,710,000
Total Project Cost $107,240,000 $24,892,000 $45,808,000 $177,940,000
Table 3-8. Project Budget Estimate for ZLD
Item Phase 1 Phase 2 Phase 3 Total
Total Construction Cost $22,320,000 $10,540,000 $14,590,000 $47,450,000
Engineering Design $2,232,000 $1,054,000 $1,459,000 $4,745,000
Construction Administration $2,232,000 $1,054,000 $1,459,000 $4,745,000
City’s Project Management Costs $2,232,000 $1,054,000 $1,459,000 $4,745,000
City’s Contingency $2,232,000 $1,054,000 $1,459,000 $4,745,000
Total Project Cost $31,248,000 $14,756,000 $20,426,000 $66,430,000
Table 3-9. Project Budget Estimate for AWTP without RO
Item Phase 1 Phase 2 Phase 3 Total Total Construction Cost $62,450,000 $15,760,000 $25,600,000 $103,810,000
Engineering Design $6,245,000 $1,576,000 $2,560,000 $10,381,000
Construction Administration $6,245,000 $1,576,000 $2,560,000 $10,381,000
City’s Project Management Costs $6,245,000 $1,576,000 $2,560,000 $10,381,000
City’s Contingency $6,245,000 $1,576,000 $2,560,000 $10,381,000
Total Project Cost $87,430,000 $22,064,000 $35,840,000 $145,334,000
3.8 O&M Cost Estimate O&M costs are based on annual totals for full utilization of Phase 1 (6-mgd), Phase 2 (10-mgd), and Phase 3 (14-mgd) flows. This scenario assumes that the AWTP will meet the base demands with other water sources contributing as needed to meet demand. O&M costs include electrical power costs, chemical usage, replacement of consumable parts, equipment maintenance, labor, and miscellaneous services contracted to third parties. The ZLD O&M costs include hauling and disposal costs for final disposal of the salts. Electrical power costs assume a $0.1111/kWh cost of electricity, as defined in the Technical Memorandum – Water Supply Alternatives Costs, August 2017 prepared by Carollo Engineers. Consumable parts include items such as UF membrane elements, cartridge pre-filters, RO elements, GAC media replacement, and UV lamps. Such items are replaced at periodic intervals from once per month for cartridge filters, once every 5 years for RO elements, once every 2 years for GAC media replacement, once every 1-2 years for UV lams, and once every 7 years for UF membranes. Staffing requirements were developed largely from the staffing plan for Pure Water San Diego, with modifications to consider the smaller scale for Flagstaff.

Flagstaff Advanced Water Reclamation: Feasibility Study Section 3
3-9
P:\Flagstaff City of\151616 - Potable Reuse Feasibiltiy\Deliverables\Reports\Feasibility Study\Advanced Water Reclamation FS_FINAL.docx
Tables 3-10, 3-11, and 3-12 summarized the annual O&M costs for the RO-based AWTP, the ZLD facility, and the O3/BAF-based AWTP respectively. Total annual costs are expressed in terms of cost per 1,000 gallons and cost per acre-foot of water produced for distribution. These two measures provide a convenient form for comparison with cost of water production from other sources. For the ZLD O&M costs, this unit cost is expressed not as the volume produced by the ZLD system itself, but as the volume produced from the combined primary treatment and ZLD system.
Table 3-10. O&M Costs for RO-Based AWTP Item Annual Cost
6-mgd 10-mgd 14-mgd
Energy $773,000 $1,183,000 $1,540,000
Chemical $156,000 $255,000 $351,000
Equipment Replacement/Consumables $418,000 $595,000 $845,000
Labor $899,000 $899,000 $899,000
Contract Services $500,000 $500,000 $500,000
Total Operation and Maintenance Costs $2,746,000 $3,432,000 $4,135,000
Cost per 1000 gallons $1.50 $1.10 $1.00
Cost per acre-foot $480 $360 $310
Table 3-11. O&M Costs for ZLD Item Annual Cost
6-mgd 10-mgd 14-mgd
Energy $104,000 $153,000 $202,000
Chemical $106,000 $176,000 $247,000
Equipment Replacement/Consumables $55,000 $88,000 $121,000
Labor $183,000 $183,000 $183,000
Contract Services $326,000 $544,000 $762,000
Total Operation and Maintenance Costs $774,000 $1,144,000 $1,511,000
Cost per 1000 gallons $2.40 $2.10 $2.00
Cost per acre-foot $770 $680 $640
Table 3-12. O&M Costs for O3/BAF-Based AWTP Item Annual Cost
6-mgd 10-mgd 14-mgd
Energy $488,000 $650,000 $892,000
Chemical $116,000 $161,000 $186,000
Equipment Replacement/Consumables $404,000 $631,000 $895,000
Labor $899,000 $899,000 $899,000
Contract Services $500,000 $500,000 $500,000
Total Operation and Maintenance Costs $2,407,000 $2,841,000 $3,372,000
Cost per 1000 gallons $1.10 $0.80 $0.70
Cost per acre-foot $360 $250 $220

Flagstaff Advanced Water Reclamation: Feasibility Study Section 3
3-10
P:\Flagstaff City of\151616 - Potable Reuse Feasibiltiy\Deliverables\Reports\Feasibility Study\Advanced Water Reclamation FS_FINAL.docx
3.9 Summary: Lifecycle Cost and Unit Cost of Water Total lifecycle costs of water expressed as $/acre-foot of water produced for consumption is a useful measure to compare water-resource alternatives. The total lifecycle cost includes the total project capital cost plus O&M costs amortized over the life of the project. For comparison purposes, the project lifecycle term is 20 years and the discount rate 4.5 percent, which corresponds roughly to municipal bond rates over the past 20 years. O&M costs are escalated with an inflation rate of 3 percent per year. As there is no defined schedule for phase expansion, each scenario of 6-, 10-, and 14-mgd is evaluated as a separate project, rather than incremental expansion upon the original 6-mgd phase.
There are some economies of scale with this approach as evidenced in the tables below. It should be noted that the high unit cost of each 6-mgd condition is due in part to the inclusion of infrastructure for 10-mgd. This skews the capital cost considerably. The 10-mgd and 14-mgd unit cost of water values are a better representation of the cost of water for comparison with other water-resource alternatives.
The least-cost alternative is the O3/BAF (non-RO) centered process. The O3/BAF process has the lowest construction cost, lowest operating cost, and highest recovery of water. The O3/BAF process meets all microbial contaminant removal requirements, minimizes the potential to form harmful DBPs, and is highly effective at reducing trace chemicals such as PPCPs. However, the O3/BAF process does not reduce salinity and will produce water with a TOC content of 2 to 4 parts per million. In contrast, the RO-based process will meet all microbial removal requirements, minimizes the potential to form harmful DBPs, is highly effective at reducing trace chemicals, removes more than 98 percent of all salinity, and produces water with a TOC content of less than 0.5 parts per million. Minerals (salts) are added back into RO-treated water to prevent corrosion. Since the DBPs and trace chemicals are controlled in both processes, and the remaining TOC poses no health risk, either process meets Federal drinking water standards. The Federal secondary standard for TDS, which is not mandatory, is 500 mg/l and few communities in Arizona serve drinking water with TDS under 500 mg/l. Since Flagstaff’s water supplies and reclaimed water contain low to moderate levels of salinity, the O3/BAF process is likely a suitable alternative. The ATW would be blended with other lower TDS water sources which would result in a final TDS somewhat higher than the current average of 250 mg/l, but less than the secondary standard of 500mg/l. Further evaluation of salinity build-up in the recycled water system is recommended to determine if additional salinity controls are needed. Ultimately, the City, with input from the community, will need to determine what level of treatment will be provided.
Tables 3-13, 3-14, and 3-15 summarize the lifecycle costs and unit cost of water for the two process train alternatives.
Table 3-13. Life-Cycle Costs for AWTP with RO
Item Unit 6-mgd 10-mgd 14-mgd
Quantity of Water Produced for Distribution
mgd 5.1 8.5 11.9
ac-ft/yr 5,710 9,521 13,330
Capital Cost $107,240,000 $132,132,000 $177,940,000
Present Value of O&M $47,349,000 $59,177,000 $71,299,000
Total Present Value $154,589,000 $191,309,000 $249,239,000
Unit Cost of Water $/af $1,350 $1,000 $950

Flagstaff Advanced Water Reclamation: Feasibility Study Section 3
3-11
P:\Flagstaff City of\151616 - Potable Reuse Feasibiltiy\Deliverables\Reports\Feasibility Study\Advanced Water Reclamation FS_FINAL.docx
Table 3-14. Life-Cycle Costs for AWTP with RO and ZLD
Item Unit 6-mgd 10-mgd 14-mgd
Quantity of Water Produced for Distribution
mgd 5.8 9.7 13.6
ac-ft/yr 6,494 10,865 15,234
Capital Cost $138,488,000 $146,888,000 $198,366,000
Present Value of O&M $60,695,000 $78,903,000 $97,422,000
Total Present Value $199,183,000 $225,791,000 $295,788,000
Unit Cost of Water $/af $1,530 $1,040 $970
Table 3-15. Life-Cycle Costs for AWTP with O3/BAF
Item Unit 6-mgd 10-mgd 14-mgd
Quantity of Water Produced for Distribution
mgd 6.0 10.0 14.0
ac-ft/yr 6,721 11,201 15,682
Capital Cost $87,430,000 $109,494,000 $145,334,000
Present Value of O&M $41,503,000 $48,987,000 $58,143,000
Total Present Value $128,933,000 $158,481,000 $203,477,000
Unit Cost of Water $/af $960 $710 $650

4-1
P:\Flagstaff City of\151616 - Potable Reuse Feasibiltiy\Deliverables\Reports\Feasibility Study\Advanced Water Reclamation FS_FINAL.docx
Section 4
Implementation Considerations 4.1 Public Information/Outreach Public outreach is a major component to the successful implementation of a DPR facility to build awareness, trust, confidence and acceptance. The NWRI guidance document identifies several key activities for an effective program: 1. Develop a strategic, transparent and thorough program. 2. Start outreach early and continue to engage the public throughout the life of the project. 3. Use proven techniques and tools to engage stakeholders. 4. Provide useful and accurate information about DPR. 5. Develop consistent messages. 6. Build relationships with community leaders (NWRI, 2018).
Katz & Associates performed public outreach components for this study, which included conducting research identifying community support and developing a fact sheet for educational information on DPR. The scope of Katz’s work included various community leaders including the mayor, city council members, and business community leaders. The findings from the conducted researched are provided in Appendix A of this report.
The Pure Water Brew Challenge, a project spearheaded by University of Arizona, Pima County Wastewater Management, and others brought an exhibit of an advanced water purification system to the Get Outdoors festival held at the Fort Tuthill Fairgrounds in June 2017. As part of the event, a survey was conducted to gather data about the attendees’ attitudes toward drinking water and using advanced treated (purified) water to supplement drinking water supplies. The data were sorted by zip code so that Flagstaff residents’ responses could be identified. There were 206 respondents with a Flagstaff zip code. The following data was gathered from the survey: • Approximately 50 percent of respondents had heard of advanced treated recycled (purified) water; • Approximately 64 percent thought it was possible to purify recycled water used for irrigation to
drinking water quality; • Approximately 90 percent of respondents were strongly in favor or somewhat in favor of using
advanced treated recycled water (purified water) as an addition to the supply of drinking water; and • Approximately 94 percent of respondents were willing or somewhat willing to drink purified water
made from advanced treated recycled water (Rock, 2018)
The City has also hosted the same Pure Water Brew Challenge exhibit described above, and the same working small-scale advanced water purification system designed with several enhancements for public information and education. Two viewing events were held during the month of April 2018: one during the First Friday event and one on April 14, with tours hosted at the Rio de Flag WRP.
In both the stakeholder interviews and the public surveys, the response to potable reuse is generally positive. Typical concerns are potential health effects from and treatment process effectiveness for pharmaceuticals and other trace organic chemicals.

Flagstaff Advanced Water Reclamation: Feasibility Study Section 4
4-2
P:\Flagstaff City of\151616 - Potable Reuse Feasibiltiy\Deliverables\Reports\Feasibility Study\Advanced Water Reclamation FS_FINAL.docx
Public outreach activities should continue throughout development of a DPR program. These activities should engage as broad a cross section of the community as possible. Pilot and demonstration treatment processes offer an excellent opportunity to inform the public about water resources and the advanced treatment processes. The City of San Diego’s Pure Water Demonstration Facility is an example of a successful demonstration facility designed for public viewing and outreach. (https://www.sandiego.gov/water/purewater/purewatersd)
Public education and outreach can also help the City determine an acceptable treatment goal for total dissolved solids and unregulated chemicals. This will be an important discussion that can have significant impact on the cost of water.
4.2 Supplemental Sampling and Monitoring In preparation for the pilot testing and design of an AWTP, there are a number of water-quality parameters that should be monitored. Some bulk parameters in addition to the requirements for Class A+ effluent are useful for monitoring water-quality trends and making broad conclusions about treatment processes. Additional sampling should be conducted for regulated contaminants, unregulated chemicals of interest to human health, and unregulated chemicals that help evaluate the effectiveness of treatment processes (each defined further below). Sampling should be conducted at regular intervals, monthly or quarterly, well in advance of design.
Continuous monitoring for conductivity, a surrogate for TDS, and TOC can provide insight into what treatment strategies may be needed. • Regulated contaminants. This includes all primary drinking water MCLs. For wastewater, this
specifically includes nitrate and disinfection by products. • Unregulated chemicals of interest to human health. This category of chemicals may appear on
health advisory lists issued by the EPA or another state agency such as California State Water Resources Control Board, DDW. Examples include several estrogenic compounds, testosterone, nitrosodimethylamine (NDMA), and perfluorooctanoic acid (PFOA).
• Unregulated chemicals as indicators of treatment performance. This category of chemicals includes some pharmaceutical and PPCPs that are known to occur in wastewater, but are at levels far below any threshold for human health or environmental concern. Some of these may serve as surrogates for monitoring the effectiveness of removal of other chemicals. Examples include the artificial sweetener sucralose and caffeine.
4.3 Pilot/Demonstration Facility Operating a pilot stage and/or demonstration facility is recommended in the NWRI documentation prior to designing a full-scale DPR facility. Pilot testing can help make design decisions about the process, verify AWT performance and regulatory approval, and evaluate the effectiveness of processes and equipment. Providing design guidance and verifying the effectiveness of processes and equipment require a relatively minimal duration, around 6 months. However, a longer duration may be recommended as part of the public outreach efforts for implementing DPR.
Pilot and demonstration serves as an integral part of the public outreach component of DPR, offering educational opportunities to stakeholders, community leaders, and the general public to learn about the treatment process. The AZ Water Brew Challenge Trailer served this exact purpose, proving the treatment effectiveness by providing clean bottled water, beer made with purified water, as well as providing a platform to discuss the robustness of the treatment processes and removal of contaminants.
Flagstaff Advanced Water Reclamation: Feasibility Study Section 4
4-3
P:\Flagstaff City of\151616 - Potable Reuse Feasibiltiy\Deliverables\Reports\Feasibility Study\Advanced Water Reclamation FS_FINAL.docx
4.4 Source Control Survey NWRI guidance recommends that a pretreatment and source control program should be established as part of the DPR permitting process. The study should address the following: • Evaluate existing pretreatment/source control program and determine additional needs to meet
needs required for DPR; • Investigate discharges into the collection system to determine what residential, commercial, or
industrial contaminants already exist; • Identify the potential for spills and other sources of stored chemicals or hazardous materials (e.g.,
dry cleaners) that may enter the wastewater collection system; • Develop a response plan for spills and other sources of hazardous materials that may enter the
wastewater collection system; • Identify education and outreach programs to protect source water quality (e.g., pharmaceutical
takeback programs, stormwater protection programs); • Compile a list of current commercial and industrial entities that discharge into the wastewater
system using the Standard Industrial Code (SIC) approach; • Establish source control criteria for existing and new industries or businesses (e.g., medical care
facilities, dental clinics, photo processors, and silver jewelry manufacturers); • Sample the treated wastewater to be used as source water for primary drinking water MCLs and
CECs. This survey should be repeated every 5 years to monitor for new chemicals and/or sources; • Provide routine monitoring, commercial/industrial business inventory, chemical inventory, waste
hauler monitoring; and • Identify regulated wastewater, drinking water and non-regulated constituents that could serve as
precursors to DBP formation.
4.5 Salinity Management With potable reuse, a significant portion of the wastewater is purified and recycled to the potable water supply. The salinity of water received at the WRP is generally higher than the potable water served. An additional 150 to 500 mg/l of TDS is not unusual. The result is that the salinity of the combined potable water supply (external sources plus recycled water) could increase without appropriate controls.
A salinity management study, including a system-wide mass balance of sources and sinks for salinity, is necessary to assess whether rising salinity will result in deleterious impacts. Significant sources of salinity from customer usage include discharges from water softeners, RO systems, and cooling towers. The contributions of salinity may increase if the groundwater or surface water sources have high hardness and/or TDS and in regions where cooling tower usage is widespread. A salinity management study should include recommendations for source control, management, and treatment options to achieve acceptable water quality.
4.6 Operator Certification/Training/Development Qualified operators are needed to provide the regulators and the public with confidence that they are competent to run these facilities and maintain protection of public health at all times. There are currently no existing operator certification programs that specifically address potable reuse systems. Existing operator certification programs for wastewater treatment and water treatment are useful but do not cover all of the special skills and knowledge of the technologies and requirements for potable reuse. Drinking Water Treatment Plants (DWTPs) and WRPs with AWT processes are still relatively uncommon; thus, they do not comprise a wide enough portion of operator’s jobs to require adding AWTP knowledge

Flagstaff Advanced Water Reclamation: Feasibility Study Section 4
4-4
P:\Flagstaff City of\151616 - Potable Reuse Feasibiltiy\Deliverables\Reports\Feasibility Study\Advanced Water Reclamation FS_FINAL.docx
to the certification tests. However, multiple regulatory bodies and expert panels are evaluating the need for potable reuse system operator qualifications and there are a few common elements. Having high-level certifications for both wastewater treatment and water treatment, plus a special endorsement for advanced water purification and/or potable reuse, is preferred. Based on the guidance provided by NWRI, ADEQ is expected to require the Operator of Record to hold a Drinking Water Treatment Class IV certification at a minimum. Wastewater treatment certification Class III or IV and a special endorsement for advanced water purification are beneficial and may also be required. Per NWRI guidance, other operators may be required to have a minimum of Drinking Water Treatment Class III certification and advanced water-purification endorsement.
The State of California has recognized the need to develop a program certifying operators to operate these specialized treatment processes, particularly in potable reuse applications. Water utilities and water industry associations have also recognized this shortfall and are taking steps to develop a supplemental AWT certification program to fill this gap.
The California Urban Water Agencies (CUWA) published a white paper in February 2016 providing framework for operator training and certification which includes: • The certification program should be a robust training and testing program centered on AWT
technologies used in the purification of wastewater effluent for potable reuse (PR); and • It should be a stand-alone certification “add on” or “supplement” to an existing certification
available to both wastewater and water treatment operators with an acceptable level of training and experience.
Currently, strategies are being developed to negotiate certification rule changes to bring the water treatment operator and wastewater treatment operator certification programs into alignment.
The certification process also requires significant on-the-job experience and the WateReuse Foundation (WRF) is currently investigating training requirements necessary for operator certification to be completed as an addition to the water or wastewater operator certification program. Development of training modules through the WRF (Project WRF-15-05) and academic groups is also underway.
Significant changes to the operator certification for AWTPs will bring additional requirements to the operator certification program for recycled water plants and will also produce fully certified individuals capable of operating and maintaining specialized equipment required to purify wastewater to drinking water standards. As operator certification for AWTPs are being evaluated, the final outcome may also impact how treatment facility classification will be scored for AWTPs.
Should “add-on” or “supplement” certification be required for AWTPs, current operation staff could be incentivized or encouraged to obtain additional certifications on top of their existing wastewater operator certification.
4.7 Funding and Financing Implementing a DPR program will require development of adequate funding to support both the construction and long-term O&M of the facility. Once sufficient capital and life-cycle costs have been developed, rate studies will be needed to determine the appropriate user fees to support debt service, ongoing operating costs, and future capital outlays.
4.8 Implementation A schedule for implementation of a potable reuse system is provided in Figure 4-1 below. Implementation includes public outreach; funding and financing; pre-design studies and planning; pilot and demonstration testing; engineering design; permitting; construction; start-up; and commissioning.

Flagstaff Advanced Water Reclamation: Feasibility Study Section 4
4-5
P:\Flagstaff City of\151616 - Potable Reuse Feasibiltiy\Deliverables\Reports\Feasibility Study\Advanced Water Reclamation FS_FINAL.docx
The pilot-study phase is shown with a minimum of 6 months for process verification and operator training. During this period, the pilot-testing facility can be made accessible as a public information vehicle. The pilot could be extended to allow more time for public education. The public outreach effort is shown to span for most of the life span of the program with the intent of keeping the public informed of progress and new developments up to the first delivery of advanced purified water. The overall program schedule is approximately 5-1/2 years.
Figure 4-1. Schedule for Implementation of Potable Reuse System

5-1
P:\Flagstaff City of\151616 - Potable Reuse Feasibiltiy\Deliverables\Reports\Feasibility Study\Advanced Water Reclamation FS_FINAL.docx
Section 5
References National Water Research Institute, Guidance Framework for Direct Potable Reuse in Arizona, January 2018.
City of Flagstaff, Technical Memorandum – Water Supply Alternatives Costs. Prepared by Carollo Engineers, August 2017.
Rock, C. PhD; Associate Professor, University of Arizona; Unpublished Data, 2018.
California Urban Water Agencies, White Paper: Potable Reuse Operator Training and Certification Framework, February 2016.

Flagstaff Advanced Water Reclamation: Feasibility Study
P:\Flagstaff City of\151616 - Potable Reuse Feasibiltiy\Deliverables\Reports\Feasibility Study\Advanced Water Reclamation FS_FINAL.docx
Appendix A: Stakeholder Meetings Summary Report

Advanced Water Treatment Cost Feasibility Study City of Flagstaff Water Services Division Stakeholder Meetings: Summary Report May 2018 Prepared by:

Advanced Water Treatment Cost Feasibility Study Stakeholder Meetings: Summary Report
INTRODUCTION ................................................................................................................................ 3
METHODOLOGY ............................................................................................................................... 3
Interviewers ..................................................................................................................... 3
One-on-One Meeting Participants ................................................................................... 3
Anonymity ........................................................................................................................ 3
Discussion Guide .............................................................................................................. 3
Meeting Length ................................................................................................................ 4
Method Limitations .......................................................................................................... 4
Report Format .................................................................................................................. 4
SUMMARY OF RESPONSES................................................................................................................ 4
Opinion of Water Supply in Flagstaff ............................................................................... 4
Awareness of Planning for New Water Supplies .............................................................. 5
Recycled Water Uses in Flagstaff ..................................................................................... 6
Potential Use of Recycled Water as a New Source of Drinking Water .............................. 6
Questions or Concerns About Purification Concept or IPR/DPR as Future Water Supply . 6
Information Needed to Better Understand/Be More Comfortable with IPR/DPR ............. 9
Water or Water Supply Information Services/Communication………………………………………9
Most Trusted Sources of Information ............................................................................. 11
Awareness of Other Potable Reuse/Groundwater Recharge Projects ............................ 12
Confidence in the Water Service Division’s Ability to Develop and Implement Potable Reuse.............................................................................................................................. 12
Suggested Candidates for Further Discussion ................................................................ 13
Other Comments or Questions ....................................................................................... 14
RECOMMENDATIONS ..................................................................................................................... 17
APPENDICES ................................................................................................................................... 17
Appendix A: One-on-one Meeting Participants ................................................................... 17
Appendix B: Discussion Guide ............................................................................................. 18

3
INTRODUCTION In May of 2018, Katz & Associates conducted one-on-one meetings with 12 stakeholders or key community leaders (see “One-on-One Meeting Participants” below). The purpose of these meetings was to gain an understanding about Flagstaff’s existing water supplies and discuss thoughts and/or questions about the City of Flagstaff Water Services Division’s planning study to maximize recycled water use including its potential as a future drinking water supply.
METHODOLOGY One-on-one meetings, also known as in-depth interviews, are a qualitative research method best suited for uncovering the range of views, beliefs, attitudes, opinions and experiences that may exist among a select group of stakeholders. A trained interviewer uses a discussion guide to conduct a structured conversation with participants while allowing for deeper conversation around topics that interest the respondent.
Interviewers The one-on-one meetings were conducted by Katz & Associates (K&A) Executive Vice President, Patricia Tennyson, and Account Executive II, Megan Drummy.
One-on-One Meeting Participants Participants were identified by Flagstaff Water Services Division based in part on their known interest, affiliations, experiences and/or their ability to represent a range of community perspectives or interests such as civic and business interests, nonprofit organizations, and government. (See Appendix A for a list of stakeholders who participated in one-on-one meetings.) Steve Camp, Water Services Division Regulatory Compliance Section Manager, initially contacted stakeholders to describe the process and gauge their interest in participating in a meeting, then provided contact information to K&A so they could schedule and conduct the meetings.
Anonymity Meeting participants were told that their responses, including quotations, would be incorporated into a summary report anonymously. Participants were promised anonymity to encourage candid feedback.
Discussion Guide A list of 12 questions (some with subsections) was prepared as a discussion guide for all meetings. The guide included unprompted questions, meaning the questions were open-ended, and the interviewer did not suggest possible answers. As appropriate, interviewers asked follow up questions not on the guide to fully explore a topic. (See Appendix B for the discussion guide.)

4
Meeting Length The one-on-one meetings ranged in length from 30 minutes to one hour and 15 minutes, with the majority of interviews lasting approximately 45 minutes. Interviewers did not cut off the discussion. Instead, they encouraged using as much time as each participant could provide to allow for the maximum opportunity for discussion.
Method Limitations Like other qualitative methods, in-depth interviews allow for detailed exploration of topics, but do not provide data that is statistically representative of a larger population. This report makes note of trends among the meeting participants when applicable, but those trends cannot be generalized. Instead, the information obtained is descriptive and should be considered as representing a range of opinions that may exist among stakeholder segments. It should also be noted that opinions may not necessarily be factually accurate either in terms of information participants recall as having been provided by city staff or participants’ understanding of reasons for what they observe in terms of the amount of water available in the region.
Report Format This report summarizes responses from meeting participants. Occasionally a response will be in quotes to indicate a specific comment, although the interviews were not recorded and remarks are not verbatim. These remarks are included to give the reader a flavor for the language participants used when discussing the City of Flagstaff’s water resources or the Water Services Division’s study of recycled water use for augmenting drinking water supplies.
SUMMARY OF RESPONSES Individuals participating in the one-on-one meetings had varied degrees of involvement in or knowledge about local water and wastewater issues: experience ranged from unfamiliar, to experienced and involved with the City of Flagstaff, Coconino County or the Flagstaff Water Commission. The variety of stakeholders resulted in a wide variety of responses, but most respondents said they want to stay up-to-date on the Water Services Division’s recycled water planning activities and potential uses for recycled water.
Opinion of Water Supply in Flagstaff Most meeting participants stated they believe water supplies are adequate for current uses and most were aware of the sources of supply for the city. There was concern expressed by some that conservation might be helping today, but would not ensure adequate future water supplies. The connection between water supply and population growth was mentioned as it relates to the longer term: “Flagstaff is growing but the water supply is not.” As one participant observed “We have struck a good balance between efficiency, conservation and growth – but I think more can be done to reduce per capita usage of water.” Another mentioned that the fact supplies are

5
adequate for current uses did not happen by accident – he credited the city with continuing to plan for the future, invest in new infrastructure such as drilling new wells when needed, and expanding non-potable water reuse as the reason Flagstaff has an adequate current water supply. Another mentioned that there is also good water management at the state level in Arizona – “…unsustainable water supply choices that are being made elsewhere are not allowed here.” One said, “There are major problems 15 to 20 years ahead – we are pulling twice as much from the aquifer now and the quality of the water replacing it is not good.” Two participants said they did not think water supplies were adequate for current uses. When it comes to future water supplies, however, there was more divergence of opinion. One said “we do not have enough information to answer this question.” Several stakeholders stated that they had been assured in direct conversations or through presentations from Water Services Division staff that the city has between a 100- and 300-year supply of water. Most tied this to the city’s investment in Red Gap Ranch, but some mentioned the amount of water in the C aquifer, springs and Lake Mary. Nonetheless, most who mentioned future water supplies from Red Gap Ranch conditioned in various ways:
• This is “paper” water – I am not convinced that there will be “wet” water in 50 or 60 years.
• I was told Red Gap Ranch gives the city water capacity to support needs for 300 years, but I do not know if this is accurate. RGR gives us capacity if we can access it – and I would underline the word “if.”
• There will be too much emphasis placed on Red Gap Ranch as the easy way to meet demand for water, which doesn’t mean it should or shouldn’t be done – but it needs a robust cost/benefit analysis to make sure we are spending our money wisely.
• True O&M costs for Red Gap Ranch water have not been developed – and I do not believe the numbers I have heard.
• I know it needs to snow in the winter to keep Lake Mary full. • The future is highly uncertain, so I mostly want us to keep our options open to guarantee
we have choices in the future.
Awareness of Planning for New Water Supplies The large majority of respondents were either “familiar” or “very familiar” with where Flagstaff’s water supply comes from currently, but most could not identify any specific projects the Water Services Division is looking at for new water supplies except for Red Gap Ranch. Nonetheless, several mentioned something similar to: “Climate impacts need to be considered – we used to count on snowmelt as a water source, and we had basically no snow this year. Lakes that used to be full to the highway are now just reeds. The Rio de Flag used to run all year, and now it only has water during monsoon times or during other rain events.” For those few who had heard something about maximizing recycled water use, one said, “I have heard they want to use recycled water for potable purposes. There may be a process for that, but I do not know.” Another read up on water to prepare for the meeting, but only mentioned that “the Lake Mary

6
basin is aging out of supplies and also read about 24 wells.”
Recycled Water Uses in Flagstaff There was high awareness about recycled or reclaimed water uses with almost all participants citing irrigation for city parks and green spaces, playing fields, private golf courses and snowmaking at Snowbowl. As one participant put it when asked what current uses for recycled water he was familiar with: “landscaping and beer.” Another said he had no concerns with any of the non-potable uses as these seemed appropriate for recycled water. One mentioned recharging the aquifer as one current use and others mentioned ponds, lakes, irrigation at NAU and commercial uses. When asked if they personally had any concerns about these uses, the following are among the responses:
• As to turning recycled water into potable water, we do not have enough recycled water to do this. What will happen to the parks, green spaces and golf courses if we do this?
• I would like to learn more about what happened in Flint, Michigan – will we learn later that there is something harmful in the recycled water and have a situation similar to the one they encountered?
• I think we have entered into contracts for some of the least productive uses of recycled water: golf courses. We have to supplement the recycled water we sell them with potable water in the summer – that means we are selling potable water at the recycled rate.
• I have heard the city charges a tax or fee for additional water people use on their vegetable gardens – they can be fined and neighbors can report them for growing vegetables.
• There are nitrates, metals, endocrine disrupters and phosphates in recycled water with no studies on the effect of reclaimed water on bacteria and fungi. And I am particularly worried about the timing of exposure to endocrine disrupting chemicals when it comes to fetal development.
• There needs to be a cost effective way for homeowners to use recycled water for landscape irrigation.
Potential Use of Recycled Water as a New Source of Drinking Water Seven participants said they have heard about this, one said yes but noted some mixed feelings about the concept, and four said they had not heard about it. For those who did hear about it, several are either elected officials or serve on a board where they have heard a presentation about potable reuse. Another mentioned the Brewers’ Challenge, one said information came from the “Flagstaff Water Group,” which is a local citizen advocacy group, and another had heard a Water Services Division staff member present about it.
Questions or Concerns About Purification Concept or IPR/DPR as Future Water Supply Meeting participants were provided the following information about ways the Water Services Division is planning to beneficially use available recycled water:

7
One method to beneficially use recycled water is to purify it through advanced treatment or purification processes and then either use it to replenish underground aquifers, augment surface water supplies, or augment drinking water supplies directly. This advanced process for recycled water to augment the water supplies is known as direct potable reuse (DPR) to the drinking water system or indirect potable reuse (IPR) to recharge the aquifer or surface water supply.
While the majority of participants professed support for the concept of potable reuse, most of them stated they would prefer IPR and they believed most residents, constituents or organization members would feel the same way. One said, “I have no concerns about IPR or DPR as a future drinking water supply, but perceptions of others might be that it is better to go back to the lake first.” The questions centered around the process, impacts on the drinking water supply, pharmaceuticals and cost. Specific questions or concerns included:
• How is it treated? Are chemicals used? Does it have any impact on nature/the environment of the lake? And I have been told the aquifer is like an underground river that keeps moving, so how is it possible to recharge that?
• I prefer IPR and I think our Native American population would as well. • I keep hearing about pharmaceuticals in wastewater and it is my perception that it is not
clear these are taken out through treatment. Has the question of pharmaceuticals been thoroughly vetted? I am not concerned about bacterial issues.
• I think there needs to be a conversation about this, but my primary concern is pharmaceutical content and endocrine disruptors – will they be taken out of the water?
• We can look to other states and countries for their experience, but what is the funding for this project? Cost will be everyone’s concern.
• We need to look closely at the technology and engineering process and the energy it uses, or how energy efficient it can be.
• I have health concerns at the point of use regarding medical waste, chemical compounds and medicine – these compounds reside in solids, so this needs further testing and I have not heard of that being done.
• I think there could be a firestorm when the city tries to administer this – 15 to 18 years ago putting fluoride in the water was on the ballot and it was demonized and voted down. I think there will be biases and prejudices about the concept rather than science. I am okay with it, but it will need to be presented in an easily understandable way.
One individual expressed specific concerns about DPR including: “Will people ever get over the idea of drinking toilet water and do we want our reputation for providing high quality drinking water to be at risk; there are always other options and will this conflict with Western Water Law; we need buffers and warning times in case of failures, equipment breaks, human error, system malfunctions, etc. because there are serious consequences of failure; and the cost feasibility of DPR, especially as an early adopter, is not known. Furthermore, IPR does not have the same risks and why should we take on all this risk when we do not have to do so. Being the last adopter of

8
DPR would be better as we can then learn lessons from others. We can do DPR after we have done everything else first, especially as we are not that desperate.” Meeting participants were also asked what questions or concerns they think members of their organization or the larger community in Flagstaff would have about IPR/DPR as a future water supply. The responses included:
• The Native American community might have other opinions or concerns and should be a big part of this discussion.
• Most people think we have wonderful drinking water from wells, so I think DPR will be a real struggle as opposed to going to Lake Mary and then to the drinking water plant.
• Our Lions Club has had several presentations on water supply and it was explained our supply is healthy, so I think they will want to know “Why on earth are we doing this?”
• The city has already invested in Red Gap Ranch, so why buy and operate this project instead? Be up front about the cost for each of these alternatives.
• I think it is disingenuous to create the impression there is always a water shortage. • Cost will be a question – make sure to compare options on an equal fiscal basis and in net
present value. (Several participants mentioned cost as being among the most common concerns.)
• I think they will be concerned about golf fees going up since courses now rely on recycled water for irrigation and there might be less of it available if this concept moves forward. And we need Snowbowl to keep operating as it is a major tourist attraction.
• We have lots of breweries and need to make sure no one questions the quality of the water they use.
• Health and public safety concerns – also mentioned by several participants – and the “yuck factor.”
• You will need to simplify the language and diagrams you have in the brochure now – this needs to be explained in a straightforward and clear manner, which is hard for scientists and engineers.
• Is anyone else doing this? What are the downsides, or why isn’t everyone doing this? • You need to have simple information and address questions like: how does this smell,
how does it taste, what about impacts on public health, what will it cost, how does the water look, will this water corrode pipes or ruin washing machines, dishwashers, etc.
Having said all of this, several people mentioned “This community manages sophisticated, difficult conversations very well.” But the Water Services Division will have to adopt the practice that we at K&A refer to as “go to them” vs. “come to us.” Traditionally water agencies schedule a meeting at their office or a centrally located city facility and post notifications of the meeting in various places, including newspapers, fliers distributed at other city facilities or invitations sent to a specific community group that might have an interest in the meeting topic. This method is “come to us” – it requires people to add the meeting to what might be their already busy schedule and make a special effort to go to the meeting location. A better practice idea is for the city to “go to them” – that is, identify where community residents already go and take the city’s

9
message to that location. This might mean setting up and staffing an exhibit at a local farmers market, community fair or festival, or other events that community residents already have on their schedule. It can also mean requesting speaking opportunities for civic groups such as Rotary or Kiwanis Clubs – the membership is already at this meeting and will not be required to add one more event to what might already be a packed personal calendar. Or the city can partner with organizations and groups to schedule a forum on water supply – because the event is co-sponsored by environmental or business groups, members of those groups may be more inclined to attend for the multiple networking opportunities afforded while they learn about water supply planning. People are busy, so making it easy for them to attend will pay dividends.
Information Needed to Better Understand/Be More Comfortable with IPR/DPR Responses to this question ranged from “I’m excited about this project – we should already be doing it” to “Why aren’t we pursuing Red Gap Ranch instead since we have already bought it and did all the work on an easement to make it feasible to construct a pipeline” to many points in between these positions. Generally, participants advised the Water Services Division to “Completely surround this with the science of it. The typical person will wonder ‘Why am I drinking what I flushed down the toilet?’ Bring in the experts, be able to answer every single question, and be ready to respond to questions from the Native American community. And there will still be people who say ‘I just don’t like it.’” Specific suggestions of information to provide include:
• Make sure we have been very aggressive on the demand side before we focus on the supply side.
• Clearly and understandably describe how the process works. • Cost will be the first thing most ask about – then “how will it benefit me?” • Advise businesses whether they will have to pay more for the water they use. • Prove this water is safe to drink. • Show how the quality of this water compares to EPA drinking water standards and how
purified water is no different from other water sources. • Show what other cities are doing when it comes to potable reuse and identify benefits to
the community and customer. Use good examples of others who have chosen potable reuse.
• Make presentations – come and teach us about this. • Provide a context for the project: where does water come from now, what could happen
in the future, what would the impacts be, etc. • Build a level of trust in the City and its leaders – go to different areas of the city and do
not expect people to come to you – to dispel myths and provide facts up front. Water or Water Supply Information Sources/Communication The following were identified as existing sources for information participants and their respective communities would turn to for information about water topics:
• I get information from my job (this is true of elected and appointed officials)

10
• Arizona Department of Water Resources • City of Flagstaff – information sent in annual reports and other communication channels,
staff reports, tours of facilities • Newspapers • Facebook • Word of mouth • USGS • Science journals • City Council meetings • Radio • Online publications
Most participants were interested in receiving updates from the Water Services Division about planning for future water supplies. The majority prefer emails either quarterly and at milestones or when major decisions are made. Communicating with members of the organizations represented by meeting participants or the community in general can be difficult because, as some observed, people do not care about water unless they are directly impacted by something like a drought or other crisis. And are we talking to people because we want input or have we already made up our minds about what we are doing? The answer to this question will provide guidance on which communication methods should be used. Getting the attention of the broader community will require a broad and comprehensive set of activities including:
• Engage the community where they are – go to where people gather and talk to them. • Make the investment in a consistent educational effort, not just during Water Awareness
Month. • Simplify the materials produced – they are too technical for the average person. We
need to talk to people about water in words they understand. • Be truthful about the pros and cons – do not give out misinformation just because you
want to do this project. • Address cost, science, need and benefits. • Use a wide variety of communication channels including Facebook, the Daily Sun,
community forums, etc. • Include information in water bills, the city newsletter and emails to stakeholders, post on
various social media platforms, send through direct mail, and more. • Make presentations at meetings of organizations
Other advice includes ensuring that the planning is appropriately paced rather than being overly aggressive about potable reuse outreach since it is only a possibility at this point. In addition, recognize that the community does not care that much about planning studies, but begin to raise awareness about the need through including potable reuse in presentations so that people

11
begin to be more comfortable with it. While several of the participants represent organizations that have regular meetings where it will be appropriate for the Water Services Division to present information about future water sources including potable reuse, about half do not. For the organizations that do publish a newsletter or send out information through other channels such as Facebook, participants were receptive to including an article about potable reuse. And those that do have regular meetings were receptive to receiving a presentation about the potential project.
Most Trusted Sources of Information Participants were asked to identify people or organizations that are trusted sources of information for community members. There were differences – for example one said not the Daily Sun and another specifically mentioned the Daily Sun. While some suggested the mayor or NAU, another said there is a mistrust of NAU, and government in general. Yet one more individual said that city government is well intentioned and progressive, so they would get an “A” on intent and trustworthiness. One stated a reminder that the Native American population would have its own perspectives on this issue and its own view of what or whom is trusted. Another advised that if the city and county agree there is a problem and potable reuse could be the solution, they should enlist community organizations such as Friends of Flagstaff’s Future and others, which would be a very powerful and trusted coalition. And it was also opined that state government is not well trusted in Flagstaff. Other suggestions of trusted sources of information were as follows:
• City employees in the Water Services Division or Water Department • Flagstaff Water Group • Friends of Flagstaff’s Future • Grand Canyon Trust • Nat White • Conservation pages on Facebook • Greater Flagstaff Chamber of Commerce and its President/CEO • USGS (Donald Bills) • Friends of the Rio de Flag • University of Arizona research program and Channah Rock • Mayor Evans • Arizona Republic • Monthly business newspaper • Private public health expert

12
Awareness of Other Potable Reuse/Groundwater Recharge Projects Of the 12 respondents, only three said they were not aware of other potable reuse/groundwater recharge projects. However, most of the others – while saying they were aware of other projects – were not specific or not always accurate about the places they believe have such projects. One of the opinions associated with this question was “I know this is a doable process and have no qualms about this, but WHY HERE?” Once projects were mentioned and explained to participants, they generally said they had no concerns except about cost. It was suggested that information about these existing projects, particularly those in Arizona, be provided to help Flagstaff residents understand more about the process. Providing links to other projects on the City’s website would also be helpful. And one participant notes that the best examples of IPR are in Arizona because since 1980, sustainable planning for groundwater has been the framework in Arizona and injecting recycled water or wastewater into groundwater basins, which are also drinking water supplies, has been the norm. Since there are many people who do not realize this, however, education on this subject is important.
Confidence in the Water Service Division’s Ability to Develop and Implement Potable Reuse Respondents were asked to rate on a scale from one to 10, with one being no confidence and 10 being high confidence, how confident they were in the Water Service Division’s ability to develop and implement a potable reuse project. The table below indicates their responses.
Participants who did clarify their responses for 10’s and 9 said:
• I trust the city – they work hard on this type of thing. • While I said 10, I do not think that would be the rating I would give them on outreach. • There are lots of regulations and they would be required to go through those steps for
implementing a project. • I do not think they are incompetent or would do anything in an incompetent way.
For lower rankings, comments included:
• I didn’t give them a 10 because Flagstaff is a small community and lacks the economies of scale and size to deal with some levels of complexities. It is a question of capacity and size of community, not the qualifications of individuals, which I believe to be high.
Confidence Level # of Respondents
10 6
9 1
8 4
7.5 1
13
• They have sent notices of unsafe levels in our water supply, so I do not totally trust the supply we have now.
• They are on the right track, but keep getting derailed, stop and start, lose initiative and continuity in the development process.
• The city has strong employees, but they will need resources and education to do this – we believe they can do it, but they will need the tools.
Suggested Candidates for Further Discussion Participants were asked to suggest other community leaders or members with whom the Water Services Division should speak regarding its plans to maximize beneficial recycled water use. Some of the recommended stakeholders had already participated in meetings. Some suggestions included:
• NAU has some strong connections with the Native American community (ITEP) • Carlotta Chief, professor at University of Arizona who works on water issues with the
Native American community • Jim McCarthy • Celia Barotz • Jerry Nabours • Jeff Oravitz • John Nauman • Vice Mayor and council members who were on the Water Commission • Ward Davis or Bryan Bates • CEOs of hospitals • President of NAU • President of the community college • Friends of Flagstaff’s Future • Golf courses • Flagstaff Water Group members • Dr. Cathy Propper, NAU and leading researcher on effects of reclaimed water on fetal
development in amphibians • Anne Newland, CEO of North County Health • Mary Jo Gregory, community health non-profit • Rob Thames, former CEO of hospital • Chris Bavasi, former mayor/police chief • School districts • County hospitals • CEOs of hospitals • Jim Babbitt, community leader • Wayne McCormick, Realty Executives

14
Other Comments or Questions As noted, several participants requested additional information and updates on the topic or any project advancements, and some indicated they are already supportive of the concept albeit may still have some questions. Most feel they or their constituencies still need more information to feel completely comfortable with the potential for IPR and, particularly, DPR. Several final comments were made and questions posed as reflected below:
• We are in a desert here and Lake Mary ebbs and flows. But I have never seen any numbers regarding our being in a water deficit. I am in strong opposition to this project. We need to develop the resources we already have: Red Gap Ranch.
• We need to be charging more for water. • Lost and unaccounted for water is way too high here. We should not be looking at other
projects when we cannot account for where at least 10 percent of our water goes. • We need to explain cost considerations and financing – “this is what we are doing, how
we will do it, and how we will pay for it.” Build a fund that can be accessed 10 to 20 years from now, develop a financing strategy that does not impinge on water uses. Hold periodic town hall meetings with presentations, including ones from the Flagstaff Festival of Science.
• A concern for water should come through the rate structure for water usage, both for residential and commercial customers.
• This is the right thing to do, but you need “buy-in” from the community – ask them their opinion.
• Regarding communicating with community members: o Go to community centers, high schools, community colleges and combine this
with an existing event like a PTA meeting – ask for 15 minutes to share about the project and include an opportunity for questions and answers.
o Go to soccer games and have a table or booth there; ask for input/have people take a five-minute survey.
o NAU – Engage in a meaningful way on conservation, water recycling technologies, consumer usable education, etc.
o Other groups to reach out to include Audubon, Friends of Flagstaff, Parks and Open Space, environmental groups, etc.
o Ask for 15 minutes at a meeting of the Elks, Knights of Columbus, Kiwanis, and other civic groups.
o Exhibit at the Museum of Northern Arizona – community education science. • Make change with the least amount of resistance regarding the best way to get
additional water supplies required for the future; include something in the water bill, local press and social media.
• Lead with successes in other places so people won’t be scared of it being tested on them. Tout the potential for this coming to Flagstaff. Lead with sustainability as an important piece in the long term sustainability of water supplies. The level of interest in technology

15
depends on the audience and the level of detail requested. Cost concerns will come down the line.
• Don’t expect the community to come to city hall – go to them at various times of day and on the weekend. Be honest, upfront and positive about it. Provide links for people to look up further information. Information on paper is not necessarily good and may be a waste of resources. The taste of the water is really important – people may associate bad taste with lack of safety.
RECOMMENDATIONS
Based on meetings with stakeholders, the following actions are recommended as next steps in the effort to raise awareness about water supply planning in Flagstaff, why additional water supplies are needed and the potential for increased recycled water use, including for augmentation of drinking water supplies:
1. The majority of participants in the meeting said they understood from Water Services Division presentations or individual conversations with staff that the city has a 100-year supply of water available to it (one participant said he understood it to be 300 years) through the aquifer under Red Gap Ranch. Some clarified that they believed Red Gap Ranch to be more “paper” water than “wet” water and provided the following reasons for this belief: the estimated cost of infrastructure that would be needed to bring this water to Flagstaff and treat it for use is not believable, concerns about potential significant impacts on those who relied on this water for use in the vicinity of Red Gap Ranch, or impacts on the environment in the vicinity of Red Gap Ranch if the water from the aquifer is brought to Flagstaff. The Water Services Division should ensure all presentations and informational materials about Flagstaff’s future water supply planning activities include information about conservation/water use efficiency, recycled water and potable reuse as well as Red Gap Ranch to reduce the opportunity for mixed messages.
2. There is some misunderstanding about the quality of recycled water and what it can be used for, including the economics of its use. Some even question whether it is used as productively as it could be, and others are not sure about what compounds or substances are in recycled water. Consider developing a more robust description of the recycled water program with explanations related to the safety and quality of recycled water, as well as addressing the questions of recycled water rates and value. This could be the topic of a white paper, included in frequently asked questions, a page on the website, or more.
3. Even those who have heard about potable reuse projects elsewhere are not clear on exactly what this means or how safe/high quality the water added to drinking water supplies would be. There was a preference among meeting participants for IPR as most

16
felt less comfortable with DPR and believed others would feel that way as well. The question of how well pharmaceuticals and endocrine disruptors are removed from purified water came up from most participants. Easy-to-understand informational materials are needed to clearly describe potable reuse to the average person. Graphics should be very simple icons with language describing the technological processes involved that is accessible to everyone.
4. Several participants mentioned that the Native American population is a key audience for the Water Services Division to meet with early to describe potable reuse planning and listen to and address their questions and concerns.
5. One theme raised multiple times throughout the meetings is the need for the Water Services Division to adopt a “go to them” philosophy of outreach vs. expecting community residents to come to meetings at a city location. There were a number of specific outreach suggestions, but this was the consensus advice: “go to where people are to talk with them about this concept, do not expect they will come to you.”
6. Several community organizations are willing to help raise awareness about water supply planning and the potable reuse concept. Take advantage of preparing a template article about potable reuse, tailor it to address interests of specific groups, and reach out to external organizations to ask that they publish the article through their own communication channels. Likewise, for organizations that do have meetings where members hear presentations, ask to be on the agenda to present water supply planning steps – but be sure the presentation is brief, non-technical, engaging, and relevant and understandable to the specific audience.
7. Cost benefit analysis and comparison of costs between alternative water supplies was a request across the spectrum of meeting participants as well. Develop an easily understandable summary of costs, including construction, operation, maintenance, quantity and quality of the water, etc.

17
APPENDICES
Appendix A: One-on-one Meeting Participants
Stakeholder Name Affiliation
T. Paul Thomas Northern Arizona Leadership Alliance
Tammara Prager Northern Arizona Association of REALTORS
Blake Nabours AZ Segway and Pedal Tours, Flagstaff Sports Exchange
Mayor Coral Evans City of Flagstaff
Bryan Bates Friends of the Rio de Flag
John Stigmon Economic Collaborative of Northern Arizona
Supervisor Art Babbott Coconino County, District 1
Dawn Tucker Friends of Flagstaff’s Future
Julie Pastrick Greater Flagstaff Chamber of Commerce
Sid Buckman Coconino County Superior Court
Charlie Odegaard City Council, City of Flagstaff
Ben Ruddell Water Commission, City of Flagstaff

18
Appendix B: Discussion Guide
Stakeholder Interview Discussion Guide
Flagstaff Advanced Water Treatment Cost Feasibility Study
Name:
Organization:
Date:
Interviewer:
Introduction:
Thank you for taking the time to speak with me today. I am working on behalf of the City of Flagstaff Water Services Division and they have asked me to speak with key community leaders and stakeholders like you. The Water Services Division has been exploring ways to maximize the beneficial uses of the City’s recycled (also known as reclaimed) water as a way to have a more locally controlled and sustainable supply for the future.
The purpose of this discussion is to gain an understanding of your knowledge about the Water Services Division and Flagstaff’s existing water supplies, tell you about the planning underway to maximize recycled water use, and discuss your thoughts and/or questions regarding uses of recycled water as a possible future drinking water supply. I’d also like to learn more about how best to communicate with you and members of your organization about these topics.
As you may know, Flagstaff has experienced a variety of water supply challenges during its history, including increased demands for water and climate related impacts. Although residents have done a good job conserving water, our 2011 water resource master planning process identified a shortfall that needs to be filled by new water sources.
Currently, Flagstaff’s water comes from three sources: 1) groundwater from the underground aquifers, 2) surface water from Upper Lake Mary, 3) spring water from the Inner Basin, and 4) recycled water, which is currently only used for non-potable applications such as irrigation, snowmaking, dual indoor plumbing at NAU and industrial manufacturing. Current production of recycled water exceeds demand during the winter months. Approximately 4,000 acre-feet of recycled water is discharged to the Rio de Flag each year, which represents approximately 50% of the total drinking water produced in a year. Finding a better end use for this water could result in an increased amount of locally available water.
Today, I’d like to ask you a series of high-level questions. I’ll be taking notes as you respond and all responses I receive will be compiled into a summary. Participants’ specific statements will remain anonymous. I respect your time and busy schedule, and promise not to keep you longer than 45 minutes. Do you have any questions before we begin?

19
Discussion Questions:
1. What is your opinion regarding water supplies in Flagstaff: do you think the water supply is adequate for its uses today? What about in the future?
2. Are you aware of the City’s planning for new water supplies? Are you aware of the Red Gap Ranch Project? Are you aware of any specific projects Water Services is conducting to plan for new water supplies?
3. Are you familiar with the current uses for recycled water? What uses are you most familiar with? Where? Do you personally have any concerns or questions about any of those uses of recycled water?
4. Before we requested time to meet with you, had you heard anything about Flagstaff exploring additional ways to use recycled water as a potential new source of drinking water? If yes, what did you hear and how or in what context did you hear about it?
5. The Water Services Division is investigating additional ways for beneficial reuse of available recycled water. One method to beneficially use recycled water is to purify it through advanced treatment or purification processes and then either use it to replenish underground aquifers, augment surface water supplies, or augment drinking water supplies directly. This advanced process for recycled water to augment the water supplies is known as direct potable reuse (DPR) to the drinking water system or indirect potable reuse (IPR) to recharge the aquifer or surface water supply. Do you have any questions or concerns about this proposal or the process the Water Services Division will use to advance treat or purify the water? Do you have any concerns or questions about using DPR or IPR as a future drinking water supply?
What about members of your organization or community – what questions or concerns do you think they might have?
If anyone asks about the treatment processes used, here they are: The processes that will be used to purify the recycled water before augmenting an underground aquifer or surface water source are: ozone, biologically activated filtration, ultraviolet light disinfection. One of the following treatment trains could be used prior to adding purified water directly to the drinking water system: 1) ultrafiltration, reverse osmosis, advanced oxidation with ultraviolet light disinfection or 2)ultrafiltration, ozone, biologically active filtration, granular activated carbon, and advanced oxidation with ultraviolet light disinfection .
6. What information do you or the members of your organization or community need to better understand the potential project or feel more comfortable with the concept of injecting purified water into our underlying groundwater, putting it into a lake, or taking it directly to a drinking water treatment plant?
7. How do you stay up to date on issues regarding water or water supply in the region or state (word of mouth, email, newspaper, television, radio, social media, etc.)?
a. Would you be interested in receiving updates from the Water Services Division regarding planning for our future water supplies?

20
b. How often would you like to receive information?
c. How do you think we should communicate with the members of your organization or members of the community here in Flagstaff about potential for increasing the use of recycled water?
d. Does your organization or community have regular meetings where we could make a presentation about this topic? How can we get on your schedule? Do you send electronic or written communication to your membership? Can we include a written article about adding purified recycled water to one of our drinking water sources?
8. Who and/or what do you think are the most trusted sources of public information in the community?
9. Are you aware of other potable reuse/groundwater recharge projects? If so, which ones? Are you aware that indirect potable reuse has been taking place in various locations in the U.S., including Flagstaff, Las Vegas and Phoenix, since the mid-sixties? [If the interviewee has not heard of similar projects, name them.]
10. On a scale of one to 10, with one being no confidence and 10 being high confidence, how confident are you in the Water Services Division’s ability to develop and implement a potable reuse project and provide additional drinking water supplies for the public? [Probe for explanation of ranking].
11. Can you think of anyone else that you think we should meet with to discuss potable reuse and how the Water Services Division is looking to maximize recycled water use here?
12. These are all the questions I have. Do you have any other general comments, or is there anything else you want to add that you believe would be helpful to efforts in collecting public input about expanding the uses of recycled water in Flagstaff or the concept of potable reuse?
Thank you for your time today.

Phoenix Office2 North Central Avenue Suite 1600Phoenix, AZ 85004T 602.567.4000