Embed Size (px)
Citation preview

PNNL-19342
Prepared for the U.S. Department of Energy under Contract DE-AC05-76RL01830
Advanced Soldier Thermoelectric Power System for Power Generation from Battlefield Heat Sources TJ Hendricks ED Case T Hogan CJ Cauchy September 2010


DISCLAIMER This report was prepared as an account of work sponsored by an agency of the United States Government. Neither the United States Government nor any agency thereof, nor Battelle Memorial Institute, nor any of their employees, makes any warranty, express or implied, or assumes any legal liability or responsibility for the accuracy, completeness, or usefulness of any information, apparatus, product, or process disclosed, or represents that its use would not infringe privately owned rights. Reference herein to any specific commercial product, process, or service by trade name, trademark, manufacturer, or otherwise does not necessarily constitute or imply its endorsement, recommendation, or favoring by the United States Government or any agency thereof, or Battelle Memorial Institute. The views and opinions of authors expressed herein do not necessarily state or reflect those of the United States Government or any agency thereof. PACIFIC NORTHWEST NATIONAL LABORATORY operated by BATTELLE for the UNITED STATES DEPARTMENT OF ENERGY under Contract DE-AC05-76RL01830 Printed in the United States of America Available to DOE and DOE contractors from the Office of Scientific and Technical Information,
P.O. Box 62, Oak Ridge, TN 37831-0062; ph: (865) 576-8401 fax: (865) 576-5728
email: [email protected] Available to the public from the National Technical Information Service, U.S. Department of Commerce, 5285 Port Royal Rd., Springfield, VA 22161
ph: (800) 553-6847 fax: (703) 605-6900
email: [email protected] online ordering: http://www.ntis.gov/ordering.htm
This document was printed on recycled paper.
(9/2003)

i
Advanced Soldier Thermoelectric Power System for
Power Generation from Battlefield Heat Sources
SERDP Project Number: SI-1652
Dr. Terry Hendricks
Pacific Northwest National Laboratory
Corvallis, OR
(Lead Principal Investigator)
Dr. Tim Hogan
Michigan State University
East Lansing, MI
Dr. Eldon Case
Michigan State University
East Lansing, MI
Charles Cauchy, President
Tellurex Corporation
Traverse City, MI
Revised Final Report 21 September 2010

ii
Table of Contents
Nomenclature iii
Acronyms viii
Keywords viii
Acknowledgements viii
Abstract ix
1. Introduction 10
1.1 Background 10
1.2 Objectives 10
1.3 Advancements in Thermoelectric Material Science and System Design 11
1.4 Reasons Why Expected Performance Was Elusive 12
2. Go/NoGo Criteria from Original SERDP Proposal & IPR White Paper 14
3. LAST / LASTT TE Materials Development 16
4. LAST / LASTT Thermal Fatigue/Mechanical Strength Results & Characterizations 31
4.1 Thermal Fatigue / Mechanical Strength Investigations 31
5. TE Module Structural Analyses 43
6. LAST / LASTT – Based TE Module Design, Development & Testing 49
7. Microchannel Heat Exchanger Design Studies 67
8. Thermoelectric System Analysis 71
9. Remaining Technical Gaps & Recommendations 86
10. Conclusions 88
11. Appendices 91
11.1 Test System Thermal Loss Calculations 91
11.2 List of Scientific/Technical Publications 92
12. Form SF298 94
13. References 95
iii
Nomenclature English
a Crack radius [m or mm or µm]
2A Mean Square of the Crack Surface Area
A TE element area [cm2]
E Young’s Modulus [Pa]
Eo Youngs’s Modulus of Uncracked Material [Pa]
f() Function of the microcrack alignment and the Poisson’s ratio
N Number of Thermal Cycles
Nvalid Number of Valid Strength Tests on Thermoelectric Specimens
Ntotal Total Number of Strength Tests on Thermoelectric Specimens
P Mean Crack Perimeter
Rc Contact Resistance [Ohm]
Rm TE Module Resistance
T Temperature [K]
PF Power Factor = 2 [W/m-K2 or µW/cm-K2]
Z Thermoelectric Figure of Merit [1/K]
Greek
Seebeck coefficient or Thermopower [V/K]
Crack Damage Parameter
Resistance Ratio [Rc/Rm]
Thermal Conductivity [W/m-K or W/cm-K]
Volumetric Crack Number Density (Number of Cracks per Unit Volume)
Poisson’s Ratio
3.14159
ρ Electrical Resistivity [Ohm-m or Ohm-cm]
Electrical Conductivity [1/(Ohm-m) or 1/(Ohm-cm)] (=1/ρ)
Subscripts
c TE module cold side
h TE module hot side
n n-type element
p p-type element

iv
Table of Tables Table 1.1 Phase 1 Project Tasks .................................................................................................................................. 14
Table 2.1 Summary of Go/NoGo Decision Criteria and Status ................................................................................... 16
Table 3.1 Tellurex N-type SERDP Sample ID’s and Compositions ........................................................................... 18
Table 3. 2 Tellurex P-type SERDP Sample ID’s and Compositions ........................................................................... 19
Table 3. 3 Tellurex Bismuth Telluride SERDP Samples ............................................................................................. 19
Table 3. 4 Table of TE module modeling results for segmented unicouples and a hot side temperature of 670K and cold side temperature of 312 K. Cost analysis is based on material costs listed at Alfa Aesar . Cast LAST, Cast LASTT, Tellurex LAST, Tellurex LASTT properties measured at Michigan State University and Northwestern University. ................................................................................................................................................................... 27
Table 3. 5 Table of TE module modeling results for segmented unicouples for 585K hot side temperature and cold side temperature of 312 K. Cost analysis is based on material costs listed at Alfa Aesar [20]. ................................... 29
Table 4. 1 Mean biaxial fracture strength of specimens tested to date in this study (4/07/09). ................................... 33
Table 5. 1 Structural and Thermal Properties Used in the TE Module Structural Analysis ........................................ 44
Table 6. 1 Dual-Layer Segmented TE Module Design Analysis Using p-type LASTT/Bismuth Telluride and n-type LAST/Bismuth Telluride. ............................................................................................................................................ 51
Table 6. 2 Test System Thermal Losses Per Two 47-Couple TE Module Test ........................................................... 60
Table 6. 3 Test Data for Initial 40 Module ............................................................................................................... 61
Table 6. 4 Test Data for TE Module 1 ......................................................................................................................... 62
Table 6. 5 Test Data for Second Run of 40 Ω Module ................................................................................................ 62
Table 6. 6 Module 3 Test Data .................................................................................................................................... 64
Table 6. 7 TE Module Action Plan .............................................................................................................................. 65
Table 7. 1 30-kW Model 'B' Set Exhaust Temperatures .............................................................................................. 70
Table 7. 2 60-kW Model 'B' Set Exhaust Temperatures ............................................................................................. 70
Table 7. 3 Projected Hot-Side Heat Exchanger Heat Fluxes Supplied to TE Module in 60-kW Model 'B' TQG (Exhaust Temperature of 703.4 F (373 °C = 646 K) ................................................................................................... 71
Table 8. 1 SERDP Dual-Section TEG Design – 30 kW Tactical Quiet Generator Conditions ................................... 74
Table 8. 2 SERDP Dual-Section TEG Design – 60 kW Tactical Quiet Generator Conditions ................................... 76
Table 8. 3 Voltage Breakdown Characteristics of Various AlN Coatings on Stainless Steel ...................................... 81
Table 8. 4 Fuel Use, Energy Availability and Efficiency as a Function of Load Conditions in Relevant TQG’s ...... 83

v
Table of Figures
Figure 3.1 Measured electrical conductivity, , thermopower, , power factor, PF = 2, and thermal conductivity, , for hot pressed samples of Ag0.9Pb9Sn9Sb0.6Te20 fabricated by Tellurex Corp. For reference, data for cast material of Ag0.9Pb9Sn9Sb0.6Te20, PbTe with 1.0% Na (atomic %) , and for (AgSbTe2)0.15-(GeTe)0.85 or TAGS-85 are also shown. ........................................................................................................................................... 20
Figure 3.2 Figure of merit, ZT, for these and other high performance p-type materials . ........................................... 20
Figure 3.3 Measured electrical conductivity, , thermopower, , and the power factor, PF = 2, for hot pressed samples of Ag0.86Pb19SbTe20 fabricated by Tellurex Corp. For reference, data of PbTe with 0.03% PbI2 (mol %) , and for cast Ag0.86Pb19SbTe20 are also shown. ............................................................................................................. 21
Figure 3.4 Thermal conductivity, κ, measured by the Kanatzidis group at Northwestern University for hot pressed samples of Ag0.86Pb19SbTe20 fabricated by Tellurex Corp. For reference, data for PbTe with 0.03% PbI2 (mol %) , and for Ag0.8Pb22.5SbTe20 fabricated by Zhou, et al., and annealed for up to 30 days are also shown. Figure of merit, ZT, for these and other high performance materials are shown on the right . ............................................................. 21
Figure 3.5 Measured electrical conductivity, , thermopower, , and the power factor, PF = 2, for hot pressed samples of Ag0.86Pb20.5SbTe20 fabricated by Tellurex Corp. For reference, data of PbTe with 0.03% PbI2 (mol %) , and for cast Ag0.86Pb19SbTe20 are also shown. ............................................................................................................ 22
Figure 3.6 Measured electrical conductivity, , thermopower, , and the power factor, PF = 2, for hot pressed samples of Ag0.86Pb22SbTe20 fabricated by Tellurex Corp. Samples LS-2, LS-3, LS-4, and LS-5 were annealed at 400ºC for 6, 12, 18, and 24 days respectively. For reference, data for PbTe with 0.03% PbI2 (mol %) , for cast Ag0.86Pb19SbTe20 [
10], and for Ag0.8Pb22.5SbTe20 fabricated by Zhou, et al., and annealed for up to 30 days are also shown. .......................................................................................................................................................................... 23
Figure 3.7 Thermal conductivity, , measured by the Kanatzidis group at Northwestern University and figure of merit, ZT = 2T/, for hot pressed samples of Ag0.86Pb22SbTe20 fabricated by Tellurex Corp. Samples LS-2, LS-3, LS-4, and LS-5 were annealed at 400ºC for 6, 12, 18, and 24 days respectively. For reference, data for PbTe with 0.03% PbI2 (mol %) , for cast Ag0.86Pb19SbTe20 [
10], and for Ag0.8Pb22.5SbTe20 fabricated by Zhou, et al. are also shown. .......................................................................................................................................................................... 24
Figure 3.8 Increase in ZT for Ag0.8Pb22.5SbTe20 samples mechanical alloyed, powder processed, and pulsed electric current sintered. Annealing at 400ºC for 30 days, significantly increased the ZT of these samples – primarily through a reduction in the thermal conductivity ......................................................................................................... 24
Figure 3.9 Measured electrical conductivity, , thermopower, , and the power factor, PF = 2, for hot pressed samples of Ag0.86Pb22SbTe20 fabricated by Tellurex Corp. For reference, data for PbTe with 0.03% PbI2 (mol %) , for cast Ag0.86Pb19SbTe20 [
10], and for Ag0.8Pb22.5SbTe20 fabricated by Zhou, et al. are also shown. ......................... 25
Figure 3.10 Thermal conductivity, , measured by the Kanatzidis group at Northwestern University and figure of merit, ZT = 2T/, for hot pressed samples of Ag0.86Pb19+xSbTe20 fabricated by Tellurex Corp. For reference, data for PbTe with 0.03% PbI2 (mol %) , for cast Ag0.86Pb19SbTe20 [
10], and for Ag0.8Pb22.5SbTe20 fabricated by Zhou, et al. are also shown. Figure of merit, ZT, for these and other high performance materials are also shown for comparison. ................................................................................................................................................................. 26
Figure 4.1 Young’s Modulus for LASTT Samples Figure 4.2 Poisson’s Ratio LASTT Samples ............. 34
Figure 4.3 Young’s Modulus for LAST Samples Figure 4.4 Poisson’s Ratio for LAST Samples ...................... 34
Figure 4.5 Young’s Modulus for PbTe Samples Figure 4.6 Poisson’s Ratio for PbTe Samples .................. 35
Figure 4.7 (1) SEM backscattered electron image of inclusions in as-received (not thermally cycled) refined-LAST specimen N38-10 of surface inclusions (Red ovals). As was the case for other refined-LAST specimens, no surface pits are evident on the specimen surface. .................................................................................................................... 36
Figure 4.8 (2) SEM secondary electron images of surface pitting in HL-LAST specimen N38-9 after thermal cycling in the large specimen chamber for 150 cycles. The pits (Red circles) in this micrograph have an average diameter of about 150-200 microns. In additions, small, intact inclusions are visible on the surface that are up to approximately 50 microns across (Blue oval). .................................................................................................................................... 36
Figure 4.9 Resonant Ultrasound Spectroscopy (RUS) measurements of the Young’s modulus and Poisson’s ratio as a function of the number of thermal fatigue cycles for p-type (LASTT) samples, cycled in the small thermal fatigue chamber. ...................................................................................................................................................................... 38

vi
Figure 4.10 Resonant Ultrasound Spectroscopy (RUS) measurements of the (a) Young’s modulus and (b) Poisson’s ratio as a function of the number of thermal fatigue cycles for n-type (refined-LAST) samples thermally cycled in the small thermal fatigue chamber. .............................................................................................................................. 39
Figure 4.11 Ring on Ring (ROR) fracture strength as a function of the number of thermal fatigue cycles for p-type LASTT cycled in the large thermal fatigue chamber. For the numbers in parentheses near the plotting symbols (i,j), the first number “i” indicates the number of valid fractures obtained and the second number “j” indicates the total number of specimens fractured for the given thermal shock treatment. ...................................................................... 40
Figure 4.12 For the ROR fracture data shown in Figure IV.11, the coefficient of variation (standard deviation divided by the mean strength) versus the number of thermal fatigue cycles for the p-type LASTT specimens thermally cycled in the large thermal fatigue chamber. ............................................................................................... 41
Figure 4.13 Ring on Ring (ROR) fracture strength as a function of the number of thermal fatigue cycles for n-type HL LAST cycled in the large thermal fatigue chamber. For the numbers in parentheses near the plotting symbols (i,j), the first number “i” indicates the number of valid fractures obtained and the second number “j” indicates the total number of specimens fractured for the given thermal shock treatment. .............................................................. 41
Figure 4.14 For the ROR fracture data shown in Figure IV.13, the coefficient of variation (standard deviation divided by the mean strength) versus the number of thermal fatigue cycles for the n-type HL LAST specimens thermally cycled in the large thermal fatigue chamber. ............................................................................................... 42
Figure 5.1. ANSYS Structural Model of Tellurex TE Module Design (49 Couples Configuration) ........................... 44
Figure 5.2 Magnified Displacements in Segmented p-type & n-type TE Elements of Tellurex Design (Displacements are mm) .............................................................................................................................................. 45
Figure 5.3 Element Structural Stresses in X-Y Lateral Directions and Z Vertical Direction for 4.4 mm X 1.4 mm X 1.4 mm TE Elements (Stress Units are MPa) .............................................................................................................. 46
Figure 5.4 Element Structural Stresses in X-Y Lateral Directions and Z Vertical Direction for 4.0 mm X 1.4 mm X 1.4 mm TE Elements (Stress Units are MPa) .............................................................................................................. 47
Figure 5.5 Element Structural Stresses in X-Y Lateral Directions and Z Vertical Direction for 7 mm X 1.4 mm X 1.4 mm TE Elements (Stress Units are MPa) ............................................................................................................. 48
Figure 6.1 TE Module Designs from Tellurex ............................................................................................................. 49
Figure 6.2. First TE Modules Using the New LAST / LASTT / Bismuth Telluride Segmented Elements ................ 52
Figure 6.3 Expected output from segmented leg modules using Tellurex materials for different contact resistance values, and two cross-sectional area ratios for n-type to p-type legs. .......................................................................... 52
Figure 6.4 Modeling results using the iterative technique for segmented modules with 4.4mm long legs. ................ 53
Figure 6.5 Expected output from segmented leg modules using Tellurex materials for different contact resistance values, and two cross-sectional area ratios for n-type to p-type legs. .......................................................................... 54
Figure 6.6 Modeling results using the iterative technique for segmented modules (4 mm long legs). ........................ 55
Figure 6.7 Voltage scan across the junction of Bi2Te3-xSex to (LAST) showing a low contact resistance (voltage drop across the junction is less than one tenth of voltage drop across the full leg).............................................................. 55
Figure 6.8 Minimal-Loss TE Module Test Configuration & System - Double cold plate configuration for the module testing stage. ................................................................................................................................................................ 56
Figure 6.9 TE Module on Cold Plate with Insulator Ring in Place ............................................................................. 57
Figure 6.10 TE Module with Microtherm Added Around & Between Legs ............................................................... 57
Figure 6.11 Short-Circuit Connections at Output Terminals ....................................................................................... 59
Figure 6.12 Initial measurements of the 40Ω module. ................................................................................................ 60
Figure 6.13 Resistance throughout the modules measured at the hot side contacts of each unicouple. ..................... 63
Figure 6.14 Infrared image of the 40(Ω) Module with current flow through the module using a power supply. ...... 63
Figure 6.15 Infrared image of Module 1 with current flow through the module using a power supply. .................... 64
Figure 7.1 Hot-Side Heat Exchanger Design Cases for 30 kW TQG .......................................................................... 68
Figure 7.2 Hot-Side Heat Exchanger Design Cases for 60 kW TQG .......................................................................... 69
Figure 7.3 Exploratory Hot-Side Heat Exchanger Design & Validation Test System Design .................................... 69
Figure 7.4 Cold-Side Microtechnology Heat Exchanger Designs Have High Heat Transfer and Low Pressure Drop ..................................................................................................................................................................................... 70

vii
Figure 8. 1 Schematic Representation of the Sectioned Design with Anticipated Thermal Conditions (30 kW TQG Design Option) ............................................................................................................................................................ 75
Figure 8.2 Schematic Representation of the Sectioned Design with Anticipated Thermal Conditions (60 kW TQG Design Option) ............................................................................................................................................................ 77
Figure 8.3 Single-Section Thermoelectric Generator System for 60 kW TQG Applications ...................................... 79
Figure 8.4 Single Layer Build-Up in Thermoelectric Generator System for 60-kW TQG .......................................... 79
Figure 8.5 Y-Direction (Radial) Thermal Expansion Displacements in TE Modules Within TE Generator System (Units are mm, Symmetric Half-Module Analysis) ..................................................................................................... 80
Figure 8.6 X-Direction (Circumferential) Thermal Expansion Displacements in TE Modules Within TE Generator System. (Units are in mm, Symmetric Half-Module Analysis) .................................................................................. 80
Figure 8.7 Z-Direction (Axial) Thermal Expansion Displacements in TE Modules Within TE Generator System. (Units are in mm) ......................................................................................................................................................... 80
Figure 8.8 GRAFOILTM / Aluminum Nitride Interface Layup in TE Generator Design ............................................. 81
Figure 8.9 TEG System Power - Efficiency Tradeoff @ 100% Full Load (Texh= 780 K) & 75% of Full Load (Texh= 733 K) .......................................................................................................................................................................... 84
Figure 8.10 TE Module Power Output as Function of Load Resistance Per Module .................................................. 85

viii
Acronyms
AlN Aluminum Nitride
FEA Finite Element Analysis
IPR In Progress Review
LAST Lead-Antimony-Silver-Telluride
LASTT Lead-Antimony-Silver-Tin-Telluride
MSU Michigan State University
PNNL Pacific Northwest National Laboratory
ROR Ring-on-Ring
SERDP Strategic Environmental Research and Development Program
TQG Tactical Quiet Generator
Keywords
LAST/LASTT thermoelectric materials; thermoelectric system analysis, thermal fatigue,
mechanical strength, battery recharging; portable power; waste heat recovery, tactical power
Acknowledgements
Our team would like to express our sincerest thanks to Dr. John Hall, Sustainable Infrastructure Program Manager, Strategic Environmental Research & Development Program Office, and Ms. Carrie Wood, Technical Monitor, HGL, Inc. for their great support and funding of this project. Our team also would like to thank Dr. Mihal Gross, Office of Naval Research, for her insightful comments and critique of this work.

ix
Abstract
The U.S. military uses large amounts of fuel during deployments and battlefield operations. This project sought to develop a lightweight, small form-factor, soldier-portable advanced thermoelectric (TE) system prototype to recover and convert waste heat from various deployed military equipment (i.e., diesel generators/engines, incinerators, vehicles, and potentially mobile kitchens), with the ultimate purpose of producing power for soldier battery charging, advanced capacitor charging, and other battlefield power applications. The technical approach employed microchannel technology, a unique “power panel” approach to heat exchange/TE system integration, and newly-characterized LAST (lead-antimony-silver-telluride) and LASTT (lead-antimony-silver-tin-telluride) TE materials segmented with bismuth telluride TE materials in designing a segmented-element TE power module and system. This project researched system integration challenges of designing a compact TE system prototype consisting of alternating layers of thin, microchannel heat exchangers (hot and cold) sandwiching thin, segmented-element TE power generators. The TE properties, structurally properties, and thermal fatigue behavior of hot-pressed and sintered (HPS) LAST and LASTT materials were developed and characterized, such that the first segmented-element TE modules using LAST / LASTT materials were fabricated and tested. The LASTT p-type materials exhibited ZT values of 1.0 at 700 K, whereas the goal for these p-type materials was about 1.2 at 700 K. The p-type LASTT power factors, although improved during the project to about 17 µW/cm-K2 at 600-700 K , fell short of the expectations of 20-22 µW/cm-K2 at 600-700 K. Further work is needed to increase p-type LASTT power factors. The LAST n-type materials exhibited ZT values of 1.0 at 700 K compared to a goal of 1.5 at 700 K. Although n-type LAST material power factors were improved significantly to 16-26 µW/cm-K2 at 700 K, the thermal conductivity of these n-type LAST materials remained too high to achieve the n-type ZT goal. Additional work is needed in developing annealing techniques to reliably reduce the thermal conductivity of these materials. Major progress was made in characterizing the thermal fatigue of the HPS LAST and LASTT materials for the first time. Both materials showed good thermal fatigue characteristics, where Young’s modulus and Poisson’s ratio remained constant over 200 thermal cycles from 40 °C to 400 °C. All of the n-type LAST materials showed surface inclusions that led to surface spalling that should be further investigated. The ring-on-ring (ROR) fracture strength for both the as-received (not thermally fatigued) LAST and LASTT was discovered comparable to ROR strengths measured on commercially available Bi2Te3 (~ 30 MPa). The ring-on-ring fracture for LASTT (p-type) exhibited a band of fracture strength values between approximately 25 MPa to 40 MPa for up to 200 thermal fatigue cycles and did not degrade significantly during thermal cycling. The refined-LAST fracture data exhibited a band of strength values between about 15 MPa and 38 MPa for 0 to 200 thermal fatigue cycles. One of the latest refined – LAST batches (N37) maintained mechanical strength near 30 MPa (26 MPa ± 4 MPa) after 200 thermal fatigue cycles. Thermoelectric, thermal and structural analyses on this project ultimately led to these LAST and LASTT materials being successfully segmented with bismuth telluride and electrically interconnected with diffusion barrier materials and copper strapping within operating TE modules. These TE modules were successfully tested at Th = 400 °C and Tc 40 °C with no structural failures. The final TE module tested achieved a conversion efficiency of 6.56% with a cold-side temperature of 95 °C, subsequent analyses indicated it would have achieved well above 7% conversion efficiency with Tc 40 °C. The TE module targeted design efficiency of 9% was not achieved primarily because extraneous internal interface resistances, while coming down with each new module build, were still too high. A compact TE system design was developed to produce 1.4-1.5 kW of electrical energy (slightly below the original 1.6 kW goal) using these new TE modules (with 9% conversion efficiency) from the exhaust waste heat of 60-kW Tactical Quiet Generators as demonstration vehicles. The system design incorporated high-performance hot-side microchannel heat exchangers designed to provide a heat flux of 5.6-12 W/cm2 to the TE modules, this hot-side heat flux being well above the original design target of 2.9 W/cm2. These microchannel heat exchangers were fabricated during the course of the project. The system design also incorporated high-performance cold-side microchannel heat exchangers capable of absorbing a heat flux of 11 W/cm2 in cooling the TE system. Useful, flexible and modular TE system designs were developed for both 30-kW and 60-kW Tactical Quiet Generators.

10
1. Introduction
1.1 Background
The U.S. military uses large amounts of fuel during deployments and battlefield operations. In fact, 70% of the gross tonnage transported when the Army deploys turns out to be fuel. The U.S. Army pays $3.2 billion per year to maintain active-duty and reserve personnel to transport fuel that actually costs the Army another $0.2 billion per year to purchase. Over 60% of the fuel used by the U.S. Air Force is for airlifting people, material, and more fuel for operations. According to a Defense Science Board report in May 2001, the true cost of fuel delivered to the battlefield is $13-$300 per gallon; other, more recent reports have indicated that the true total burdened cost of fuel is approximately $20 per gallon. It also takes additional fuel and personnel risk to transport fuel into and around the modern battlefield. Eliminating the need for just one fuel convoy per day would create an enormous benefit in reduced risk and workload to soldiers in the Iraq and Afghanistan operational theaters. Consequently, the U.S. military has a strong need to develop technologies that increase fuel efficiency and minimize fuel requirements all along the logistics trail and in all battlefield operations.
The U.S. Army and Marines also have large and growing battlefield power requirements for a variety of battlefield equipment that allows them to effectively perform and complete their missions. This battlefield equipment includes a variety of sensors and laser-based range-finders and illuminator systems, wireless communications and computer systems, global positioning systems, night-vision equipment, electronic digital assistants and data managers, and weapon systems like thermal weapons sights, Javelin anti-tank missile launchers, counter-mortar radar, and various assault rifles. All of these systems have power requirements that are typically satisfied with various battery systems, such as AA alkaline, rechargeable AA NiMH, Li/SO2 , Li/MnO2 , and Zn-Air batteries. A typical rule of thumb is that a soldier needs 1 AA battery every hour, and soldiers typically carry twice as many as they need for battle contingency purposes. A typical soldier’s current power requirement is 14-30 watts average and 55 watts peak, and it is expected to rise to as high as 46 watts average and 65 watts peak in the near future. Consequently, the weight of the required batteries just one soldier needs is up to 11 lb for a 24-hour mission and up to 34 lb for a 72-hour mission. These weights are expected to rise to 17 lb and 52 lb for a 24-hour and 72-hour mission, respectively, in the near future.
The second aspect of this growing battlefield power requirement is logistics-related; that is, transporting the required fuel and battery weight into and around the battlefield theater and disposing of the used or partially-used batteries after mission completion. Many batteries are disposed of with 85% of full charge and contribute to the growing “battery graveyard” in the Iraq theater. Transporting battery weight into, around, and out of the battlefield theater also consumes fuel and contributes to military fuel requirements.
The U.S. military’s constant and growing power requirement creates a serious current and growing need for battery and, more recently, ultra-capacitor charging capabilities, to reduce the number of batteries and battery weight required on modern battlefields. The military also has current and growing needs to use battlefield fuel more efficiently to reduce fuel logistics costs and battlefield personnel risk.
1.2 Objectives
This project objective was to develop a lightweight, small form-factor, soldier-portable advanced thermoelectric (TE) system prototype to recover and convert waste heat from a variety of deployed equipment (i.e., diesel generators/engines, incinerators, vehicles, and potentially mobile kitchens), with the ultimate purpose of obtaining additional power for soldier battery charging, advanced capacitor charging, and other battlefield power applications. The main project objective was to achieve power conversion efficiencies of ~10% (double current TE conversion efficiencies) in a TE system with ~1.6-kW power output for a spectrum of battlefield power applications (i.e., Li-145 battery charging, ultra-capacitor charging). This technical objective involved integrating PNNL’s microchannel technology, PNNL’s unique “power panel” approach to heat exchange/TE system design, and recently characterized LAST (lead-antimony-silver-telluride alloys) thermoelectric
11
materials and bismuth telluride TE materials in an operating segmented TE power device. This project intended to research and solve the never-before-addressed system integration challenges (thermal expansion, thermal diffusion, electrical interconnection, thermal and electrical interfaces) of designing thin “power panels” consisting of alternating layers of thin, microchannel heat exchangers (hot and cold) sandwiching thin, segmented TE power-generating devices stacked vertically in a prescribed number of repetitive layers. Our national laboratory-university-industry team anticipated this project would produce a Technology Readiness Level (TRL) 4 system ready for rapid transition into TRL 6 validation of this critical power system technology for a wide spectrum of battlefield operations and power applications (i.e., Li-145 battery charging, ultra-capacitor charging). Current estimates indicate that adoption of this technology and its derivatives could produce up to a 13% reduction in fuel usage for the same power output in current 60 kW Tactical Quiet Generators (TQG) or up to a 3% increase in their power output for same fuel input.
There were several derived project objectives in TE materials development, TE module development, and system component development that emanated from main objective to achieve power conversion efficiencies of 10% in a 1.6 kW TE power system. Advanced n-type LAST materials and p-type materials were required that had high-performance ZT values, acceptable structural properties, could be segmented with bismuth telluride materials and could be transitioned into operating TE modules with all the appropriate electrical and structural connections that survive high temperature operation. The required ZT values of n-type LAST materials to meet project system performance objectives were 1.5 at 700 K. The required ZT values of p-type LASTT materials were 1.2 at 700 K. The power factors of both the n-type LAST and p-type LASTT materials needed to be 20 µW/cm-K2 or higher at 600-700 K. Manufacturability requirements dictated that hot-pressed and sintered versions of the n-type LAST and p-type LASTT materials were required. One derived structural property objective was to show that the Young’s modulus and Poisson’s ratio of the n-type LAST and p-type LASTT materials was stable after repeated thermal cycling from Th = 40 °C to operating conditions where Th = 400 °C. This would confirm that microcrack initiation and growth was not a problem and controllable in these materials. Another derived structural property objective was to demonstrate fracture strengths in the n-type LAST and p-type LASTT materials of about 30 MPa, similar to the fracture strengths of common bismuth telluride materials (We used in current TE cooling modules and power generators, before and after thermal cycling. Derived objectives in TE module development were ultimately to develop and demonstrate a 10% TE module conversion efficiency. The Phase 1 Go/NoGo objective was to demonstrate 8-10% conversion efficiency at the TE module level. Additional derived TE module objectives were to demonstrate: 1) thermoelectrically effective and structurally sound interfacing of the LAST/LASTT TE materials with bismuth telluride materials within n-type and p-type segmented elements, and 2) thermally effective and structurally sound interfacing of LAST/LASTT/bismuth telluride electrical connections at the hot- and cold-side of the TE element. This was all required to achieve the stated TE module conversion efficiencies. Derived system component development objectives included performing the required TE module structural analyses to provide TE module design guidance, design hot-side and cold-side microchannel heat exchangers to provide at least 2.9 W/cm2 heat flux performance, fabricate microchannel heat exchanger design prototypes, and develop TE module / heat exchanger interfacing techniques to ensure adequate thermal transport and electrical insulation across the TE module / heat exchanger interfaces on the hot- and cold-side. The TE module structural analyses and design had to show that n-type and p-type TE materials would remain within their fracture strength limits established in the structural property testing described above. The TE modules must then survive repeated thermal cycling conditions.
1.3 Advancements in Thermoelectric Material Science and System Design
Several advancements in TE material science, segmented TE element design and demonstration, TE module fabrication, microchannel heat exchanger design and fabrication, and TE system design were demonstrated on this project. The TE properties, structurally properties, and thermal fatigue behavior of hot-pressed and sintered (HPS) LAST and LASTT materials were developed and characterized, such that the first segmented-element TE modules using LAST / LASTT materials were fabricated and tested. The HPS LASTT p-type materials exhibited ZT values of 1.0 at 700 K. The p-

12
type LASTT power factors were improved during the project to about 17 µW/cm-K2 at 600-700 K The HPS LAST n-type materials ultimately exhibited ZT values of 1.0 at 700 K and their power factors were improved significantly to 16-26 µW/cm-K2 at 700 K, however the thermal conductivity of these n-type LAST materials remained too high to achieve the n-type ZT goal. A major advancement in the n-type LAST materials was that 3 different versions of n-type LAST materials were developed, each having different temperature-dependency behavior that could be exploited and tailored in dual-segmented and triple-segmented TE element designs. These three n-type LAST materials were controllably fabricated by straight-forward variations in key processing parameters. Major progress was made in characterizing the thermal fatigue and mechanical strength of the HPS LAST and LASTT materials for the first time. Both materials showed good thermal fatigue characteristics, where Young’s modulus and Poisson’s ratio remained constant over 200 thermal cycles from 40°C to 400°C. All of the n-type LAST materials showed surface inclusions that led to surface spalling that should be further investigated. In addition, approximately 20% of the p-type LASTT specimens showed bloating during thermal cycling, resulting in internal pores that were up to hundreds of microns across and at least tens of microns thick. The ring-on-ring (ROR) fracture strength for both the as-received (not thermally fatigued) LAST and LASTT was discovered comparable to ROR strengths measured on commercially available Bi2Te3 (~ 30 MPa, Wereszczak et al.25). The ring-on-ring fracture for LASTT (p-type) exhibited a band of fracture strength values between approximately 25 MPa to 40 MPa for up to 200 thermal fatigue cycles and did not degrade significantly during thermal cycling. The refined-LAST fracture data exhibited a band of strength values between about 15 MPa and 38 MPa for 0 to 200 thermal fatigue cycles. One of the latest refined – LAST batches (N37) maintained mechanical strength near 30 MPa (26 MPa ± 4 MPa) after 200 thermal fatigue cycles. These structural and fracture strength characterizations are the first reported comprehensive measurements of structural and fracture strength properties after thermal cycling for these new n-type LAST and p-type LASTT materials. In fact, there is very little structural and fracture strength data reported in the literature for any thermoelectric materials. Thermoelectric, thermal and structural analyses on this project ultimately led to these LAST and LASTT materials being successfully segmented with bismuth telluride and electrically interconnected with diffusion barrier materials and copper strapping within operating TE modules. These TE modules were successfully tested at Th = 400 °C and Tc 40 °C with no structural failures. The final TE module tested achieved a conversion efficiency of 6.56% with a cold-side temperature of 95 °C, subsequent analyses indicated it would have achieved well above 7% conversion efficiency with Tc 40 °C. The TE module targeted design efficiency of 9% was not achieved primarily because extraneous internal interface resistances, while coming down with each new module build, were still too high. The TE modules tested showed good structural integrity with no structural failures during the repeated testing. This is a testimony to the excellent structural analysis and design work and structural property characterization performed in designing these TE modules. In true fact, the module structural design dictated the overall TE module design as much as thermoelectric and thermal design considerations. These operating TE modules were the first demonstration of LAST/LASTT materials, and in particular segmented elements using LAST / LASTT materials, in an operating TE module.
A compact TE system design was developed to produce 1.4-1.5 kW of electrical energy (slightly below the original 1.6 kW goal) using these new TE modules (with 9% conversion efficiency) from the exhaust waste heat of 60 kW Tactical Quiet Generators as demonstration vehicles. The system design incorporated high-performance hot-side microchannel heat exchangers designed to provide a heat flux of 5.6-12 W/cm2 to the TE modules, this hot-side heat flux being well above the original design target of 2.9 W/cm2. These high thermal heat fluxes were achieved with microchannel designs that had predicted pressure drops of about 0.6-0.8 psi, well within our project target goal of 1 psi pressure drop. These microchannel heat exchangers were fabricated during the course of the project. The system design also incorporated high-performance cold-side microchannel heat exchangers capable of absorbing a heat flux of 11 W/cm2 in cooling the TE system. Useful, flexible and modular TE system designs were developed for both 30 kW and 60 kW Tactical Quiet Generators. The design for the 60 kW TQG was designed and projected to achieve a 9% TE module conversion efficiency with a 1.4 kW power output at 100% full load conditions, while the design for the 30 kW TQG was
13
projected to achieve about 1.3 kW of power at about 7.8% system conversion efficiency. These designs would provide the Army with several viable waste energy recovery options in their TQG fleet.
1.4 Reasons Why Expected Performance Was Elusive
Although the project accomplished many milestones and firsts in designing and demonstrating TE elements and modules using n-type LAST and p-type, there were some significant shortcomings in performance that left some project goals unmet. In particular, the final system designs did not achieve the stated goal of 10% conversion efficiency and 1.6 kW power output in its Phase 1 work and the segmented-element TE modules did not achieve their intended conversion efficiencies and power outputs. The major reason for this is that the HPS n-type LAST and p-type LASTT TE materials did not meet thermoelectric performance expectations. In particular, the LASTT p-type materials exhibited ZT values of 1.0 at 700 K, whereas the goal for these p-type materials was about 1.2 at 700 K. The p-type LASTT power factors, although improved during the project to about 17 µW/cm-K2 at 600-700 K, fell short of the expectations of 20-22 µW/cm-K2 at 600-700 K. Additional research and development is required to improve their power factors. In addition, the n-type LAST materials exhibited ZT values of 1.0 at 700 K compared to a goal of 1.5 at 700 K. Although n-type LAST material power factors were improved significantly to 16-26 µW/cm-K2 at 700 K, the thermal conductivity of these n-type LAST materials remained too high to achieve the n-type ZT goal. There was significant work on-going at the end of the project to improve high-temperature annealing processes that showed good promise and was successful at times in reducing the thermal conductivity across the intended temperature range. However, repeatability of this effect was questionable and more research and development is needed in improve the annealing processes (times and temperatures) to systematically and reproducibly decrease the thermal conductivity in the HPS n-type LAST materials. All of the n-type LAST materials showed surface inclusions that led to surface spalling that should be further investigated and eliminated in future material versions. Also, about 20% of the p-type LASTT specimens showed bloating during thermal cycling, and that problem should also be addressed. The TE modules also did not meet their performance goals because of extraneous electrical contact resistances at critical element and component connections within the TE modules. These extraneous electrical resistances were decreasing with each subsequent TE module buildup as fabrication processes improved at the end of the project, but more work is required in this area. TE modules using the new n-type LAST and p-type LASTT materials also should be subjected to systematic and rigorous thermal cycling which there simply was not time for as the project closed
Phase 1 Project Task Summary
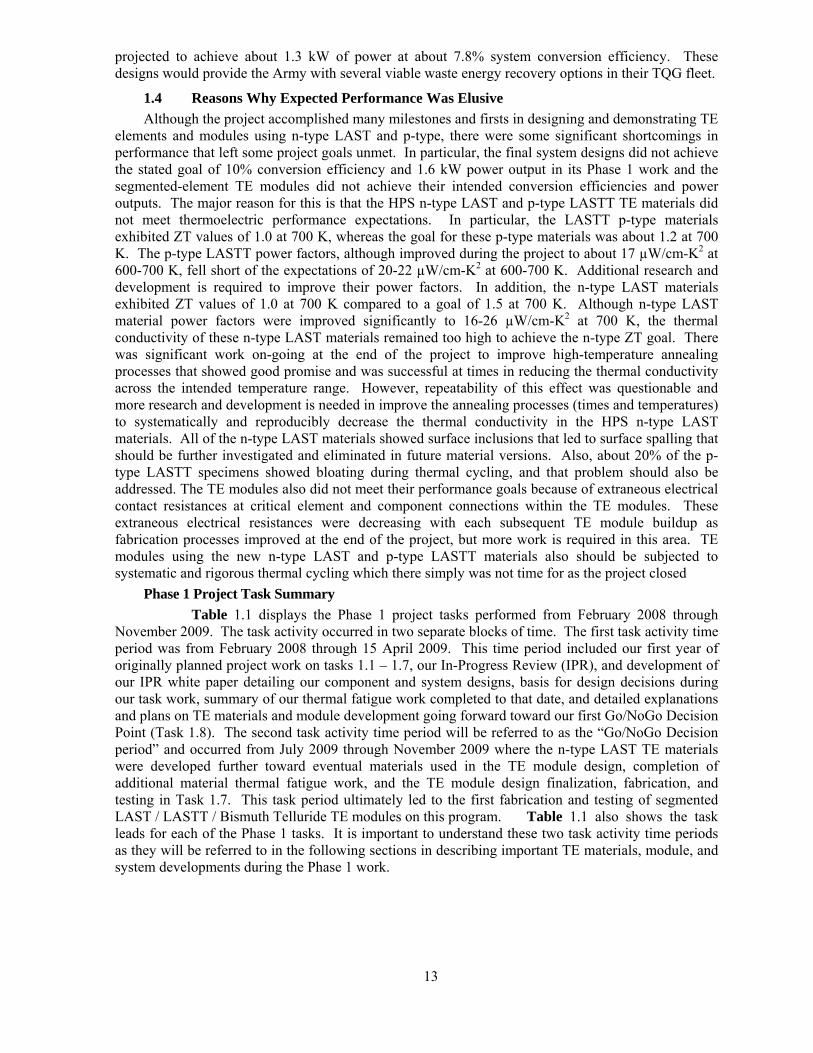
Table 1.1 displays the Phase 1 project tasks performed from February 2008 through November 2009. The task activity occurred in two separate blocks of time. The first task activity time period was from February 2008 through 15 April 2009. This time period included our first year of originally planned project work on tasks 1.1 – 1.7, our In-Progress Review (IPR), and development of our IPR white paper detailing our component and system designs, basis for design decisions during our task work, summary of our thermal fatigue work completed to that date, and detailed explanations and plans on TE materials and module development going forward toward our first Go/NoGo Decision Point (Task 1.8). The second task activity time period will be referred to as the “Go/NoGo Decision period” and occurred from July 2009 through November 2009 where the n-type LAST TE materials were developed further toward eventual materials used in the TE module design, completion of additional material thermal fatigue work, and the TE module design finalization, fabrication, and testing in Task 1.7. This task period ultimately led to the first fabrication and testing of segmented LAST / LASTT / Bismuth Telluride TE modules on this program. Table 1.1 also shows the task leads for each of the Phase 1 tasks. It is important to understand these two task activity time periods as they will be referred to in the following sections in describing important TE materials, module, and system developments during the Phase 1 work.

14
Table 1.1 Phase 1 Project Tasks
Task Number
Task Description Task Leads Task Dates
1.1 Define System & Requirements & Perform System-Level Analysis (Thermal, TE, Structural)
PNNL 2/2008 – 3/2009 7/2009 – 9/2009
1.2 Research & Develop Segmented Element Interfaces & Processes
MSU/Tellurex 5/2008 – 3/2009 7/2009 – 9/2009
1.3 Research & Develop TE Device – Design TE Couple Electrical Connection Interfaces & Circuit Layout
Tellurex 5/2008 – 3/2009 7/2009 – 9/2009
1.4 Design & Develop HX/TE Thermal Interfaces & Processes
PNNL 5/2008 – 12/2008
1.5 Design Hot- & Cold-Side Microchannel Heat Exchangers
PNNL 5/2008 – 12/2008
1.6 TE Material Thermal Stability Studies MSU 5/2008 – 3/2009 7/2009 – 10/2009
1.7 TE Module Fabrication with LAST / LASTT / Bi2Te3 Elements
Tellurex 7/2009 – 11/2009
1.8 Go/NoGo Decision 12/2009
2. Go/NoGo Criteria from Original SERDP Proposal & IPR White Paper Our Go/NoGo criteria were originally specified in our SERDP Proposal (January 2008) and
refined in our IPR White Paper (April 2009). The criteria are given below to confirm and clarify what our specific goals were during this Go/NoGo Decision period.
Go/NoGo Decision Point #1
This decision point was at the end of Phase 1 and represents the point at which Tellurex would deliver five multi-couple devices with the approximate size and style of the final TE module design using custom hand assembly and fabrication tooling. These hand-fabricated devices were to go through performance testing at MSU. The key decision criteria were achieving a module conversion efficiency of 8-10% with a power output of approximately 5 W at temperatures and temperature differentials associated with our final diesel generator exhaust stream conditions and the system design details. These specific temperatures were to be determined in Tasks 1.1 through 1.7 of Phase 1 and were the result of both TE module design details and the microchannel heat exchanger design details establish in these tasks. At this point our team was to have completed the TE material thermal stability and thermal fatigue studies. The key decision criteria would be demonstrating that the LAST / LASTT TE materials have fatigue and strength characteristics similar or better than undoped PbTe TE materials being that, historically, PbTe has been successfully used and withstood the rigors of field operation. PNNL was to complete the microchannel heat exchanger design studies and have a specific target design established. Our team was also to provide SERDP with a test plan at the end of Phase 1 for Task 2.3 (Perform TE Device Validation Testing) in Phase 2, which specified TE module testing procedures and configurations and the following test parameters: Hot-side temperature, Cold-side temperature, Planned time at temperature, Planned duty cycles, Planned test duration, Expected voltage and current levels, and Expected internal resistance.

15
Modifications From In-Progress Review (IPR) White Paper and Summary of Next Steps Outlined in IPR White Paper:
Further improve the n-type HL LAST materials from Tellurex by refining the lead composition and annealing process steps similar to that used in the Zhou process materials shown in Figures 3.4 and 3.8.
Concentrate our available thermal fatigue / mechanical strength testing resources on the HL LAST n-type compositions coming from Tellurex as well as continuing with the testing of the LASTT p-type materials from Tellurex.
Because the stress states developed in the materials are dependent on the module and system design, our team also feels it is critical to perform module-level thermal cycling tests during the time leading up to our Go/NoGo Decision in July 2009. As part of the work to evaluate the mechanical strength impacts of these LAST/LASTT materials and the effects of thermal fatigue, PNNL will perform structural stress analyses of our TEG system using the compiled thermal-fatigue-induced properties (Young’s modulus, Poisson’s ratio) leading up to our Go/NoGo Decision.
We had originally intended to perform our validation testing on the hot-side heat exchanger design in Phase 2 of our program, but if time and budget permit we will begin this testing in the time period immediately prior to our Go/NoGo Decision in July 2009.
As discussed above in Section 33, the project was targeting the ZT performance of the Zhou-process n-type material and the HL LAST n-type material for the remainder of our TEG system design on this project.
This created 2 significant criteria for our team:
1) The lack of mechanical property data in the literature of TE materials created difficulties for the Go-No Go decision criteria. The undoped PbTe TE materials demonstrated low biaxial fracture strength and tended to accumulate microcracking during thermal cycling. Thus, the undoped PbTe material does not have sufficient mechanical integrity to allow its use as a benchmark material. Instead, the project proposed that Go-No Go criteria for material thermal stability be two-fold, namely that the biaxial, ring-on-ring (ROR) fracture strength of the LASTT and HL LAST be (1) comparable to or higher than the MPa measured for the biaxial ROR fracture strength measured for commercial Bi2Te3 material [Wereszczak et al.25] and (2) exceed the in-material stresses computed from the PNNL numerical modeling of thermally-induced stresses in the modules. In addition, the project team was to consider the results of module-level thermal fatigue testing done by Tellurex. For the thermal stability studies, the project team proposed focusing on the thermal fatigue/fracture testing of p-type LASTT specimens until early May. Starting in early May we would begin both thermal fatigue/ biaxial fracture testing (According to Reference ix.) and thermal fatigue/elastic moduli testing of the n-type HL LAST and n-type “refined” HL LAST. During the March-July 2009 time period, the following thermal stability work was to be completed:
Mar – April: Thermal fatigue/biaxial fracture strength testing on 60 LASTT disks May – July: Thermal fatigue/ biaxial fracture strength testing on 80 of HL LASTT disks May – June: Thermal fatigue/elastic modulus testing on 4 HL LASTT plate-shaped specimens
Because of funding administration and the time that SERDP Go/NoGo Decision funding arrived, the May – July 2009 (unfunded) timeframe was modified to July – October 2009.

16
(The project originally intended to perform fracture testing on 150 from each of the p-type LASTT and n-type LAST specimens. The project ultimately scheduled fracture testing on 80 specimens from each of the p-type LASTT and n-type HL LAST material.)
2) Test module robustness under near-operating conditions (will aid in correlating analytical
materials strength data with near-operation conditions of fabricated modules). This task was to take place at Tellurex and MSU and intended to test the modules under thermal cycling conditions similar to the time-temperature profiles used in material thermal fatigue studies and specified by PNNL. Because of time and funding constraints this task was not completed, although it was noted that none of the TE modules fabricated and tested in Section VI suffered any structural failures during the repeated exposure to test conditions (Th = 400 °C, Tc = 40 °C).
Table 2.1 shows a summary of our Go/NoGo decision criteria and the current status relative to completion or demonstration. The following sections will discuss the status in detail and give anticipated or recommended next steps beyond the Go/NoGo decision point.
Table 2.1 Summary of Go/NoGo Decision Criteria and Status
ZT = Material Figure of Merit x Temperature
PF = Power Factor = 2; where =Seebeck Coefficient [µV/K], =electrical conductivity [(ohms-cm) -1]
3. LAST / LASTT TE Materials Development The genesis of this project was the early excellent thermoelectric properties demonstrated by the
cast-versions of LASTT (Lead Antimony Silver Tin Telluride) materials and LAST (Lead Antimony
No/NoGo
Decision
Criteria Status Comments
n-type LAST Material Development
ZT: 1.5 @ 700 K
0.9 @ 500 K
0.4 @ 400 K
PF: 18 µW/cm-K2 @ 700 K
15 µW/cm-K2 @ 500 K
11 µW/cm-K2 @ 400 K
Data from Zhou et al.10
ZT: 1.0 @ 700 K
0.7 @ 500 K
0.5 @ 400 K
PF: 16 - 26 µW/cm-K2 @ 700 K
17 – 21 µW/cm-K2 @ 500 K
16 – 20 µW/cm-K2 @ 400 K
Issue is Reducing TE Material Thermal Conductivity
Successful Bonding of LAST/Bismuth Telluride
and LASTT/Bismuth Telluride Shown at
Temperature;
Successful Bonding of LAST/LASTT/Stainless
Steel Hot Interfaces Shown at Temperature
TE Module Performance Demonstrate Power of 5 W (for 2 modules) @ 8-10%
Conversion Efficiency
Demonstrated 2.6% to 6.5% Efficiency (1.8 W Maximum for
1 module)
Module Efficiency Increasing with Each Module Fabrication
LAST / LASTT Thermal Fatigue (200 cycles)
Demonstrate that materials were stable; Mechanical
Strengths of ~30 MPa
Young’s Modulus & Poisson’s Ratio Appear Stable @ 200
Cycles
Mechanical Strength
LAST: 25 -40 MPa
LASTT: 15- 37 MPa
TE Module Structural Analysis
Complete Module Structural Analysis Using Thermal
Fatigue Data
Completed Analysis;
Identified Critical Element & Interface Designs
High Stresses Mitigated - No Module Structural
Failures Occurred
Microchannel Heat Exchanger Design
2.9 W/cm2 Designs with 5.6 – 12.0 W/cm2 Completed & Exceeded Goal
Task 2.3 Test Plan Develop the Test Plan for Phase II Module Testing
Completed & Discussed in Go/NoGo Report, Section VI
TE Module Thermal Cycling Demonstrate Thermal Cycling up to 400 °C
Time & Budget Did Not Allow No Module or Couple Breakage During
Multiple Testing Cycles; Shift Cycling to Phase 2

17
Silver Telluride) materials shown in Figures 3.1 and 3.2. The LASTT materials (shown in dashed light blue in Figure 3.1) exhibited reasonably high power factors at a fraction of the material costs of TAGS-85. The LASTT materials (shown in Forest Green in Figure 3.2) exhibited peak ZT values in excess of 1.5 at 650 K. These properties at these temperatures are ideal for waste heat recovery applications in diesel engine and vehicle exhaust applications. However, based on early research at Michigan State University and at Tellurex Corporation supported by the Office of Naval Research (ONR) it was known that the cast-versions of LAST/LASTT required further improvements in reproducibility and the required manufacturing processes. The ONR supported research also provided preliminary mechanical strength data on these materials, identified strength levels that were low in module fabrication research, and identified paths for strength improvements (e.g. powder processing demonstrated a three-fold increase in strength for polished specimens tested with bi-axial ball-on-ring flexure testing) for robust TE generator systems in engine/vehicle waste heat recovery applications. Consequently, in order to achieve project goals our team immediately began (even before the start of our current project) further developing hot-pressed and sintered (HPS) versions of the LAST/LASTT materials.
Our early TE material efforts on this project have focused on the characterization of HPS materials fabricated by Tellurex Corporation, including measurements of 21 n-type Ag0.86Pb19SbTe20 (LAST) based materials, 16 p-type Ag0.9Pb9Sn9Sb0.6Te20 (LASTT) based materials, one n-type Bi2Te3-
xSex, and one p-type BixSb2-xTe3 sample. Table 3.1, Table 3.2, and Table 3.3 show these early TE materials and their chronology up to the March 2009 timeframe, as well as other TE materials investigated in our Go/NoGo time period after June 2009. Measurements have included temperature dependent electrical conductivity, and thermopower and room temperature thermal conductivity and scanning voltage measurements for electrical conductivity and verification of sample uniformity. Temperature-dependent thermal conductivity measurements were recently obtained by sending samples to the Thermal Physical Research Laboratory (TPRL) at Purdue University for temperature-dependent thermal diffusivity measurements, and sending samples to Professor Mercouri Kanatzidis at Northwestern University for temperature- dependent thermal conductivity measurements. In both cases, the laser flash technique for thermal diffusivity measurements was utilized. The results of the electrical conductivity, , thermopower, , the resulting power factor, 2, and the thermal conductivity, , for the p-type Ag0.9Pb9Sn9Sb0.6Te20 (LASTT) and the ZT given by:
are shown in Figure 3.1 and Figure 3.2. Figure 3.2 also shows the level of performance for p-type hot-pressed and sintered LASTT materials (Light Green labeled SERDP project) as of November 2009 at the end of the Phase 1 effort. Although they are not at the performance levels of cast LASTT materials, this work has shown good progress, the p-type LASTT materials are exhibiting repeatability, and have approached the power factors of cast LASTT materials. As these materials continue to develop going forward, it is anticipated they can continue to more closely approach cast LASTT performance levels.
Four compositions of n-type samples were investigated, including Ag0.86Pb19SbTe20, Ag0.86Pb20.5SbTe20, Ag0.86Pb22SbTe20, and Ag0.86Pb19+xSbTe20. The Ag0.86Pb19+xSbTe20 composition was an n-type LAST material that was developed independently at Tellurex Corporation laboratories under Tellurex internal research and development funding during a non-contractual period from April 2009 through June 2009. This material set was brought into the project by Tellurex Corporation in July 2009 in order to provide a higher performance, most structurally stable n-type material for subsequent TE module fabrication and testing later during the Go/NoGo Decision period (July – November 2009). It is referred to as “refined” HL LAST in later sections of this report, but its actual composition cannot be revealed because it is proprietary intellectual property by Tellurex Corporation not developed under this project.

18
Table 3.1 Tellurex N-type SERDP Sample ID’s and Compositions
Sample ID Sample Composition Date Received
HL-LAST Ag0.86Pb22SbTe20 3/2/2009
LS-2 Ag0.86Pb22SbTe20 6 day anneal (400ºC) 4/14/2009
LS-3 Ag0.86Pb22SbTe20 12 day anneal (400ºC) 4/14/2009
LS-4 Ag0.86Pb22SbTe20 18 day anneal (400ºC) 4/14/2009
LS-5 Ag0.86Pb22SbTe20 24 day anneal (400ºC) 4/14/2009
N1011-27 to N1011-34 Ag0.86Pb19SbTe20 9/8/2008 - 4/23/2009
N15D-18 Ag0.86Pb19SbTe20 8/1/2008
N24-2 and N24-3 Ag0.86Pb19SbTe20 9/5/2008 & 9/15/2008
N24-2-#1 Ag0.86Pb19SbTe20 4/2/2009
N24-2-#2 Ag0.86Pb19SbTe20 4/13/2009
N24-2-#3 Ag0.86Pb19SbTe20 4/16/2009
N24-2-#4 Ag0.86Pb19SbTe20 4/23/2009
N26-1 to N26-3 Ag0.86Pb22SbTe20 9/30/2008
N26-1-#1 Ag0.86Pb22SbTe20 4/2/2009
N26-1-#2 Ag0.86Pb22SbTe20 4/13/2009
N26-1-#3 Ag0.86Pb22SbTe20 4/16/2009
N26-1-#4 Ag0.86Pb22SbTe20 4/23/2009
N28-5 Ag0.86Pb19SbTe20 1/23/2009
N28-7 Ag0.86Pb19SbTe20 1/23/2009
N30 Ag0.86Pb20.5SbTe20 1/14/2009
N30-#1 Ag0.86Pb20.5SbTe20 4/2/2009
N30-#2 Ag0.86Pb20.5SbTe20 4/13/2009
N30-#3 Ag0.86Pb20.5SbTe20 4/16/2009
N30-#4 Ag0.86Pb20.5SbTe20 4/23/2009
N30-8 Ag0.86Pb20.5SbTe20 5/4/2009
N32-1 Ag0.86Pb19SbTe20 2/6/2009
N33-42 Ag0.86Pb19SbTe20 5/7/2009
N33-43 Ag0.86Pb19SbTe20 5/4/2009
N33-45 Ag0.86Pb19SbTe20 5/4/2009
N35-1 Ag0.86Pb22SbTe20 5/7/2009
N35-7 Ag0.86Pb22SbTe20 5/4/2009
N36-#1 Ag0.86Pb19+xSbTe20 5/18/2009
N37-2a Ag0.86Pb19+xSbTe20 6/26/2009
N37-2b Ag0.86Pb19+xSbTe20 8/13/2009
N37-2c Ag0.86Pb19+xSbTe20 8/19/2009

19
Table 3.2 Tellurex P-type SERDP Sample ID’s and Compositions
Sample ID Sample Composition Date Received
P15D-56a Ag0.9Pb9Sn9Sb0.6Te20 8/1/2008
P15D-58a Ag0.9Pb9Sn9Sb0.6Te20 8/1/2008
P21-22-1 Ag0.9Pb9Sn9Sb0.6Te20 4/2/2009
P2122-1-#1 Ag0.9Pb9Sn9Sb0.6Te20 4/13/2009
P2122-1-#2 Ag0.9Pb9Sn9Sb0.6Te20 4/16/2009
P2122-1-#3 Ag0.9Pb9Sn9Sb0.6Te20 4/23/2009
P2122-1-#4 Ag0.9Pb9Sn9Sb0.6Te20 9/30/2008
P21-22-2 Ag0.9Pb9Sn9Sb0.6Te20 9/30/2008
P21-22-5 Ag0.9Pb9Sn9Sb0.6Te20 9/30/2008
P21-28 Ag0.9Pb9Sn9Sb0.6Te20 10/24/2008
P21-29 Ag0.9Pb9Sn9Sb0.6Te20 10/24/2008
P21-34 Ag0.9Pb9Sn9Sb0.6Te20 10/24/2008
P21-35 Ag0.9Pb9Sn9Sb0.6Te20 10/24/2008
P24-17 Ag0.9Pb9Sn9Sb0.6Te20 1/23/2009
P24-17-#1 Ag0.9Pb9Sn9Sb0.6Te20 4/2/2009
P24-17-#2 Ag0.9Pb9Sn9Sb0.6Te20 4/13/2009
P24-17-#3 Ag0.9Pb9Sn9Sb0.6Te20 4/16/2009
P24-17-#4 Ag0.9Pb9Sn9Sb0.6Te20 4/23/2009
P25-1 Ag0.9Pb9Sn9Sb0.6Te20 2/6/2009
P31-1 Ag0.9Pb9Sn9Sb0.6Te20 6/26/2009
P38-1 Ag0.9Pb9Sn9Sb0.6Te20 7/7/2009
P40-4 Ag0.9Pb9Sn9Sb0.6Te20 8/1/2008
Table 3.3 Tellurex Bismuth Telluride SERDP Samples
Sample ID Composition Comments
BiTe-N Bi2Te3-xSex For power factor measurements
BiTe-N-k Bi2Te3-xSex For thermal conductivity
BiTe-P BixSb2-xTe3 For power factor measurements
BiTe-P-k BixSb2-x Te3 For thermal conductivity

20
Figure 3.1 Measured electrical conductivity, , thermopower, , power factor, PF = 2, and thermal conductivity, , for hot pressed samples of Ag0.9Pb9Sn9Sb0.6Te20 fabricated by Tellurex Corp. For reference, data for cast material of Ag0.9Pb9Sn9Sb0.6Te20, PbTe with 1.0% Na (atomic %) [1], and for (AgSbTe2)0.15-(GeTe)0.85 or TAGS-85 [2] are also shown.
Figure 3.2 Figure of merit, ZT, for these and other high performance p-type materials [1,2,3,4,5,6,7,8].
200
400
600
800
1000
1200
1400
1600
1800
300 400 500 600 700 800
P21-22-1aP21-22-2aP21-29P21-34aP21-35aP24-17P38-1P40-4PbTeTAGS-85Cast FitEC Fit
Ele
ctri
cal C
ondu
ctiv
ity
(S/c
m)
Temperature (K)
Tellurex p-type HP LASTT
50
100
150
200
250
300
300 400 500 600 700 800
P21-22-1aP21-22-2aP21-29P21-34aP21-35aP24-17P38-1P40-4PbTeTAGS-85Cast FitTEP Fit
The
rmop
ower
(µ
V/K
)
Temperature (K)
Tellurex p-type HP LASTT
0
5
10
15
20
25
30
35
300 400 500 600 700 800
P21-22-1aP21-22-2aP21-29P21-34aP21-35aP24-17P38-1P40-4PbTe (1.0 Na)TAGS-85Cast FitPF Fit
Pow
er F
acto
r (µ
W/c
m·K
2 )
Temperature (K)
Tellurex p-type HP LASTT
0.5
1
1.5
2
2.5
3
300 400 500 600 700 800
P15-11
P25-2 (1st Run)P25-2 (2nd Run)P25-1 (Cp from P25-2)P7/P8PbTe (1.0-Na)TAGS-85TC Fit
The
rmal
Con
duct
ivity
(W
/m·K
)
Temperature (K)
Samples measured byM. Kanatzidis's group(Northwestern Univ.)
P25-1 TPRLUsing Cpfrom P25-2
0
0.5
1
1.5
2
400 600 800 1000 1200
ZT
Temperature (K)
BixSb
2–xTe
3
Na0.95
Pb20
SbTe22
Zn4Sb
3
Ag0.5
Pb6Sn
2Sb
0.2Te
10
CeFe4Sb
12
PbTeYb
14MnSb
11
(AgSbTe2)0.15
(GeTe)0.85
p-type
Ce0.28
Fe1.5
Co2.5
Sb12
nanoBi
xSb
2–xTe
3
Ag0.9
Pb9Sn
9Sb
0.6Te
20 (100g)
TellurexLASTT

21
Figure 3.3 Measured electrical conductivity, , thermopower, , and the power factor, PF = 2, for hot pressed samples of Ag0.86Pb19SbTe20 fabricated by Tellurex Corp. For reference, data of PbTe with 0.03% PbI2 (mol %) [9], and for cast Ag0.86Pb19SbTe20 [
10] are also shown.
Figure 3.4 Thermal conductivity, κ, measured by the Kanatzidis group at Northwestern University for hot pressed samples of Ag0.86Pb19SbTe20 fabricated by Tellurex Corp. For reference, data for PbTe with 0.03% PbI2 (mol %) [9], and for Ag0.8Pb22.5SbTe20 fabricated by Zhou, et al., and annealed for up to 30 days [17] are also shown. Figure of merit, ZT, for these and other high performance materials are shown on the right [9, 11,12,13, 14, 15,16,17].
0
100
200
300
400
500
600
300 400 500 600 700 800
N1011-15
N15D-18b
N24-2
N24-2-#1
N24-3
N28-5
N32-1
N33-42
PbTe
Cast Fit
Ele
ctri
cal C
ondu
ctiv
ity (
S/c
m)
Temperature (K)
Tellurex n-type hot pressed (Ag0.86
Pb19
SbTe20
)
-350
-300
-250
-200
-150
-100
-50
300 400 500 600 700 800
N1011-15N15D-18bN24-2N24-2-#1N24-3N28-5N32-1N33-42PbTeCast Fit
The
rmop
ower
(µ
V/K
)
Temperature (K)
Tellurex n-type hot pressed (Ag0.86
Pb19
SbTe20
)
0
5
10
15
20
25
30
35
40
300 400 500 600 700 800
N1011-15N15D-18bN24-2N24-2-#1N24-3
N28-5N32-1N33-42PbTeCast Fit
Pow
er F
acto
r (µ
W/c
m·K
2 )
Temperature (K)
Tellurex n-type hot pressed (Ag0.86
Pb19
SbTe20
)
0.5
1
1.5
2
2.5
300 400 500 600 700 800
N32-2TC Fit (N15-6)TC Fit (N32-2)Cast FitZhou (0d)Zhou (10d)Zhou (30d)PbTe
The
rmal
Con
duct
ivity
(W
/m·K
)
Temperature (K)
Tellurex n-type HP LAST
Anneal653 (K)
0
0.5
1
1.5
2
400 600 800 1000 1200
ZT
Temperature (K)
Bi2Te
3-xSe
x
Ag0.86
Pb18
SbTe20
(Cast)
PbTe
CoSb3
La2Te
3
SiGe
PbTe-PbS(8%)
n-type
Ba0.30
Ni0.05
Co3.95
Sb12
Mg2Si
0.6Sn
0.4
Mg2Si
0.4Sn
0.6
Ba0.08
Yb0.09
Co4Sb
12Ag0.8
Pb22.5
SbTe20
(HP 30d anneal)(HP 0d anneal)
TellurexAg
0.86Pb
19SbTe
20

22
Results for the electrical conductivity, , thermopower, , the resulting power factor (2), and thermal conductivity, , for the n-type Ag0.86Pb19SbTe20 (LAST) are shown in Figure 3.3 and Figure 3.4. Figure 3.3 shows significant improvements were made in n-type materials from N1011-15 to N28-5 to N32-1 as the power factor increased in the initial stages of Phase 1 largely through increases in the electrical conductivity of the samples. However, as shown in Figure 3.4, these materials have fallen well short of the ZT of cast LAST materials and required significant performance improvements going forward. Tellurex’s subsequent development in these materials involved adjustments to the lead content to Ag0.86Pb20.5SbTe20. This composition showed some samples with a p-type to n-type transition as a function of temperature as shown in Figure 3.5. They further exhibited a rapidly increasing power factor at the higher temperatures demonstrating some control of the temperature location of the peak in the power factor.
Figure 3.5 Measured electrical conductivity, , thermopower, , and the power factor, PF = 2, for hot
pressed samples of Ag0.86Pb20.5SbTe20 fabricated by Tellurex Corp. For reference, data of PbTe with 0.03% PbI2 (mol %) [9], and for cast Ag0.86Pb19SbTe20 [
10] are also shown.
0
100
200
300
400
500
600
300 400 500 600 700 800
N30N30-#1N30-#2N30-#3N30-#4N30-8PbTeCast Fit
Ele
ctri
cal C
ondu
ctiv
ity
(S/c
m)
Temperature (K)
Tellurex n-type hot pressed (Ag0.86
Pb20.5
SbTe20
)
-400
-300
-200
-100
0
100
200
300
300 400 500 600 700 800
N30N30-#1N30-#2N30-#3N30-#4N30-8PbTeCast Fit
The
rmop
ower
(µ
V/K
)
Temperature (K)
Tellurex n-type hot pressed (Ag0.86
Pb20.5
SbTe20
)
0
5
10
15
20
25
30
35
40
300 400 500 600 700 800
N30N30-#1N30-#2N30-#3
N30-#4N30-8PbTeCast Fit
Pow
er F
acto
r (µ
W/c
m·K
2 )
Temperature (K)
Tellurex n-type hot pressed (Ag0.86
Pb20.5
SbTe20
)

23
Results reported by Zhou, et al. [17], showed samples of higher lead content powder processed and sintered exhibited significant increases in ZT upon annealing at a relatively mild temperature (400ºC) as in Figure 3.4 Tellurex subsequently incorporated the annealing step and composition (Ag0.86Pb22SbTe20) to better match the Zhou process. Tellurex fabricated samples LS-2 through LS-4 in 10mm × 10mm × 2mm shapes suitable for thermal conductivity measurements using the laser flash measurement technique. These samples were measured by Professor Mercouri Kanatzidis’ group at Northwestern University and the same samples were then sent to Michigan State University where they were cut to the appropriate dimensions and measured for power factor. Through this process, all three parameters for ZT were measured on the same samples and are shown in Figure 3.7.
Figure 3.6 Measured electrical conductivity, , thermopower, , and the power factor, PF = 2, for hot pressed samples of Ag0.86Pb22SbTe20 fabricated by Tellurex Corp. Samples LS-2, LS-3, LS-4, and LS-5 were annealed at 400ºC for 6, 12, 18, and 24 days respectively. For reference, data for PbTe with 0.03% PbI2 (mol %) [9], for cast Ag0.86Pb19SbTe20 [
10], and for Ag0.8Pb22.5SbTe20 fabricated by Zhou, et al., and annealed for up to 30 days [17] are also shown.
0
100
200
300
400
500
600
300 400 500 600 700 800
HL-LAST-a2HL-LAST-a3LS-2LS-3LS-4LS-5N35-1Zhou (0d)Zhou (10d)Zhou (30d)Cast FitPbTe
Ele
ctri
cal C
ondu
ctiv
ity
(S/c
m)
Temperature (K)
Tellurex n-type hot pressed (Ag0.86
Pb22
SbTe20
)
-400
-300
-200
-100
0
100
200
300
300 400 500 600 700 800
HL-LAST-a2HL-LAST-a3LS-2LS-3LS-4LS-5N35-1Zhou (0d)Zhou (10d)Zhou (30d)Cast FitPbTe
The
rmop
ower
(µ
V/K
)
Temperature (K)
Tellurex n-type hot pressed (Ag0.86
Pb22
SbTe20
)
0
10
20
30
40
300 400 500 600 700 800
HL-LAST-a2HL-LAST-a3LS-2LS-3LS-4LS-5N35-1Zhou (0d)Zhou (10d)Zhou (30d)Cast FitPbTe
Pow
er F
acto
r (µ
W/c
m·K
2 )
Temperature (K)
Tellurex n-type hot pressed (Ag0.86
Pb22
SbTe20
)

24
Figure 3.7 Thermal conductivity, , measured by the Kanatzidis group at Northwestern University and
figure of merit, ZT = 2T/, for hot pressed samples of Ag0.86Pb22SbTe20 fabricated by Tellurex Corp. Samples LS-2, LS-3, LS-4, and LS-5 were annealed at 400ºC for 6, 12, 18, and 24 days respectively. For reference, data for PbTe with 0.03% PbI2 (mol %) [9], for cast Ag0.86Pb19SbTe20 [
10], and for Ag0.8Pb22.5SbTe20 fabricated by Zhou, et al. [17] are also shown.
Figure 3.8 Increase in ZT for Ag0.8Pb22.5SbTe20 samples mechanical alloyed, powder processed, and
pulsed electric current sintered. Annealing at 400ºC for 30 days, significantly increased the ZT of these samples – primarily through a reduction in the thermal conductivity [9,11,12,13,14,15,17].
During a funding interruption period, Tellurex Corporation continued n-type LAST research and development (using internal Tellurex funding) investigating additional adjustments in the composition of the samples. Measurement results for these Ag0.86Pb19+xSbTe20 samples are shown in Figure 3.9.
0
0.5
1
1.5
2
400 600 800 1000 1200
ZT
Temperature (K)
Bi2Te
3-xSe
x
Ag0.86
Pb18
SbTe20
(Cast)
PbTe
CoSb3
La2Te
3
SiGe
PbTe-PbS(8%)
n-type
Ba0.30
Ni0.05
Co3.95
Sb12
Mg2Si
0.6Sn
0.4
Mg2Si
0.4Sn
0.6
Ba0.08
Yb0.09
Co4Sb
12Ag0.8
Pb22.5
SbTe20
(HP 30d anneal)(HP 0d anneal)
TellurexAg
0.86Pb
19SbTe
20

25
Figure 3.9 Measured electrical conductivity, , thermopower, , and the power factor, PF = 2, for hot pressed samples of Ag0.86Pb22SbTe20 fabricated by Tellurex Corp. For reference, data for PbTe with 0.03% PbI2 (mol %) [9], for cast Ag0.86Pb19SbTe20 [
10], and for Ag0.8Pb22.5SbTe20 fabricated by Zhou, et al. [17] are also shown.
The same processing conditions and sample composition were used for samples sent to the Kanatzidis group at Northwestern University for thermal conductivity measurements. The results used in calculating the ZT of these samples is shown in Figure 3.10.
0
200
400
600
800
1000
300 400 500 600 700 800
N36-#1a
N36-#1b
N37-2a
N37-2b
N37-2c
Zhou (0d)
Zhou (10d)
Zhou (30d)
Cast LAST
PbTe
EC Fit
Ele
ctri
cal C
ondu
ctiv
ity
(S/c
m)
Temperature (K)
Tellurex n-type hot pressed (Ag0.86
Pb19+x
SbTe20
)
-350
-300
-250
-200
-150
-100
-50
300 400 500 600 700 800
N36-#1a
N36-#1b
N37-2a
N37-2b
N37-2c
Zhou (0d)
Zhou (10d)
Zhou (30d)
Cast LAST
PbTe
TEP Fit
The
rmop
ower
(µ
V/K
)
Temperature (K)
Tellurex n-type hot pressed (Ag0.86
Pb19+x
SbTe20
)
0
5
10
15
20
25
30
35
300 400 500 600 700 800
N36-#1a
N36-#1b
N37-2a
N37-2b
N37-2c
Zhou (0d)
Zhou (10d)
Zhou (30d)
Cast LAST
PbTe
PF Fit
Pow
er F
acto
r (µ
W/c
m·K
2 )
Temperature (K)
Tellurex n-type hot pressed (Ag0.86
Pb19+x
SbTe20
)

26
Figure 3.10 Thermal conductivity, , measured by the Kanatzidis group at Northwestern University and figure of merit, ZT = 2T/, for hot pressed samples of Ag0.86Pb19+xSbTe20 fabricated by Tellurex Corp. For reference, data for PbTe with 0.03% PbI2 (mol %) [9], for cast Ag0.86Pb19SbTe20 [
10], and for Ag0.8Pb22.5SbTe20 fabricated by Zhou, et al. [17] are also shown. Figure of merit, ZT, for these and other high performance materials are also shown for comparison.
Device analyses simulated the first section performance of our dual-section TEG system (shown in Figures 8.1 and 8.2) and analyzed per couple costs for various n-type and p-type TE material combinations (shown in Figures 3.2, 3.4, 3.8, 3.10) segmented with high-performance Bi2Te3 – alloys from Tellurex.
Table 3.4 shows the efficiency and cost analysis for these various material combinations. The couple cost results include all materials used in the couple and incorporate the different couple sizing shown in Table 3.4 into the analysis results. Table 3.4 also includes the various references for the material properties, Seebeck coefficient, electrical conductivity and thermal conductivity, as function of temperature used in the TE design performance analysis. Device modeling of segmented leg structures was done using a one dimensional iterative technique [18]. Equation fits to the electrical
0.6
0.8
1
1.2
1.4
1.6
1.8
2
2.2
300 400 500 600 700 800
N37-8N37-38N37-39-1N37-39-2Zhou (0d)Zhou (10d)Zhou (30d)Cast FitTC Fit
The
rmal
Con
duct
ivity
(W
/m·K
)
Temperature (K)
Tellurex n-type hot pressed Ag0.86
Pb19+x
SbTe20
0
0.2
0.4
0.6
0.8
1
1.2
1.4
1.6
300 400 500 600 700 800
N37-2aN37-2bN37-2cZhou (0d)Zhou (10d)Zhou (30d)Cast LASTPbTeZT Fit
ZT
Temperature (K)
Tellurex n-type hot pressed (Ag0.86
Pb19+x
SbTe20
)
0
0.5
1
1.5
2
400 600 800 1000 1200
ZT
Temperature (K)
Bi2Te
3-xSe
x
Ag0.86
Pb18
SbTe20
(Cast)
PbTe
CoSb3
La2Te
3
SiGe
PbTe-PbS(8%)
n-type
Ba0.30
Ni0.05
Co3.95
Sb12
Mg2Si
0.6Sn
0.4
Mg2Si
0.4Sn
0.6
Ba0.08
Yb0.09
Co4Sb
12Ag0.8
Pb22.5
SbTe20
(HP 30d anneal)
TellurexAg
0.86Pb
19+xSbTe
20
312K
670K
Bi2Te3-xSex
N-typehot
BixSb2-xTe3
P-typehot
Ln1
Ln2
Lp1
Lp2
TjnTjp 5 (mm)

27
conductivity, thermopower, and thermal conductivity were determined, and used in the modeling effort [19]. The first-section segmented structure shown above was used for the modeling results listed in Table 3.4.
The cost analysis in Table 3.4 in square brackets [ ] is based on yield values provided by Tellurex of 80% for LAST, LASTT under the Tellurex near-final-shape processing route, and 20% for other processing routes requiring cutting of the cast ingots or pressed pucks (20% yield for cast LAST, cast LASTT, PbTe, and TAGS-85). Yield for BaxYbyCo4Sb12 was provided by Dr. Harold Schock to be greater than 90%.
Table 3.4 Table of TE module modeling results for segmented unicouples and a hot side temperature of
670K and cold side temperature of 312 K. Cost analysis is based on material costs listed at Alfa Aesar [20]. Cast LAST, Cast LASTT, Tellurex LAST, Tellurex LASTT properties measured at Michigan State University and Northwestern University.
Case # / N-type Hot Case # / P-type Hot
Tjn (K)
Tjp (K)
Ln1 (mm)
Lp1 (mm)
An/ApnQ
(W/cm2)pQ
(W/cm2)
(%)
~ $ per unicouple (2mm 2mm for p-leg) [w/ yield]
1. Best Cast LAST 1. TAGS-852 390 470 1.7 2.1 1.64 10.8 15.2 12.4 $0.699 [$2.647]
2. Best Cast LAST 2. Best Cast LASTT
390 490 1.7 2.6 1.45 10.8 13.2 12.1 $0.298 [$1.117]
3. Zhou-based LAST 30d anneal 17
3. TAGS-852 440 460 2.5 2 1.42 12.1 14.6 11.8 $0.679 [$3.009]
4. BaxYbyCo4Sb128 4. TAGS-852 430 470 1.3 2 0.62 23 14.8 11.7 $0.715
[$2.594]5. Best cast LAST 5. Best
Tellurex LASTT
390 490 1.7 2.6 1.35 10.8 13.1 11.5 $0.287 [$0.747]
6. Zhou-based LAST 30d anneal Error!
Bookmark not defined.
6. Cast LASTT 440 490 2.6 2.6 1.4 11.8 13.3 11.5 $0.280 [$0.959]
7. PbTe 9 7. TAGS-852 450 470 1.8 2.1 0.86 18.6 14.5 11.4 $0.607 [$2.801]
8. Zhou-based LAST - 30d anneal 17
8. Best Tellurex LASTT
440 490 2.6 2.6 1.23 11.8 12.7 10.9 $0.264 [$0.576]
9. Best Tellurex LAST
9. TAGS-852 440 470 2.2 2.1 1.67 12.6 14.8 10.9 $0.694 [$2.638]
10. Avg. Cast LAST 10. Avg. Cast LASTT
420 470 2 2.6 1.36 11.8 13 10.5 $0.284 [$1.034]
11. PbTe 9 11. Best Tellurex LASTT
450 490 1.9 2.6 0.72 17.9 12.7 10.5 $0.212 [$0.787]
12. Best Tellurex LAST
12. Best Tellurex LASTT
440 490 2.2 2.6 1.41 12.4 12.7 10.1 $0.287 [$0.333]
13. PbTe 9 13. PbTe 1 450 490 1.9 2.3 0.59 17.9 13.6 9.99 $0.164 [$0.782]
14. Avg. Tellurex LAST
14. Avg. Tellurex LASTT
460 490 2.5 2.5 1.34 13 12.9 9.5 $0.277 [$0.321]
15. BaxYbyCo4Sb12 Skutterudites 8
15. Best Tellurex LASTT
440 490 1.3 2.6 0.53 22.3 12.7 10.7 $0.294 [$0.332]
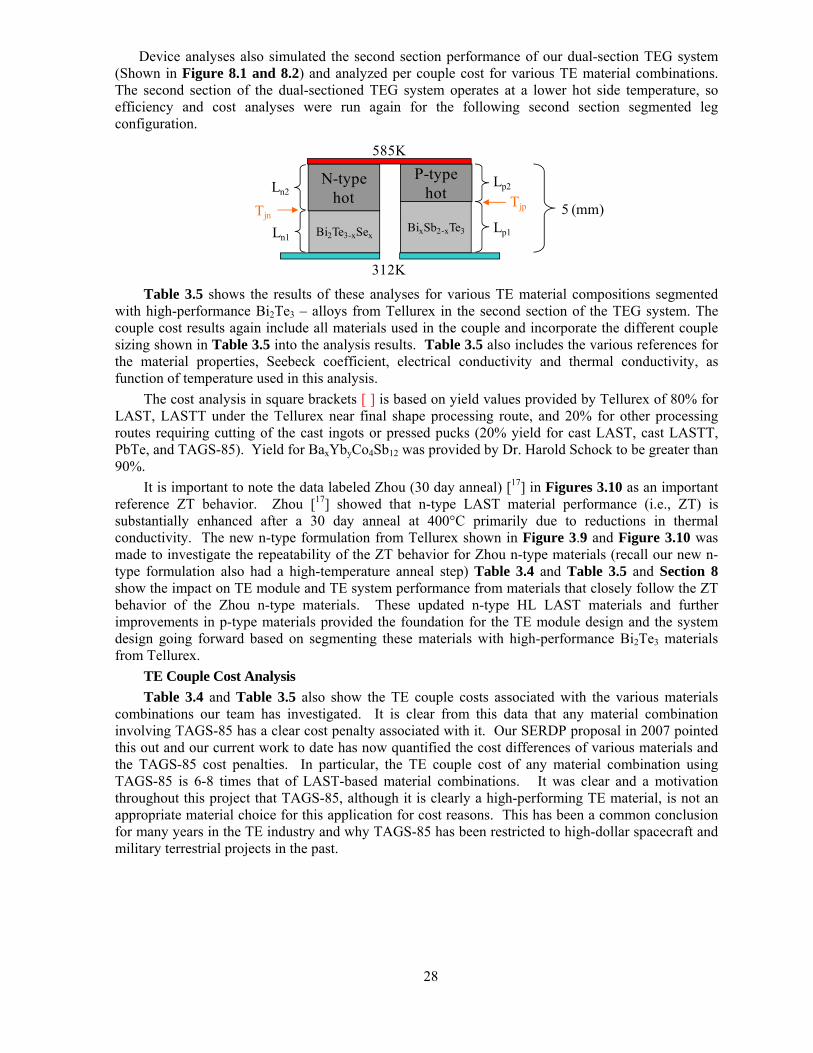
28
Device analyses also simulated the second section performance of our dual-section TEG system (Shown in Figure 8.1 and 8.2) and analyzed per couple cost for various TE material combinations. The second section of the dual-sectioned TEG system operates at a lower hot side temperature, so efficiency and cost analyses were run again for the following second section segmented leg configuration.
Table 3.5 shows the results of these analyses for various TE material compositions segmented
with high-performance Bi2Te3 – alloys from Tellurex in the second section of the TEG system. The couple cost results again include all materials used in the couple and incorporate the different couple sizing shown in Table 3.5 into the analysis results. Table 3.5 also includes the various references for the material properties, Seebeck coefficient, electrical conductivity and thermal conductivity, as function of temperature used in this analysis.
The cost analysis in square brackets [ ] is based on yield values provided by Tellurex of 80% for LAST, LASTT under the Tellurex near final shape processing route, and 20% for other processing routes requiring cutting of the cast ingots or pressed pucks (20% yield for cast LAST, cast LASTT, PbTe, and TAGS-85). Yield for BaxYbyCo4Sb12 was provided by Dr. Harold Schock to be greater than 90%.
It is important to note the data labeled Zhou (30 day anneal) [17] in Figures 3.10 as an important reference ZT behavior. Zhou [17] showed that n-type LAST material performance (i.e., ZT) is substantially enhanced after a 30 day anneal at 400°C primarily due to reductions in thermal conductivity. The new n-type formulation from Tellurex shown in Figure 3.9 and Figure 3.10 was made to investigate the repeatability of the ZT behavior for Zhou n-type materials (recall our new n-type formulation also had a high-temperature anneal step) Table 3.4 and Table 3.5 and Section 8 show the impact on TE module and TE system performance from materials that closely follow the ZT behavior of the Zhou n-type materials. These updated n-type HL LAST materials and further improvements in p-type materials provided the foundation for the TE module design and the system design going forward based on segmenting these materials with high-performance Bi2Te3 materials from Tellurex.
TE Couple Cost Analysis
Table 3.4 and Table 3.5 also show the TE couple costs associated with the various materials combinations our team has investigated. It is clear from this data that any material combination involving TAGS-85 has a clear cost penalty associated with it. Our SERDP proposal in 2007 pointed this out and our current work to date has now quantified the cost differences of various materials and the TAGS-85 cost penalties. In particular, the TE couple cost of any material combination using TAGS-85 is 6-8 times that of LAST-based material combinations. It was clear and a motivation throughout this project that TAGS-85, although it is clearly a high-performing TE material, is not an appropriate material choice for this application for cost reasons. This has been a common conclusion for many years in the TE industry and why TAGS-85 has been restricted to high-dollar spacecraft and military terrestrial projects in the past.
Tjn
312K
585K
Bi2Te3-xSex
N-typehot
BixSb2-xTe3
P-typehot
Ln1
Ln2
Lp1
Lp2
Tjp 5 (mm)

29
Table 3.5 Table of TE module modeling results for segmented unicouples for 585K hot side temperature and cold side temperature of 312 K. Cost analysis is based on material costs listed at Alfa Aesar [20].
Case # / N-type Hot Case # / P-type Hot Tjn (K)
Tjp (K)
Ln1 (mm)
Lp1 (mm)
An/Ap nQ
(W/cm2) pQ
(W/cm2)
(%)
~ $ per unicouple (2mm
2mm for p-leg) [w/ yield]
16. Best cast LAST 16. TAGS-852 390 470 2 2.8 1.26 9 10.6 10.1 $0.554 [$2.030]
17. Best cast LAST 17. Best Cast LASTT
390 490 2 3.3 1.25 9 9.6 9.82 $0.263 [$0.878]
18. Best cast LAST 18. Best Tellurex LASTT
390 490 2 3.5 1.11 9 9.6 9.47 $0.245 [$0.586]
19. BaxYbyCo4Sb12
8 19. TAGS-852 430 470 1.8 2.8 0.68 16.2 10.6 9.41 $0.598
[$1.954] 20. Zhou-based LAST 30d anneal 17
20. TAGS-852 440 470 3.1 2.8 1.34 9.5 10.5 9.28 $0.548 [$2.252]
21. PbTe 9 21. TAGS-852 450 470 2.4 2.8 0.75 14.2 10.6 9.2 $0.493 [$2.143]
22. Zhou-based LAST 30d anneal 17
22. Best cast LASTT
440 480 3.1 3.4 1.28 9.5 9.6 9.05 $0.251 [$0.722]
23. Best Tellurex LAST
23. TAGS-852. 440 470 2.8 2.8 1.34 9.9 10.6 8.82 $0.552 [$2.023]
24. Avg. Cast LAST
24. Avg. Cast LASTT
410 490 2.4 3.4 1.19 9.5 10.1 8.77 $0.250 [$0.787]
25. Zhou-based LAST
30d anneal 4 25. Best Tellurex LASTT
440 490 3.1 3.4 1.16 9.5 9.9 8.76 $0.239 [$0.471]
26. PbTe 9 26. Best Tellurex LASTT
450 490 2.4 3.4 0.69 13.9 9.9 8.64 $0.195 [$0.609]
27. PbTe 9 27. PbTe 1 450 490 2.4 3 0.67 13.9 10.8 8.61 $0.170 [$0.666]
28. Best Tellurex LAST
28. Best Tellurex LASTT
440 490 2.7 3.3 1.22 10 9.9 8.34 $0.251 [$0.284]
29. Avg. Tellurex LAST
29. Avg. Tellurex LASTT
460 490 3.2 2.5 1.16 10.2 9.5 7.97 $0.252 [$0.287]
30. BaxYbyCo4Sb12
8 30. Best Tellurex LASTT
440 490 1.9 3.4 0.58 15.8 9.6 8.8 $0.277 [$0.306]
GoNoGo Decision Period (July – November 2009)
The p-type LASTT materials, composition, and processing were kept constant during this period, while the project team focused on the challenges of improving the n-type LAST materials. Tellurex and MSU ultimately developed and tested “refined” n-type HL LAST materials (Ag0.86Pb19+xSbTe20) that have very beneficial temperature-dependent TE properties over the anticipated TE device temperature range (312 K to 670 K). This led to critically important segmented TE couple designs that employ high-performance n-type and p-type LAST / LASTT materials segmented with high-performance bismuth telluride. The project team now understands and can manipulate LAST / LASTT thermoelectric material properties in ways that have never been done before. The project team's findings are that the n-type LAST materials are certainly a complex material set whose thermoelectric (TE) properties can be tunable to tailor the design through a number of compositional and processing parameters (i.e., knobs) that can significantly affect its temperature-dependent TE material properties. The TE properties can be quite sensitive to some of these "knobs" and it is now understood much

30
better how to control the properties in n-type LAST materials. It is all still n-type LAST, but just different versions that can be exploited in TE module design activities. This is something that was not understood and appreciated prior to April 2009. Samples with properties that peak at higher temperatures (> 700K), samples with properties that peak at lower temperatures (< 500K), and samples that exhibit less temperature sensitive properties (smaller variation in power factor over the 350K to 700K temperature range) were fabricated and tested by paying close attention to the starting material purity, and by adjusting the lead concentration. Because these behaviors and the impact of the compositional and processing knobs are understood much better, the project made good progress on the TE module designs during the Go/NoGo Decision period (July – November 2009). These newer “refined” n-type HL LAST material versions (Ag0.86Pb19+xSbTe20) also exhibited much better thermal fatigue characteristics than previous n-type LAST materials shown in Table 3.1 prior to April 2009 (See Section 3).
During the Go/NoGo Decision period, seventeen p-type, and 39 n-type samples were measured for temperature dependent electrical conductivity and thermopower. Four p-type samples and 9 n-type samples were sent to the Kanatzidis group at Northwestern or to the Thermo-Physical Research Lab at Purdue for thermal conductivity measurements. Figure 3.1 shows data for p-type samples where the power factor indicates two distinct groups of samples. The higher power factor group includes samples P21-22-2a, P21-34a, P21-35a, and P40-4. The composition and processing used for materials in the fabrication of modules follows that used for sample P40-4, and modeling efforts are based on fits to the properties of this sample as indicated in the electrical conductivity, thermopower, and power factor plots. In addition to indications of the repeatability in material properties, these plots are used to indicate the relationship between the fits used in modeling, and the actual data measured. Thermal conductivity data were taken on similar samples (P25-1, and P25-2) with the fit used for modeling also shown in Figure 3.1. These fits are listed below:
The process for fabrication of the p-type LASTT samples has shown good repeatability as indicated by the power factor plot in Figure 3.1. P-type materials used in the module fabrication were of the same composition and processing as those in the P40 series.
Significant effort went into the fabrication of the “refined” n-type HL LAST materials (Ag0.86Pb19+xSbTe20) during the Go/NoGo Decision period. It has been found that processing and composition adjustments can lead to three distinct behaviors in the power factors of Figures 3.3, 3.5, 3.6 and 3.9. Samples that exhibit a near zero power factor at 300K and then rapidly increase as temperature increases such as the Ag0.86Pb22SbTe20 HL-LAST samples in Figure 3.6 show the largest power factor (near 26 µW/cm-K2) at 700K of all samples measured. Samples that show a broad maximum in the power factor, such as with sample N32-1 (Ag0.86Pb19SbTe20 in Figure 3.3), are also possible but their power factors are relatively low. Samples, such as N36-1b and N-37-2b (Ag0.86Pb19+xSbTe20 shown in Figure 3.9), can also be seen that show a weak temperature dependence in their power factor. These samples begin at 300K with their highest power factor (near 20 µW/cm-K2), then reach a gradual minima near 430K followed by a subtle maxima near 600K. Although there are gradual minima and maxima throughout the 300 – 700 K temperature range, the power factor is near 20 µW/cm-K2. These n-type LAST materials have superior power factors in some temperature ranges (300-550 K) to the materials by Zhou [17] discussed above. Such tunability of the properties can aid in the design of modules for specific applications. In particular, the project team believes it is now possible and our TE modeling supports that a 10% TE module can be achieved by taking advantage of these different temperature-dependent behaviors in a triple-segmented n-type element leg in the future.

31
For the purposes of fabricating our Go/NoGo Decision TE modules Tellurex focused on fabricating TE modules with N36-1b and N37-2b LAST materials (i.e., “refined” HL LAST - Ag0.86Pb19+xSbTe20). The TE module design analysis in section VI shows our Go/NoGo TE modules using these type of n-type LAST materials segmented with n-type Bismuth Telluride, and our p-type LASTT materials segmented with p-type Bismuth Telluride, can achieve 9% conversion efficiency accounting for contact resistance losses. Phase 2 plans would have taken advantage of the HL-LAST enhanced performance at higher temperatures (600-700 K) to triple-segment the n-type leg (using HL LAST a2 (Ag0.86Pb22SbTe20), N36-1b (Ag0.86Pb19+xSbTe20), and bismuth telluride) and thereby achieve the 10% module efficiency target. The project team did not have time and budget to work out the fabrication details, particularly interface designs, of this triple-segmented n-type LAST leg design in the time available in our Go/NoGo Decision period testing. However, the project team believes this could have been completely addressed and solved in Phase 2 of the project.
Properties of N37-2b used for module/couple modeling purposes discussed in Section 6, have the following fits to the experimental data:
4. LAST / LASTT Thermal Fatigue/Mechanical Strength Results & Characterizations
4.1 Thermal Fatigue / Mechanical Strength Investigations
Mechanical Property Characterization
The thermal fatigue damage induced in the specimens included in this study was characterized by two methods, namely elastic modulus and fracture strength measurements. The elastic modulus measurements allow one to non-destructively monitor the accumulation of thermal fatigue damage in the specimen. Also, the Young’s modulus and Poisson’s ratio are required in order to construct a stiffness matrix for the finite element method evaluation of stress and strain [Kaliakin, 21].
The thermal fatigue induced decrement in elastic modulus is a function of an “ensemble average” of the microcrack damage, but is biased toward the larger cracks by the third moment of the crack radius, <a3> that appears in the crack damage parameter [Laws and Brockenbrough [22]; Budiansky and O’Connell [23]. Laws and Brockenbrough [22] and Budiansky and O’Connell [23] have modeled the decrement in Young’s modulus that occurs with an accumulation of microcrack damage, where
f1EE 0 (4.1)
Where E = the Young’s modulus of the microcracked body, E0 is the Young’s modulus of the uncracked material, f() is a function of the microcrack alignment and the Poisson’s ratio, , and is the crack damage parameter [19]. The crack damage parameter, , is in turn given by
P
A2
2
(4.2)
Where, 2A is the mean square of the crack surface area, P is the mean crack perimeter, and is the volumetric crack number density (the number of cracks per unit volume). If the assumption is

32
made that the microcracks are planar and circular with all cracks having the same radius a, then the
expression for (equation 4.2) simplifies to 3a .
Microcracks can also lead to a decrement in fracture strength. For unreinforced, brittle materials the strength is a function of the largest flaw size. In this study, the “Ring-on-Ring” (ROR) or equibiaxial configuration [ASTM C 1499, [24] was selected for the strength testing, The ring-on-ring configuration decreases the likelihood of failures from flaws on the edge of the specimen, since the stress intensity factor tends to be high for sharp corners, specimens tested in uniaxial bend tend to fail from edge flaws. However, for the ring on ring configuration, the stresses are lower along the specimen circumference, making failures from edge flaws less likely. If the circumferential defects such as porosity or cracks induced by processing are sufficiently large, then the ROR specimens still fracture from the edge, resulting in an invalid fracture [ASTM C 1499, 24 ].
Thus, while each of the two mechanical characterization techniques employed in this study, namely (i) measurement of elastic moduli and (ii) determination of the fracture strength are sensitive to microcrack and macrocrack damage, the elastic measurements are sensitive to essentially the entire ensemble of flaws in the specimen while fracture strength is determined by the largest flaw. If, as will be discussed below, the Young’s modulus and Poisson’s ratio is relatively constant as a function of thermal cycling, then that implies the average microcrack “size” and number density did not change appreciably as a function of the thermal fatigue. However, a change (decrease) in strength is a function of growth of the largest flaw in a brittle material.
The thermal stability study included two types of testing activities: (1) the thermal fatigue/fracture study which involves biaxial fracture testing of disk-shaped specimens and (2) thermal fatigue/elasticity studies, in which the Young’s modulus and Poisson’s ratio of thermally fatigued plate-shaped specimens is measured by Resonant Ultrasound Spectroscopy (RUS) as a function of the cumulative number of thermal fatigue cycles. Early in the project both the thermal fatigue/fracture study and the thermal fatigue/elasticity study included p-type LASTT, n-type LAST and undoped PbTe specimens. Table 3.1 shows the p-type and n-type compositions during this early period up to March 2009. The materials will be discussed first. The reformulated, higher-lead version of n-type LAST designated “refined” HL LAST was developed independently by Tellurex Corporation during a non-SERDP-funded period and introduced into this SERDP program for thermal fatigue/mechanical strength characterization after June 2009.
Thermal fatigue/fracture studies
Up to early March 2009, Tellurex had supplied 83 p-type LASTT disks, 60 undoped PbTe disks, and 30 n-type LAST disks with compositions shown in Table 3.1. The biaxial fracture results obtained for these samples are summarized in Table 4.1. For each fractured specimen, the crack pattern resulting from the biaxial, ring-on-ring fracture was compared to the crack patterns specified in ASTM C 1499 [24] to determine if the particular test was a valid fracture test. In Table 4.1, the number of valid tests, Nvalid, and the total number of tests, Ntotal, are listed. As examples, fractures that result from edge flaws or pre-existing cracks can result in invalid tests on a given specimen [24, ASTM C 1499].
Most of the LASTT specimens (Ag0.9Pb9Sn9Sb0.6Te20 compositions) up to the March 2009 timeframe had a fracture strength of roughly 32 + 5 MPa in ring-on-ring (ROR) fracture testing ( Table 4.1), which is comparable to the 30 MPa ROR strength measured for commercially available Bi2Te3 Wereszczak 2009[25]. Wereszczak et al [25] determined the ROR strength of commercial Bi2Te3 (Marlow Industries, Dallas, TX) to be 30 MPa for specimens with faces cut parallel to the cylindrical axis and 50 MPa for specimens with faces oriented perpendicular to the billet axis. Ten of these LASTT specimens had some surface anomalies, with 5 of the 10 specimens received showing blistering on the specimen surfaces following 90 thermal cycles. These blisters ranged from about 5 mm to 1 cm in diameter. However, none of the previously tested LASTT specimens showed blistering. Tellurex has noted that blistering upon annealing is a problem that they have observed and overcome in the past. Blistering continued to occur AFTER the March, 2009 timeframe and was observed in some specimens during entire period of the thermal fatigue testing of the p-type material. In total, blistering occurred in approximately 14% of all p-type specimens (about

33
one specimen out of seven) that were subjected to thermal fatigue testing. The blistering is likely caused by oxygen/oxide contamination. Tellurex subsequently took steps to remove all sources of oxygen and oxide formation throughout their material processing.
The fracture strength of both the undoped PbTe specimens and the n-type LAST specimens (Ag0.86Pb19SbTe20) in these early studies were lower than that of the LASTT specimens ( Table 4.1). For these LAST specimens, the mean fracture strength of the as-received specimens was 17 MPa, with considerable scatter in the strength data (as illustrated by a standard deviation of 12 MPa). Refined HL LAST composition and (Ag0.86Pb19+xSbTe20) processing produced later in Phase 1 work helped to improve these n-type strength properties. These refined n-type HL LAST compositions are discussed later in this report.
Table 4.1 Mean biaxial fracture strength of specimens tested to date in this study (4/07/09).
Material Specimen Condition Test Nvalid/Ntotal Strength (Mpa) LASTT P14 As-received BOR 6/10 46 4 P15 Polished BOR 6/10 58 8 P15 As-received ROR 9/10 32 5 P15 30 thermal cycles ROR 9/10 30 5 P25 90 thermal cycles ROR 4/10 17 + 7 PbTe PbTe1 As-received ROR 10/10 19 6 PbTe1 30 thermal cycles ROR 16/20 20 3 PbTe2 30 thermal cycles ROR 10/10 15 4 PbTe2 Annealed 400oC ROR 7/10 22 3 PbTe2 Annealed 500oC ROR 10/10 15 6 LAST N27/N28 As-received ROR 12/17 17 12 N31 30 thermal cycles ROR 7/10 15 11
Tellurex also supplied 10 plate-shaped specimens of the p-type LASTT (Ag0.9Pb9Sn9Sb0.6Te20 compositions), undoped PbTe and n-type LAST (Ag0.86Pb19SbTe20 composition) disks identified in Table 3.1 by March 2009. Four plate-shaped specimens each of the LASTT, undoped PbTe and LAST underwent a total of 200 thermal fatigue cycles, with the Young’s modulus and Poisson’s ratio measured in the as-received state and following every 10 thermal cycles. Of the remaining six LASTT plate specimens, two specimens were used for microstructural studies, one specimen was sent to Northwestern University (through Professor Hogan) for thermal conductivity testing and the remaining two LASTT plate specimens were not usable for elasticity studies due to cracks in the as-received specimens. Thermal fatigue/elasticity testing on the LAST and undoped PbTe specimens was suspended because of the low strength values of these early n-type LAST specimens reported in Table 4.1, pending arrival of their formulated HL LAST specimens later in Phase 1.
For the p-type LASTT (Ag0.9Pb9Sn9Sb0.6Te20 compositions), the Young’s modulus, E (Figure 4.1) and Poisson’s ratio, (Figure 4.2) are relatively constant as a function of the cumulative number of thermal cycles, N, which indicates that for the LASTT, little microcrack damage accumulates as a function of the thermal fatigue cycling [26, Case 2002]. For the n-type LAST (Ag0.86Pb19SbTe20 composition), two specimens (N28-12 and N28-14) showed a constant Young’s modulus and Poisson’s ratio as a function of the cumulative number of thermal cycles (Figures 4.3 and IV.4, respectively), but an additional two LAST specimens showed a drop-off in E and with thermal cycling. The undoped PbTe specimens showed similar thermal cycling behavior in E and , although two of PbTe samples did show some fall off in E and indicating microcrack development (Figures 4.5 and 4.6). Thus, although the materials included in this study are relatively weak, and although the early n-type LAST materials strength data shows extensive scatter, the exposure to thermal fatigue conditions induced little additional damage in the later specimens (Ag0.86Pb19SbTe20 composition). Of course, given the low strength and high thermal expansion coefficients of the PbTe-based materials (18-20 x 10-6 / K - Our Scientific Advisory Board review), the concern is the specimens may be

34
sensitive to damage induced by thermal expansion mismatch stresses that may arise, for example, due to interconnections within the thermoelectric module. However, stresses that develop within the system upon heating are very dependent on the TE module, the interconnection materials, the TEG design configuration, and what design steps are taken to mitigate thermal expansion induced stresses. For example, our system design is incorporating a “floating” hot-side design using AlN coatings and GRAFOILTM layers that allow small amounts of movement on the TE hot-sides to alleviate module and element stresses. In Section 5 below, the compression and thermal-expansion structural analyses performed at PNNL are presented and discussed.
Figure 4.1 Young’s Modulus for LASTT Samples Figure 4.2 Poisson’s Ratio LASTT Samples
Figure 4.3 Young’s Modulus for LAST Samples Figure 4.4 Poisson’s Ratio for LAST Samples
0 50 100 150 20025
30
35
40
45
50
55
P15-14 (fractured after 160 cycles)
P15-16 P15-17
(fractured after 180 cycles) P15-19Y
oung
's m
odu
lus
(GP
a)
Number of thermal cycles0 50 100 150 200
0.0
0.1
0.2
0.3
P15-14 (fractured after 160 cycles)
P15-16 P15-17
(fractured after 180 cycles) P15-19P
oiss
on's
rat
ioNumber of thermal cycles
0 50 100 150 20025
30
35
40
45
50
55
N28-11 N28-12 N28-14 N28-16
You
ng's
mod
ulus
(G
Pa
)
Number of thermal cycles
0 50 100 150 2000.0
0.1
0.2
0.3
N28-11 N28-12 N28-14 N28-16
Poi
sson
's r
atio
Number of thermal cycles
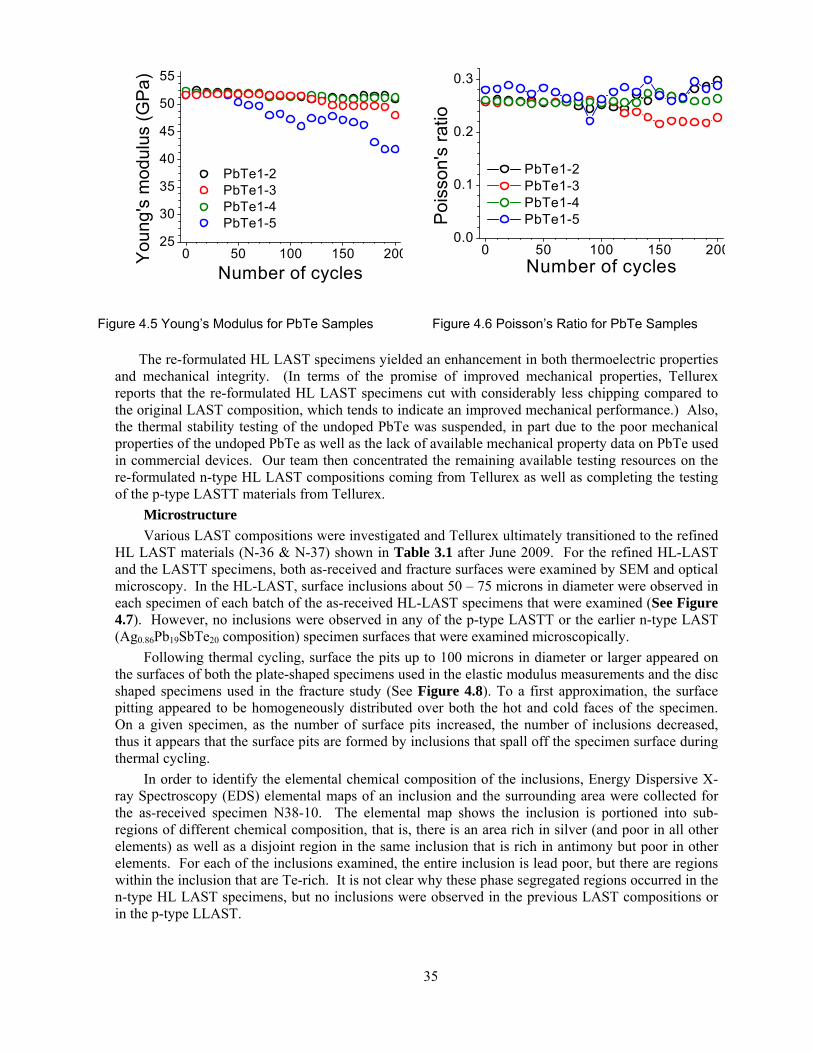
35
0 50 100 150 20025
30
35
40
45
50
55
PbTe1-2 PbTe1-3 PbTe1-4 PbTe1-5
Yo
un
g's
mo
du
lus
(GP
a)
Number of cycles
0 50 100 150 2000.0
0.1
0.2
0.3
PbTe1-2 PbTe1-3 PbTe1-4 PbTe1-5P
oiss
on's
rat
io
Number of cycles
Figure 4.5 Young’s Modulus for PbTe Samples Figure 4.6 Poisson’s Ratio for PbTe Samples
The re-formulated HL LAST specimens yielded an enhancement in both thermoelectric properties and mechanical integrity. (In terms of the promise of improved mechanical properties, Tellurex reports that the re-formulated HL LAST specimens cut with considerably less chipping compared to the original LAST composition, which tends to indicate an improved mechanical performance.) Also, the thermal stability testing of the undoped PbTe was suspended, in part due to the poor mechanical properties of the undoped PbTe as well as the lack of available mechanical property data on PbTe used in commercial devices. Our team then concentrated the remaining available testing resources on the re-formulated n-type HL LAST compositions coming from Tellurex as well as completing the testing of the p-type LASTT materials from Tellurex.
Microstructure
Various LAST compositions were investigated and Tellurex ultimately transitioned to the refined HL LAST materials (N-36 & N-37) shown in Table 3.1 after June 2009. For the refined HL-LAST and the LASTT specimens, both as-received and fracture surfaces were examined by SEM and optical microscopy. In the HL-LAST, surface inclusions about 50 – 75 microns in diameter were observed in each specimen of each batch of the as-received HL-LAST specimens that were examined (See Figure 4.7). However, no inclusions were observed in any of the p-type LASTT or the earlier n-type LAST (Ag0.86Pb19SbTe20 composition) specimen surfaces that were examined microscopically.
Following thermal cycling, surface the pits up to 100 microns in diameter or larger appeared on the surfaces of both the plate-shaped specimens used in the elastic modulus measurements and the disc shaped specimens used in the fracture study (See Figure 4.8). To a first approximation, the surface pitting appeared to be homogeneously distributed over both the hot and cold faces of the specimen. On a given specimen, as the number of surface pits increased, the number of inclusions decreased, thus it appears that the surface pits are formed by inclusions that spall off the specimen surface during thermal cycling.
In order to identify the elemental chemical composition of the inclusions, Energy Dispersive X-ray Spectroscopy (EDS) elemental maps of an inclusion and the surrounding area were collected for the as-received specimen N38-10. The elemental map shows the inclusion is portioned into sub-regions of different chemical composition, that is, there is an area rich in silver (and poor in all other elements) as well as a disjoint region in the same inclusion that is rich in antimony but poor in other elements. For each of the inclusions examined, the entire inclusion is lead poor, but there are regions within the inclusion that are Te-rich. It is not clear why these phase segregated regions occurred in the n-type HL LAST specimens, but no inclusions were observed in the previous LAST compositions or in the p-type LLAST.

36
Figure 4.7 (1) SEM backscattered electron image of inclusions in as-received (not thermally cycled)
refined-LAST specimen N38-10 of surface inclusions (Red ovals). As was the case for other refined-LAST specimens, no surface pits are evident on the specimen surface.
Figure 4.8 (2) SEM secondary electron images of surface pitting in HL-LAST specimen N38-9 after thermal cycling in the large specimen chamber for 150 cycles. The pits (Red circles) in this micrograph have an average diameter of about 150-200 microns. In additions, small, intact inclusions are visible on the surface that are up to approximately 50 microns across (Blue oval).
However, given that the phase-segregated regions occur, the differing composition within the inclusions likely lead to differing local thermal expansion coefficients. The thermal expansion coefficient of the inclusion would likely be different than that of the matrix. During heating and cooling, these differing thermal expansions would generate mechanical stresses. If the stresses are sufficiently high this could lead to cracking near the inclusion and subsequent spalling off of the inclusion to form the observed surface pits in thermally cycled refined-LAST.
In the thermally cycled HL LAST specimens that were examined, it appears that some smaller inclusions are still intact after thermal cycling. This is also consistent with microcracking due to thermal expansion mismatch, that is, for a given level of thermal expansion mismatch, there is a critical inclusion size below which microcracking is not induced by thermal expansion mismatch [Cleveland and Bradt, 20].
Specimen surface finish and impact
It is important to note that for all of the refined-LAST and LASTT specimens in this study, including all the specimens that were tested by either elasticity/thermal fatigue and fracture strength/thermal fatigue had specimen surfaces in the “as-received condition” (approximately 400 grit surface finish, as received from Tellurex). Typically for strength testing, specimen surfaces are polished to a mirror finish that corresponds to polishing with grit sizes of one micron or less. Fracture

37
testing earlier in this study indicated that if as-received LASTT specimens were polished to a mirror finish, there strength increased to about 40 – 50 MPa. However, when thermoelectric modules are fabricated commercially, due to considerations of time and expense, it is extremely unlikely that the surfaces of each thermoelectric leg would be polished to a mirror surface finish. Thus, the as-received specimen surface finish represents a more realistic surface condition for TE module fabrication rather than polishing to a mirror finish.
Elastic modulus measurements in LASTT and HL LAST specimens
Using the Resonant Ultrasound Spectroscopy (RUS) technique [Migliori and Sarrao,27 Ren et al., 28], the Young’s modulus and, E, Poisson’s ratio, , were determined for four plate-shaped specimens each of LASTT and refined-LAST. For all of the elasticity/thermal fatigue measurements of LASTT and refined-LAST included in this study, the thermal cycling was done in the small thermal chamber.
For LASTT, the four specimens included in the elasticity/thermal fatigue study were P15-14-17, and P15-19 (Figure 4.9). In Figure 4.9, the green horizontal lines in the Young’s modulus and Poisson’s ratio plots represent the mean of the zero thermal cycle values for all four specimens for Young’s modulus and Poisson’s ratio, respectively. The Young’s modulus and Poisson’s ratio of the p-type specimens decreased slightly as a function of thermal cycling (Figure 4.9), although two specimens failed prior to 200 thermal cycles, namely specimen P15-17 failed after 180 thermal cycles and P15-14 fractured after 160 thermal cycles. This was also shown in Figures 4.1 and 4.2.
As was the case for the p-type specimens, the Resonant Ultrasound Spectroscopy (RUS) technique was used to measure the Young’s modulus and, E, Poisson’s ratio, , for four plate-shaped HL LAST specimens cycled in the small thermal fatigue chamber (Figure 4.10). In Figure 4.10, the green horizontal lines in the E and plots represent the mean of the zero thermal cycle values for all four specimens for E and , respectively. E and for the n-type HL LAST specimens decreased only slightly with an increasing number of thermal fatigue cycles (Figure 4.10), similar to the E and for behavior for p-type LASTT (Figure 4.9). However, unlike the p-type elastic modulus/thermal fatigue specimens, none of the four HL LAST specimens failed during thermal cycling in the small thermal fatigue chamber (Figure 4.10).

38
0 50 100 150 20025
30
35
40
45
50
55
P15-14 (fractured after 160 cycles)
P15-16 P15-17
(fractured after 180 cycles) P15-19
You
ng's
mod
ulus
(G
Pa)
Number of thermal cycles
0 50 100 150 2000.0
0.1
0.2
0.3
P15-14 (fractured after 160 cycles)
P15-16 P15-17
(fractured after 180 cycles) P15-19
Poi
sson
's r
atio
Number of thermal cycles
Figure 4.9 Resonant Ultrasound Spectroscopy (RUS) measurements of the Young’s modulus and Poisson’s ratio as a function of the number of thermal fatigue cycles for p-type (LASTT) samples, cycled in the small thermal fatigue chamber.

39
0 50 100 150 20025
30
35
40
45
50
55
60
You
ng's
mod
ulus
(G
Pa)
Number of thermal cycles
N39-50 N39-53 N37-28 N37-29
0 50 100 150 2000.0
0.1
0.2
0.3
Poi
sson
's r
atio
Number of thermal cycles
N39-50 N39-53 N37-28 N37-29
Figure 4.10 Resonant Ultrasound Spectroscopy (RUS) measurements of the (a) Young’s modulus and
(b) Poisson’s ratio as a function of the number of thermal fatigue cycles for n-type (refined-LAST) samples thermally cycled in the small thermal fatigue chamber.
Fracture strength of as-received and thermally fatigued HL LAST and LASTT N-type HL LAST and p-type LASTT disc-shaped specimens were fractured using the ROR technique [ASTM C 1499,24] following thermal cycling in the large thermal fatigue chamber (Figures 4.11 - 4.14).

40
0 50 100 150 200
10
20
30
40
50
P15- As Received P28- As Received P15- 30 Cycles P28- 60 Cycles P25- 90 Cycles P28/32- 90 Cycles (redo) P26- 120 Cycles P32- 150 Cycles P28- 200 Cycles
Str
engt
h (M
Pa)
Number of Cycles (N)
Figure 4.11 Ring on Ring (ROR) fracture strength as a function of the number of thermal fatigue cycles for p-type LASTT cycled in the large thermal fatigue chamber. For the numbers in parentheses near the plotting symbols (i,j), the first number “i” indicates the number of valid fractures obtained and the second number “j” indicates the total number of specimens fractured for the given thermal shock treatment.
For the zero thermal cycle condition (the as-received specimens) a total of 20 specimens each of LAST and HL LAST were fractured in two groups of ten specimens each (Figures 4.11 – 4.14). The specimens that were thermally fatigued prior to fracture testing were placed in the large thermal fatigue chamber and cycled in groups of up to 10 specimens each for 30, 60, 90,120, 150, or 200 thermal cycles, except for the p-type LASTT specimens subjected to 90 thermal cycles. For the p-type LASTT specimens that underwent 90 thermal fatigue cycles, two groups of ten specimens each were tested; since the first group tested had a low mean strength and a very high scatter (Figures 4.11 and 4.12).
The ROR fracture strength data of the p-type LASTT specimens shows a band of fracture strength values between approximately 25 MPa and 40 MPa for range from 0 to 200 thermal fatigue cycles (Figure 4.11). In terms of analyzing the relative spread in the fracture strength data for both the n-type HL LAST and p-type LASTT specimens included in this study, Weibull statistics could not be applied to the specimens since Weibull statistics would require at least 20 valid fractures at each thermal cycling condition. However, in order to provide an alternative measure of the scatter in the data, the coefficient of variation (the standard deviation/mean) was plotted for the LASTT (Figure 4.12) and HL LAST (Figure 4.14) specimens. For the p-type LASTT fracture data, the coefficient of variation, CV, (standard deviation of the strength values / mean strength) ranged between about 0.1 and 0.2 except for one group of the as-received specimens for which CV 0.3, and both sets of the 90 thermal cycle specimens where CV 0.36 and 0.45 (Figures 4.11 and 4.12).

41
0 50 100 150 2000.0
0.1
0.2
0.3
0.4
0.5
P15- As Received P28- As Received P15- 30 Cycles P28- 60 Cycles P25- 90 Cycles P28/32- 90 Cycle (redo) P26- 120 Cycles P32- 150 Cycles P28- 200 Cycles
(Std
.De
v./M
ea
n S
)
Number of Cycles (N)
Figure 4.12 For the ROR fracture data shown in Figure IV.11, the coefficient of variation (standard deviation divided by the mean strength) versus the number of thermal fatigue cycles for the p-type LASTT specimens thermally cycled in the large thermal fatigue chamber.
Figure 4.13 Ring on Ring (ROR) fracture strength as a function of the number of thermal fatigue cycles
for n-type HL LAST cycled in the large thermal fatigue chamber. For the numbers in parentheses near the plotting symbols (i,j), the first number “i” indicates the number of valid fractures obtained and the second number “j” indicates the total number of specimens fractured for the given thermal shock treatment.
For the disc-shaped HL LAST samples (thermally cycled in the large thermal fatigue chamber), the mean ROR fracture strength values averaged between 15 MPa and 29 MPa for the 0 to 200 cycles, with the exception of one group of the as-received group specimens, which had a mean strength value of 37 MPa (Figure 4.13). The mean fracture strength for HL LAST was relatively constant between zero thermal cycles and 60 thermal cycles. For 90, 120 and 150 thermal cycles, the mean strength decreases although the scatter in the strength data for the 90, 120 and 150 thermal cycle data makes it difficult to determine how significant the decrease in mean strength is for these cycling conditions.

42
Surprisingly, the mean fracture strength for 200 cycles is roughly 30 MPa again, which may imply that the lower mean strengths for the specimens tested after 90, 120 and 150 thermal cycles is due to variations among the specimen batches and perhaps to the number density and size of the inclusions and surface pitting observed for the thermally cycled HL LAST.
Figure 4.14 For the ROR fracture data shown in Figure IV.13, the coefficient of variation (standard
deviation divided by the mean strength) versus the number of thermal fatigue cycles for the n-type HL LAST specimens thermally cycled in the large thermal fatigue chamber.
Fracture strength comparisons with the literature
For most thermoelectric materials, the mechanical property database in the literature is very limited. For fracture strength, ideally one might try to compare the fracture strength determined in this study with the fracture strength of commercially available thermoelectric materials, since the commercially available thermoelectric materials have proven their ability to withstand the stresses induced by in-service conditions. However, the only open-literature fracture study of any commercially available thermoelectric material is the one done by Wereszczak et al. [25] in which Ring-on-Ring (ROR) fracture strength was measured for a commercial Bi2Te3 material (Marlow Industries, Dallas, TX). Wereszczak et al. [25]found a mean fracture strength of 30 MPa for the Marlow Bi2Te3 specimens with faces oriented parallel to the billet cylindrical axis and 50 MPa for specimens with faces oriented perpendicular to the billet axis.
For the as-received n-type HL LAST and p-type LASTT specimens included in this study, the fracture strength is approximately 30 MPa (Figures 4.11 and 4.13), which is comparable to the values measured for the Marlow Bi2Te3 specimens by Wereszczak et al. [25]. Nevertheless, Wereszczak et al. [25] did not perform a thermal fatigue study on the Marlow Bi2Te3 thus it is not known how the fracture strength of Bi2Te3 degrades with thermal cycling. Furthermore, no thermal fatigue study is available in the literature for any thermoelectric material, regardless of whether the material is commercially available or not.
Thermal Fatigue / Mechanical Strength Summary
For the HL LAST specimens only, the as-received specimens surfaces showed inclusions, roughly 50 to 75 microns across. Energy Dispersive X-ray Spectroscopy (EDS) showed that in general the inclusions were lead poor, but disjoint sub-regions within the inclusions were rich in silver or antimony. All of the HL LAST specimens that were cycled in the small and large thermal fatigue chambers showed surface pitting and a decrease in the number density of inclusions, which implies that during fatigue the inclusions spalled off the surfaces. Since the chemistry of the inclusions are different than the average chemistry of the bulk material, the spalling of the surface inclusions may be
43
due to a mismatch in thermal expansion coefficient between the matrix of HL LAST and the inclusions.
All HL LAST and LASTT specimens tested prior to thermal cycling and all specimens fatigued in either the large and small thermal fatigue chambers had an “as-received” surface finish (the 400 grit surface finish present when the specimens were received from Tellurex). This as-received surface finish was selected for testing since that is a more realistic surface finish for TE module legs than the mirror-like surface finish typically used in strength testing.
The elasticity/thermal fatigue testing on HL LAST and LASTT showed that the Young’s modulus and Poisson’s ratio were relatively insensitive to thermal fatigue cycling, except for two specimens, P15-14 which fractured after 160 cycles and which P15-17 fractured after 180 cycles. This indicates that the “average” microcrack length and/or number of microcracks do not increase appreciably during thermal cycling in the small thermal fatigue chamber.
The ring-on-ring (ROR) fracture strength for both the as-received (not thermally fatigued) HL LAST (n-type) and LASTT (p-type) is comparable to ROR strengths measured on commercially available Bi2Te3 [Wereszczak et al., 8]. The ring-on-ring fracture for LASTT (p-type) shows a band of fracture strength values between approximately 25 MPa to 40 MPa for up to 200 thermal fatigue cycles, thus the fracture strength of LASTT does not degrade significantly during thermal cycling in the large thermal fatigue chamber. The HL LAST fracture data shows a band of strength values between about 15 MPa and 38 MPa for 0 to 200 thermal fatigue cycles. One of our latest HL LAST batches (N37) maintained mechanical strength near 30 MPa (26 MPa ± 4 MPa) after 200 thermal fatigue cycles. However there is no data available in the literature for the strength or elasticity changes due to thermal fatigue of Bi2Te3 or any other thermoelectric material, so it is impossible to compare LAST / LASTT thermal cycling strength data with other thermoelectric materials.
A Finite Element Analysis of the TE module design performed by Pacific Northwest National Laboratory (PNNL) indicates that with the appropriate dimensions and interconnections, the thermal stresses generated within thermoelectric modules fabricated from HL LAST and LASTT elements may not exceed the strength values measured in this study. Future work that is needed is thermal fatigue testing of LAST/LASTT thermoelectric modules under typical operating conditions for this application (Th = 670K, Tc =312 K).
5. TE Module Structural Analyses As part of the Thermal Fatigue / Mechanical Strength evaluations and results in Section 4, PNNL
has performed finite element (FE) structural modeling of displacements and stresses in the LAST / LASTT TE materials, the Bismuth Telluride TE materials, copper electrical connection strapping, and interface materials within the TE modules. PNNL used the ANSYS (Version 11) structural analysis software to analyze various load steps and loading conditions on the TE modules using the thermal fatigue data on Young’s modulus and Poisson’s ratio generated by MSU in the work described in Section 4. The ANSYS model of the TE module contains 56,000 finite elements and models the following components within the TE module as shown Figure 5.1:
LAST n-type / LASTT p-type TE materials
Bismuth Telluride n-type / Bismuth Telluride p-type TE materials
Copper electrical strapping
Diffusion Barrier and Electrical Interconnect materials
The copper electrical strapping (i.e., often referred to as copper “straps”) is shown in Figure 5.1. The diffusion barrier and electrical interconnection material is shown as 0.010” stainless steel in Figure 5.1.
The ultimate goal in this structural work was to evaluate displacements-stresses for different TE module and TE element designs, understand the structural behavior at the TE element level, provide structural design guidance on TE element sizing (i.e., length and width), and provide structural design guidance on diffusion barrier interface material selection. The ultimate goal was to establish TE

44
module and element structural designs to satisfy the mechanical strength requirements and capabilities of the LAST / LASTT and Bismuth Telluride materials identified in Section 4.
Copper tabs(10 mil)
p1
p2
n1
n2
Stainless Steel (10 mil)
Figure 5.1. ANSYS Structural Model of Tellurex TE Module Design (49 Couples Configuration)
Table 5.1 Structural and Thermal Properties Used in the TE Module Structural Analysis
The model shown in Figure 5.1 is a full model of the Tellurex TE module that takes advantage of the centerline symmetry within the module by applying zero-centerline-displacement boundary conditions along the centerline planes. Table 5.1 shows the structural properties used in the TE module analyses. This analysis approach allows us to evaluate displacements-stresses as a result of differential thermal expansions and applied compression in each of these module components and the integrated impact from each component on others within the module. Structural displacements-stresses in the TE module were analyzed for two load conditions (i.e., Load Steps). Load step 1 is room temperature displacements-stresses after high temperature fabrication processes are performed. Load step 2 is the high temperature displacements-stresses expected during operation with T hot = 670 K and T cold = 312 K and compression loading of 30 lbs/inch2 (600 lbs total) in the TE power generation stack up. Tellurex specified a desired compression loading of 30 -35 psi for the TE modules in the final system. This load step also included a hot-side boundary condition that allowed lateral (X-Y) direction slippage of the hot-side copper strapping interface with the hot heat exchangers as the TE modules heated up during TEG operation.
Alumina CopperSteel
316
LASTT
(p1)
LAST
(n1)
p_Bi2TE3
(p2)
n_Bi2TE3
(n2)
*Young’s Mod
(GPa)300 129 205 46.55 54.5 43.6 43.6
Yield / Fracture Strength**
(MPa)
2100b
(compressive)~198 300
30-32(ROR)
46-58 (BOR)26(ROR) 8-166 8-166
CTE
(x10-6 / C)8.2
Temp
Dependent(15-18)
18.54 21.0 21.014.4,
21.3
14.4,
21.3
Thermal
Conductivity
(W/m K)
25Temp
Dependent(420-370)
16.3 1.5035 1.25 2.27 1.103
p1: Tellurex LASTT n1: Tellurex LAST p2: p-type Bi2Te3 n2: n-type Bi2Te3

45
Our structural analysis work identified crucial TE element sizes, and diffusion barrier and interconnect materials were found to be critical design parameters in determining and controlling the displacements-stresses in the TE elements. Various materials were analyzed for the diffusion barrier and interconnect materials between the copper straps and the TE materials including:
Molybdenum
Antimony
Type-316 Stainless Steel (High Expansion Stainless Steel)
Type-1010 Stainless Steel
Our structural analysis determined that any combination that used molybdenum created extremely high stresses in the TE element because of its relatively low coefficient of thermal expansion. Antimony was much better in this regard, but its mechanical strength was not high enough to withstand the interfacial stresses created between the TE material and the copper straps during operational thermal expansions. Our team ultimately selected type-316 stainless steel as the diffusion barrier and interface material between the TE material and the copper straps because this creates the lowest stresses in the TE materials during the thermal expansions and compressions expected during high temperature operation.
Our structural analysis of the Tellurex TE module designs then focused on investigating various TE element dimensions to better optimize displacement – stress conditions and provide structural design guidance in meeting the mechanical strength capabilities and requirements of the LAST / LASTT materials on the TE module hot side. PNNL analyzed TE module designs with elements in the following dimensional range: 4.4 mm (high) X 2.5 mm (edge) X 2.5 mm (edge) to 7.0 mm (high) X 1.4 mm (edge) X 1.4 mm (edge) and combinations in between these values. In performing the structural analysis we have found through exaggerating the displacements just what forces and force directions are acting on the p-type and n-type elements and how elements are being deformed under anticipated operating conditions. Figure 5.2 shows an example of these exaggerated displacements (40X magnification) on the hot-side (top) and cold-side (bottom) under expected operating conditions.
Figure 5.2 Magnified Displacements in Segmented p-type & n-type TE Elements of Tellurex Design (Displacements are mm)
This model is a quarter-scale model of the TE module to take into account the centerline symmetry of the TE module, accounts for and allows lateral movement of the module surfaces on hot-side (because of our GRAFOILTM interfaces that allow slippage during expansion), accounts for 30 psi compression on the TE module in the generator stack-up, the fixed surface mount on the cold-side, and the relatively small movement and expansion on the cold side (at 312 K it remains close to room temperature during operation). What is clear in the analysis results is that the copper straps are expanding on the hot-side to create structural forces that tilt the TE elements relative to their original

46
positions. This creates tensional stresses at the corners and edges of the TE elements under expected operating temperature conditions.
3) X-Y Direction (Lateral) Structural Stresses
4) Z-Direction (Vertical) Structural Stresses 5)
Figure 5.3 Element Structural Stresses in X-Y Lateral Directions and Z Vertical Direction for 4.4 mm X 1.4 mm X 1.4 mm TE Elements (Stress Units are MPa)
Figure 5.3 shows the magnitude of these stresses for TE elements having dimensions of 4.4 mm (high) X 1.4 mm (edge) X 1.4 mm (edge). We have concluded that the X-Y lateral stresses are within our requirements based on LAST / LASTT strength measurements discussed in Section 4. The Z-direction tension stresses however are higher than our requirements for the element dimensions analyzed in Figure 5.3. Additional structural analyses were performed on TE elements that were shorter than those in Figure 5.3 with dimensions of 4.0 mm high X 1.4 mm X 1.4 mm, as this was the size used in the final Go/NoGo TE module. Figure 5.4 shows the structural stresses that developed in this configuration. They were only slightly higher than those shown in Figure 5.3.

47
a)X-Y Direction (Lateral) Structural Stresses
(b) Z-Direction (Vertical) Structural Stresses
Figure 5.4 Element Structural Stresses in X-Y Lateral Directions and Z Vertical Direction
for 4.0 mm X 1.4 mm X 1.4 mm TE Elements (Stress Units are MPa)
Additional structural analysis on TE elements that are wider (4.4 mm high X 2.5 mm X 2.5 mm) determined that the X-Y stresses are larger, but tolerable, while the Z-direction tension stresses are much too large. In the structural analysis shown in Figures 5.3 and 5.4, even though the Z-tension stresses are shown as too large, an important thing to consider is that these tension stresses are occurring at corners which are very difficult to model accurately because of the mathematical singularities that occur in corners in FE models. The FE model represents that corner as a “mathematically exact” corner, which drives model-predicted stresses at corners to somewhat artificially high levels. The corners in an actual TE element have a certain amount of “rounding” because of the fabricating process itself. This “corner rounding” is extremely difficult to model but it is well-known that rounding and chamfering of corners reduces stresses in these locations (See standard ASTM C1161-02c). This has created one design option for the TE elements of the size shown in Figures 5.3 and 5.4. Tellurex has actually produced LAST / LASTT TE elements of this size with rounded corners to minimize the stresses shown.
PNNL also structurally analyzed a TE element design with dimensions as tall as 7 mm high X 1.4 mm X 1.4 mm in order to quantify stresses at the extreme bounds of the potential element design space. Figure 5.5 shows the structural stresses determined in that analysis. These results show the LAST / LASTT corner stresses (Figure 5.5b) at the hot side being reduce significantly to levels that are comparable to the LAST / LASTT mechanical fracture strength levels shown in Section 4.

48
(a) X-Y Direction (Lateral) Structural Stresses
(b) Z-Direction (Vertical) Structural Stresses Figure 5.5 Element Structural Stresses in X-Y Lateral Directions and Z Vertical Direction
for 7 mm X 1.4 mm X 1.4 mm TE Elements (Stress Units are MPa)
The same “corner rounding” issue discussed above occurs in this analysis in that the corners are represented as “mathematically exact” in the model, thereby artificially increasing model-predicted stresses, whereas the actual TE element has some “rounding” to it from the fabrication processes that is extremely difficult to model. Therefore we believe that the actual corner stresses in the TE elements will be less than those shown in Figure 5.5b. Our team does not believe the compression stresses (negative stress values in bluish colored regions) will be a problem as the TE materials are generally much better in compression than in tension as is common in most materials.
These structural analysis findings have pushed our TE element designs toward two different options: 1) TE element sizes of those shown in Figure 5.3 with chamfered corners to reduce local stresses or 2) taller and/or thinner TE element dimensions to reduce local corner stresses. The second option actually creates a power output problem in that taller / thinner TE elements will have lower

49
length/area ratios and therefore lower power output than we desire. Our design estimates have shown the power output per couple would fall by about 40% in elements with dimensions shown in Figure 5.5. Therefore, our team has decided to take the option 1 design approach using TE elements similar in size to those shown in Figure 5.3 to build our prototype TE modules for TE testing described Section 6. This design approach will be incorporated into our TE module that goes through thermal cycling to augment the structural analysis discussed here and mechanical fracture testing results discussed in Section 4.
Tellurex produced TE modules using the element dimensions shown in Figure 5.4 in the TE module development and testing work described Section 6. The modules performed quite well structurally with no structural failures noted during testing performed at MSU that included some cycling up and down in temperature. This was not an exhaustive test of their thermal cycling performance. However, these tests did show the modules could withstand repeated high temperatures without structural failures. Our team therefore felt that the structural analyses described in this section did focus the TE module design in the proper direction and was successful in developing structurally sound designs.
6. LAST / LASTT – Based TE Module Design, Development & Testing TE module design integrated what has been learned about a thermoelectric material’s matched-
load voltage, current and power at a variety of temperatures and ΔT’s, along with a host of practical concerns. Materials compatibility, thermal expansion & contraction, strength and elasticity of materials, manufacturing limitations & physical placement restraints, and the need for low ohmic contact electrical connections, all must be considered in the process of module design. As the TE materials reached higher stages of development discussed in Section 3, the challenge was to converge on module characteristics. The module design progressed and prototype fabrication processes were evaluated as final decisions on TE materials were made.
The TE module design initially focused on two possible architectures: a) 18.46 x 72.91 mm substrate design. This is a 49-couple, two-layered device (Figure
6.1a) laid out in a 5 by 20 pellet matrix (less two corner pellets). b) 18.46 x 36.61 mm substrate design. This is a 24-couple, two-layered device (Figure
6.1b) laid out in a 5 by 10 pellet matrix (less two corner pellets). This option was considered if necessary to enhance thermal cycling capability with two modules mounted side-by-side using a short wire between them for series connection.
(a)
(b) Figure 6.1 TE Module Designs from Tellurex
With both architectures, the TE pellets initially had a cross-sectional area defined by dimensions of 2.5 mm per side. The height of each material layer and overall pellet height were not determined until final selection of n-type LAST materials (although the overall height had to be kept below 4.4 mm due to cutting hardware limitations). The p-type LASTT materials were better understood and much more repeatable earlier in the program, so they were not the critical path in the module design. While there was a desire to make pellets relatively small to increase the number of couples and the voltage output of the module, it was felt that the 2.5 mm dimension was as low as could be

50
accommodated in the tooling without adversely affecting manufacturability. Thus the challenge was to find out how many couples of that size could fit in the available substrate area. Both designs in Figure 6.1 were designed to fit within the 7.6 cm × 2.0 cm footprint for the hot-side and cold-side heat exchangers. Drawings for both substrate architectures were complete and ready to go to the fabricator prior to the Go/NoGo Decision Period. The final material selections occurred in July during the Go/NoGo Decision period.
During development and characterization of the materials planned for the modules, several parameters came into play in deciding the physical characteristics of the first modules for testing. These parameters include:
Manufacturing limitations (equipment, materials robustness, pellet placement precision in a non-high volume setting, etc.)
Power requirements of program goals
Efficiency requirements
Heat exchanger footprint
Materials availability
Timing of module build phase given long materials development cycle
Heat exchanger interface (flatness, non-ohmic coating, heat transfer)
Structural integrity for handling and operation
A number of these parameters were more important than others in steering the direction of the module design and most of the parameters are interrelated. Structural integrity of the pellets, the couples and eventually the module was important. Numerous iterations at Tellurex and MSU involved pellet sizes ranging 1.4 mm x 1.4 mm x 4.0mm to 3.6mm x 3.6mm x 6mm. These dimensions resulted in pellets that were large enough to work with in assembly and bulky enough to withstand handling. However, the countervailing issue of strength in thermal gradients would, after PNNL structural analysis, led the team to move toward taller, smaller cross-sectional area pellets. Tellurex had considered this prior to the PNNL structural analysis given its experience with high L/A ratio bismuth telluride modules operated in high ΔT environments, but awaited quantitative confirmation from the PNNL structural analysis to confirm specific element dimensions. Though the taller, smaller cross-section elements presented handling issues, the operational issue was considered more important.
A number of module possibilities were explored by using computer models. Each of these models employs finite element analysis to ‘map’ the impact of thermal resistance across the module T. There were three models—one for single layer, another for a segmented layer (i.e., a multi-material layer), one that models two-stage cascade devices. As each material was evaluated at MSU (and at Northwestern University, M. G. Kanatzidis’ group, for thermal conductivity), curve fits were developed to reflect the capabilities demonstrated. The models were constructed so new material data could be entered in a manner which provided easy menu-based selection. Thus new materials could be examined within a module context very quickly. The set-up menu allowed the user to easily choose different pellet dimensions and layer thicknesses. It became very expedient to run a variety of module permutations.
Ultimately, cascaded devices were abandoned because exploration showed there was little to be gained while much is lost in the complexity of such a module. On the other hand, it became quite apparent that there was substantial benefit in using segmented layers using Bi2Te3, LAST, and LASTT. Throughout the process of evaluating the various design configurations (sizes, materials, etc.), the computer models offered a valuable way to quickly glimpse the possibilities. Even when changes were driven by mechanical considerations, modeling showed much of the ultimate impact.
The Table 6.1 below shows an example of projected performance for a segmented 2-layer device using Tellurex module design software. Note that this does not reflect losses due to thermal interfaces; thus the performance will appear enhanced (i.e., efficiencies and power higher than

51
expected in a final module). This modeling was coordinated with modeling efforts and results from MSU shown later in Figure 6.3–Figure 6.7. As various design changes were considered, the modeling data in these tables and working with MSU enhanced the Tellurex decision-making and allowed them to make intelligent design choices.
Table 6.1 Dual-Layer Segmented TE Module Design Analysis Using p-type LASTT/Bismuth Telluride and n-type LAST/Bismuth Telluride.
In addition to module design, processes incorporating both LAST(T) and bismuth telluride into single pellets were employed. The materials development and characterization allowed Tellurex to select the appropriate n-type LAST and p-type LAST(T) material choices for our Go/NoGo TE modules. With that information and also fitting within the module design, wafers of the chosen materials were fabricated. From these wafers, pellets were diced and readied for assembly. Along with what was learned via modeling of the modules, current manufacturing limitations at Tellurex did not allow parts of much beyond 4mm tall to be successfully diced in quantity. With more development, and possibly other equipment, this limitation could be remedied in the future and taller elements could be possible. This is why PNNL investigated TE elements as tall as 7 mm in their structural analysis. Another factor impacting module design was access to components for module fabrication. Materials, such as conductor tabs and substrates, that Tellurex has access to without leveraging tooling charges allowed for the use of materials that could be accessed expediently with low cost.
Ultimately, the module has to be able to provide a power density that will satisfy the total system design goals. The structural analysis, as noted in the “TE Module Structural Analyses” section, indicated that small cross-sectional, long pellets would be beneficial in reducing hot side corner stresses to acceptable levels. Bringing the pellets to 1.4 x 1.4 x 7mm accomplished this. However, given limitations in manufacturing and given that such high L/A pellets would greatly reduce power density, it was determined that pellets of 1.4 x 1.4 x 4mm were acceptable for Go/NoGo TE module trials.
The first modules using LAST/LASTT/Bismuth Telluride segmented elements developed for initial testing are shown in Figure 6.2. They utilize 1.4 mm x 1.4 mm x 4mm geometry pellets for both p- and n-type couple legs. With 47 couples and a 0.319 pellet fill factor, the overall cross-section of the module is 19.5 x 29.5mm, with an overall height of ~ 5.64mm. The cold side is 96% alumina, 0.64mm in thickness. This provides structural support for handling and provides a base for nickel plated copper tabs. The bismuth telluride cold side section of the segmented pellets is soldered to these conductor tabs. On the hot side of the couples 0.13mm of Grafoil® is added and singulated with each couple. This provides a compliant hot side thermal interface.
Layer C Layer H
N Bi2Te3 Tx N37-8 Couples W ThH Layer Length
C Layer Length W Th
H Layer Length
C Layer Length
P Bi2Te3 TX P25-2 47 1.397 1.397 2 2 1.397 1.397 2 2
TC TH TC TH T N P N P VNL Resistance
Static Source Power PML Model Carnot VML IML
312 673 39 400 361 475.226 502.371 202.226 229.371 7.554 4.162 22.662 3.428 10.252% 10.13% 3.777 0.908
N MaterialP Material P Bi2Te3 'Tx
N Bi2Te3 Tx
Layer C
ModuleK° C° K° Layer junction temperature C° Efficiency
Thermal Resistivity P Pellet dims N Pellet dims
P21 multiN37-2
Layer HSeebeck Coeficient & Electrical Resistivity

52
Figure 6.2. First TE Modules Using the New LAST / LASTT / Bismuth Telluride Segmented Elements
Module development included the computer modeling of the materials and via iteration with MSU and PNNL on the mechanical, structural and manufacturing parameters, the complete module design was worked to final design with projections on electrical characteristics and conversion efficiency.
Utilizing modeling software developed under ONR-MURI support, the above fits to the data were used for determining optimal dimensions for segmented leg modules, and to see the influence of deviations from those dimensions. These modeling results assume zero thermal losses. For this model the p-type leg dimensions are 1.4mm × 1.4mm × 4.4mm which includes 2.2mm of P40-4 (Ag0.9Pb9Sn9Sb0.6Te20) material and 2.2mm of Bi2-xSbxTe3 for the p-type segmented leg. For the case of An/Ap = 1, the n-type leg dimensions are also 1.4mm × 1.4mm × 4.4mm including 2.4mm of N37-2 (Ag0.86Pb19+xSbTe20) material and 2mm of Bi2Te3-xSex for the n-type segmented leg. For the case of An/Ap = 1.35 which is the optimal ratio, the n-type leg dimensions are 1.63mm × 1.63mm × 4.4mm including 2.4mm of N37-2 (Ag0.86Pb19+xSbTe20) material and 2mm of Bi2Te3-xSex for the n-type segmented leg. The efficiency reaches 9.8% for = 0.0 and (An/Ap) = 1.35, and 9.0% for = 0.1and (An/Ap) = 1.35 as shown in Figure 6.3. The modeling in Figure 6.3 is based on average material properties as described by Cobble [29], while the modeling in Figure 6.4 is based on an iterative modeling technique [Hogan and Shih,18].
Figure 6.3 Expected output from segmented leg modules using Tellurex materials for different contact
resistance values, and two cross-sectional area ratios for n-type to p-type legs.
0
2
4
6
8
10
0 50 100 150 200 250
Eff
icie
ncy
(%)
Load Resistance per Unicouple (m)
n-type leg = 2mm of Bi2Te
3-xSe
x
p-type leg = 2.2mm of Bi2-x
SbxTe
3
Th = 670K T
c = 312K
p-type leg = 1.4mm × 1.4mm × 4.4mm
An/ApSymbol0.010.110.01.350.11.35
= Rc/R
m
0
0.01
0.02
0.03
0.04
0.05
0.06
0.07
0 50 100 150 200 250 300
Pow
er O
utpu
t per
Uni
coup
le (
W)
Load Resistance per Unicouple (m)
Th = 670K T
c = 312K
p-type leg = 1.4mm × 1.4mm × 4.4mm
An/ApSymbol0.010.110.01.350.11.35
= Rc/R
m
n-type leg = 2mm of Bi2Te
3-xSe
x
p-type leg = 2.2mm of Bi2-x
SbxTe
3

53
Position dependent properties for the = 0.0 condition and assuming zero thermal losses were further modeled using an iterative modeling technique. The results are shown Figure 6.4. This shows highest efficiency when the cross-sectional area of the n-type leg is approximately 1.35 larger than the cross-sectional area of the p-type leg as shown in Figure 6 3.
In Figure 6.4, the family of curves that are showing module efficiency versus Jp, the current density in the p-type leg, gives information on the optimal load conditions. As the resistive load is adjusted, the current through the module changes leading to a curve that peaks at a given current density. This family of curves shows both how efficiency changes with variations in the current density and variations in the relative cross-sectional area of the n-type to p-type legs. To see this second point more clearly, the module efficiency vs. An/Ap plot shows the peak values of the module efficiency versus Jp graph and helps to identify the optimal cross-sectional area ratio. From the iterative modeling, position dependent properties can also be graphed. The heat flux vs. position on the leg corresponds to the heat flow through the thermoelectric material only and does not include thermal losses through insulation between legs. This gives information at the cold side and hot sides of the modules providing valuable information needed for heat exchanger design. This is essential as the required heat fluxes for very short legs can easily exceed capabilities of standard heat exchanger designs. The modeling software was developed based on a user input of the desired junction temperature for segmented legs and the resulting position dependent plots of the material properties can indicate clear demarcation points between materials used as seen in the ZT vs. position on the leg plot in Figure 6.4. The required length of each segment of the leg to achieve the desired junction temperatures is determined from such plots.
Figure 6.4 Modeling results using the iterative technique for segmented modules with 4.4mm long legs.

54
The manufacturing of the modules resulted in legs of 1.4mm × 1.4mm × 4mm, therefore the modeling was also done for these shorter leg dimensions as shown in Figures 6.5 and 6.6. Here the p-type leg dimensions are 1.4mm × 1.4mm × 4mm which includes 2mm of P40-4 (Ag0.9Pb9Sn9Sb0.6Te20) material and 2mm of Bi2-xSbxTe3 for the p-type segmented leg which yields a junction temperature of 490K. For the n-type leg, as was done above, two cases are shown in Figure 6.5. For the case of An/Ap = 1, the n-type leg dimensions are also 1.4mm × 1.4mm × 4mm including 2.25mm of N37-2 (Ag0.86Pb19+xSbTe20) material and 1.75mm of Bi2Te3-xSex for the n-type segmented leg. For the case of An/Ap = 1.35 which is the optimal ratio, the n-type leg dimensions are 1.63mm × 1.63mm × 4mm including 2.25mm of N37-2 (Ag0.86Pb19+xSbTe20) material and 1.75mm of Bi2Te3-xSex for the n-type segmented leg. These dimensions yield a junction temperature of 460K for the n-type leg. As expected, the efficiency does not change with the change in leg length, and reaches 9.8% for = 0.0 and An/Ap = 1.35, and 9.0% for = 0.1 as shown in Figure 6.5. A slightly lower efficiency of 9.5% for = 0.0 is reached when An/Ap = 1 (or 9.0% with = 0.1 and An/Ap = 1). The power output from each unicouple in the module does increase compared to the leg length of 4.4mm. This is caused by a higher heat flux associated with the shorter legs while maintaining an equal conversion efficiency.
Figure 6.5 Expected output from segmented leg modules using Tellurex materials for different contact
resistance values, and two cross-sectional area ratios for n-type to p-type legs.
For the 4mm long legs, position dependent properties for the = 0.0 condition and assuming zero thermal losses were further modeled using the iterative modeling technique. The results are shown in Figure 6.6. This also shows highest efficiency when the cross-sectional area of the n-type leg is approximately 1.35 larger than the cross sectional area of the p-type leg as shown in Figure 6.5.
0
2
4
6
8
10
0 50 100 150 200 250
Eff
icie
ncy
(%)
Load Resistance per Unicouple (m)
n-type leg = 1.75mm of Bi2Te
3-xSe
x
p-type leg = 2mm of Bi2-x
SbxTe
3
Th = 670K T
c = 312K
p-type leg = 1.4mm × 1.4mm × 4mm
An/ApSymbol0.010.110.01.350.11.35
= Rc/R
m
0
0.01
0.02
0.03
0.04
0.05
0.06
0.07
0.08
0 50 100 150 200 250
Pow
er O
utpu
t per
Uni
coup
le (
W)
Load Resistance per Unicouple (m)
Th = 670K T
c = 312K
p-type leg = 1.4mm × 1.4mm × 4mm
An/ApSymbol0.010.110.01.350.11.35
= Rc/R
m
n-type leg = 1.75mm of Bi2Te
3-xSe
x
p-type leg = 2mm of Bi2-x
SbxTe
3

55
Figure 6.6 Modeling results using the iterative technique for segmented modules (4 mm long legs).
The segmented legs for the module design also were scanned at room temperature with a voltage scanning system. For a 1.4mm × 1.4mm × 4mm a scan near the junction is shown in Figure 6.7.
Figure 6.7 Voltage scan across the junction of Bi2Te3-xSex to (LAST) showing a low contact resistance
(voltage drop across the junction is less than one tenth of voltage drop across the full leg).
During the Go/NoGo Decision period our team developed and refined a TE module measurement system for measuring our TE module efficiency and power output in order to assess our TE module
0
2000
4000
6000
8000
1 104
1.2 104
-0.5 0 0.5 1 1.5 2 2.5 3 3.5
Vol
tage
(µ
V)
Position (mm)
Bi2Te
3
LAST
Bi2Te
3-xSe
x =1,153(S/cm)
LAST Ag0.86
Pb19
SbTe20=109(S/cm)

56
Go/NoGo criteria. This Go/NoGo criteria was established as demonstrating 5W of power output at an efficiency of 8-10% in our TE modules to demonstrate mid-term progress toward our ultimate project goals. These modules would then be refined to a higher packing density in Phase 2 for integration into the power system.
A module measurement system was designed and assembled for measuring one or two modules at a time by using a dual cold plate configuration. To measure two modules, a heater is sandwiched between the modules being tested. In this way, losses from the heater are minimized by having the heat path predominantly through the thermoelectric material only. A sketch of the module measurement stage is shown in Figure 6.8.
Figure 6.8 Minimal-Loss TE Module Test Configuration & System - Double cold plate configuration for the
module testing stage.

57
If a single module is to be tested, then a piece of insulation is used to replace the other module shown in the configuration of Figure 6.8. The modules are mounted between two cold plates that are temperature controlled using a water chiller. Thermal contact to the cold stage is made using Grafoil® or thermal grease between the alumina substrate of the module and the cold stage. A 1mm thick meandering line nichrome heater was EDM machined and is used to maintain the hot side of the modules. An aluminum nitride electrical insulator separates the heater from the Grafoil® sheets which are placed on top of each hot side electrode. The springs under the lower cold plate provide loading on the modules, and mechanical pressure is adjusted to 30psi by monitoring the deflection of these springs. The upper photograph in Figure 6.8 shows test bismuth telluride modules mounted with thermal insulation frame around the modules and powder insulation filling the space between the modules and the frame. The lower photograph shows a Tellurex 47-couple segmented leg module at the beginning of the measurement stage mounting process. When both modules were removed from the measurement system, and each one replaced with Microtherm® insulation, 2.6 (W) of heater power was required to maintain a temperature of 400 ºC. This is an indication of the losses in the system with this configuration and close to the expected value of 2.7 (W) as indicated in Table 6.2. These values are used in the module efficiency calculations during test conditions discussed below.
Test Procedure: Step 1: Module Installation
Figure 6.9 TE Module on Cold Plate with Insulator Ring in Place
Place bottom module onto cold plate as shown. Thermal grease or Grafoil may be used for
improving thermal contact of the cold side of the module to the cold plate.
Pour in Microtherm to insulate the module. Make sure to clean all insulation from the hot side
electrodes.
Figure 6.10 TE Module with Microtherm Added Around & Between Legs
Place the aluminum nitride on top of the module
to insulate the heater from the module. Place the heater on top of the aluminum nitride.

58
Figure 6.12Figure 6.13 Figure 6.11

59
Step 3: Module Heating
Figure 6.11 Short-Circuit
Connections at Output Terminals
Turn on chiller and set it to desired cold side temperature
Using LabView Program “Efficiency System PRG 1,” set current level to desired current level and wait for temperature to stabilize.
It is key to heat the module slowly to prevent damage to the module. It is good to increment current in 1 amp steps every 20-30 minutes until reaching operating temperatures (for two 19.5mm x 25.9mm modules with 47 couples each and 4mm leg heights, the current required to reach 400C was approximately 13 A).
Step 4: Module Output Measurement Record the open circuit voltage on the 2182’s
Place the short circuit on the output posts
Peltier effects will lower the hot side temperature. Increase the heater power to return to the open circuit hot side temperature
Wait for temperature to stabilize
Measure the short circuit current with the current sensor
Remove short circuit and increase power to the next temperature point
Step 5: Module Removal Cool down module slowly. Use same time between power
adjustments during heating of module.
Turn off pump
Vent system
Remove shroud
Un-solder all electrical connections
Turn ram rod until it is no longer deflecting the cold plates
Remove top assembly
Remove top cold plate
Vacuum out all of the microtherm
Remove top module, Remove heater, Remove bottom module

60
Test System Thermal Losses
To quantify our TE module efficiency in the test system shown in Figure 6.8, it was necessary for our team to estimate the test system thermal losses for this test configuration, which was considered a minimal-thermal-loss design. Table 6.2 shows the estimates of these test system thermal losses. This does not account for I2R heating of the copper leads going to the heater - we estimate this to be less than half of the heat loss up the copper leads and it would appear as a heat gain to the heater and offset the thermal losses shown for the copper heater leads. Our detailed thermoelectric modeling at MSU and Tellurex predicts there will be 31 W of thermal flow into the TE materials on the TE module hot side (See Appendix A) after these thermal losses are accounted for.
Table 6.2 Test System Thermal Losses Per Two 47-Couple TE Module Test
Thermal Loss Description Qloss – With Modules in System [Watts]
Qloss – Insulation Only in System [Watts]
Qloss – Measured Insulation Only in System [Watts]
Insulation Between Module n- & p- legs
2 x 0.70 2 x 0.52 -
Insulation Lateral Heat Flow 2 x 0.19 2 x 0.19 - Copper Heater Leads (2 leads)
1.3 1.3 -
Thermocouple Leads (4 thermocouples)
0.002 0.002 -
Total for Two Modules 3.1 2.7 2.6
(See Appendix A For Details)
Measurement Results for Tellurex Modules
The initial test module had a measured resistance of 40 (Ω) which was believed to be too large for efficiency measurements. However, it did provide a good test module for working on the mounting and measuring techinique. The module was thus mounted in the system, and in place of the second module, a piece of insulation was used. The open circuit voltage and short circuit current were measured for various temperature gradients from 40.3K to 191.9K (Figure 6.15), and the system was then cooled down. The second day, the module was measured again at three different temperature gradients of 141K, 322K, and 359K. It was observed that the module resistance significantly reduced after these tests.
Figure 6.12 Initial measurements of the 40Ω module.
Day 2

61
Based on the reduction in the resistance, it was decided to take efficiency measurements on this module as shown for various hot side and cold side temperatures in Table 6.3.
Only one module was measured, with Microtherm® insulation in place of the second module, for the measurements shown in Table 6.3 Each pair of two rows in the above table correspond to a module under a fixed temperature gradient with the top row of the two corresponding to the open circuit condition of the module, and the second of the two rows corresponding to the short circuit condition of the module. The power output from the module was calculated by one fourth of the open circuit voltage times the short circuit current or ¼·[Voc·Isc]. The efficiency of the module was calculated by subtracting the loss of 2.6 (W) from the power to the heater, and dividing this into the output power from the module for a hot side temperature of 383 ºC and a cold side temperature of 24 ºC.
%18.3(W) 6.2(W) 6.35
(W) 051.1
Table 6.3 Test Data for Initial 40 Module
Heater 40 Module
Current (A)
Voltage (V)
Power (W)
Matched Load Power (W)
Temp Hot (ºC)
Temp Cold (ºC)
T Voltage (V) Current (A)
Max Power (W)
3.02 1.06 3.20 3.25
64.5 24.2 40.3 0.495 0 0.0038 3.05 1.08 3.29 64.4 24.2 40.2 0.0000053 0.031
4.01 1.42 5.69 14.9
86.6 24.3 62.3 0.9399 0 0.0115 4.09 5.88 24.0 86.4 24.6 61.8 0.0000129 0.049
5.02 1.76 8.84 9.13
118.9 24.8 94.1 1.44 0 0.0317 5.15 1.83 9.42 118.6 24.9 93.7 0.0000284 0.088
6.01 2.15 12.9 13.5
163.5 24.4 139.1 2.01 0 0.117 6.29 2.23 14.0 163.9 24.5 139.4 0.0000678 0.233
7.01 2.51 17.6 18.8
216.1 24.3 191.8 2.684 0 0.281 7.48 2.68 20.0 216.2 24.6 191.6 0.000124 0.419
6 2.08 12.5 13.5
164 23.8 140.2 1.85 0 0.158
6.4 2.28 14.6 163.8 24.1 139.7 0.00002 0.342
9.01 3.24 29.2 31.8
347.7 24.5 323.2 4.25 0 0.866 9.78 3.52 34.4 347.1 25 322.1 0.0002697 0.815
9.51 3.43 32.6 35.6
383.1 24.3 358.8 4.73 0 1.051 10.34 3.73 38.6 383.8 24 359.8 0.000281 0.889
The next module (Module 1) was then measured along with the 40 (Ω) module above, in the two module configuration of Figure 6.8. For Module 1, the measured results are shown below in Table 6.4:

62
Table 6.4 Test Data for TE Module 1 Heater Module 1
Current (A)
Voltage (V)
Power to Module 1 (W)
Matched Load Power (W)
Temp Hot (ºC)
Temp Cold (ºC) T
Voltage (V)
Current (A)
Module Resistance (Ω)
Max Power (W)
2.04 0.69 0.704 0.739
36.0 20.9 15.1 0.102 0.000 5.345 0.000
2.12 0.73 0.774 36.7 21.0 15.7 0.000009 0.019 4.02 1.40 2.814
2.890 80.9 21.2 59.7 0.453 0.000
5.662 0.009 4.12 1.44 2.966 81.3 21.8 59.5 0.000032 0.080 8.00 2.90 11.600
12.444 240.8 31.4 209.4 1.970 0.000
4.613 0.210 8.60 3.09 13.287 241.5 32.6 208.9 0.000163 0.427 10.61 3.82 20.265
22.516 361.2 39.3 321.9 3.160 0.000
4.334 0.576 11.71 4.23 24.767 360.0 41.3 318.7 0.000292 0.729 11.56 4.16 24.045
26.544 402.9 43.1 359.8 3.564 0.000
4.752 0.668 12.71 4.57 29.042 400.0 48.3 351.7 0.000278 0.750
These data give a measured module efficiency of: %65.2(W) 3.1(W) 6.5442
(W) .6680
For this measurement run, the 40 (Ω) Module gave the following measurement results (Table 6.5) for this second run of the module:
Table 6.5 Test Data for Second Run of 40 Ω Module
Heater 40Ω Module
Current (A)
Voltage (V)
Power to 40Ω Module (W)
Matched Load Power (W)
Temp Hot (ºC)
Temp Cold (ºC) T
Voltage (V)
Current (A)
Module Resistance (Ω)
Max Power (W)
2.04 0.69 0.704 0.739
36.0 20.8 15.2 0.095 0.000 6.778 0.000
2.12 0.73 0.774 36.7 20.8 15.9 0.000009 0.014 4.02 1.40 2.814
2.890 80.9 20.8 60.1 0.403 0.000
5.515 0.007 4.12 1.44 2.966 81.3 20.8 60.5 0.000022 0.073 8.00 2.90 11.600
12.444 240.8 23.9 216.9 1.822 0.000
5.623 0.148 8.60 3.09 13.287 241.5 24.3 217.2 0.000121 0.324 10.61 3.82 20.265
22.516 361.2 22.0 339.2 3.189 0.000
5.585 0.455 11.71 4.23 24.767 360.0 21.8 338.2 0.000206 0.571
11.56 4.16 24.045 26.544
402.9 22.0 380.9 3.660 0.000 5.090 0.658
12.71 4.57 29.042 400.0 23.5 376.5 0.000397 0.719
These data give a measured module efficiency of: %61.2(W) 3.1(W) 6.5442
(W) .6580
Thus there is a measured reduction in the efficiency of the 40 (Ω) module from the first time it was measured. To investigate further, the resistance of the module was measured at each of the hot side contacts to map out the resistance for each of the 47 couples in the module. This was done both for Module 1 and for Module 2 as shown in Figure 6.16.

63
Figure 6.13 Resistance throughout the modules measured at the hot side contacts of each unicouple.
An infrared image of the 40(Ω) Module was used to identify trouble spots in the module as shown in Figure 6.17 below.
Figure 6.14 Infrared image of the 40(Ω) Module with current flow
through the module using a power supply.
As can be seen from Figure 6.17, three unicouples show little to no heat pumping, and 13-16 other unicouples show significantly reduced heat pumping with respect to the rest of the unicouples. Module 1 shows a similar image as shown in Figure 6.18.
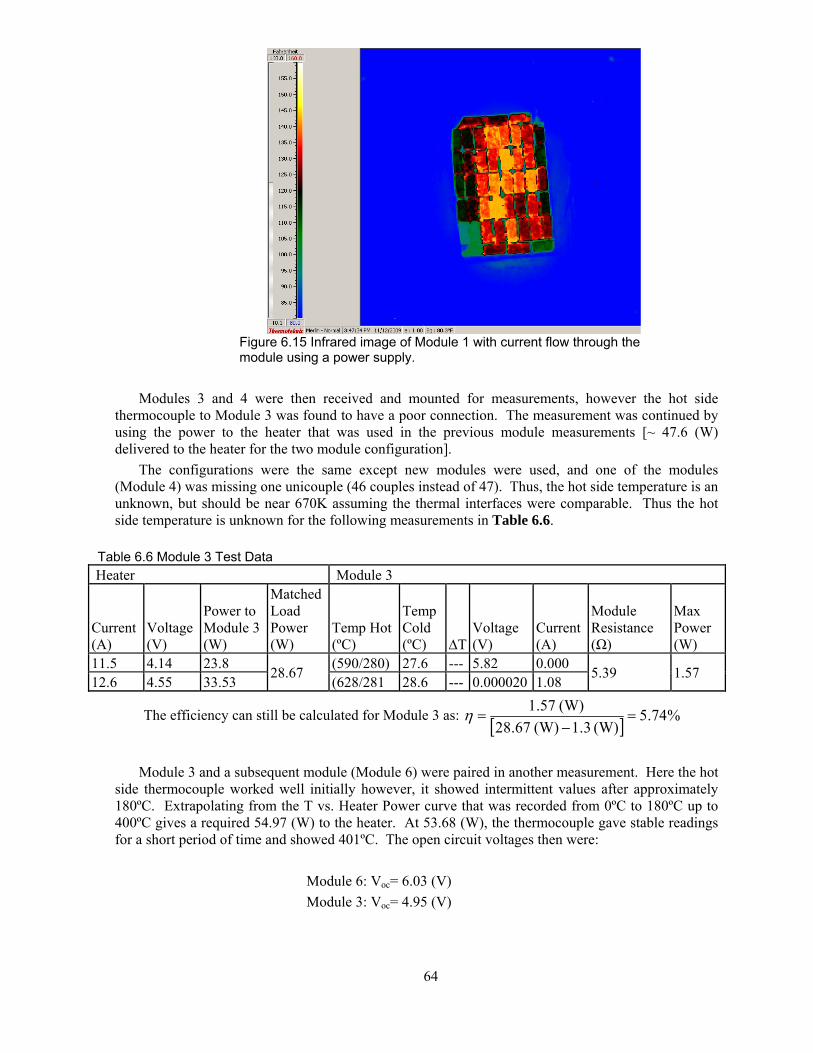
64
Figure 6.15 Infrared image of Module 1 with current flow through the
module using a power supply.
Modules 3 and 4 were then received and mounted for measurements, however the hot side thermocouple to Module 3 was found to have a poor connection. The measurement was continued by using the power to the heater that was used in the previous module measurements [~ 47.6 (W) delivered to the heater for the two module configuration].
The configurations were the same except new modules were used, and one of the modules (Module 4) was missing one unicouple (46 couples instead of 47). Thus, the hot side temperature is an unknown, but should be near 670K assuming the thermal interfaces were comparable. Thus the hot side temperature is unknown for the following measurements in Table 6.6.
Table 6.6 Module 3 Test Data Heater Module 3
Current (A)
Voltage (V)
Power to Module 3 (W)
Matched Load Power (W)
Temp Hot (ºC)
Temp Cold (ºC) T
Voltage (V)
Current (A)
Module Resistance (Ω)
Max Power (W)
11.5 4.14 23.8 28.67
(590/280) 27.6 --- 5.82 0.000 5.39 1.57
12.6 4.55 33.53 (628/281 28.6 --- 0.000020 1.08
The efficiency can still be calculated for Module 3 as: %74.5(W) 3.1(W) 67.82
(W) .571
Module 3 and a subsequent module (Module 6) were paired in another measurement. Here the hot side thermocouple worked well initially however, it showed intermittent values after approximately 180ºC. Extrapolating from the T vs. Heater Power curve that was recorded from 0ºC to 180ºC up to 400ºC gives a required 54.97 (W) to the heater. At 53.68 (W), the thermocouple gave stable readings for a short period of time and showed 401ºC. The open circuit voltages then were:
Module 6: Voc= 6.03 (V)
Module 3: Voc= 4.95 (V)

65
Module 3 shows an open circuit voltage which is lower than previously measured, possibly indicating the first measurement was for a larger temperature gradient.
To obtain the short circuit current from Module 6, after it was short circuited the heater power adjusted to 58.08 (W) where Module 3 Voc= 4.95 (V). Thus the Module 3 open circuit voltage was used as a feedback mechanism for reaching the same temperature gradient as when both modules were open circuited. At this point Module 6 short circuit current, Isc = 1.21 (A) was measured. Thus at matched load, Module 6 gives 0.25*6.03(V)*1.21(A) = 1.824 (W) output.
Heater power at matched load for Module 6 is: (26.84 + 31.24)/2 = 29.04 (W), from which the efficiency can be calculated as:
%56.6(W) 3.1(W) 29.04
(W) .8241
Based on these module measurements we have seen a general increase in the performance of the modules from 2.6% efficiency to over 6.5%. Significant improvements have been seen in the alignment of unicouples and with reductions in the module resistances using compression pressures of approximately 30 psi and at hot side temperatures near 670K. It should be further noted, that the measured cold side temperature for Module 6 for the above results was 95ºC, thus the test conditions were 368K cold side, and 674K hot side. Modeling results for these temperatures gives an expected module efficiency of 7.5% (for zero contact resistance, = 0.0). By adjusting the contact resistance within the model, agreement with the measured 6.56% efficiency occurs for = 0.196. Using the target temperatures of 312K and 670K along with a = 0.196, the model results give a module efficiency of 8.34%.
At the end of the Go/NoGo Decision testing, our team had made significant progress in removing extraneous resistances associated with electrical contacts in the fabricated TE modules. The module resistance at room temperature was 4.9 and it should have been approximately 3.0 in the modules above that achieved 6.56% at a cold-side temperature, Tc= 95 °C.
Table 6.7 shows the TE Module Action Plan that was developed at the end of the Go/NoGo Decision period and Phase 1 showing the recommended actions required for subsequent TE modules fabricated in future efforts. This is part of the recommendations for future work discussed in Section 9. Tellurex has followed this plan after Phase 1 was over and can now fabricate better performing LAST/LASTT TE modules as result of the critical learning and understanding obtained on this Phase 1 SERDP program.
Table 6.7 TE Module Action Plan Performance Issue Current Status / Observation Next Step Action Needed Potentially High Resistance @ Conductor Tab Interfaces
Likely contributes to observed high module resistance
This is strongly connected to refining, improving, and gaining better control of the interface manufacturing process. This has already been improving as Tellurex gains experience with fabrication process.
Potentially High Resistance @ LAST/LASTT/Bismuth Telluride Interfaces
No direct observation at this point, but could be contributing to high module resistance. We also feel that oxygen can play a role in decreasing the quality of this bond.
More work to quantify the resistance (i.e., voltage drops) at this interface. Obtain and implement more sensitive oxygen monitoring equipment in the fabrication process to further minimize oxygen contamination

66
Performance Issue Current Status / Observation Next Step Action Needed during process.
Isolated element / couple electrical shorting
Contributes to low open circuit voltage
Obtain and implement thermal imaging equipment at Tellurex. Create element thermal footprints through powered cooling and establish potential shorting early in fabrication process.
Electrical Resistance Improves Upon Compression
We have observed this in each of the TE modules. We don’t currently understand this phenomenon fully. Generally an effect in the proper direction. Could be related to aging and pressure-derived “healing” of interfaces.
Systematically test a number of TE modules with and without compression. Test resistance after fabrication, then test resistance after a set time period. Then put compression at same temperature conditions as current module tests. Check for controllable changes in resistance and correlate to fabrication processes and impacts.
Recommended Future TE Module Test Plan
Phase 2, Task 2.3 Test plans and data on single TE modules in any follow-on Phase 2
This test plan was our recommended test plan if this program would have moved into Phase 2. Tellurex would have established module performance test capability and performed validation testing on the first-article single TE module. This module would have segmented LAST / Bismuth Telluride n-type elements and LASTT / Bismuth Telluride p-type elements of the design discussed. Deliverables would have been the module performance test data. Tellurex would have provided 5-10 modules from those produced in Task 2.2 to test at MSU. Tellurex envisioned the following TE Device validation effort:
c) Send 5-10 modules to MSU for thermoelectric testing. d) Test module for performance at operating temperature in vacuum environment. (Th
= 400 °C, Tc = 39 °C) e) Ramp module temperatures up and down to determine mechanical and electrical
stability in a simulated real-world environment. f) Repeat testing of sample of ~5-10 modules to determine variability in fabrication
techniques to validate performance characteristics prior to system assembly.
Testing Environment
In SERDP meeting discussions between the developmental parties, it was decided that the “simulated real-world environment” be changed to a vacuum or inert gas environment for these first tests. In the original SERDP task documentation it was noted in Task 2.2 that the module will be encapsulated with aerogel or other determined anti-sublimation material. In the course of development it was discussed among the parties that oxygen may play a detrimental role regarding potential degradation of the module. Being the first modules ready for test in the program, it was felt that so as not to obscure test results, it was more appropriate to test these first modules in a non-oxygen environment. This being the case, Tellurex is not equipped to test at the required temperatures in a non-oxygen environment.
Testing modules for performance
Module performance testing would have been performed at Michigan State University where apparatus exists to test modules in a non-oxygen environment. This test system in described above in this section. It was planned that the test would have provided data on open circuit voltage, closed circuit current (at matched load), matched load voltage and electrical resistance. Conversion

67
efficiency of heat to electrical energy would have been calculated by noting the electrical energy powering a resistance heater and subtracting the passive losses, then using this quantity as the denominator with the closed circuit voltage and current as the numerator. The passive losses include heat flow through thermocouple wires, module power lead wires, thermal losses that occur on the non-module side of the heater and thermal losses from the module hot side to cold side through the insulation between the legs of the module. The cold side will be maintained at 39ºC. The module hot side would have been ramped up incrementally in ten (10) ~36ºC steps up to 400ºC. The module then would have been ramped down in the same manner back to 39ºC. After stabilization at the set temperatures, heater energy would have been recorded along with open circuit voltage (needed to set matched load at ~50% of open circuit voltage), closed circuit voltage at matched load and closed circuit current at matched load.
Our project team also would have performed power output vs. load resistance characterization at Thot = 400°C and Thot =~347°C, while maintaining Tcold = 39°C, to establish the module power – load and current-voltage curves. The second hot side temperature (~347°C) was selected to match approximately a 75% load condition on a 60-kW Tactical Quiet Generator (TQG). Our team then would have compared the experimental power –load and current voltage data with TE module model predictions to confirm module performance behavior and understandings.
Ramp module temperatures up and down to determine mechanical and electrical stability in a simulated real-world environment
From information acquired through the U.S. Army RDECOM, it was determined that a device operating under battlefield conditions would be required to perform numerous thermal cycles. This first thermal cycle testing on this SERDP project would have used up to 200 thermal cycles to gain our first thermal fatigue and module thermal cycling data while staying within initial project budgets. Performing more thermal cycles would require more project funding in the future. The thermal cycling tests by Dr. Case at MSU used the 200 cycle standard. Therefore, thermal cycling testing of the module was scheduled for 200 cycles and is consistent with RDECOM’s guidance, available SERDP project budgets, and Dr. Case’s testing. The ramp rate of the module was set by the heat up of the hot side of the module as modeled by PNNL given the exhaust temperatures from the battlefield generator, exhaust flow rates and microchannel heat exchanger effectiveness. Expected ramp rate for the module is 39ºC to 400ºC in ten minutes or a ramp rate of ~ 0.60ºC/second. Again, given the concern about oxygen in the system, it was decided that MSU would have performed this test in a non-oxygen environment. Therefore, if achievable by the test equipment, the planned test would have ramped up in 10 minutes, hold for 5 minutes, then ramped down in 30 minutes. For 200 continuous cycles, the duration of the test would have been up to 150 hours unless the module fails (catastrophic) prior to 200 cycles. During the 5 minute hold period at the top of the cycle, closed circuit current was to be measured to determine if resistance of the module was changing, indicating degradation of the module. Intermittently throughout the test, open circuit voltage was to be tested. This would help determine if the failure mechanism is physical fracturing of the module legs or their electrical contacts or degradation of the thermoelectric material. On completion of the test, the module would have been demounted and visually inspected.
7. Microchannel Heat Exchanger Design Studies
Phase 1 work has defined the microchannel heat exchanger designs for both the TE device hot-side and cold-sides that can integrate into the overall system design discussed in Section 8. The exhaust flow conditions for 30-kW and 60 kW “Model A” TQG configurations, supplied early in our Phase 1 project by the U.S. Army RDECOM, have driven our hot-side microchannel heat exchanger design. Those conditions were identified by RDECOM as:
30 kW Tactical Quiet Generator - Flow Rate: 445 cfm; Temperature: 898 F (481 C) at Outlet of Turbo Charger 60 kW Tactical Quiet Generator - Flow Rate: 697 cfm; Temperature: 945 F (507 C) at Outlet of Turbo Charger

68
These conditions are the flow conditions for Model 'A' TQG's, which are the TQG's most prevalent at RDECOM, Ft. Belvoir, VA. U.S. Army RDECOM (Chris Wildmann – CERDEC Ft. Belvoir, VA; Joseph Antonette – Aberdeen Test Center) has confirmed this during our work in Phase 1. Our work during this No/NoGo period has identified a second set of exhaust flow conditions that are associated with Model 'B' TQG's, which are most prevalent at the Aberdeen Test Center. The exhaust flow conditions for Model 'B' TQG's using low-sulfur fuel are identified as shown in Table 7.1 and Table 7.2.
The need to maintain TE cold-side temperatures in the 310 K – 320 K range to achieve our desired TE module efficiencies has driven our cold-side microchannel heat exchanger design. Our work has explored and quantified the heat fluxes and pressure drops attainable in three types of hot-side microchannel heat exchanger designs; flat-plate parallel-fin designs, rectangular honeycomb designs, and hexagonal honeycomb designs. Figure 7.1 shows heat flux vs. pressure drop characteristics and the established design point (q” = 5.63 W/cm2; =0.935) for the 30 kW TQG flow conditions. This work has focused on the better performing and more manufacturable rectangular honeycomb designs characterized in Figure 7.1. The hot-side microchannel designs identified all fit within an envelope of 7.6 cm long X 2.1 cm deep X 1.52 cm tall, with a 7.6 cm X 2.0 cm heat transfer footprint on each TE hot-side. The hot side heat exchanger is intended to transfer the heat fluxes shown in Figure 7.1 to each 7.6 cm X 2.0 cm side so that this operates as a dual-direction design. Similar design analyses have quantified the heat fluxes and pressure drops attainable under the 60 kW TQG flow conditions using a rectangular honeycomb design. Figure 7.2 shows the heat flux vs. pressure drop characteristics and the established design point (q” = 12.0 W/cm2; =0.936) for the 60 kW TQG flow conditions. The hot-side heat exchanger designs in both Figure 7.1 (30 kW TQG) and Figure 7.2 (60 kW TQG) have the same 7.6 cm X 2.0 cm heat transfer footprint, so the design can actually move between the 30 kW TQG and 60 kW TQG design conditions quite rapidly in our TEG system designs. Figure 7.3 shows the exploratory hot-side microchannel design that would be used for test validation of the hot side design. Figure 7.3 also shows the test system designed for testing this hot-side exploratory design.
Figure 7.1 Hot-Side Heat Exchanger Design Cases for 30 kW TQG
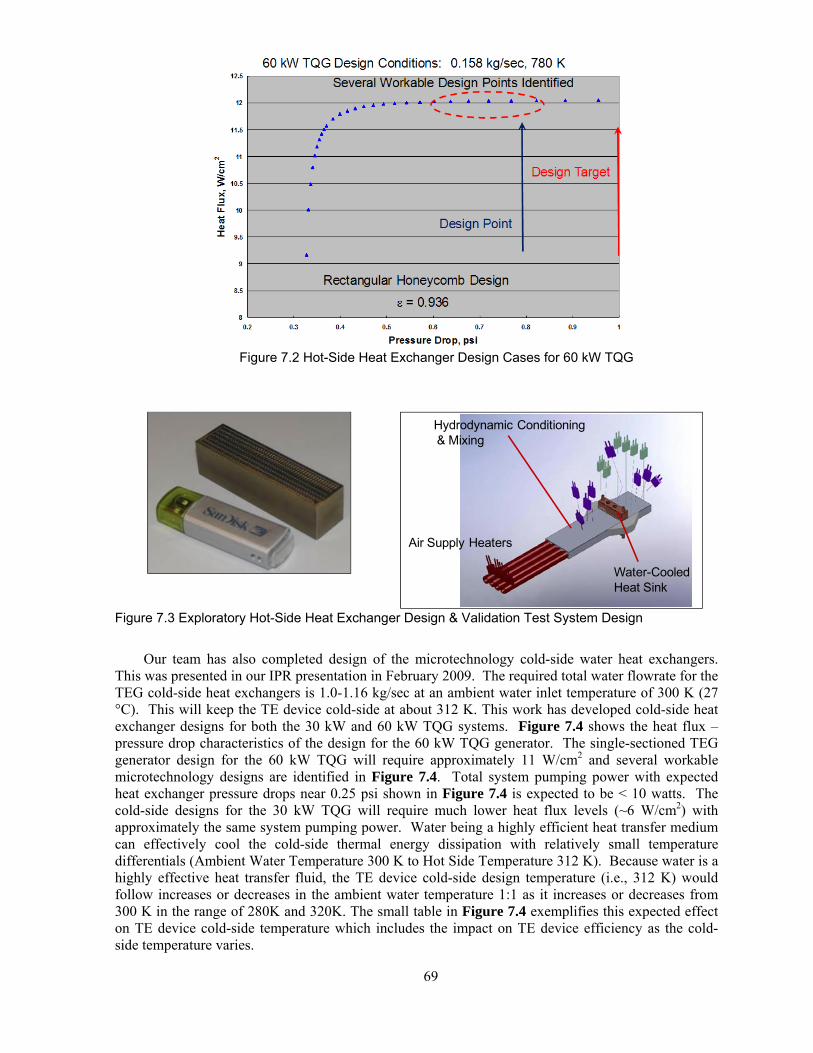
69
Figure 7.2 Hot-Side Heat Exchanger Design Cases for 60 kW TQG
Figure 7.3 Exploratory Hot-Side Heat Exchanger Design & Validation Test System Design
Our team has also completed design of the microtechnology cold-side water heat exchangers. This was presented in our IPR presentation in February 2009. The required total water flowrate for the TEG cold-side heat exchangers is 1.0-1.16 kg/sec at an ambient water inlet temperature of 300 K (27 °C). This will keep the TE device cold-side at about 312 K. This work has developed cold-side heat exchanger designs for both the 30 kW and 60 kW TQG systems. Figure 7.4 shows the heat flux – pressure drop characteristics of the design for the 60 kW TQG generator. The single-sectioned TEG generator design for the 60 kW TQG will require approximately 11 W/cm2 and several workable microtechnology designs are identified in Figure 7.4. Total system pumping power with expected heat exchanger pressure drops near 0.25 psi shown in Figure 7.4 is expected to be < 10 watts. The cold-side designs for the 30 kW TQG will require much lower heat flux levels (~6 W/cm2) with approximately the same system pumping power. Water being a highly efficient heat transfer medium can effectively cool the cold-side thermal energy dissipation with relatively small temperature differentials (Ambient Water Temperature 300 K to Hot Side Temperature 312 K). Because water is a highly effective heat transfer fluid, the TE device cold-side design temperature (i.e., 312 K) would follow increases or decreases in the ambient water temperature 1:1 as it increases or decreases from 300 K in the range of 280K and 320K. The small table in Figure 7.4 exemplifies this expected effect on TE device cold-side temperature which includes the impact on TE device efficiency as the cold-side temperature varies.
Air Supply Heaters
Water-Cooled Heat Sink
Hydrodynamic Conditioning& Mixing

70
Figure 7.4 Cold-Side Microtechnology Heat Exchanger Designs
Have High Heat Transfer and Low Pressure Drop
PNNL has evaluated the impact on heat exchanger performance resulting from the much lower exhaust temperatures of the 60-kW Model 'B' TQG's. At the 100% Load Condition the 60 kW Model 'B' TQG has an exhaust temperature of 703.4 F (373 °C = 646 K). The heat fluxes for different TE hot-side conditions at the 100% Load Condition of this Model 'B' TQG are given in Table 7.3.
This compares to hot-side heat exchanger heat fluxes of approximately 11-12 W/cm2 in the 60 kW Model 'A' TQG exhaust conditions at full load (i.e., Texhaust = 507º C = 780 K). Tellurex and Michigan State University have determined that the effect of these lower TE hot side temperatures would be to reduce the TE conversion efficiency to approximately 7% in the Model ‘B’ TQG’s. The effect of these lower exhaust temperatures on both heat exchanger performance and TE device conversion efficiency is therefore quite dramatic and would strongly impact TE generator system performance.
Table 7.1 30-kW Model 'B' Set Exhaust Temperatures
Load Condition
Exhaust Temperature
Ambient Temperature
100% 689.0F (638 K) 54.9F
75% 593.7F (585 K) 75.4F
50% 463.7F (513 K) 62.9F
25% 362.7F (457 K) 45.7F
Table 7.2 60-kW Model 'B' Set Exhaust Temperatures
Load Condition
Exhaust Temperature
Ambient Temperature
100% 703.4F (646 K) 58.2F
75% 612.4F (595 K) 75.0F
50% 483.2F (524 K) 66.2F
25% 382.1F (468 K) 55.7F

71
Table 7.3 Projected Hot-Side Heat Exchanger Heat Fluxes Supplied to TE Module in 60-kW Model 'B' TQG (Exhaust Temperature of 703.4 F (373 °C = 646 K)
TE Hot Side Temperature Hot-Side Heat Flux Provided to TE Module
290 °C (563 K) 7.7 W/cm2
300 °C (573 K) 6.8 W/cm2
310 °C (583 K) 5.9 W/cm2
8. Thermoelectric System Analysis The project goal was to develop a modular, portable TE generator design for a variety of
battlefield heat sources, such as diesel generators, incinerators, and mobile kitchens. This represented a wide spectrum of possible design conditions, so 30 kW, and later 60 kW, Tactical Quiet Generators (TQG) were selected as prototype demonstration vehicles to establish a reasonable series of design conditions that would allow our team to: 1) create a representative design that could be flexible and robust enough to satisfy a wide range of possible battlefield heat sources, and yet 2) create a design that could potentially satisfy the design requirements of a common and wide-spread battlefield heat source.
Our team has investigated single-section and dual-section design options, with a variety of TE material combinations in segmented designs in the first section and segmented and non-segmented designs in the second section, for both a 30 kW and a 60 kW TQG. The TE system design sectioning is schematically depicted in Figures 8.1 and 8.2 below Tables 8.1 and 8.2. The TE material combinations investigated are some of the more relevant ones analyzed in Table 3.4 and Table 3.5. The ‘Model A’ 30 kW and 60 kW TQG’s have quite different exhaust flow conditions at full load power conditions as shown below:
30 kW TQG: Exhaust Mass Flow Rate = 0.097 kg/second; Exhaust Temperature After Turbo Charger = 481 °C
60 kW TQG: Exhaust Mass Flow Rate = 0.158 kg/second; Exhaust Temperature After Turbo Charger = 507 °C
The 60 kW TQG, being a higher power TQG, has significantly higher exhaust flow enthalpy to recover, although there also is substantial flow enthalpy available in the 30 kW TQG. Because flow conditions are different in the two TQG’s the available energy recovery, conversion efficiency, and power possible will be different. Our work with both generators has shown the design performance differences using the two options and elucidated what the opportunities are in each case. The 60 kW TQG provides higher conversion efficiency opportunities and higher power output because its exhaust temperatures are higher and flow enthalpy is higher and it provides the best opportunity for achieving our system goals. However, the 30 kW TQG does provide deployment opportunities for our TEG system design at somewhat lower performance levels than the project goals of 1.6 kW @ 10% conversion efficiency. Since the project ultimately desired to deploy the TEG system across a range of TQG’s, the work with both TQG’s was highly beneficial because it provided two deployment pathways for the system design, which is versatile enough to accommodate both deployment options. This is highly beneficial to the Army in the long-term as it even provides a design pathway into 100 kW TQG deployment.
Table 8.1 shows the assessment of the TEG section thermal flows and power outputs from the exhaust flow conditions in a 30 kW TQG at full load power using the material combinations and case numbers directly from Table 3.4 and Table 3.5. The thermal flows in each section are based on the hot-side heat exchanger designs discussed in Section 7, which have projected heat exchanger effectiveness = 0.935 as indicated in the table. This work has investigated the projected performance of early LAST/LASTT materials developed in our project against Zhou-process n-type LAST / Best Tellurex p-type LASTT materials, TAGS-85 p-type/PbTe n-type materials, TAGS-85 p-type /

72
BaxYbyCo4Sb12 n-type skutterudite and LASTT p-type / BaxYbyCo4Sb12 n-type skutterudite materials. In general, this project investigated segmented designs in the 1st section (hot-side section) in all cases where the given material combination is segmented with high-performance Bi2Te3 alloys from Tellurex. In the 2nd section the project investigated segmenting the given material combinations (material case numbers in Table 3.4 and Table 3.5) or using entirely high-performance Bi2Te3 alloys from Tellurex. Figure 8.1 shows the planned material segmenting in both sections with the anticipated hot-side, cold-side, and flow temperatures in the sectioned TEG design. The TE device efficiencies for each section in Table 8.1 come right from the corresponding material analysis results in Table 3.4 and Table 3.5. In general, each case investigated shows that when considering parasitic thermal losses the system performance falls short of the project goals of 1.6 kW @ 10% conversion efficiency when considering LAST / LASTT material options, although this work projects about 1.3-1.4 kW @ 8-9% total system conversion efficiency. This shortfall is due primarily to TE material performance, primarily n-type LAST being below where it needs to be. The TAGS-85 / PbTe material options (material cases 7 and 21) show a slight improvement to 1.55 kW at 9.2 % efficiency, but still short of the project goals. The Best Tellurex LASTT p-type / BaxYbyCo4Sb12 n-type skutterudite materials (material case 15 and 30) also fall short of the project goals at 1.47 kW and 8.8% efficiency. This is no better than Zhou-process n-type LAST / Best Tellurex p-type LASTT materials (material cases 8 and 25) that this project targeted. The highlighted analysis rows (yellow, blue, brown and green) show the important comparisons within this project given the prohibited costs of TAGS-85 materials discussed in Section 3. This project concluded that any material combination utilizing TAGS-85 is not cost-effective for this project or anticipated Army applications within TQG’s because of the large cost penalty associated with TAGS materials discussed above.
There is an additional point to make about the design analysis point shown in Table 8.1 that was pointed out in the IPR presentation in Feburary 2009. The selected design point used in Table 8.1 provides a TE hot-side condition of Thot = 670 K with a TE cold-side condition of Tcold = 312 K in the 1st TE section. This design point was used because it allows the hot-side heat exchangers to extract the largest amount of energy in the 1st section while simultaneously producing TE hot-side and cold- side conditions that allow the conversion efficiency of near 10%. The hot-side heat exchanger design is actually demonstrating highly effective heat transfer ( = 0.935) in providing the largest heat transfer and simultaneously providing the Thot = 670 K. Figure 8.1 shows how closely the exhaust temperature exiting the 1st section approaches Thot = 670 K. The heat transfer could not be much better than that shown for the 1st section in Figure 8.1. This 1st section outlet condition then dictates the inlet thermal conditions to the 2nd TE section. Similar to the 1st section, the heat transfer in the 2nd TE section is highly effective ( = 0.935) in providing the largest heat transfer while simultaneously providing the highest engineering-feasible hot-side temperature Thot = 585 K in the 2nd section to give the best conversion efficiency. As pointed out in the IPR presentation in both sections, there is a tradeoff in maximum possible conversion efficiency and heat transfer (and therefore power output) as we go to potentially higher hot-side temperatures on the TE device. If one selected a higher hot-side temperature in the 1st section to create higher 1st section conversion efficiency, this would necessarily reduce the heat transfer possible in the 1st section, thereby reducing the power output created at this higher conversion efficiency. This also requires the 2nd section to produce more power at the fundamentally lower conversion efficiency because it is the lower temperature section, consequently reducing the overall system conversion efficiency.
Table 8.2 shows the assessment of the TEG section thermal flows and power outputs from the exhaust flow conditions in a 60 kW TQG at full load power. Once again the thermal flows in each section are based on hot-side heat exchanger designs discussed in Section7, which have heat exchanger effectiveness = 0.936 as indicated in the table. This work investigated the projected performance of the same material combinations as in the 30 kW TQG case in Table 8.1. In general, the project looked at segmented designs in the 1st section (hot-side section) in all cases where the given material combination is segmented with high-performance Bi2Te3 alloys from Tellurex. In the 2nd section the project looked at segmenting the given material combination or using entirely high-performance Bi2Te3 alloys from Tellurex. The TE device efficiencies for each section in Table 8.2 come right from the corresponding material analysis results in Table 3.4 and Table 3.5. Figure 8.2
73
shows the planned material segmenting in both sections with the anticipated hot-side, cold-side, and flow temperatures in the sectioned TEG design. This design would expect to provide nearly the same hot-side and cold-side temperatures to the TE devices. The main benefit that the 60 kW TQG provides relative to the 30 kW TQG is to give higher exhaust inlet temperatures and higher heat flows through the hot-side heat exchangers which translates into more TEG power output.

74
Table 8.1 SERDP Dual-Section TEG Design – 30 kW Tactical Quiet Generator Conditions 30kW TQG Full Load Flow Conditions – Mass Flow=0.097 kg/sec, Texhaust = 754.2 K, Tambient (water) = 300 K. Qh1, Qh2 = Thermal Energy Provided to Hot Side of Section 1and Section 2 Minus Parasitic Thermal Losses, Respectively P1, P2 = Design Power Outputs in Section 1 and 2, Respectively; 1, 2 = TE Conversion Efficiency in Section 1 & Section 2 Qhtotal = Total Thermal Energy Provided in Hot Side Heat Exchangers for Both Sections
1st Section Analysis – Th=670K, Tc=312 K 2nd Section Analysis – Th=585 K, Tc = 312 K
Material Case # / TE Materials
1-Segmented (%)
Qh1 [W] =0.935
P1 [W]
total Material Case # / TE Materials
2 (%)
Qh2 [W] =0.935
P2 [W]
Ptotal [W]
Qhtotal [W]
total (%)
2. Cast LAST & Bi2Te3 Materials – Best
12.1 0.9*8220 892.9 10.9 Bi2Te3 (only) 28.Best Tellurex LAST/LASTT & Bi2Te3 (Segmented)
7.37 8.34
0.9*8603 0.9*8603
570.6 645.8
1463.6 1538.7
16823 8.7 9.1
10. Cast LAST & Bi2Te3 Materials – Average
10.5 0.9*8220 778.3 9.5 Bi2Te3 (only) 28.Best Tellurex LAST/LASTT & Bi2Te3 (Segmented)
7.37 8.34
0.9*8603 570.6 645.8
1348.9 1424.1
16823 8.0 8.5
14. SERDP Project Average LAST/LASTT Materials
9.5 0.9*8220 702.8 8.6 Bi2Te3 (only) 28.Best Tellurex LAST/LASTT & Bi2Te3 (Segmented)
7.37 8.34
0.9*8603 570.6 645.8
1273.4 1348.6
16823 7.6 8.0
12. SERDP Project Best LAST/LASTT & Bi2Te3 Materials
10.1 0.9*8220 747.2 9.1 Bi2Te3 (only) 28.Best Tellurex LAST/LASTT & Bi2Te3 (Segmented)
7.37 8.34
0.9*8603 570.6 645.8
1317.8 1393.0
16823 7.8 8.3
8. LAST/LASTT With Zhou-based Process on n-type, Best Tellurex LASTT & Bi2Te3 Materials
10.9 0.9*8220 806.4 9.8 Bi2Te3 (only) 25. Zhou Process on n-type & Best Tellurex LASTT & Bi2Te3 (Segmented)
7.37 8.76
0.9*8603 570.6 678.3
1377.0 1484.7
16823 8.2 8.8
7. TAGS-85/PbTe & Bi2Te3 Materials
11.4 0.9*8220 841.9 10.2 Bi2Te3 (only) 21. TAGS-85 /PbTe & Bi2Te3 Materials
7.37 9.2
0.9*8603 570.6 712.3
1412.5 1554.2
16823 8.4 9.2
4. n-type BaxYbyCo4Sb12 Skutterudites & TAGS-85 & Bi2Te3 Materials
11.7 0.9*8220 864.8 10.5 Bi2Te3 (only) 28.Best Tellurex LAST/LASTT & & Bi2Te3 (Segmented)
7.37 8.34
0.9*8603 570.6 645.8
1435.4 1510.6
16823 8.5 9.0
15. n-type BaxYbyCo4Sb12 Skutterudites, Best Tellurex LASTT & Bi2Te3 Materials
10.7 0.9*8220 791.6 9.6 Bi2Te3 (only) 30. n-type BaxYbyCo4Sb12 Best Tellurex LASTT & Bi2Te3 (Segmented))
7.37 8.8
0.9*8603 570.6 681.4
1362.2 1472.9
16823 8.1 8.8
Material Case Numbers Taken from Tables 3.4 and 3.5

75
First Section Conditions Second Section Conditions
Figure 8. 1 Schematic Representation of the Sectioned Design with Anticipated Thermal Conditions (30
kW TQG Design Option)
Once again the highlighted analysis rows (yellow, blue, brown and green) show the important comparisons within the project given the prohibited costs of TAGS-85 / PbTe materials discussed in Section 3. These system analyses and comparisons in Table 8.2 show important opportunities with the 60 kW TQG and its exhaust flow conditions. First, it appears that a single-section system design using Zhou-process n-type LAST / Tellurex p-type LASTT materials (material case #8) and accounting for parasitic heat losses can very nearly meet our project goals of 1.6 kW @ 10% conversion efficiency. This is why the Zhou-process n-type LAST materials were targeted in TE material studies discussed in Section 3. This case is highlighted with bold outline in Table 8.2 and in this case predicts about 1725 W @ 9.8% efficiency. The maximum possible conversion efficiency and heat transfer (and therefore power output) once again tradeoff as one goes to potentially higher hot-side temperatures on the TE device. If one selected a slightly higher hot-side temperature in the 1st section, such as Thot = 685 K, to create higher 1st section conversion efficiency, this would give a TE conversion efficiency of 1 = 11.3%. This reduces the heat transfer possible in the 1st section to 15.19 kW (because the heat exchanger temperature differential decreases), thereby reducing the power output created at this higher conversion efficiency to 1545 W compared to the 1725 W at Thot = 670 K.
312K
670K
Bi2Te3-xSex
N-typehot
BixSb2-xTe3
P-typehot
Ln1
Ln2
Lp1
Lp2
TjnTjp 5 (mm)
Tjn
312K
585K
Bi2Te3-xSex
N-typehot
BixSb2-xTe3
P-typehot
Ln1
Ln2
Lp1
Lp2
Tjp 5 (mm)

76
Table 8.2 SERDP Dual-Section TEG Design – 60 kW Tactical Quiet Generator Conditions
60 kW TQG Full Load Flow Conditions - Mass Flow = 0.158 kg/sec, Texhaust = 780.2 K, Tambient (Water) = 300 K 10% Thermal Losses in Each Section Included in These Calculations Qh1, Qh2 = Thermal Energy Provided to Hot Side of Section 1 and Section 2 Minus Parasitic Thermal Losses, Respectively P1, P2 = Design Power Outputs in Section 1 and Section 2, Respectively 1, 2 = TE Conversion Efficiency in Section 1 and Section 2, Respectively Qhtotal = Total Thermal Energy Provided in Hot Side Heat Exchangers for Both Sections
1st Section Analysis – Th = 670 K, Tc = 312 K 2nd Section Analysis – Th=585 K, Tc = 312 K Material Case # / TE Materials
1-Segmented (%)
Qh1 [W] =0.936
P1Seg-mented[W]
total [%]
Material Case # / TE Materials
2 (%)
Qh2 [W] =0.936
P2 [W]
Ptotal [W]
Qhtotal [W]
total (%)
2. Cast LAST & Bi2Te3 Materials – Best
12.1 .9*17585 1910.3 10.9 Bi2Te3 (only) 28.Best Tellurex LAST/LASTT & Bi2Te3 (Segmented)
7.37 8.34
.9*14398 .9*14398
955.0 1080.7
2865.3 2991.0
31983 31983
9.0 9.4
10. Cast LAST Materials – Average
10.5 .9*17585 1664.9 9.5 Bi2Te3 (only) 28.Best Tellurex LAST/LASTT & Bi2Te3 (Segmented)
7.37 8.34
.9*14398 955.0 1080.7
2619.9 2745.6
31983 8.2 8.6
14. SERDP Project - Average LAST/LASTT Materials
9.5 .9*17585 1503.5 8.6 Bi2Te3 (only) 28.Best Tellurex LAST/LASTT & Bi2Te3 (Segmented)
7.37 8.34
.9*14398 955.0 1080.7
2458.5 2584.2
31983 7.7 8.1
12. SERDP Project - Best LAST/LASTT & Bi2Te3 Materials
10.1 .9*17585 1598.5 9.1 Bi2Te3 (only) 28.Best Tellurex LAST/LASTT & Bi2Te3 (Segmented)
7.37 8.34
.9*14398 955.0 1080.7
2553.5 2679.2
31983 31983
8.0 8.4
8. SERDP Project LAST/LASTT With Zhou-based Process on n-type, Best Tellurex LASTT & Bi2Te3 Materials
10.9 .9*17585 1725.1 9.8 Bi2Te3 (only) 25.Zhou Process on n-type, Best Tellurex LASTT & Bi2Te3 (Segmented))
7.37 8.76
.9*14398 955.0 1135.1
2680.1 2860.2
31983 31983
8.4 8.9
7. TAGS-85/PbTe & Bi2Te3 Materials
11.4 .9*17585 2001.2 10.2 Bi2Te3 (only) 21. TAGS-85 /PbTe & Bi2Te3 Materials
7.37 9.2
.9*14398 955.0 1192.2
2956.2 3193.4
31983 31983
9.2 10.0
4. n-type BaxYbyCo4Sb12 Skutterudites & TAGS-85 & Bi2Te3 Materials
11.7 .9*17585 2055.7 10.5 Bi2Te3 (only) 28.Best Tellurex LAST/LASTT & Bi2Te3 (Segmented)
7.37 8.34
.9*14398 955.0 1080.7
3010.7 3136.4
31983 9.4 9.8
15. n-type BaxYbyCo4Sb12 Skutterudites, Best Tellurex LASTT & Bi2Te3 Materials
10.7 .9*17585 1693.4 9.6 Bi2Te3 (only) 30. n-type BaxYbyCo4Sb12 Best Tellurex LASTT & Bi2Te3 (Segmented))
7.37 8.8
0.9*14398 955.0 1140.3
2648.4 2833.7
31983 8.3 8.9
Material Case Numbers Taken From Table 3.4 and Table 3.5

77
First Section Conditions Second Section Conditions
Figure 8.2 Schematic Representation of the Sectioned Design with Anticipated Thermal Conditions (60
kW TQG Design Option)
Although this satisfies the project objective of a system efficiency of 10.2% after accounting for heat losses, this does not satisfy the power goal of 1.6 kW. The project team therefore concluded that hot side temperatures of 670 - 678 K in a single-sectioned design with a 60 kW TQG is the proper choice to satisfy the project objectives. The 60 kW TQG conditions do not necessarily lead to substantial increase of the TE device temperature differential, although small hot-side temperature adjustments (i.e., few degrees K) are possible with the 60 kW TQG and would be helpful without compromising the 1.6 kW power goal. More importantly it does allow the design to significantly increase the temperature differential across the hot-side heat exchanger and the amount of thermal energy input to the TE devices. This design refinement was simply not possible with the 30 kW TQG option. Table 8.2 also shows the performance using TAGS-85 / PbTe materials (material case #7) is only slightly better than using Zhou-process n-type LAST / Tellurex p-type LASTT materials (material case 8), and the Best Tellurex LASTT p-type / BaxYbyCo4Sb12 n-type skutterudite materials (material case 15) are slightly below that benchmark. As discussed above in Section 3 the project team spent much effort after the IPR in February 2009 targeting the Zhou-process n-type material and the HL LAST n-type material performance for the TEG system design on this project.
It is also clear in Table 8.2 that a dual-section design for the 60 kW TQG has the opportunity to produce about 2860 W at near 9% total system conversion efficiency. Thus, a dual-section TEG design in the 60 kW TQG has the opportunity to produce much more power than the project goal at attractive conversion efficiencies because the exhaust flow enthalpy is much higher. This is a
312K
670K
Bi2Te3-xSex
N-typehot
BixSb2-xTe3
P-typehot
Ln1
Ln2
Lp1
Lp2
TjnTjp 5 (mm)
Tjn
312K
585K
Bi2Te3-xSex
N-typehot
BixSb2-xTe3
P-typehot
Ln1
Ln2
Lp1
Lp2
Tjp 5 (mm)
78
potential long-term benefit to the Army in seeking to give them various deployment options with this system.
Figure 8.3 shows the TEG system design developed in our Phase 1 work. This system design is approximately 27 cm diameter x 23-30 cm length (Not counting the exhaust stream inlet flange). The project team estimated the weight of the TEG system for a 60 kW TQG design at approximately 46-54 lbs (20.9 – 24.5 kg). This includes all the microtechnology heat exchangers, the TE devices, the plumbing and manifold hardware, and the compressive structural support. The design shown in Figure 8.3 has 6 separate layers with each layer comprising one dual-direction hot-side heat exchanger, two TE module layers and one cold-side heat exchanger. The layer build-up is shown in Figure 8.4. The length and weight range are due to the fact that our modular design could expand from 6 separate layers to 8 separate layers due to TE module packing factor variations. Figure 8.4 also shows the internal design of the machined ceramic that serves several purposes, such as thermal insulation, flow manifolding, and structural support between adjacent layers.
PNNL and Tellurex designed the TE modules, interfaces, and TEG to allow for the anticipated thermal expansions while minimizing the resulting thermally-induced structural stresses. PNNL has investigated the axial, radial, and circumferential thermal expansion in our Single-Section TEG system design for 60 kW TQG applications shown in Figure 8.3 A and B. This SolidWorks model in Figure 8.3 was the basis for the current thermal expansion analyses. The total axial expansion is expected to be 0.1 cm (0.041 inch) and will be accommodated by stainless steel compression springs at the ends of the system that will maintain adequate structural compression of the system. The radial expansion in the hot side heat exchangers is expected to be 0.012 cm (0.005 inch). The circumferential expansion in each hot-side heat exchanger is expected to be 0.0486 cm (0.019 inch). The expected TE module expansions were shown in Figures 8.5, 8.6 and 8.7. The circumferential expansion and radial expansions in the TE module are expected to be 0.0179 cm (0.007 inch) and 0.007 cm (0.0028 inch), respectively. The SolidWorks model in Figure 8.3 was the foundation for our structural analyses and thermal fatigue structural studies in Section 5 supporting and leveraging the thermal stability studies in Section 4.
The design would use GRAFOILTM and thin Aluminum Nitride dielectric interfaces between the TE device and hot side heat exchanger that are designed to accommodate the differential expansions. Figure 8.8 shows the typical layup and positioning of the GRAFOILTM and aluminum nitride (AlN) dielectric interfaces between the TE devices and the hot- and cold-side heat exchangers. The thin AlN dielectric interfaces are only required on the TE device hot-side and are applied to the stainless steel heat exchanger surfaces to provide the necessary electrical isolation between p-type and n-type materials and couples in the TE device. This thin AlN dielectric layer only needs to be about 6-7 µm thick after appropriate surface polishing of the stainless steel surfaces to provide the required electrical isolation. Table 8.3 shows the measured breakdown voltage for different AlN thicknesses determined in PNNL and Oregon State University laboratory tests. The only reason thicknesses of 6.5 µm showed erratic breakdown performance is that the stainless steel surfaces were not polished beforehand; a deficiency that was easily fixed in subsequent tests. Our system would not be designed for voltages over 50 volts, so thicknesses of about 6.5 – 7.0 µm would work fine and these can be routinely applied and controlled in PNNL sputtering systems.

79
(A)
(B)
Assembly Threaded rods (8) w/springs. Cooling modules built into rings for each layer. Water flow Blue pipes: 4 inlet tubes. Red pipes: 4 discharge tubes.
Figure 8.3 Single-Section Thermoelectric Generator System for 60 kW TQG Applications
Figure 8.4 Single Layer Build-Up in Thermoelectric Generator System for 60-kW TQG
RadialExhaust Flow
Exhaust Gas In
Machined Ceramic• Thermal Insulation• Flow Manifolding• Structural Support• SiO2/SiC Composition

80
Figure 8.5 Y-Direction (Radial) Thermal Expansion Displacements in TE Modules Within TE Generator
System (Units are mm, Symmetric Half-Module Analysis)
Figure 8.6 X-Direction (Circumferential) Thermal Expansion Displacements in TE Modules Within TE
Generator System. (Units are in mm, Symmetric Half-Module Analysis)
Figure 8.7 Z-Direction (Axial) Thermal Expansion Displacements in TE Modules Within TE Generator
System. (Units are in mm)
Y-Displacement (Radial)

81
Figure 8.8 GRAFOILTM / Aluminum Nitride Interface Layup in TE Generator Design
Table 8.3 Voltage Breakdown Characteristics of Various AlN Coatings on Stainless Steel
Projected TE Generator System Performance in Model A 60 kW Conditions
TQG’s in battlefield environments generally operate much of the time at load conditions below full load output and spend only a fraction of their operating time (approximately 16%) at full load conditions. The TQG generator exhaust temperature varies as function of load conditions as shown for the ‘Model B’ TQG in Table 7.1 and Table 7.2, generally decreasing as percentage of full load condition decreases. The exhaust temperature of ‘Model A’ TQG’s also decreases as the generator operates at load conditions below full load. PNNL has investigated the expected power output for various external electrical resistance conditions on the TEG and two different load conditions on the ‘Model A’ 60 kW TQG (100% Full Load and 75% Full Load). This effectively maps out the expected power output as the voltage and current output change as external resistance conditions change. This system analysis was performed to evaluate our project system goals as the 60 kW TQG exhaust conditions change from full load conditions to partial load conditions. The system analysis was performed for the system configuration presented in Figures 8.2 and 8.3. The system-level analysis included the integrated performance effects of the hot-side and cold-side heat exchangers coupled with the TE modules discussed in Sections 5 and 6. This analysis inherently accounts for the thermal performance of the hot-side and cold-side heat exchangers coupled with the thermoelectric performance of TE modules as the TQG exhaust temperatures, and therefore the hot-side and cold-side temperatures and thermal flows change in the TEG system. This analysis is different from the system-level design optimization studies discussed above in Table 8.1 and Table 8.2 in that it is now analyzing the performance envelope of the fixed TE device / heat exchanger designs in the system shown in Figure 8.3 as exhaust temperatures and electrical load resistances vary.
U.S. Army RDECOM was unable to obtain ‘Model A’ 60 kW TQG exhaust temperatures at 75% load conditions from actual testing on TQG in time for this report, so PNNL estimated these exhaust temperatures from the approximate exhaust flow energies (i.e., enthalpies) in Table 8.4. While the full load exhaust conditions in a Model A 60 kW are 780 K (507 °C) at a mass flow rate of 0.158 kg/sec, this exhaust flow energy analysis estimated the 75% load conditions in a 60 kW will be
GraphoilLayers
Stainless Steel Hot-Side Heat Exchangers
AlN Dielectric Layer
TEG ‘s
Copper Cold-SideHeat Exchangers
Substrate Material
Stainless Steel316
StainlessSteel 304
Comments
AlN Coating 5.2 µm 50 - 70 v 5 - 25 v 3 samples; No Surface Polishing
AlN Coating 6.5 µm 135 – 200 vErratic
~200 vErratic
3 samples; No Surface Polishing
AlN Coating 7.0 µm 125 - 130 vConsistent
160 -180 vConsistent
2 samples each; Surfaces Polished
Before Coating

82
approximately 733 K at a mass flow rate of 0.158 kg/sec. These two exhaust conditions were analyzed in the system-level TEG analysis described above.
Figure 8.9 shows the projected TE module efficiency – system power maps resulting from system-level analysis of the single-section TEG for ‘Model A’ 60 kW TQG applications at 100% full power and 75% of full power output from the TQG. The TE material properties described in Section 3 and the TE module design described in Section 6 were used in this analysis. The ambient cooling temperature was set at 300 K in these analyses. The module efficiency – system power map shows the crucial tradeoff between module efficiency and system power output as the external load resistance increases for 100% and 75% of full TQG power conditions. An important characteristic in this type of system-level analysis is that increasing the external load resistance simultaneously increases the temperature differential across the TE modules for constant exhaust temperature and ambient cooling temperature conditions. This creates the common behavior that the system power output peaks at a certain critical external load resistance which is clearly depicted in Figure 8.9. This also produces a maximum electrical conversion efficiency at a second, higher critical external load resistance, which is clearly shown in Figure 8.9. Both of these key performance conditions are the result of the effects of higher temperature differentials across the TE modules producing higher voltage and higher external electrical resistance decreasing current. Figure 8.9 shows that the maximum power output for 100% full TQG power conditions is projected to be about 1.4 kW at just below 9.0% TE module conversion efficiency. The TE module maximum conversion occurs at about 9.0% with only a slight decrease in system power to about 1.38 kW. At 75% of full TQG power conditions, it is clear the maximum system power output decreases to about 1.14 kW at about 8.15% module efficiency and the maximum module efficiency occurs at about 8.2% module efficiency with system power staying nearly the same at 1.14 W. This characteristic module-system behavior in Figure 8.9 provides a useful comparison of the critical operating points for the TEG design. It shows that the current TEG system design achieves below the targeted project goal of 1.6 kW with TE module efficiency of 9% for ‘Model A’ 60 kW TQG exhaust conditions at 100% full load. Our team feels that further improvements in the module efficiency to 10% will allow the design to achieve close to the project goals at 1.55 kW under these TQG exhaust conditions. Figure 8.9 also shows how the power and efficiency of the TEG system will degrade at 75% of full load conditions in the ‘Model A’ 60 kW TQG, with power output decreasing to about 1.14 kW. Given this assessment our project power goal of 1.6 kW was slightly optimistic and would require a TE module efficiency of 10.3 – 10.5%. We would recommend slightly lowering this aggressive goal in future system development work. In discussions with U.S. Army RDECOM a TEG system power output of 1.4 – 1.55 kW is still quite useful on the battlefield and a TE module conversion efficiency of even 9% would be a huge step forward for TE technology based on their past experience.

83
Table 8.4 Fuel Use, Energy Availability and Efficiency as a Function of Load Conditions in Relevant TQG’s
Power Rating Power LevelFuel Use(gal/hr) Efficiency
ApproximateExhaust Energy
30-kW 100% 2.61 29.9% ~30 kW
75% 2.10 27.9%~25 kW
50% 1.60 24.4%~20 kW
25% 1.17 16.7%~16 kW
60-kW 100% 4.66 33.5% ~50 kW
75% 3.73 31.4%~42 kW
50% 2.66 29.3%~31 kW
25% 1.86 21.0%~25 kW
100-kW 100% 7.41 35.1% ~78 kW
75% 6.13 31.8%~69 kW
50% 4.66 27.9%~56 kW
25% 3.20 20.3%~43 kW

84
Figure 8.9 TEG System Power - Efficiency Tradeoff @ 100% Full Load (Texh= 780 K) & 75% of Full Load
(Texh= 733 K)
Figure 8.10 demonstrates the TE module power dependency on external load resistance on a per-module basis resulting from the system-level analysis at 100% and 75% of full TQG power conditions. This analysis was for a 47-couple TE module design with 1.4 mm x 1.4 mm x 4.4 mm TE elements and agrees well with the analysis in Figure 6.3, although the analysis in Figure 6.3 gives a slightly higher module power of 2.4 W for =0.1 conditions. The peak module power condition occurs and is shown, but the power vs. resistance behavior does not follow a familiar power parabolic profile for TE power modules operating with constant temperature differentials. The reason for this is that once again this type of system-level performance analysis does not maintain a constant temperature differential across the TE module as external load resistance increases for constant exhaust temperature conditions. Figure 8.10 shows the temperature differential across the TE module actually increases as external resistance increases, thereby creating the unique power-resistance profile shown in Figure 8.10.
700 800 900 1000 1100 1200 1300 1400
4.5
5
5.5
6
6.5
7
7.5
8
8.5
9
9.5
TE Module Efficiency - System Power maps with Varying External Resistance
System Power [W]
% T
E M
odul
e E
ffic
ienc
y
(0.24, 302)
(0.33, 304)
(0.43, 305)
(0.53, 307)
(0.62, 308)
(0.72, 310)
(0.81, 311)
(0.91, 312) (1.00, 313) (1.10, 314) (1.19, 315)
(1.29, 315)
(1
.38,
316
)
(1
.48,
317
)
(1
.58,
318
)
(1.6
7, 3
18)
(1
.77,
319
)
(1.8
6, 3
19)
(1
.96,
320
)
(2.0
5, 3
20)
(2
.15,
321
)
(0.24, 333)
(0.33, 335)
(0.43, 337)
(0.53, 339)
(0.62, 340)
(0.72, 342)
(0.81, 343)
(0.91, 345) (1.00, 346) (1.10, 347) (1.19, 348)
(1.28, 349)
(1
.37,
349
)
(1
.47,
350
)
(1
.56,
351
)
(1.6
6, 3
52)
(1
.75,
352
)
(1.8
5, 3
53)
(1
.94,
354
)
(2.0
4, 3
54)
(2
.13,
355
)
(RExt
/RInt
, T )
TEx
=733K
TEx
=780K
Increasing External Load Resistance & Temperature Differential
Includes 10% Thermal Losses & Electrical Contact

85
Figure 8.10 TE Module Power Output as Function of Load Resistance Per Module
Another important effect demonstrated in Figure 8.10 power performance data is that the peak power point does not occur at the traditional Ro = R condition (R = TE module resistance, Ro = external resistance). Instead it occurs at Ro > R in the Figure 8.10 data. This is again directly related to the fact that the temperature differential is not constant across the TE module at various resistances in this system-level analysis. When considering the power output from the TE modules given by:
The traditional Ro = R peak power condition occurs when this equation is differentiated and set to zero assuming T is constant. However, to determine the peak power condition in this system-level analysis T must be assumed variable and the differentiation then becomes more complex. The peak power condition after this differentiation then becomes:
This equation shows that Ro > R by an amount related to the derivative of module temperature differential with respect to Ro, and is therefore related to the module temperature differential dependence on Ro. This equation directly results in a quadratic relationship for the Ro that can be solved to explicitly quantify the Ro > R peak power condition in any particular system-level analysis.
0 2 4 6 8 10 12
1
1.5
2
2.547-Couple TE Module Power vs. External Resistance
External Resistance [Ohm]
% T
E M
odul
e P
ower
[W]
T
=302
T=
304
T=305
T=
307
T=308
T
=310
T=
311
T=312
T
=313
T=314
T
=315
T=315
T=
316
T=317
T
=318
T
=318
T=
319
T=319
T
=320
T
=320
T
=321
T=
333
T=
335
T
=33
7
T=
339
T=
340
T=
342
T=
343
T=
345
T=
346
T=
347
T=
348
T=
349
T=
349
T=
350
T=
351
T=
352
T=
352
T=
353
T=
354
T=
354
T=
355
T = Th-T
c
TEx
=733K
TEx
=780K
oo
RRR
TP
2
2
)(
)(
o
ooo R
T
T
RRRRR
)()22( 2
1.4 mm X 1.4 mm X 4.4 mm TE elements
=0.1

86
It accurately predicts the peak power resistance value shown in the TE module power predictions in Figure 8.10 derived from the system-level performance analysis. This is one of the unique findings from the TEG system-level performance analyses in this work.
Given the discussion in this section and in Section 7, the project continued to use the original ‘Model A’ 60-kW TQG exhaust conditions as the design and test conditions for developing this bench-scale prototype TEG system. This provided an appropriate design condition and avenue for designing a flexible, modular system applicable across a variety of battlefield heat sources (i.e., tactical quiet generators, incinerators, and mobile kitchens), but the ‘Model A’ 60-kW TQG and its exhaust conditions simply serve as the demonstration vehicle for this technology and prototype TEG system.
9. Remaining Technical Gaps & Recommendations Additional Module Structural Stress & Thermal Fatigue Testing
Because the stress states developed in the materials are dependent on the module and system design, our team feels future work is needed in thermal fatigue testing and thermal cycling of LAST/LASTT thermoelectric modules under typical operating conditions for this application (Th = 673K, Tc =312 K). This will augment our knowledge base on module-level strength characteristics of the LAST / LASTT materials. Tellurex plans to perform module-level thermal cycling on an existing test-stand as they continue developing these materials after this Phase 1. With the information of the mechanical properties of these materials, further modeling and structural stress analysis should be done at the module and system levels to evaluate the influence of geometrical variations in contacts, and leg geometries including cylindrical leg geometries. Additional stresses caused by the interfaces between the modules and the heat exchangers, and the overall system clamping mechanisms should be investigated through such modeling efforts. Limits on the dimension can then be determined using the fracture strength information gathered as part of this research. This would also give further insight on the allowed clamping forces to remain within acceptable limits but obtain the optimal thermal connection to the heat exchangers. Under this research Tellurex fabricated segmented leg modules that were tested and cycled in temperature several times. However further testing for long term cycling, and various temperature rates should be done to better understand failure mechanisms. It is anticipated that such efforts would lead to insight on possible redesigns needed for electrode configurations, and electrode to heat exchanger interfaces.
Module Performance Stability It is crucial to establish performance stability in the new TE modules. Evaluation of the repeatability and stability of the modules will require long term measurements and repeated measurements on different modules to establish variability in the performance of the modules. These tests should be done under the expected operating conditions. Accelerated testing should also be investigated to see how well it agrees with the longer term measurements.
TE Material Performance Improvement As evidenced by the results shown for cast materials in Figure 3.7 and 3.8 there remains the opportunity for further improvements in TE properties of the LAST / LASTT materials in future work. Thermal conductivities are higher than desired and need to be decreased. Since we have already demonstrated higher power factors than Zhou et al. in our n-type LAST materials, we see reducing the n-type LAST thermal conductivity as the pathway to increasing the ZT performance to align better with our Zhou material benchmark in Figures 3.4 and 3.8. This will enable achieving higher TE module performance and approach the module conversion efficiency of 10% or more, which was the ultimate project goal. Comparisons with the power factor of cast samples show the pressed samples of the Ag0.86Pb19+xSbTe20 have a higher power factor at the higher temperatures, thus further work on reducing the thermal conductivity should be done for

87
these materials and processing techniques. This may include additives in small quantities (< 1%) specifically for reduction of thermal conductivity without significant influences on the power factor properties.
Triple-Segemented n-Type Element Design It also is important to work out the fabrication details, particularly interface designs, of a new triple-segmented n-type LAST leg design. Modeling based on the measured sample properties indicates that some increases in the efficiency may be possible through three segment leg structures. As seen by the power factors for the Ag0.86Pb22SbTe20 samples, the peak occurs at higher temperatures, thus through further segmentation, or functionally graded samples, higher efficiency modules may be possible, and further modeling efforts are needed to determine this.
TE Module Internal Insulation It also is important to demonstrate “aerogel” or comparable insulation between module legs. Efficiency measurements of the thermoelectric modules include thermal insulation in a powder form that is put between the thermoelectric legs and around the module. For the modules used in the final thermoelectric generator system, this or a similar thermal insulator is needed in order to reduce the thermal losses, and further investigations of incorporating this insulation in a manufacturable technique are needed.
TE Module / Heat Exchanger Interfaces It is critical to demonstrate TE module / heat exchanger interfaces using the techniques described Section 8 and show satisfactory performance in operating TE modules and heat exchangers at the system-level.
Encapsulation to Control Oxygen Contamination It is critical to demonstrate encapsulation techniques to prevent oxygen contamination of the LAST/LASTT materials, electrode interface materials, and LAST/Bismuth Telluride and LASTT/Bismuth Telluride interfaces for long-term stable performance. Further contact resistivity measurements for identification of the predominant changes in module resistance after annealing are needed to help verify effectiveness of these encapsulation techniques. Voltage scanning of the segmented legs within the module for comparison of the contact resistivity at the LAST/bismuth telluride and LASTT/bismuth telluride interfaces compared with the contact resistivities at the semiconductor to metal interfaces are needed to better understand the source of this resistance and its stability with time. Additional thermal imaging of the modules to identify uniformity over all unicouples is needed in conjunction with some of the voltage scans so interior unicouples can also be evaluated and full module images used to investigate uniformity.
Aluminum Nitride Coating Thermal Resistance Future work also should continue developing the aluminum nitride coatings of our heat exchanger surfaces for electrical isolation. Interfaces between the aluminum nitride coated heat exchangers and the hot side metal contacts is presently Grafoil. Further measurements of the thermal heat flow through this interface are needed to validate the model, and to study methods for reducing thermal resistance at this interface.
TE Module Packing Factors Additional work is required to increase packing factors to reduce the size of the modules used. Further modeling should be done which incorporates the interface thermal resistances (preferably from measured values for this system), to determine the optimal system size and increase the power to volume ratio. Engineering design work is needed to integrate TE module / heat exchanger interfacing as the design parameters and TE module packing factors are adjusted.
LAST/LASTT Manufacturing Process Refinement Refinements are necessary in manufacturing processes and development of fabrication equipment and tooling to transition

88
to high-volume TE module fabrication. Tellurex has already continued some of this process refinement work after this Phase 1 work. However, several challenges with high volume production of these materials include the time required for fabrication of the n-type cast materials, and sample dicing limitations with the existing systems. Infrastructure improvements are necessary to have the necessary number of furnaces for cast fabrication and to have the needed sample shaping equipment. As many of the limitations on the overall system can be alleviated through adjustments in the thermoelectric material dimensions, the ability to change these dimensions over relatively large ranges are needed to address specific application requirements.
10. Conclusions This project has taken the development of LAST / LASTT TE materials to demonstration in next
generation TE devices and designed a flexible, modular TEG system to provide > 1.5 kW of electrical power from the waste exhaust stream heat in Tactical Quiet Generators. While the Tactical Quiet Generators were the potential Army demonstration vehicle, additional military waste heat applications would also include incinerators and mobile kitchens. The main project objective was to achieve power conversion efficiencies of ~10% (double current TE conversion efficiencies) in a TE system with ~1.6-kW power output for a spectrum of battlefield power applications (i.e., Li-145 battery charging, ultra-capacitor charging). This technical objective involved integrating PNNL’s microchannel technology, PNNL’s unique “power panel” approach to heat exchange/TE system design, and recently characterized LAST (lead-antimony-silver-telluride alloys) thermoelectric materials and bismuth telluride TE materials in an operating segmented TE power device. This project intended to research and solve the never-before-addressed system integration challenges (thermal expansion, thermal diffusion, electrical interconnection, thermal and electrical interfaces) of designing thin “power panels” consisting of alternating layers of thin, microchannel heat exchangers (hot and cold) sandwiching thin, segmented TE power-generating devices stacked vertically in a prescribed number of repetitive layers. Several derived project objectives in TE materials development, TE module development, and system component development expanded from the main objective to achieve power conversion efficiencies of 10% in a 1.6 kW TE power system. Advanced n-type LAST materials and p-type materials were required that had high-performance ZT values, acceptable structural properties, could be segmented with bismuth telluride materials, and could be transitioned into operating TE modules with all the appropriate electrical and structural connections that survive high temperature operation. Additional derived TE module objectives included demonstrating: 1) thermoelectrically effective and structurally sound interfacing of the LAST/LASTT TE materials with bismuth telluride materials within n-type and p-type segmented elements, and 2) thermally effective and structurally sound interfacing of LAST/LASTT/bismuth telluride electrical connections at the hot- and cold-side of the TE element. Our team derived system component development objectives to perform the required TE module structural analyses to provide TE module design guidance, design hot-side and cold-side microchannel heat exchangers to provide at least 2.9 W/cm2 heat flux performance, fabricate microchannel heat exchanger design prototypes, and develop TE module / heat exchanger interfacing techniques to ensure adequate thermal transport and electrical insulation across the TE module / heat exchanger interfaces on the hot- and cold-side. The TE module structural analyses and design had to show that n-type and p-type TE materials would remain within their fracture strength limits established in the structural property testing described above. A later goal in the project, after TE modules were actually fabricated and demonstrated, was that the TE modules must then survive repeated thermal cycling conditions.
Our progress to date with developing n-type LAST materials has shown increased power factors (2 ) compared to Zhou data [17] (labeled as “HP 30-day anneal” in Figure 3.8 and shown in Table 2.1) that has served as our benchmark material performance identified in our IPR white paper as our material performance target for the n-type LAST materials. This meant that the n-type LAST materials

89
needed to achieve a goal of 1.5 at 700 K. However, as shown in Table 2.1 the ZT of our latest n-type LAST materials do not exceed those of the Zhou materials, but only attained ZT values of 1.0 at 700 K. The reason is that the thermal conductivity of these n-type LAST materials (See Figure 3.7 and Figure 3.10) is too high, although n-type LAST material power factors were improved significantly to 16-26 µW/cm-K2 at 700 K. Significant work was on-going at the end of the project to improve high-temperature annealing processes that showed good promise and was successful at times in reducing the thermal conductivity across the intended temperature range. More work is required to develop and optimize the annealing processes (i.e., times and temperatures) on the n-type LAST materials to reproducibly reduce their thermal conductivity. As future work continues in developing these materials, it is believed that these LAST thermal conductivities will decrease and allow them to more closely mimic the Zhou materials and increase ZT to the necessary levels required to meet this project’s goals. The generally slow materials development and measurement process was sped up by the close coordination between Tellurex and MSU and Northwestern University during the Go/NoGo performance period. This was crucial in achieving the n-type LAST materials progress to date. In moving forward, this type of coupled material development and measurement coordination is critical.
A major advancement in the n-type LAST materials was that 3 different versions of n-type LAST materials were developed during the course of this project, each having different temperature-dependency behavior that could be exploited and tailored in dual-segmented and triple-segmented TE element designs. These three n-type LAST materials were controllably fabricated by straight-forward variations in key processing parameters.
Progress was also made with the p-type LASTT TE materials. In particular, the LASTT p-type materials demonstrated very good repeatability on the project but exhibited ZT values of 1.0 at 700 K, whereas the goal for these p-type materials was about 1.2 at 700 K (as shown in Figure 3.2). The p-type LASTT power factors, although improved during the project to about 17 µW/cm-K2 at 600-700 K shown in Figure 3.1, fell short of the expectations of 20-22 µW/cm-K2 at 600-700 K. Additional research and development is required to improve their power factors.
The TE module design and fabrication work, involving significant thermoelectric, thermal and structural design and analysis efforts, led to the first segmented TE modules using n-type LAST / Bismuth Telluride and p-type LASTT / Bismuth Telluride materials. These modules have been tested in the module test facilities at MSU (see Section 6) and demonstrated increasing TE conversion efficiency with each new module fabricated and tested. Testing at MSU has shown a tested TE conversion efficiency of 6.56% with a dual-module power of 3.6 W in the latest TE module fabricated and tested. This is below our target of showing 5 W with 8-10% efficiency in these module tests. One of the main reasons for this is that module internal resistance was still too high at 4.9 compared to a goal of about 3 at room temperature. This work developed an Action Plan to identify and eliminate the extraneous resistances and Tellurex expects to provide higher performance modules as they continue to develop and perfect the fabrication processes and improve the n-type refined LAST materials going forward from Phase 1. Tellurex has successfully fabricated the interfaces shown in Figure 5.1, particularly the LAST / LASTT interfaces to the stainless steel diffusion barriers and the stainless steel – copper strapping interface. These interfaces showed no structural failures during TE module testing at MSU. These operating TE modules were the first demonstration of LAST/LASTT materials, and in particular segmented elements using LAST / LASTT materials, in an operating TE module. PNNL, Tellurex and Michigan State University also have developed a design pathway to 10% TE module designs that would incorporate triple-segmented element designs with various LAST/LASTT materials discussed in Section 3 and bismuth telluride. These new element designs would take advantage of the different n-type LAST versions discussed above.
Major progress was made in characterizing the thermal fatigue and mechanical strength of the new LAST and LASTT materials for the first time. All LAST and LASTT specimens tested prior to thermal cycling and all specimens fatigued in either the large and small thermal fatigue chambers had an “as-received” surface finish (the 400 grit surface finish present when the specimens were received

90
from Tellurex). This as-received surface finish was selected for testing since that is a more realistic surface finish for TE module legs than the mirror-like surface finish typically used in strength testing.
The elasticity/thermal fatigue testing on the LAST (Ag0.86Pb19SbTe20 , Ag0.86Pb19+xSbTe20) and LASTT (Ag0.9Pb9Sn9Sb0.6Te20) showed that the Young’s modulus and Poisson’s ratio were relatively insensitive to thermal fatigue cycling, except for two specimens, P15-14 which fractured after 160 cycles and which P15-17 fractured after 180 cycles. This indicates that the “average” microcrack length and/or number of microcracks do not increase appreciably during thermal cycling up to 200 cycles in our thermal fatigue chamber.
The ring-on-ring (ROR) fracture strength for both the as-received (not thermally fatigued) LAST and LASTT (Ag0.9Pb9Sn9Sb0.6Te20) is comparable to ROR strengths measured on commercially available Bi2Te3 (Wereszczak et al.25). The ring-on-ring fracture for LASTT (p-type) shows a band of fracture strength values between approximately 25 MPa to 40 MPa for up to 200 thermal fatigue cycles, thus the fracture strength of LASTT does not degrade significantly during thermal cycling in the large thermal fatigue chamber. One batch (P32) increased in strength upon thermal cycling, while another batch (P28) decreased slightly upon thermal cycling. The refined-LAST fracture data shows a band of strength values between about 15 MPa and 38 MPa for 0 to 200 thermal fatigue cycles. One of our latest refined – LAST batches (N37) maintained mechanical strength near 30 MPa (26 MPa ± 4 MPa) after 200 thermal fatigue cycles. These structural and fracture strength characterizations are the first reported comprehensive measurements of structural and fracture strength properties after thermal cycling for these new n-type LAST and p-type LASTT materials. However, since there is no data available in the literature for the strength or elasticity changes due to thermal fatigue of Bi2Te3 or any other thermoelectric material, it is impossible to compare LAST / LASTT thermal cycling strength data with other thermoelectric materials.
For the refined HL LAST specimens, the as-received specimen’s surfaces showed inclusions, roughly 50 to 75 microns across. Energy Dispersive X-ray Spectroscopy (EDS) showed that in general the inclusions were lead poor, but disjoint sub-regions within the inclusions were rich in silver or antimony. All of the refined HL LAST specimens that were cycled in the small and large thermal fatigue chambers showed surface pitting and a decrease in the number density of inclusions, which implies that during fatigue the inclusions spalled off the surfaces. Since the chemistry of the inclusions are different than the average chemistry of the bulk material, the spalling of the surface inclusions may be due to a mismatch in thermal expansion coefficient between the matrix of refined HL LAST and the inclusions.
A Finite Element Analysis (FEA) performed by Pacific Northwest National Laboratory (PNNL) indicates that with the appropriate dimensions and interconnections, the thermal stresses generated within thermoelectric modules fabricated from our latest n-type LAST and p-type LASTT elements may not exceed the strength values measured in this study. This showed that two module design pathways exist for minimizing TE element stresses during operation: 1) TE element sizes of those shown in Figure 5.3 with chamfered corners to reduce local stresses or 2) taller and / or thinner TE element dimensions to reduce local corner stresses. The second option actually creates a power output problem in that taller / thinner TE elements will have lower length/area ratios and therefore lower power output than we desire. Our design estimates have shown the power output per couple would fall by about 40% in elements with dimensions shown in Figure 5.4. Therefore, the option 1 design approach using TE elements similar in size to those shown in Figure 5.3 was implemented to build our prototype TE modules for TE testing described Section 6. The FEA was crucial in successfully developing TE module designs that have shown no structural failures to date during module performance testing at MSU during the Go/NoGo decision period. This is a testimony to the excellent structural analysis and design work and structural property characterization performed in designing these TE modules. In true fact, the module structural design dictated the overall TE module design as much as thermoelectric and thermal design considerations.

91
Microchannel heat exchanger design studies have developed several designs that will satisfy our TEG thermal requirements on the TEG hot-side and cold-side. This work has identified and developed several hot-side designs that can provide about 12 W/cm2 at the TE hot side for the 60 kW TQG exhaust conditions and about 11 W/cm2 on the TE cold side, while providing the required hot- and cold-side temperatures on the TE modules (i.e., Thot = 670 K, Tcold = 312 K). These high thermal heat fluxes were achieved with microchannel designs that had predicted pressure drops of about 0.6-0.8 psi, well within our project target goal of 1 psi pressure drop. These microchannel heat exchangers were fabricated during the course of the project. The microchannel heat exchanger design studies show that these thermal designs can transition rapidly and smoothly to designs that would accommodate 30 kW TQG exhaust conditions. This work also has evaluated and quantified the effect of exhaust conditions in ‘Model B’ TQG’s on the microchannel design performance, showing a significant drop in thermal performance in Table 7.3 due to significantly cooler exhaust conditions. This effect, along with the significant loss in TE conversion efficiency, would severely degrade the power output from our TEG system to about 50% of the TEG power output for ‘Model A’ TQG conditions.
Useful, flexible and modular TE system designs were developed for both 30 kW and 60 kW Tactical Quiet Generators on this Phase 1 project. A modular integrated TEG system was designed to deliver 1.4 – 1.5 kW of electrical power using the new TE modules (with 9% conversion efficiency) by recovering the exhaust waste heat of “Model A” 60-kW TQG with an exhaust temperature of 780 K and mass flow rate of 0.158 kg/seconds. This is slightly below our project goal of 1.6 kW and 10% conversion efficiency for the TE module-related and material-related reasons discussed above. This modular design could also be modified to a dual-section design and applied to recovering exhaust waste heat from a 30 kW TQG design, which would produce a slightly lower power of about 1.3 kW at a conversion efficiency of about 7.8%. These options are discussed in Section 8. PNNL has investigated the expected power output for various external electrical resistance conditions on the TEG and two different load conditions on the ‘Model A’ 60 kW TQG (100% Full Load and 75% Full Load). System analysis results are shown in Figure 8.9. This system analysis was performed to evaluate our project system goals as the 60 kW TQG exhaust conditions change from full load conditions to partial load conditions. The system analysis was performed for the system configuration presented and discussed in our IPR white paper (April 2009) and shown in Figure 8.2. The system-level analysis included the integrated performance effects of the hot-side and cold-side heat exchangers coupled with the TE modules discussed in Sections 4 and 5. The TE module efficiencies are projected to be approximately 9%, as shown in Figure 8.9, using the latest LAST/LASTT materials and bismuth telluride in a dual-segmented element design. As mentioned above, a design pathway has been developed to 10% TE module designs that would incorporate triple-segmented element designs using various LAST/LASTT materials with bismuth telluride. These system designs would provide the Army with several viable waste energy recovery options in their TQG fleet.
A TE module test plan presented in Section 6 was developed for future testing of the TE modules discussed in Section 6. This plan has been followed at Tellurex Corporation since the completion of Phase 1. Tellurex is continuing internal development of these new LAST/LASTT segmented-element modules based on the foundational groundbreaking work in this Phase 1 project. Better performing LAST/LASTT TE modules have been fabricated at Tellurex as a result of this test plan and enhanced fabrication processes since Phase 1 completion.
11. Appendices
11.1 Test System Thermal Loss Calculations
Heat flow calculation for SERDP TE Modules Testing
Updated 10/21/09

92
Tellurex module outside dimensions = 19.5 mm × 29.5 mm = 575.25×10⁻⁶ m2
Area of all thermoelectric legs = [47 (couples)]·[2 (legs/couple)]·[1.397 (mm)]2 = 183.45×10⁻⁶ m2
Area between thermoelectric legs (insulation) = 575.25×10⁻⁶ m2 - 183.45×10⁻⁶ m2 = 391.80×10⁻⁶ m2
Hot side heat flow into n-type leg = 17.89 W/cm2
Hot side heat flow into p-type leg = 15.97 W/cm2
The T is 670K – 312K = 358K
Heat flow through the thermoelectric material
Total heat flow into thermoelectric material on the hot side = [17.89×10⁴ (W/m2)]·[47 (n-type legs)]·[1.95×10⁻⁶ m2/leg] + [15.97×10⁴ (W/m2)]·[47 (p-type legs)]·[1.95×10⁻⁶ m2/leg] = 31 W
Heat loss through insulation between module legs
Total heat flow through the Microtherm insulation with a thermal conductivity of 0.02 (W·m-1·K-
1) is [391.80×10⁻⁶ (m2)/4×10-3 (m)]·[0.02 (W·m-1·K-1)]·[358 (K)] = 0.701 (W)
Lateral Heat loss through insulation (out the sides of the module)
Total heat flow through the Microtherm insulation with a thermal conductivity of 0.02 (W·m-1·K-
1) is perimeter of the module over the insulation thickness on the sides (1”) times the average temperature times the thermal conductivity or:
[19.5×10⁻³ (m) + 29.5×10⁻³ (m)]·2·[5×10-3 (m)]/[25.4×10-3 (m)]·[491 (K)]·[0.02(W·m-1·K-1)] = 0.189 (W)
Heat loss up copper heater leads
Lead length = 0.6096m
Lead cross-sectional area (13 AWG): 2.63×10⁻⁶ m2
Copper thermal conductivity: 401 W·m-1·K-1
Heat loss: [2.63×10⁻⁶ (m2)]/[0.609(m)]·[401(W·m-1·K-1)][373(K)]=0.645 Watts per lead. Two leads total for a total heat loss of 1.29 (W)
Heat loss up Thermocouples (estimated)
Lead length = 0.6096 m
Lead cross-sectional area: 49.0874×10⁻⁹ m2
304 stainless steel thermal conductivity: 16.3 W·m-1·K-1
Heat loss: [49.087×10⁻⁹ (m2)]/[0.609(m)]·[16.3(W·m-1·K-1)]·[373(K)] = 489.58W per thermocouple. 4 thermocouples, for a total of 0.00196 (W) heat loss through the thermocouples. This assumes solid stainless steel, but it is actually a stainless steel tube around two thermocouple wires. We believe this is an over-estimate of the heat flow through the thermocouples.
Summary:
31 Watts through thermoelectric material (for one 47 couple module)
Approximately 2.182 Watts thermal losses (for one 47 couple module)
Note: With two modules everything doubles, except for the heat loss up the copper heater leads. Note: This does not account for I2R heating of the copper leads going to the heater (we estimate this to be less than half of the heat loss up the copper leads).
11.2 List of Scientific/Technical Publications
1) Poster Presentation, T. J. Hendricks, T. P. Hogan, E. D. Case, C.J. Cauchy, “Advanced Soldier Thermoelectric Power System for Power Generation from Battlefield Heat Sources - SERDP Project

93
#SI-1652”, Poster within the 'Partners in Environmental Technology Technical Symposium & Workshop' Proceedings, December 2008, Washington, DC (published).
2) Presentation and Poster, T. J. Hendricks, T. P. Hogan, E. D. Case, C.J. Cauchy, J. Barnard, “Advanced Soldier Thermoelectric Power System for Power Generation from Battlefield Heat Sources - SERDP Project #SI-1652”, Abstract Proceedings of the 'Direct Thermal-to-Electrical Energy Conversion Symposium & Workshop, December 2008. Monterey, CA (published).
3) Interim Annual Technical Report, T. J. Hendricks, T. P. Hogan, E. D. Case, C.J. Cauchy, “Advanced Soldier Thermoelectric Power System for Power Generation from Battlefield Heat Sources - SERDP Project #SI-1652”, 14 January 2009, Submitted to SERDP Office.
4) Invited Technical Presentation at DOE 2009 Thermoelectrics Applications Workshop, C.J. Cauchy, “Tunable LAST Thermoelectric Properties for Generator Applications”, Abstracts and CD of Proceedings for DOE 2009 Thermoelectrics Applications Workshop, October 2009, San Diego, CA (published).
5) Invited Technical Presentation at the DOE 2009 Thermoelectrics Applications Workshop, T. J. Hendricks, T. P. Hogan, E. D. Case, C.J. Cauchy, “Advanced Soldier Thermoelectric Power System for Power Generation from Battlefield Heat Sources”, Abstracts and CD of Proceedings for DOE 2009 Thermoelectrics Applications Workshop, October 2009, San Diego, CA (published).
6) Technical Presentation: A. Q. Morrison, E. D. Case, F. Ren, T. J. Hendricks, C. Cauchy, J. Barnard, Elastic Modulus and Biaxial Fracture Strength of Thermally Fatigued Hot Pressed LAST and LASTT Thermoelectric Materials, Presented at the Materials Science and Technology Conference, Pittsburg PA.
7) Conference Paper, T. J. Hendricks, T. P. Hogan, E. D. Case, C.J. Cauchy, “Advanced Soldier Thermoelectric Power System Operating from Battlefield Heat Sources”, Proceedings of the Fall 2009 Materials Research Society Meeting, Paper #1218-Z07-02, December 2009, Boston, MA.
8) Technical Presentation, N. Matchanov, J. D’Angelo, C.-I. Wu, T. P. Hogan, J. Barnard, C. J. Cauchy, T. J. Hendricks, J. Sootsman, M. G. Kanatzidis, “Influence of Lead Content on the Properties of Hot Pressed n-type Ag0.86PbxSbTe20 (LAST)”, Proceedings of the Fall 2009 Materials Research Society Meeting, December 2009, Boston, MA.
9) Technical Presentation, J. D'Angelo, N. Matchanov, C.-I. Wu, T. P. Hogan, J. Barnard, C. J. Cauchy, T. J. Hendricks, M. G. Kanatzidis, “Thermoelectric Module Measurement System”, Proceedings of the Fall 2009 Materials Research Society Meeting, December 2009, Boston, MA (accepted for publication).
10) Conference Paper, T.J. Hendricks, N.K. Karri, T.P. Hogan, C.J. Cauchy, “New Thermoelectric Materials and New System-Level Analysis Perspectives Using Battlefield Heat Sources for Battery Recharging”, Proceedings of the 44th Power Sources Conference, Paper #28-2, June 2010, Las Vegas, NV (accepted for publication).

94
12. Form SF298

95
13. References
1. Z.H. Dughaish, “Lead telluride as a thermoelectric material for thermoelectric power generation,” Physica B, vol. 322, pp. 205-223, (2002).
2. E. A. Skrabek, D. S. Trimmer, “Properties of the General TAGS System,” Chapter 22 in CRC Handbook of Thermoelectrics, ed. D. M. Rowe, CRC Press LLC, Boca Raton, FL, USA, (1995).
3. B. Poudel, Q. Hao, Y. Ma, Y. Lan, A. Minnich, B. Yu, X. Yan, D. Wang, A. Muto, D. Vashaee, X. Chen, J. Liu, M. S. Dresselhaus, G. Chen, Z. Ren, “High-Thermoelectric Performance of Nanostructured Bismuth Antimony Telluride Bulk Alloys,” Science, vol. 320, pp. 634-638 (2008).
4. J. Androulakis, K-F. Hsu, R. Pcionek, H. Kong, C. Uher, J.J. D'Angelo, A. Downey, T. Hogan, M.G. Kanatzidis, “ Nanostructuring and high thermoelectric efficiency in p-type Ag(Pb1-ySny)mSbTe2+m,” Advanced Materials, 18 (9), pp. 1170-1173, (2006).
5. S.R. Brown, S.M. Kauzlarich, F.Gascoin, G.J. Snyder, “Yb14MnSb11: New High Efficiency Thermoelectric Material for Power Generation,” Chemistry of Materials, vol. 18 pp. 1873-1877, (2006).
6. T. Caillat, J.-P. Fleurial, A. Borshchevsky, “Preparation and Thermoelectric Properties of Semiconducting Zn4Sb3,” Journal of the Physical Chemistry of Solids, vol. 58 no.7 pp.119-1125, (1997).
7. E. A. Skrabek, D. S. Trimmer, “Properties of the General TAGS System,” Chapter 22 in CRC Handbook of Thermoelectrics, ed. D. M. Rowe, CRC Press LLC, Boca Raton, FL, USA, (1995).
8. B. C. Sales, D. Mandrus, B. C. Chakoumakos, V. Keppens, and J. R. Thompson, “Filled Skutterudite Antimonides: Electron Crystals and Phonon Glasses,” Physical Review B, Vol. 56, No. 23, pp. 15081 – 15089, (1997).
9. Y. Gelbstein, Z. Dashevsky, M.P. Dariel, “High Performance n-type PbTe-Based Materials for Thermoelectric Applications,” Physica B, vol. 363, pp. 196–205, (2005).
10. Cast Ag0.86Pb19SbTe20 samples were > 100g ingots fabricated under Office of Naval Research support (N00014-02-1-0867 MURI) at Michigan State University.
11. G. J. Snyder, “Application of the compatibility factor to the design of segmented and cascaded thermoelectric generators,” Applied Physics Letters, Vol. 84, No. 13, pp. 2436- 2438, (2004).
12. X. Shi, H. Kong, C.-P. Li, C. Uher, J. Yang, J. R. Salvador, H. Wang, L. Chen, W. Zhang, “Low Thermal Conductivity and High Thermoelectric Figure of Merit in n-type BaxYbyCo4Sb12 Double-Filled Skutterudites,” Applied Physics Letters, vol. 92, article 182101, (2008).
13. V. K. Zaitsev, M. I. Fedorov, E. A. Gurieva, I. S. Eremin, P. P. Konstantinov, A. Yu. Samunin, M. V. Vedernikov, “Highly effective Mg2Si1−xSnx thermoelectrics,” Physical Review B, 74, 045207, (2006).
14. X. Tang, Q. Zhang, L. Chen, T. Goto, T. Hirai, “Synthesis and thermoelectric properties of p-type- and n-type-filled skutterudite RyMxCo4−xSb12.R:Ce,Ba,Y;M:Fe,Ni,” Journal of Applied Physics, Vol. 97, pp. 093712-1 - 093712-10, (2005).
15. K-F. Hsu, S. Loo, F. Guo, W. Chen, J. S. Dyck, C. Uher, T. Hogan, E. K. Polychroniadis, M. G. Kanatzidis, “Cubic AgPbmSbTe2+m: Bulk Thermoelectric Materials with High Figure of Merit,” Science 303. 5659, pp. 818 – 821, (2004).
16. J. Androulakis, C.-H. Lin, H.-J. Kong, C. Uher, C.-I. Wu, T. Hogan, B. A. Cook, T. Caillat, K. M. Paraskevopoulos, M. G. Kanatzidis, “Spinodal Decomposition and Nucleation and Growth as a Means to Bulk Nanostructured Thermoelectrics: Enhanced Performance in Pb1-xSnxTe-PbS,” Journal of the American Chemical Society, vol. 129, pp. 9780-9788, (2007).
17 M. Zhou, J.-F. Li, T. Kita, “Nanostructured AgPbmSbTem+2 System Bulk Materials with Enhanced Thermoelectric Performance,” Journal of the American Chemical Society, vol. 130, pp 4527-4532, (2008).
18. T. P. Hogan and T. Shih, “Modeling and characterization of power generation modules based on bulk materials,” Chapter 12 in Thermoelectrics Handbook: Micro to Nano, Edited by D. M. Rowe, CRC Press, 2005.
19. The equation fits can be found at: http://www.egr.msu.edu/~hogant/index.htm under the “Research” link. 20. Cost analysis was based on pricing information found at http://www.alfa.com for 99.999% pure elements (or
most pure when 5N was not available) on 5/14/2009. The cross sectional size of the p-type leg was fixed at 2mm 2mm, and the n-type leg cross sectional area was multiplied by the factor of (An/Ap) as listed in Table 3.4

96
21. V.N. Kaliakin, Introduction to Approximate Solution Techniques, Numerical Modeling, and Finite Element
Methods, Marcel Dekker, Inc, New York, 2002. 22. Laws, N. and Brockenbrough, J.R., The effect of micro-crack systems on the loss of stiffness of brittle solids, Int.
J. Solids Structures, 23 (9): 1247-1268, 1987. 23. Budiansky, B. and O’Connell, R.J., Elastic moduli of a cracked solid, Int. J. Solids Structures, 12: 81-97, 1976. 24. “Standard Test Method for Monotonic Equibiaxial Flexure Strength of Advanced Ceramics at Ambient
Temperatures," ASTM C 1499, Vol. 15.01, ASTM, West Conshohocken, PA, 2007. 25. A. A. Wereszczak, T. P. Kirkland, O. M. Jadaan, and H. Wang, Strength of Bismuth Telluride, Ceramic
Engineering and Science Proceedings, Wiley InterScience, New York, preprint, to be published 2009. 26. E. D. Case, “The Saturation of Thermomechanical Fatigue in Brittle Materials”, 137 – 208 in Thermo-
Mechanical Fatigue and Fracture, WIT Press, Southampton, UK, 2002. 27. A. Migliori and J. L. Sarrao, Resonant Ultrasound Spectroscopy: Applications to Physics, Materials
Measurements, and Nondestructive Evaluation, (Academic Press, New York, 1997). 28. F. Ren, E. D. Case, J. R. Sootsman and M. G. Kanatzidis, H. Kong, C. Uher E. Lara-Curzio and R. M. Trejo, C.
Uher, 2008, The high temperature elastic moduli of polycrystalline PbTe measured by resonant ultrasound spectroscopy” Acta Materialia, 56, 5954 – 5963.
29. M. H. Cobble, “Calculations of Generator Performance,” CRC Handbook of Thermoelectrics, CRC Press, 1995.