Embed Size (px)
Citation preview

ADVANCED NUCLEAR FUELS CORPORATION
ANF-87-159
Issue Date: 11/24/87
H. B. ROBINSON UNIT 2
LARGE BREAK LOCA/ECCS ANALYSIS
WITH AN INCREASED ENTHALPY RISE FACTOR
Prepared by
T. H. Chen PWR Safety Analysis
Licensing & Safety Engineering Fuel Engineering & Technical Services
November 1987
gf
K~~Z AN AFFILIATE OF KRAMTWER UNION
(j~ 7/QKWU
eU
CUSTOMER DISCLAIMER
IMPORTANT NOTICE REGARDING CONTENTS AND USE OF THIS DOCUMENT
PLEASE READ CAREFULLY
Advanced Nuclear Fuels Corporation's warranties and representations concerning the subject matter of this document are those set forth in the Agreement between Advanced Nuclear Fuels Corporation and the Customer pursuant to which this document is issued. Accordingly, except as otherwise expressly provided In such Agreement, neither Advanced Nuclear Fuels Corporation nor any person acting on its behalf makes any warranty or representation, expressed or implied, with respect to the accuracy, completeness, or usefulness of the information contained in this document, or that the use of any information, apparatus, method or process disclosed in this document will not infringe privately owned right: or assumes any liabilities with respect to the use of any information, apparatus method or process disclosed in this document. The information contained herein is for the sole use of Customer. In order to avoid impairment of rights of Advanced Nuclear Fuels Corporation in patents or inventions which may be included in the information contained in this document, the recipient. by its acceptance of this document. agrees not to publish or make public use (in the patent use of the term) of such information until so authorised in writing by Advanced Nuclear Fuels Corporation or until after six (6) months following termination or expiration of the aforesaid Agreement and any extension thereof, unless otherwise expressly provided in the Agreement. No rights or licenses in or to any patents are implied by the furnishing of this document.
XN-NF-FOO-765 (1187)

i ANF-87-159
TABLE OF CONTENTS
Section Paae
1.0 INTRODUCTION ......................................... 1
2.0 SUMMARY ............................................. 2
3.0 LIMITING BREAK LOCA ANALYSIS ............................ 6
3.1 LOCA Analysis Model ..................................... 7
3.2 LOCA Analysis Results ................................... 9
4.0 CONCLUSIONS ......................................... 60
5.0 REFERENCES ......................................... 61

11 ANF-87-159
LIST OF TABLES
Table Paae
2.1 H. B. Robinson Unit 2 LOCA/ECCS Analysis Results ......... 4
3.1 H. B. Robinson Unit 2 System Data ........................ 11
3.2 Fuel Design Parameters ................................. 12
3.3 H. B. Robinson Unit 2 LOCA/ECCS Analysis Conditions and'esults .......................................... 13
3.4 H. B. Robinson Unit 2 Partial Large Break Spectrum Analysis Results..................................... 14
3.5 H. B. Robinson Unit 2 LOCA/ECCS Analysis Event Times...... 15

iii ANF-87-159
LIST OF FIGURES
Figure Page
2.1 H .B. Robinson Unit 2 K(z) - Normplized Axially De endent Power Peaking Limit (FqL(z)] Curve, Y = 2.32 .........................................
3.1 Blowdown System Nodalization ....................... 16
3.2 REFLEX Nodalization .............................. 17
3.3 H.B. Robinson Unit 2 o(z) vs. Core Height Used in the Large BreaR LOCA/ECCS Analysis.......... 18
3.4 Cladding Temperature Comparison for the Various Break Sizes at EOBY (Peak Power Node) ............. 19
3.5 Fuel Average Temperature Comparison for the Various Break Sizes at EOBY (Peak Power Node) .............. 20
3.6' H.B. Robinson Unit 2 Fq(z) Limit vs. Core Height for Axial Power Distributions Used in the Large Break LOCA/ECCS Analysis .......................... 21
3.7 Downcomer Flow Rate during Blowdown Period, 0.8 DECLG Break ................................. 22
3.8 Upper Plenum Pressure during Blowdown Period, 0.8 DECLG Break ................................. 23
3.9 Average Core Inlet Flow Rate during Blowdown Period, 0.8 DECLG Break ........................... 24
3.10 Average Core Outlet Flow Rate during Blowdown Period, 0.8 DECLG Break .......................... 25
3.11 Total Break Flow Rate during Blowdown Period, 0.8 DECLG Break ......................... ........ 26
3.12 Break Flow Enthalpy during Blowdown Period, Vessel Side, 0.8 DECLG Break ....................... 27
3.13 Break Flow Enthalpy during Blowdown Period, Pump Side, 0.8 DECLG Break ......................... 28
iv ANF-87-159
LIST OF FIGURES (Cont.)
Figure Page
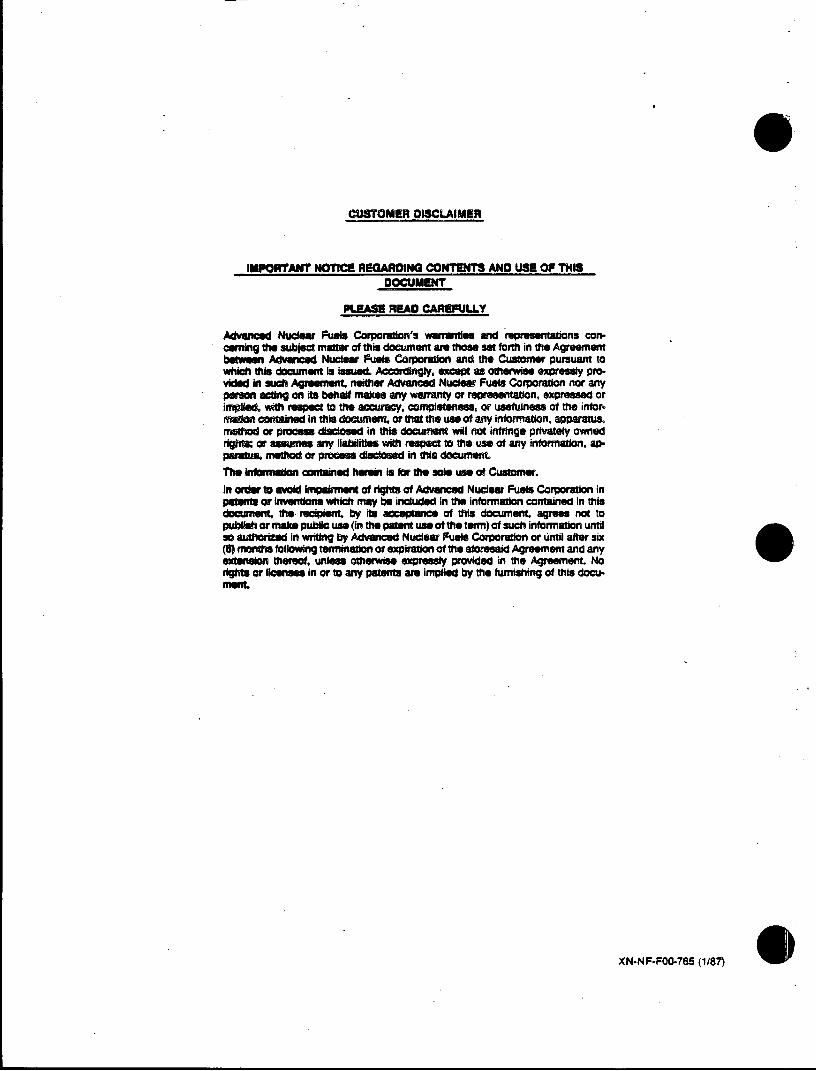
3.14 Flow from Intact Loop Accumulator during Blowdown Period, 0.8 DECLG Break ................... 29
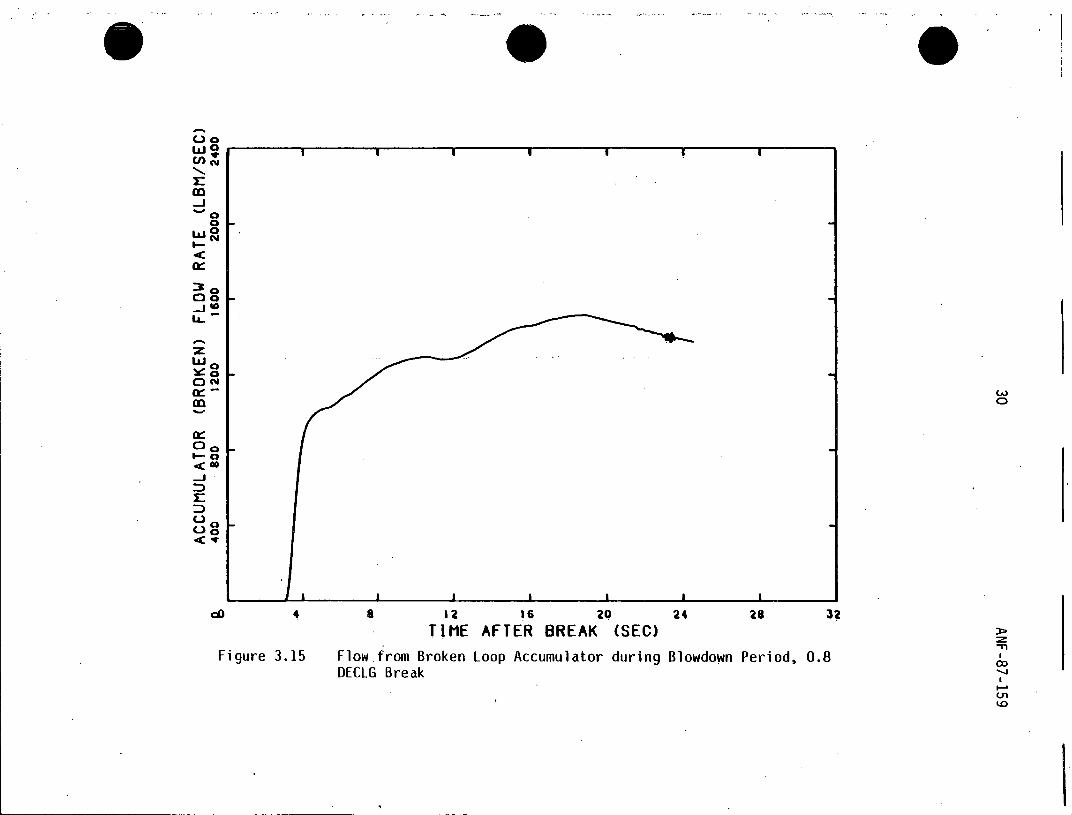
3.15 Flow from Broken Loop Accumulator during Blowdown Period, 0.8 DECLG Break ................... 30
3.16 Heat Transfer Coefficient during Blowdown Period at Peak Power Node, 0.8 DECLG Break, Cosine Power Shape ........... ......... 31
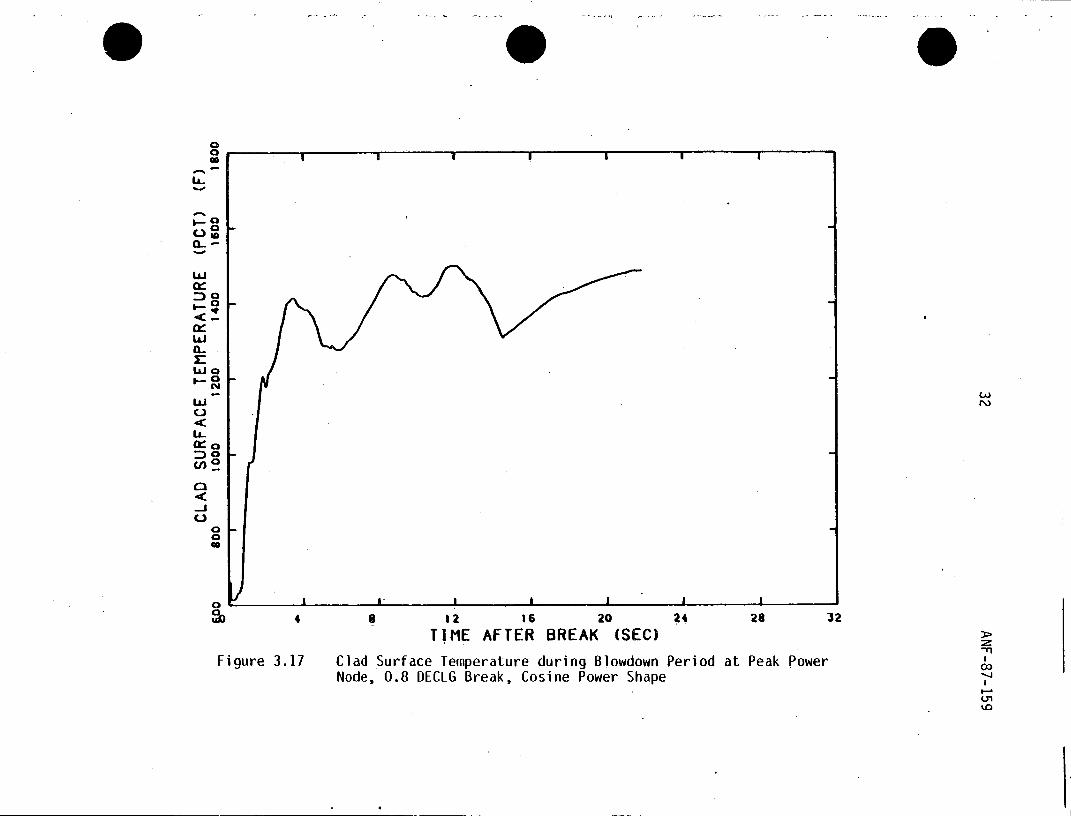
3.17 Clad Surface Temperature during Blowdown Period at Peak Power Node, 0.8 DECLG Break, Cosine Power Shape ............................... 32
3.18 Depth of Metal-Water Reaction during Blowdown Period at Peak Power Node, 0.8 DECLG Break, Cosine Power Shape ............................... 33
3.19 Average Fuel Temperature during Blowdown Period at Peak Power Node, 0.8 DECLG Break, Cosine Power Shape ............................... 34
3.20 Hot Channel Average Quality, Center Volume, 0.8 DECLG Break, Cosine Power Shape ........ 35
3.21 Heat Transfer Coefficient during Blowdown Period at Peak Power Node, 0.8 DECLG Break, Top-Skewed Power Shape ............................ 36
3.22 Clad Surface Temperature during Blowdown Period at Peak Power Node, 0.8 OECLG Break, Top-Skewed Power Shape ...................... 37
3.23 Depth of Metal-Water Reaction during Blowdown Period at Peak Power Node, 0.8 DECLG Break, Top-Skewed Power Shape ............................ 38
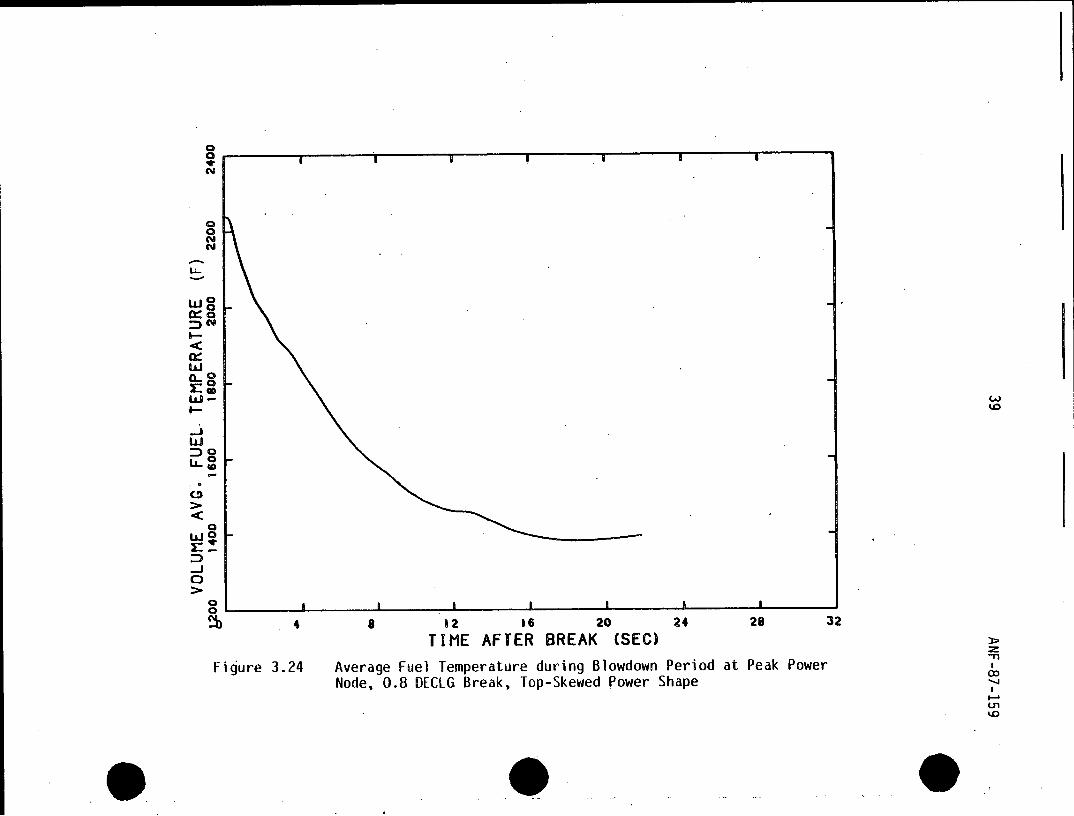
3.24 Average Fuel Temperature during Blowdown Period at Peak Power Node, 0.8 DECLG Break, Top-Skewed Power Shape ............................ 39
3.25 Hot Channel Average Quality, Top Volume, 0.8 DECLG Break, Top-Skewed Power Shape ............. 40

v ANF-87-159
LIST OF FIGURES (Cont.)
Figure Paae
3.26 Containment Back Pressure, 0.8 DECLG Break..........41
3.27 Normalized Power, Cosine Power Shape, 0.8 DECIG Break........... ....................... 42
3.28 Normalized Power, Top-Skewed Power Shape, 0.8 DECLG Break................................... 43
3.29 Accumulator (Intact) Flow Rate during Refill and Reflood-Periods, 0.8 DECLG. Break .................... 44
3.30 Accumulator (Broken) Flow Rate during Refill and Reflood Periods, 0.8 DECLG Break ................... 45
3.31 HPSI (Intact) Flow Rate during Refill and Reflood Periods, 0.8 DECLG Break ................... 46
3.32 HPSI (Broken) Flow Rate during Refill and Reflood Periods, 0.8 DECLG Break ................... 47
3.33 LPSI (Intact) Flow Rate during Refill and Reflood Periods, 0.8 OECLG Break................... 48
3.34 LPSI (Broken) Flow Rate duringRefill and Reflood Periods, 0.8 DECLG Break ................... 49
3.35 Reflood Core Mixture Level, 0.8 DECIG Break, Cosine Power Shape ................................ 50
3.36 Reflood Downcomer Mixture Level, 0.8 DECLG Break, Cosine Power Shape......................... 51
3.37 Reflood Upper Plenum Pressure, 0.8 DECLG Break, Cosine Power Shape......................... 52
3.38 Core Flooding Rate, 0.8 DECLG Break, Cosine Power Shape...............................53
3.39 Reflood Core Mixture Level, 0.8 DECLG Break, Top-Skewed Power Shape .......... o.. .............. 54
3.40 Reflood Bowncomer Mixture Level, 0.8 DECLG Break, Top-Skewed Power Shape ...................... 55

3 ANF-87-159
The LOCA/ECCS analysis presented in this report supports operation of H. B. Robinson Unit 2 with the established power peaking limits, a full core of
ANF's fuel operating at the rated power of 2300 MWt, a maximum total peaking
of 2.32, a nuclear enthalpy rise factor of 1.70, and a steam generator tube plugging of up to 6% and for peak rod average burnups less than 49 MWO/kgU.
4 ANF-87-159
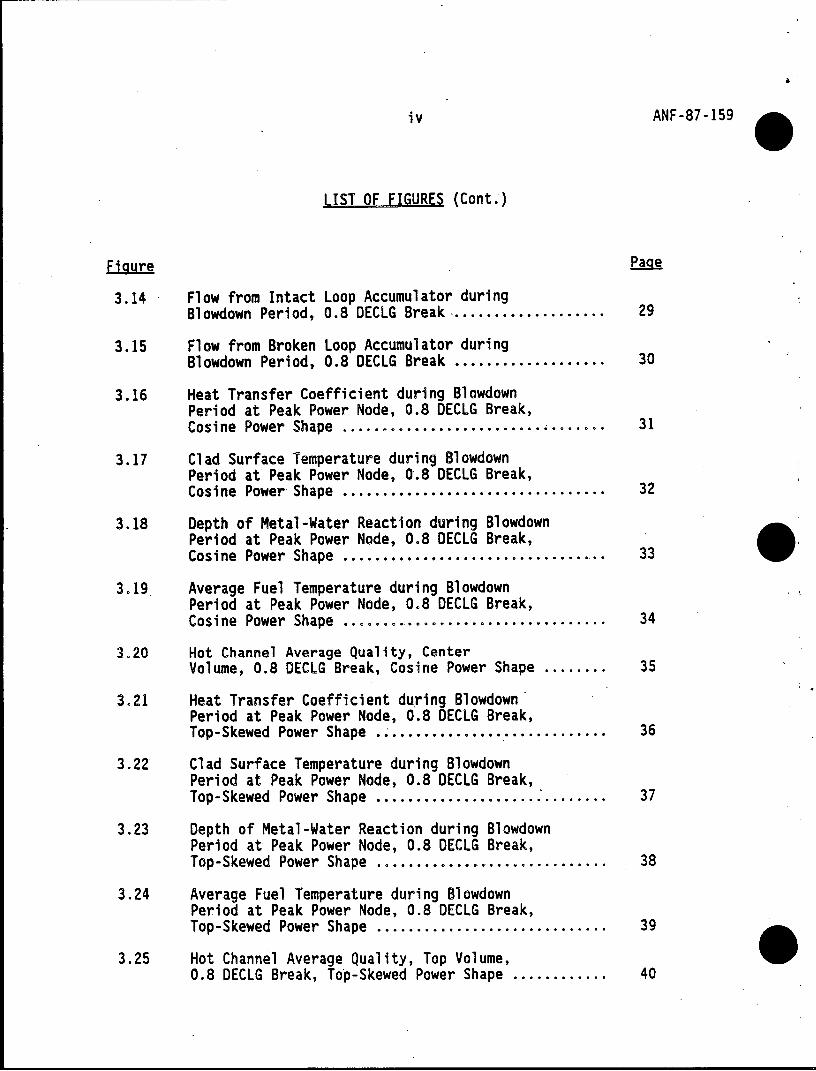
Table 2.1 H. B. Robinson Unit 2 LOCA/ECCS Analysis Results
Peak Peak X/L=0.50 X/L=.8125
Peak Rod Avg. Exposure Range, MWD/kgU 0-49 0-49
Peak Cladding Temperature,PCT, OF 1931 1935
Total Core Zr-H 20 Reaction, % <1.0 <1.0
Local Zr-H20 Reaction, %* 2.54 2.13
*Values at 200 seconds into LOCA transient.

-1.2
1.0 1.0 6.0,1.0)(10.8, 0.94
CV
0.8
t-4 (12.0, 0.647)
0.6
0 0.4
0.82
0 2 4 6 8 1012
ELEVAT ION IN CORE (FT)
Figure 2.1 H.B. Robinson Unit 2 K(Z) - Normalized Axially Dependent Power Peaking Limit (FQL(Z)) Curve, FQ= 2.32
a e .0.

6 ANF-87-159
3.0 LIMITING BREAK LOCA ANALYSIS
The analysis reported herein supports an increase in the nuclear enthalpy rise
factor to 1.70 (FAH) and the K(z) curve provided in Amendment 109 to the H.B.
Robinson Unit 2 Technical Specifications, Figure 3.10-3(1). The present ANF
analysis was performed for the following conditions:
(1) The previously identified limiting break (0.8 DECLG).
(2) Core thermal power of 2346 MW, including 2% uncertainty.
(3) A full core of ANF fuel.
(4) Maximum steam generator tube plugging fraction of 6%.
(5) Use of fission gas release and stored energy data at the maximum stored
energy exposure, considering exposures ranging from BOC-to-EOC, with
maximum assembly average exposure of 44 MWD/kgU at EOC.
Operating conditions and fuel parameters used in the analysis are provided in
Tables 3.1 and 3.2, respectively.
The analysis included the following calculations: stored energy and fission
gas release, system and hot channel blowdowns, containment pressure,
normalized decay. power, reactor refill, system reflood, and hot rod heat up.
The models used in the analysis are described in Section 3.1.
A LOCA break spectrum analysis had previously been performed for H. B.
Robinson Unit 2 with results reported in XN-NF-84-72, Supplement 1,(2) This
analysis (which did not use the FCTF reflood correlations) identified the 0.8 DECLG break as having the highest PCT as well as the highest calculated stored
energy (fuel average temperature) and cladding temperature at end-of bypass
(EOBY) time. Although use of the FCTF reflood correlation would not be
expected to change the 0.8 DECLG break as the limiting break size in the
previous analysis, a partial large cold leg break spectrum analysis was
performed with blowdown and hot channel calculations using the. cosine power

7 ANF-87-159
distribution to confirm that the 0.8 DECLG break remains the most limiting
break.
3.1, LOCA Analysis Model
The Advanced Nuclear Fuels Corporation EXEM/PWR ECCS evaluation model(3) was
used to perform the required analyses. This model consists of the following
computer codes:
(1) RODEX2 for initial stored energy, fission gas release, and gap
conductance;
(2) RELAP4-EM for the system blowdown, hot channel blowdown, and accumulator
& SIS flow split calculations;
(3) CONTEMPT-LT/22 as modified in accordance with NRC Branch Technical
Position CSB 6-1 for computation of containment back pressure;
(4) REFLEX for computation of system reflood; and
(5) TOODEE2 for the calculation of final fuel rod heat up.
The quench time, quench velocity and carryover rate fraction (CRF)
correlations in REFLEX, and the heat transfer correlation in TOODEE2 are based
on ANF's 17x17 FCTF data.
The H. B. Robinson Unit 2 nuclear reactor is a Westinghouse three-loop
pressurized water reactor with a dry containment. The reactor coolant system
is divided into control volumes representing reasonably homogeneous regions,
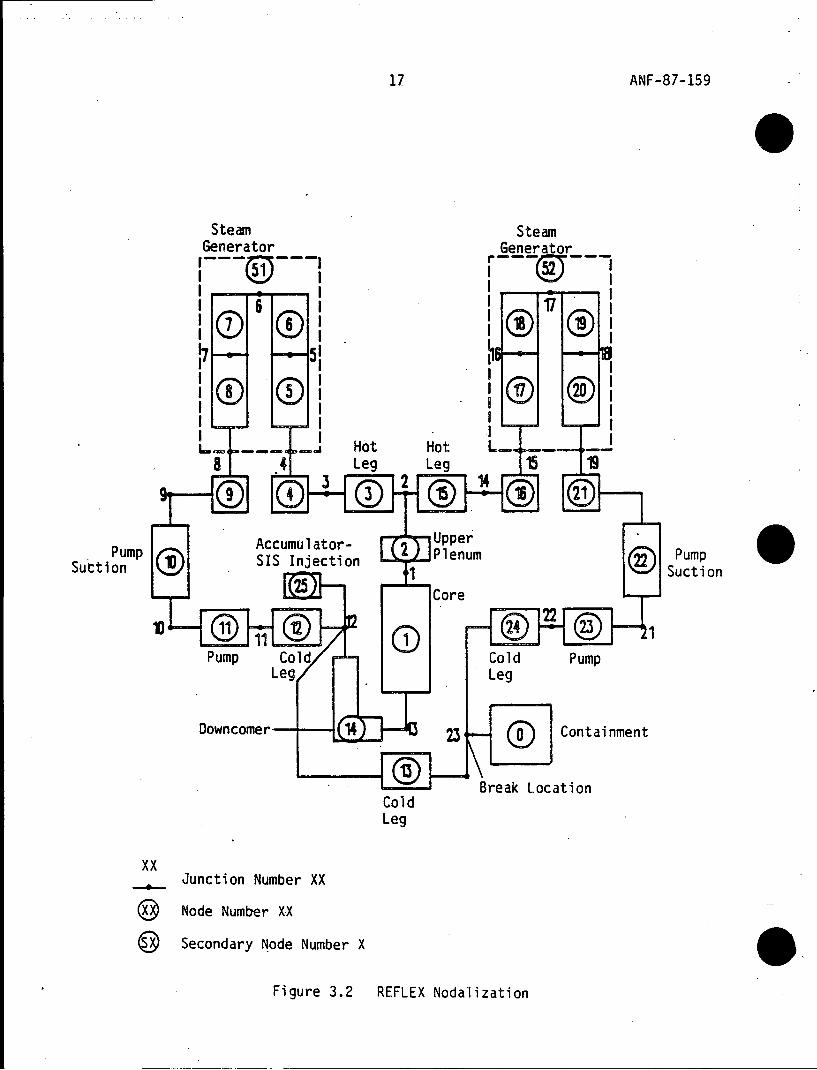
interconnected by flow-paths or "junctions". The system nodalization is
depicted in Figure 3.1. The single failure is assumed to be the loss of one
of three HPSI pumps in addition to a loss of one LPSI pump. The reactor
coolant pump performance characteristics are the Westinghouse pump homologous
curves built into the RELAP4 code. Six percent of the tubes in each steam
generator are assumed to be plugged. The transient behavior was determined
from the governing equations for the conservation of mass, energy, and
momentum. Energy transport, flow rates, and heat transfer are determined from

II 8 ANF-87-159
appropriate correlations. The reactor core model uses heat generation rates
determined from reactor kinetics equations which use reactivity feedback and
decay heating as required by Appendix K of 10 CFR 50. System input parameters
are given in Table 3.1. Figure 3.2 shows the nodalization used in the REFLEX
reflood calculations for H. B. Robinson Unit 2.
The K(z) curve represents the variation of the limit on power peaking with
core height. The K(z) curve is the ratio of the power peaking limit at any
elevation [FQL(z)] to the maximum allowed total peaking factor (FQT). The
allowed power peaking is reduced at the top of the core to offset the effect
on PCT of reduced coolant heat transfer from (1) the short core uncovery
periods at the top of the core during small break LOCA events., and (2) reduced
cooling capacity at the top of the core during the reflood period of large
break LOCA events. The portion of the curve which represents the limit
imposed by the small break LOCA events is based on the current LHGR limits
presented in the H. B. Robinson Unit 2 Technical Specifications(1) and is not
otherwise addressed in the present analysis.
The axial dependence of the limits on power peaking for large break LOCA/ECCS
analyses was determined based on an analysis using two axial power shapes:
(1) A center-peaked chopped cosine axial power shape. This power shape was
analyzed with a total peaking factor of 2.32 at a core height of 6.0 ft.
(2) A conservative top-skewed power shape representative of EOC conditions.
This power shape was analyzed with a total peaking factor of 2.21 at a
core height of 9.75 ft.
These power shapes are shown in Figure 3.3. The calculations were performed
using fuel rod conditions at the exposure when maximum stored energy occurs
(1.8 MWD/kgU). The use of fuel rod conditions at the maximum stored energy
exposure produces conservative PCT results for the entire range of exposures

9 ANF-87-159
from BOC-to-EOC. The EOC exposure considered in this analysts was 44 MWD/kgU
maximum assembly average exposure.
3.2 LOCA Analysis Results
The analysis conditions and results of the limiting 0.8 DECLG break are
summarized in Table 3.3. The axial power profiles used in the analysis are
compared to the axially dependent power peaking factor limit in Figure 3.6.
The maximum PCT calculated for the 0.8 DECLG break with the chopped cosine
power shape is 1931'F and occurs at 63.8 second at a core height of 7.29 ft.
The maximum local metal-water reaction after 200 sec is 2.54%, and the total
core metal-water reaction is less than 1%. The maximum PCT calculated for the
0.8 DECLG with the top-skewed power shape is 1935'F and occurs at 126.7
seconds at a core height of 11.0 ft. The maximum local metal-water reaction
after 200 sec is 2.13%, and the total core metal-water reaction is less than
1%.
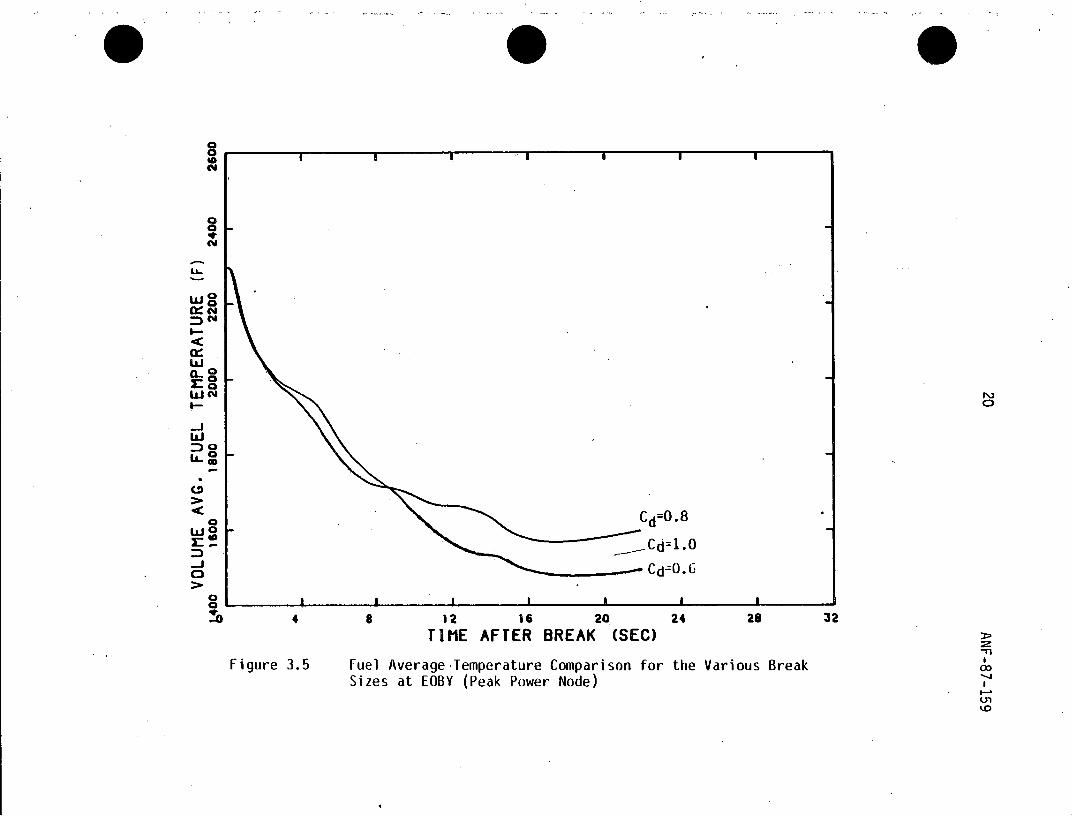
The results of the partial large break spectrum analysis are presented in Table 3.4. The differences in fuel average temperature (stored energy) and cladding temperature calculated at EOBY time for the various break sizes (CD =
0.6, 0.8, 'and 1.0) show similar differences in magnitude as in the previous
break spectrum analysis. Therefore, the analysis confirms that the previous
identified limit break, the 0.8 DECLG, remains the limiting break. Figures
3.4 and 3.5 show the cladding and fuel average temperature comparisons for the
various break sizes.
Table 3.5 presents the timing and sequence of events as determined for the
reactor system during the large guillotine break with a discharge coefficient
of 0.8. Figures 3.7 through 3.15 provide plotted results from the system
blowdown analysis. Figures 3.16 through 3.20 present results for the chopped
cosine power shape hot channel blowdown calculation. . Figures 3.21 through 3.25 present results for the top-skewed power shape hot channel blowdown calculation. Figure 3.26 presents the calculated containment back pressure
10 ANF-87-159
history, and Figures 3.27 and 3.28 show the normalized decay power results for
the cosine and top-skewed power shapes, respectively. Accumulator and Safety
Injection System flows during the refill and reflood time period are shown in
Figures 3.29 through 3.34. The reflood calculation results for the chopped
cosine power shape are presented in Figures 3.35 through 3.38, and the results
for the top-skewed power shape are presented in Figures 3.39 through 3.42.
The TOODEE2 hot rod heatup results for the chopped cosine shape and top-skewed
shape are presented in Figure 3.43, and Figure 3.44, respectively.

11 ANF-87-159
Table 3.1 H.B. Robinson Unit 2 System Data
Primary Heat Output, MWt 2300 (2346)*
Primary Coolant Flow, ibm/hr 100.3 x 10⁶
Primary Coolant Volume, ft3 9186**
Operating Pressure, psia 2250
Inlet Coolant Temperature, *F 546.2
Reactor Vessel Volume, ft3 3684
Pressurizer Total Volume, ft3 1300
Pressurizer Liquid Volume, ft3 780
Accumulator Total Volume, ft3 (each of three) 1200
Accumulator Liquid Volume, ft3 825
Accumulator Pressure, psia 615
Steam Generator Heat Transfer Area, ft2 (one) 40859***
Steam Generator Secondary Flow, lbm/hr (one) 3.37 x 10⁶ (3.428 X 10⁶)*
Steam Generator Secondary Pressure, psia 800
Reactor Coolant Pump Rated Head, ft 266
Reactor Coolant Pump Rated Speed, rpm 1190
Reactor Coolant Pump Rated Torque, ft-lbf 22363
Moment of Inertia, lbm-ft2/rad 70000
*Values within the parenthesis are for 102% power.
**Includes the pressurizer total volume, and 6% SG tube plugging.
***Includes 6% SG tube plugging.
12 ANF-87-159
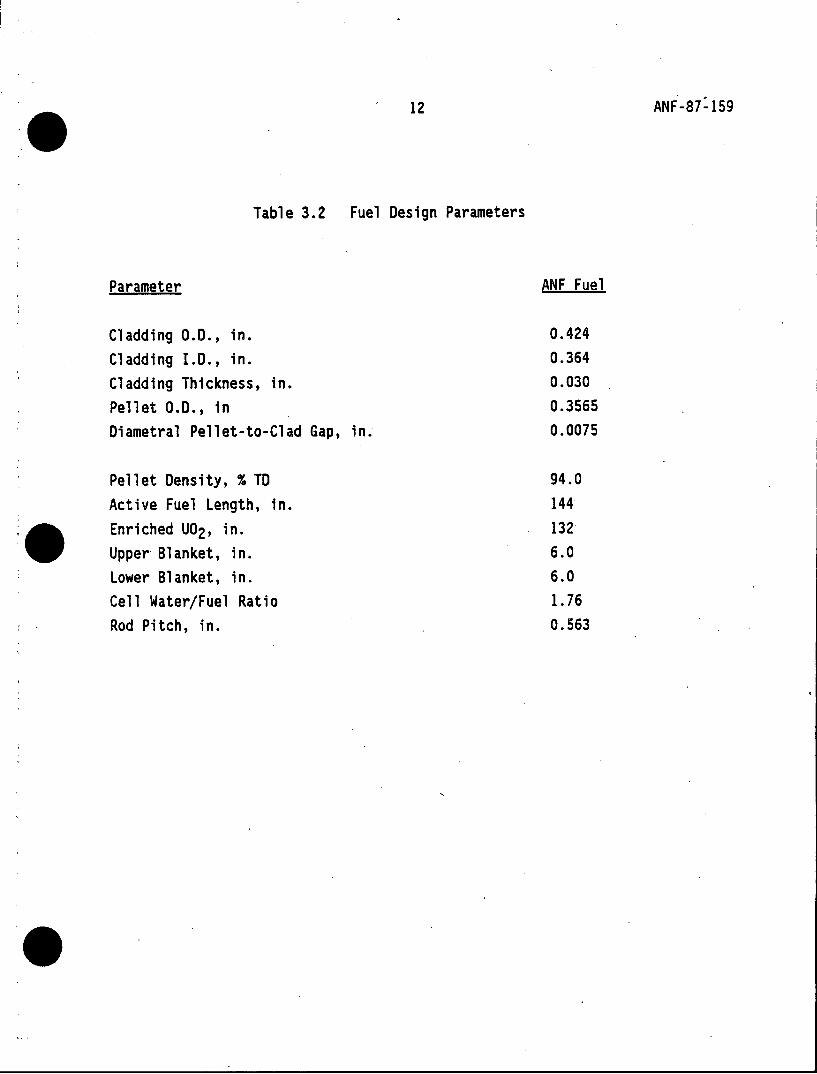
Table 3.2 Fuel Design Parameters
Parameter ANF Fuel
Cladding 0.D., in. 0.424
Cladding I.D., in. 0.364
Cladding Thickness, in. 0.030
Pellet 0.D., in 0.3565
Diametral Pellet-to-Clad Gap, in. 0.0075
Pellet Density, % TD 94.0
Active Fuel Length, in. 144
Enriched U02, in. 132
Upper Blanket, in. 6.0
Lower Blanket, in. 6.0
Cell Water/Fuel Ratio 1.76
Rod Pitch, in. 0.563

13 ANF-87-159
Table 3.3 H. B. Robinson Unit 2 LOCA/ECCS Analysis Conditions and Results
Calculational Basis
License Core Power, MWt 2300
Power Used for Analysis, MWt* 2346
Break Size, DECLG, Cd 0.8
Nuclear Enthalpy Rise, FAH 1.70
Steam Generator Tube Plugging, % 6.00
Maximum Peak Rod Average Exposure, MWD/kgU 49.0
Peak Peak X/L=0.50 X/L=.8125
Peak Rod Avg. Exposure Range, MWD/kgU 0-49 0-49
Exposure at Time of Peak Stored Energy, MWD/kgU Peak Rod Average Exposure 1.8 1.8
Average LHGR, kw/ft 5.98 5.98
Peak Linear Heat Generation Rate (LHGR)* 14.16 13.50
Total Peaking Factor, FqT 2.32 2.21
Axial Peaking Factor, FEZ** 1.365 1.301
Local Peaking Factor, FL 1.07 1.07
Peak Cladding Temperature, PCT, OF 1931 1935
Peak Cladding Temperature Location, ft 7.29 11.0'
Peak Cladding Temperature Time, sec 63.8 126.7
Hot Rod Burst Location, ft 6.04 9.75
Hot Rod Burst Time, sec 37.19 50.74
Channel Blockage Fraction 0.268 0.307
Total Core Zr-H 20 Reaction, % <1.0 <1.0
Local Zr-H 20 Reaction Location, ft 6.04 11.0
Local Zr-H 20 Reaction, %*** 2.54 2.13
*Including 1.02 factor for power uncertainty. **Including 1.03 for engineering uncertainty.
***Values at 200 seconds into LOCA transient.

14 ANF-87-159
Table 3.4 H. B. Robinson Unit 2 Partial Large Break Spectrum Analysis Results
Break size, Cd DECLG 0.6 DECLG 0.8 DECLG 1.0
EOBY Time (sec) 23.0 21.84 21.81
Fuel Average Temperature at 1506.9 1598.6 1546.5 at EOBY (*F)
Cladding Temperature at EOBY (OF) 1423.2 1486.9 1458.1

15 ANF-87-159
Table 3.5 H.B. Robinson Unit 2 LOCA/ECCS Analysis Event Times
Event - Time (sec)
Start 0.0
Initiate Break 0.1.
Safety Injection Signal 0.7
Accumulator Injection (Broken Loop) 3.2.
Accumulator Injection (Intact Loop) 11.9
End-of-Bypass (EOBY) 21.84
Safety Pump Injection, HPSI 25.70
Accumulator Empty (Broken Loop) 43.59
Safety Pump Injection, LPSI (Broken Loop) 43.74
Start of Reflood (BOCREC) 46.17
Accumulator Empty (Intact Loop) 50.82
Safety Pump Injection, LPSI (Intact Loop) 51.45
Peak Clad Temperature Reached:
Cosine 63.84
Top-skewed 126.74

STEAM PuESSURIZER STEM
0 MOI VLM
n, FLOW JUNCTION
INTACT LOOP IROKEN LOOP
18 20
ci) REUACTOA VESSEL (j
BREAK LOCATION
a 4 -ii ----- 51HOT LEG ON
9 111 (( 164 2261a
39 1 61 PLOIP
II 0 8 42 U42
2.1 (ij 41 ~j) CONTAINMENT
102
ACCUMUJLATOR ACCUMU4LATOR
Figure 3.1 Blowdown System Nodalization
17 ANF-87-159
Steam Steam Generator Generator
I I - . I III17
0 (D@
I I I I . Hot Hot L_
8 4 Leg Leg 1 5
9
Accumulator- Upper
SutiP SIS Injection Plenum S on
Pump Cold -Cold Pump Leg Leg
Downcomer- 3 Containment
Break Location Cold Leg
XX Junction Number XX
© Node Number XX
Secondary Node Number X
Figure 3.2 REFLEX Nodalization

2.5
1.5 -- Il
2.0
------ EOC-AX L L
01.5M/
0.0
S2 4 6 10 1
ELEVATION IN CORE (FT) 0
Figure 3.3 H.B. Robinson Unit 2 Fq(Z) vs. Core Height Used in the Large Break LOCA/ECCS Analysis

O SIIII I I I
)O
CC =0.6
0
Wa
r- d
C
-
O
0
0
I I I I III
2 16 20 24 28 32 TIME AFTER BREAK (SEC)
Figure 3.4 . Cladding Temperature Comparison for the Various Break Sizes at EOBY (Peak Power Node)
cLr
O
a
bJ.
Li..
C
WN
CC,
Cd=0.8 WO r...Cd=1.0
Cd=0.G
S4 8 12 16 20 24 28 32
TIME AFTER BREAK (SEC)
Figure 3.5 Fuel Average Temperature Comparison for the Various Break 0 Sizes at EOBY (Peak Power Node)
It-o

2.5
2.0.
1.5
F T '0 L I M IT C U R V E COSINE
------ EOC AXIAL
0.0 0 2 4 6 8 10
1.0
ELEVATININ CRE (F)
Power Distributions Used in the Large Break LOCA/ECCS Analysis
e 0.5

e a g
C)
Wa
cng
L
0
C
0 0
0
C)
C)
C
0 a as as o2 s 412 16 20 24 26 32
TIME AFTER BREAK (SEC)
Figure 3.7 Downcomer Flow Rate during Blowdown Period, 0.8 DECLG Break
L,

<o 0
<0.
- CI
O
w
a
LAJ
CL
WLAa
0
0A
4 8 12 16 20 24 28 32 TIME AFTER BREAK (SEC)
Figure 3.8 Upper Plenum Pressure during Blowdown Period, 0.8 DECLG Break
I.
toD
a e0e

C)1
U)O
a
Go
0 0 O
C3)
-O
Wa
O
-j
0
WO O
'b 1 2 1s 2o 24 28 32
TIME AFTER BREAK (SEC)>
Figure. 3.9 Average Core Inlet Flow Rate during Blowdown Period, 0.8 DECLGI Brea
Braka U.. 0

0 O
o
0:
U
Ca
U) a
I
O O
'h4 a6 20asa 24 28 a2
TIME AFTER BREAK (SEC)
Figure 3.10 Average Core Outlet Flow Rate during Blowdown Period- 0.8 DECLGI Break
rn
04
e e a

(1)
ca
-LJ
0 Wa
UO
OO Cf)
a0
cJ
)-O
Li
Q O
0
S4 1 2 16 20 24 2s 32
TIME AFTER BREAK (SEC)
Figure 3.11 Total Break Flow Rate during Blowdown Period, 0.8 DECLG Break 8 00
LLLD

iJ
O O
aI I I II
)
0
-II
U1
m I
4w62 43 TIE (SC
Fiue310ra lwEtap uig lwonProiVse ie .
DELGBra
Lhlon

C
LU 0 cn8
C
C.)
0 a- c
0
>-0
CX0 ca
d0 4 812 16 20 24 ' 28 32
TIME (SEC)
Figure 3.13 Break Flow Enthalpy during Blowdown Period, Pump Side, 0.8 DECLG Break
Liin

U. a
On
0
0 a
QC
Do
LLn
D
Go)
I<0I4 I00 21 02 83
TIEATRBRA4SC
Fiue31 lo rmItc-Lo cuuaordrn lwow eid .
DELGBra
C.(J 0
e e 90
L0) Jo
34I I I I III
toa
00 ) N
ci 4a 21 02 83
z
000
6-0
(L) a
4 84 12 16 20 24 28 32 TIME AFTER BREAK (SEC)
Figure 3.15 Flow from Broken Loop Accumulator during Blowdown Period, 0.8 DECLG Break
I-.

I I I I I
v6
LL cc
ILLLA
LLJ
C)
0.4 812 t6 20 24 28 32
TIME AFTER BREAK (SEC) D
Figure 3.16 Heat Transfer Coefficient during Blowdown Period at Peak PowerIn Node, 0.8 DECLG Break, Cosine Power Shape
LU 0
O
CL
IO W
.0 a
O
O
cr LLJ a
W II3
LA..
0
D 4 8 12 16 20 24 28 32 TIME AFTER BREAK (SEC)
Figure 3.17 Clad Surface Temperature during Blowdown Period at Peak Power Node, 0.8 DECLG Break, Cosine Power Shape
I-.

0I
C
0 C) -an
0 -O00
0
L.
O C6.
O0
CO4 82 I2620 24 2832
TIME AFTER BREAK (SEC)
1.11
Figure 3.18 Depth of Metal-Water Reaction during Blowdown Period at PeakIA
IdO
Power Node, 0.8 DECLG Break, Cosine Power Shape
07
anO

O
a U
I-N
fl-C
I
.. J
O
CL
-J
C
0
4 84 12 16 20 24 28 3
TIME AFTER BREAK (SEC)
Figure 3.19 Average Fuel Temperature during Blowdown Period at Peak Power Node, 0.8 DECLG Break, Cosine Power Shape
U-'

eJe
O f -C)
Wcn
C3
aDb 4 812 IS 20 24 28 32
TIME AFTER BREAK (SEC).
-- n
I0I
Figure 3.20 Ho t Channel Average Quality, Center Volume, 0.8 QECLG Break, c Cosine Power Shape
I-n

II I I I I
0
c'o LL.
CAJ
L< C
Wt- 0
4812 16 20248
TIME AFTER BREAK (SEC) : Figure 3.21 Heat- Transfer Coefficient during Blowdown Period at Peak Power I1
Node, 0.8 DECLG Break, Top-Skewed Power Shape -

CL
0DO
bJA
o
.
C
0
0
CO o
1821620 24 28 32 TIME AFTER BREAK (SEC)
Figure 3.22 Clad Surface Temperature during Blowdown Period at Peak Power Node, 0.8 DECLG Break, Top-Skewed Power Shape
(31
LO0
e e *0.

C?
Co ro
z C
000
<a
W
0
2ao
I.*
00 4 2162 4 83
O k*
O
O
o~ w aD 62 42
TIEATRBRAaSC Fiue320 et fMtlWtrRacindrn lwonPro tPa
Poe0oe . EL ra ,TpSee oe hp
a 0
LA 0
I-o
O
-LJW
LL
g a e
LLJ
01
4 812 16 20 24 28 32
TIME AFTER BREAK (SEC)
Figure 3.24 Average Fuel Temperature during Blowdown Period at Peak PowerIn
Node, 0.8 DECLG Break, Top-Skewed Power Shape 1
Ln

We
re I I II . I
-3
W
zo C.CD
c; C5
C!
n I I I I I S4 8 12 16 20 24 28 32
TIME AFTER BREAK (SEC) Figure 3.25 Hot Channel Average Quality, Top Volume, 0.8 DECLG Break, In Top-Skewed Power Shape
U-'

CONTAINMENT PRESSURE. PSIA 10 20 30 40 so s0 70
(D 0
rco
rn3
CD
6S= SN 0t

1 .II I I I I I
%
C3
cr
s1 100 200 300 400 500 600 700 80 TIME AFTER BREAK. SECONDS
Figure 3.27 Ndrmalized Power, Cosine Power Shape, 0.8 DECLG Break
ulj cnl

cb I I I I I.
%
C
0
C3 0
1.
100 200 300 400 500 600 700 8o0
TIME AFTER BREAK. SECONDS
an
Fiur 328 Normalized Power, Top-Skewed Power Shape, 0.8 DECLG Break 00 411
0.
z

W 4
-J
C
C-)
I
~00 I-a
< o -j i
40a
I___ I I I I II
40 80 120 160 200 240 280 320
TI ME after EOBY (SEC)
Figure 3.29 Accumulator (Intact) Flow Rate during Refill and Reflood Periods, 0.8 DECLG Break
I-I

%ad L)
O
-32
NI
00
Q
Perods 0.8 DECLG BreakSec wn
Fiue33wcuuao Boe)FowRt uigRfl n elo
Peid , . E:- ra qL

d C4
co
03
<
W
d -j UL
U)
3:
d N
III I I
40 80 120 160 200 240 280' 320
T I ME after EOBY (Sec)
Figure 3.31 HPSI. (Intact) Flow Rate during Refill and Reflood Periods, 0.8 DECLG Break
I-s

d II I I III
M3
w* C,)
-LJ
w.
I
-4
Ci)
0
I I I I ' I I I
40 80 120 160 200 240 280 320
TI ME after EOBY (Sec) 71
Figure 3.32 HPSI (Bfoken) Flow Rate during Refill and REflood Periods, 0.8 DECLG Bireak I
Ln

I I I IIII
C-3 W
Cr4
7b 4o so 12o 1so 20o 24o 280 32o
TI ME after EOBY (Sec)
Figure 3.33 LPSI (Intact) Flow Rate during Refill and Reflood Periods, 0.8 C DECLG Break
-Jn

C-)
O
inn
-LJ
<0
0
0~
10 40 so12 160 200 240 280 320
TI ME after EOBY (sec)
Figure 3.34 IPSI (Broken) Flow Rate during kefill and Reflood Periods, 0.8 DECLG Breaka
I-.

I I I II I I I I
I-I
TIME AFECBEK SC
L FMB
0
0
C3 08 2 6 0 -0203030401
I0n TIEATRBRAWSC
Fiue33Delo oeMxueIee] . EL raCsn oe hp

e I I1 I p IIIII
N
I
Jo Ld 0
Id
W
Ed N'
0
a30 40 80 120 160 200 240 280 320 360 40 01
TIME AFTER BREAK (SEC)
Figure 3.36 ReflIood Downcomer Mixture Level, 0.8 DECL8 Break, Cosine Power
Sape

**
l)
a
%0 U)
J
CL
O cr
-LJ
CL
a D
CY
1 I I I I I I I I4
9D 40 80 120 160 200 240 280 320 360 400 TIME AFTER BREAK (SEC)
Figure 3.37 Reflood Upper Plenum Pressure, 0.8 DECLG Break, Cosine Power Shape

SI I I I I I
A
N
C
c QC
C)
0
Wc~
C? . a
o0
On
co
aD40 80 120 160 200 240 280 320 360 40
La..
TIME AFTER BREAK (SEC)
Figure 3.38 Core Flooding Rate, 0.8 DECLG Break, Cosine Power Shape
W

a
O
O
-co
G0 40 80 120 160 200 240 280 320 360 401
TIME AFTER BREAK (SEC)
Figure 3.39 Reflood Core Mixture Level, 0.8 OECLG Break, Top-Skewed Power Shape

WO
N
O
I-o
WS
Xe e
W c
-J
0
00 zI
004 o10102020203030401 0L
TIME AFTER BREAK (SEC) LO
[igtire 3.40 Reflood Downcooicr Mixtture Level, 0.8 DECLG Break, Top-Skewed Power sha pe

C
*J .
Uf)
o
IL W
U)
2D 40 80 120 160 200 240 . 280 320 360 4.0 0
TIME AFTER BREAK (SEC)
Figure 3.41 Reflood Upper Plenum Pressure, 0.8 DECLG Break, Top-Skewed Power Shape

REFLOOD RATE CINCH/SEC)
40.8 1 .2 152.0 .2.4 2.83.
I0
N)
0-cD
S>
Sm >. e
-v
.D m 0
.:E
M
V0

FO=2.32.FDHl .70.FZ-l .365 ar
I I I I I I
I. PCT NODE
(NODE 14 AT 7.29 FT.)
2. RUPTURED NODE
Lii (NODE 9 AT 6.04 FT.)
U. 0
orwo
Go
UU,
2
ca
O
&0.0 20.0' 40.0 60.0 80.0 100.0 120.0 14 0.0 160.0 180.0 200.0 TIME - SECONDS
Figure 3.43 Cladding Temperature during Refill and Reflood Periods, 0.8 DECLG, Break Cosine Power

FO=2?21.FDH=170.FZ=1.301 0 0 W
I. PCr NODE
(NODE 23 AT 11.00 FT.) 0
N 2. RUPTURED NODE
J (NODE 18 AT 9.75 Fr.) s1
C50 Wa
e-o
r-0
W
U),
2
CIo
C.)
0
00
a I I I
p0.0 20.0 40.0 60.0 80.0 100.0 120.0 140.0 160.0 180.0 20*0.0 TIME - SECONDS
Figuire 3.44 Cladding Temperature during Refill and Reflood Periods, 0.8 DLCLG, Top Skewe er Shape

60 ANF-87-159
4.0 CONCLUSIONS
For break sizes up to and including the double-ended severance of a reactor
primary coolant pipe, the Emergency Core Cooling System for H. B. Robinson
Unit 2 will meet the Acceptance Criteria as specified in 10 CFR 50.46, with
the 1.70 (FAH) limit and the axially dependent power peaking limit for 2.32
(FqT) shown in Figure 2.1. The criteria are as follows:
(1) The calculated peak fuel element clad temperature does not exceed the
2200'F limit.
(2) The amount of fuel element cladding that reacts chemically with water
or steam does not exceed 1% of the total amount of zircaloy in the
reactor.
(3) The cladding temperature transient is terminated at a time when the
core geometry is still amenable to cooling. The local cladding
oxidation limit of 17% is not exceeded during or after quenching.
(4) The core temperature is reduced and decay heat is removed for an extended period of time, as required by the long-lived radioactivity
remaining in the core.

61 ANF-87-159
5.0 REFERENCES
(1) H.B. Robinson Unit 2 Technical Specifications, Docket No. 50-261, Page 3.10-22, Figure 3.10-3, Amendment 109.
(2) "H.B. Robinson Unit 2 Large Break LOCA-ECCS Analysis with Increased Enthalpy Rise Factor: Break Spectrum," XN-NF-84-72, Supplement 1, Exxon Nuclear Company, Inc., Richland, WA 99352, August 1984.
(3) Dennis M. Crutchfiel& (USNRC Asst. Director Division of PWR Licensing-B) to Gary M. Ward (ENC Manager, Reload Licensing), "Safety Evaluation ofExxon Nuclear Company's Large Break ECCS Evaluation Model EXEM/PWR and Acceptance for Referencing of Related Licensing Topical Reports," dated July 8, 1986.
(4) "Acceptance Criteria for Emergency Core Cooling Systems for Light'Water Cooled Nuclear Power Reactors," 10 CFR 50.46 and Appendix K of 10 CFR
. 50; Federal Register, Volume 39, Number 3, January 4, 1974.

ANF-87-159
Issue Date: 11/24/87
H. B. ROBINSON UNIT 2 LARGE BREAK LOCA/ECCS
ANALYSIS WITH AN INCREASED ENTHALPY RISE FACTOR
Distribution
FT Adams
TH Chen
NF Fausz
RC Gottula
JS Holm LA Nielsen
GL Ritter
B0 Stitt
IZ Stone
BD Webb
HE Williamson
CP&L/HG Shaw (12)
Document Control (5)