Embed Size (px)
Citation preview

Advanced C/C++Debugging (CDT project)
Tracing (Linux Tools PROJECT)
Dominique dot toupin at ericsson dot com
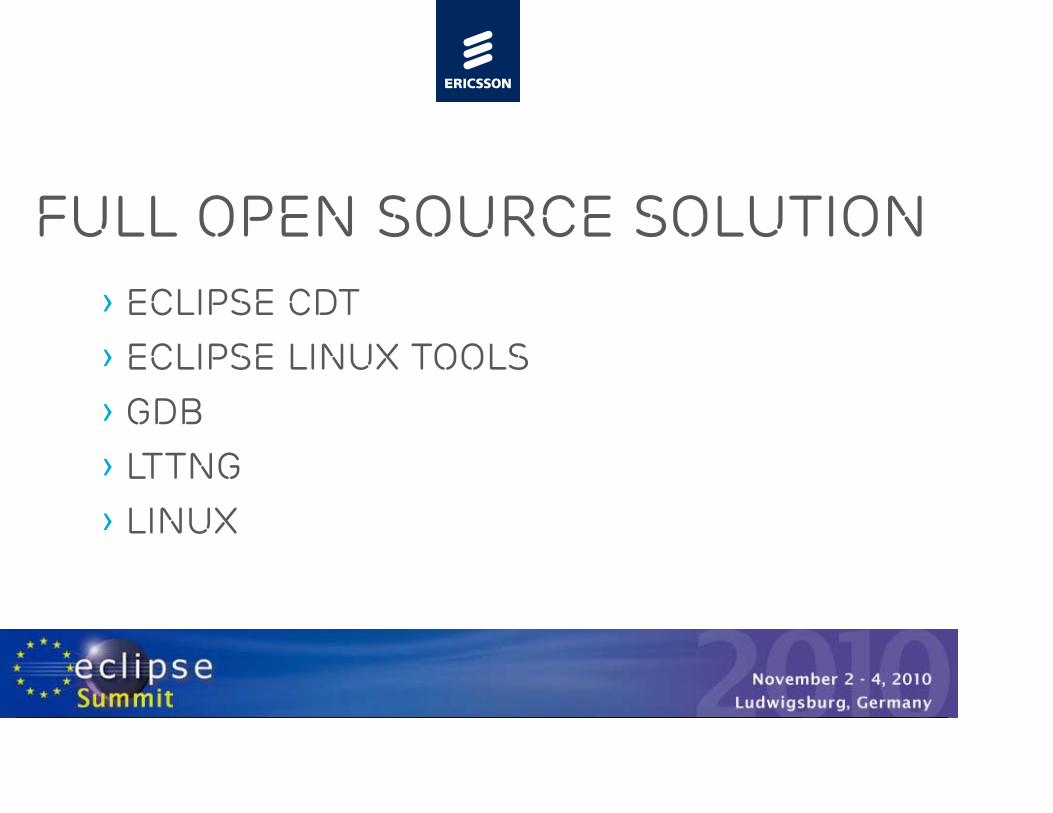
FULL open source solution› Eclipse CDT› Eclipse Linux Tools› GDB› LTTng› Linux


© Ericsson | Eclipse Summit 2010
Reverse debugging
› Allows to undo register and memory changes so as to move the execution backwards
› Uses recording and playback
Buttons to controlreverse execution Start recording
and displayexecution buttons

© Ericsson | Eclipse Summit 2010
Multi core-process-contexthttp://wiki.eclipse.org/CDT/MultiCoreDebugWorkingGroup
› More execution in parallel in many processes› Debugging related processes at the same time› Dynamically attach and detach from processes› Follow child process created with a fork, exec, › Global Breakpoint, many processes can execute the same code,
auto attached to the process only when the breakpoint is hit, also usefull for short lived-process
› Core awareness, threads are running on which cores
Cores are shownfor both threadsand processes
› More execution in parallel in many processes› Debugging related processes at the same time› Dynamically attach and detach from processes› Follow child process created with a fork, exec, › Global Breakpoint, many processes can execute the same code,
auto attached to the process only when the breakpoint is hit, also usefull for short lived-process
› Core awareness, threads are running on which cores

© Ericsson | Eclipse Summit 2010
© Ericsson | Eclipse Summit 2010
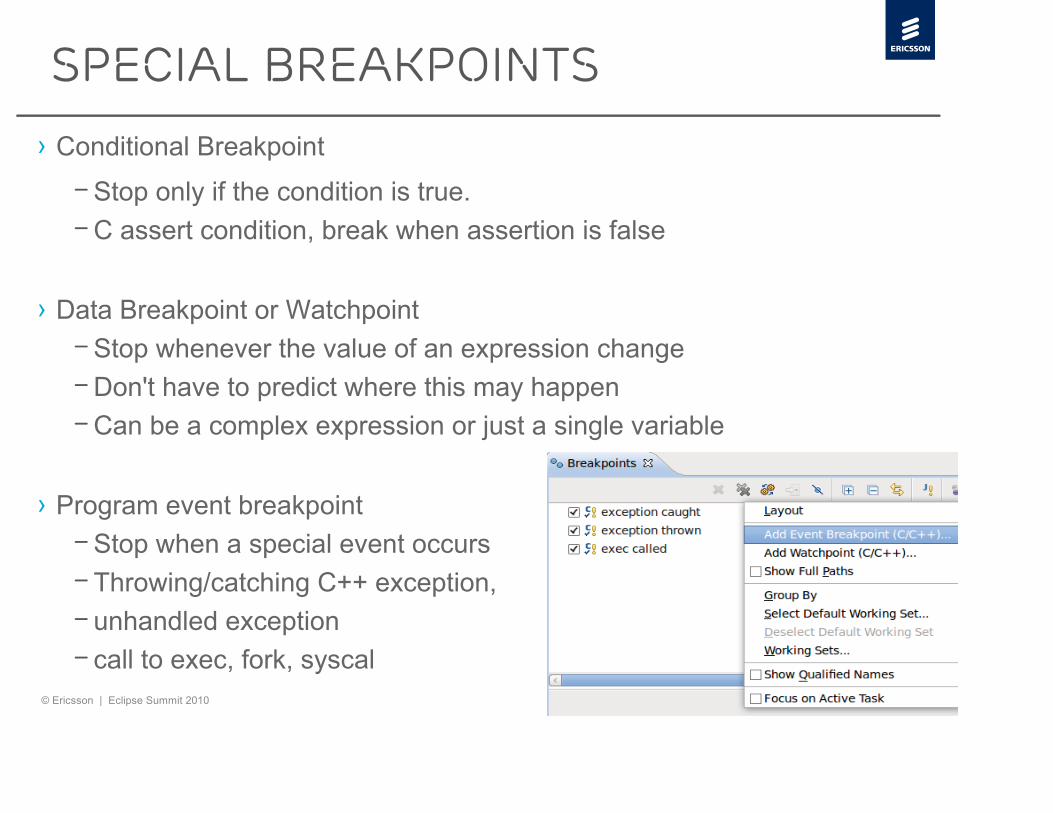
Special breakpoints
› Conditional Breakpoint – Stop only if the condition is true.– C assert condition, break when assertion is false
› Data Breakpoint or Watchpoint – Stop whenever the value of an expression change– Don't have to predict where this may happen – Can be a complex expression or just a single variable
› Program event breakpoint – Stop when a special event occurs– Throwing/catching C++ exception, – unhandled exception – call to exec, fork, syscal

● Display and editing of complex objects like Lists, Maps, Vectors
Complex structures shown in an intuitive way and editable
● Some programs have a deep interaction with OS resources DSF-GDB can show: process groups, file descriptors, internet-domain sockets, shared memory segments, semaphore, message queues, loaded kernel modules, etc.

© Ericsson | Eclipse Summit 2010
Non-STOP
› Debugging a process by stopping its execution might cause the program to change its behavior drastically, or perhaps fail, even when the code itself is correct.
– Troubleshooting in the lab– Chasing a race condition– Debugging problems happening only under heavy load – Investigating user interface issues
› Non-Stop allows to stop and examine one or more thread in the debugger while other threads continue to execute freely

© Ericsson | Eclipse Summit 2010
Dynamic Tracepoints
› Tracepoint collects user-specified info and continues execution without stopping any thread, essential for live sites
› Dynamic i.e. inserted with a jump (in process) or a trap› Data collection can be conditional to a user specified expression
› Tracepoint actions:– collect state trace data e.g. timestamp, and program data e.g. variables, register– evaluate expressions , e.g. modify trace variables– step (similar to breakpoint step) and collect data in each step
› A trace experiment can be stopped after the n'th hit› Static tracepoint (LTTng UST) can be stored in the debug tracepoint buffer› Debug tracepoint are good when no static tracepoint are available and for
small quantity of data

© Ericsson | Eclipse Summit 2010
Dynamic Tracepoints Visualization
› Intuitive display using debugger views
Line where trace was collected
Tracepoint thatcollected data
Collected data
© Ericsson | Eclipse Summit 2010
TRacing
› Need to understand what is going on in a system without causing disturbance? → Tracing is for you
› Compared to logging, tracing typically records lower-level events that occurs much more frequently
› Tracers are therefore optimized to handle a lot of data while having a small impact on the system
› Static Tracepoint – created by designer before compilation– represent wisdom of developers who are most familiar with the code– The rest of the world can use static tracepoint to extract a great deal
of useful information without having to know the code

© Ericsson | LinuxCon Tracing Mini-Summit 2010

© Ericsson | LinuxCon Tracing Mini-Summit 2010
LTTng Perspective

© Ericsson | LinuxCon Tracing Mini-Summit 2010
LTTng Histogram, Statistics
© Ericsson | LinuxCon Tracing Mini-Summit 2010
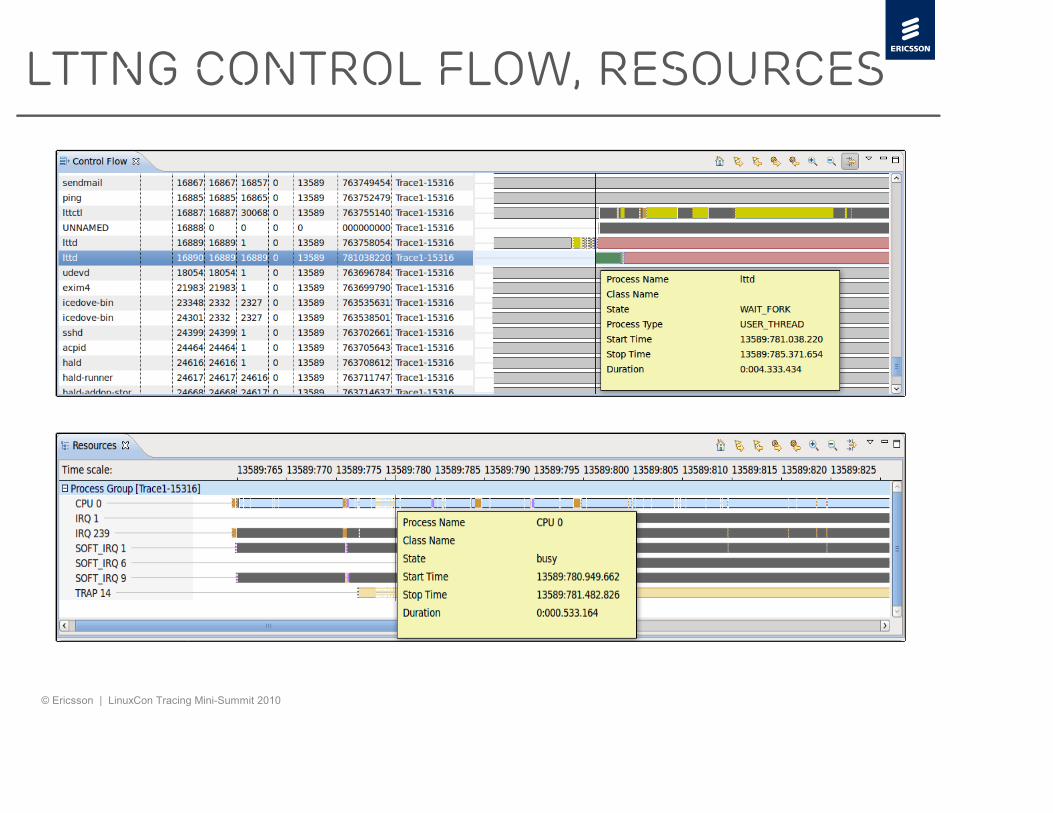
LTTng Control Flow, Resources

© Ericsson | LinuxCon Tracing Mini-Summit 2010
Upcoming Features
› General– Tracing tool control– Trace streaming– Heterogeneous traces– GDB Tracepoints– Source lookup– Performance tuning
› Analyses– Time correction (traces synchronization)
› Multi-core, multi-level, multi-node– Timing dependencies (between processes)– Latency Analysis– Pattern matching (security e.g. intrusion detection)
› Other trace format– Linux User Space Tracing– Text format– De-facto standard format Multi-core
association, Embedded Linux Forum, Samsung, Ericsson, Mentor Graphic, WindRiver, IBM, Freescale, TI, Nokia-Siemens Network, National Instruments, etc. www.multicore-association.org/workgroup/tiwg.phpCommon Trace Format Requirement: http://lwn.net/Articles/408824/ Common Trace Format Implementation: http://lwn.net/Articles/408825/

© Ericsson | LinuxCon Tracing Mini-Summit 2010
TMF
TMF – Architecture
View A
Analysis W
View B View C
View DRequest/Event Handler
Experiment
Analysis ZTrace 1 Trace 2
Ana
lysi
s X
ExternalComponent
ExternalComponent
An aly sis Y

© Ericsson | LinuxCon Tracing Mini-Summit 2010
TMF
LTTng – TMF Integration
ControlFlowView
ResourcesView
Statistics View
Kernel StateSystem
EventsView
HistogramView
TraceParsing
Lib
Experiment/Traceset
Trace nTrace 1 ProjectView
Some otherAnalysis Tool
Some otherView
JNI
© Ericsson | Eclipse Summit 2010
Additional Online Resources
› Eclipse CDT DSF-GBD lead: marc DOT khouzam AT ericsson DOT com [email protected]
› CDT Multi-core debugging http://wiki.eclipse.org/CDT/designs/MultiCoreDebug, http://wiki.eclipse.org/CDT/MultiCoreDebugWorkingGroup, http://wiki.eclipse.org/PinAndClone
› http://gcc.gnu.org/wiki/summit2010› Advanced Tracing Features using GDB and LTTng, Real-time debugging using GDB
Tracepoints, GDB Tracepoints: From Prototype to Production› http://gcc.gnu.org/wiki/HomePage?action=AttachFile&do=get&target=2009-GCC-Summ
Using Eclipse for Reverse, Multi-Process and Non-Stop Debugging with GDB p.65, GDB Tracepoints, Redux p.105, Hybrid multi-architecture debugging with GDB p.137
› http://www.gccsummit.org/2008/gcc-2008-proceedings.pdf Non-stop Multi-Threaded Debugging in GDB p.117
› Eclipse LTTng plug-in lead: francois DOT chouinard AT ericsson DOT com [email protected]
› http://www.eclipse.org/linuxtools/projectPages/lttng› http://www.lttng.org, http://lttng.org/content/success-stories
›

Advanced C/C++Debugging (CDT project)
Tracing (Linux Tools PROJECT)
Dominique dot toupin at ericsson dot com