Embed Size (px)
Citation preview
Teknillinen korkeakoulu Vesihuoltotekniikan julkaisuHelsinki University of Technology Water and Wastewater EngineeringEspoo 2009
ADVANCED OPERATION AND CONTROL METHODS OF MUNICIPALWASTEWATER TREATMENT PROCESSES IN FINLAND
Henri Haimi, Michela Mulas, Kristian Sahlstedt and Riku Vahala

Teknillinen korkeakoulu Vesihuoltotekniikan julkaisuHelsinki University of Technology Water and Wastewater EngineeringEspoo 2009
ADVANCED OPERATION AND CONTROL METHODS OF MUNICIPALWASTEWATER TREATMENT PROCESSES IN FINLAND
Henri Haimi, Michela Mulas, Kristian Sahlstedt and Riku Vahala
Teknillinen korkeakouluVesihuoltotekniikka
Helsinki University of TechnologyWater and Wastewater Engineering

Helsinki University of TechnologyWater and Wastewater EngineeringP.O. Box 5200FI02015 TKKFinlandTel. +358 9 4511Fax. +358 9 451 3856Email: [email protected]
ISBN 9789512299751

____________________________________________________________________________________________
Advanced operation and control methods of municipalwastewater treatment processes in Finland
2
Contents
INTRODUCTION ............................................................................................................................................. 4
1.1 MOTIVATIONS ............................................................................................................................................ 41.2 OBJECTIVES ............................................................................................................................................... 51.3 REPORT OVERVIEW..................................................................................................................................... 6
PART I............................................................................................................................................................... 7
CHAPTER 2. MODELLING AND SIMULATION.......................................................................................... 9
2.1 ACTIVATED SLUDGE PROCESS MODELS ........................................................................................................ 9Bioreactor models....................................................................................................................................... 9Secondary settler models........................................................................................................................... 10ASP Simplified models .............................................................................................................................. 11
2.2 IWA/COST BENCHMARK SIMULATION MODELS ....................................................................................... 142.3 PLANTWIDE MODELS ............................................................................................................................... 162.4 PROCESS SIMULATION ENVIRONMENT....................................................................................................... 17
CHAPTER 3. PROCESS CONTROL............................................................................................................. 20
3.1 FEEDBACK CONTROL ALGORITHMS............................................................................................................ 20Onoff control........................................................................................................................................... 20PID algorithms......................................................................................................................................... 21
3.2 FEEDFORWARD CONTROL ......................................................................................................................... 223.3 ADVANCED CONTROL ALGORITHMS .......................................................................................................... 23
Cascade Control....................................................................................................................................... 23Model predictive control ........................................................................................................................... 24Fuzzy logic control ................................................................................................................................... 26Artificial neural networks.......................................................................................................................... 28
3.4 CONTROL APPLICATIONS........................................................................................................................... 29BSM1 applications.................................................................................................................................... 29BSM2 applications.................................................................................................................................... 33Real plant control examples ...................................................................................................................... 34
3.4 PLANTWIDE CONTROL ............................................................................................................................. 36
CHAPTER 4. SENSORS AND DATA ANALYSIS ........................................................................................ 39
4.1 SENSORS AND ANALYSERS ....................................................................................................................... 39Online sensors......................................................................................................................................... 39Softsensors .............................................................................................................................................. 39Predicting the wastewater characteristics ................................................................................................. 41
4.2 DATA ANALYSIS AND FAULT DETECTION ................................................................................................... 42Data screening ......................................................................................................................................... 42Data reconciliation................................................................................................................................... 42Fault detection and diagnosis.................................................................................................................... 43
PART II............................................................................................................................................................ 44
CHAPTER 3. ICA AT FINNISH ASPS .......................................................................................................... 46
3.2 PLANT CONFIGURATIONS AND OPERATION ................................................................................................. 46Energy and chemical consumptions........................................................................................................... 48Wastewater quality ................................................................................................................................... 49Employees ................................................................................................................................................ 49Wastewater quality ................................................................................................................................... 50
3.3 STATUS OF ICA IN FINLAND ..................................................................................................................... 50Sensors..................................................................................................................................................... 50Controls ................................................................................................................................................... 51Alarm ....................................................................................................................................................... 52

____________________________________________________________________________________________
Advanced operation and control methods of municipalwastewater treatment processes in Finland
3
Modelling ................................................................................................................................................. 52Attitude towards ICA ................................................................................................................................ 53Considerations from the WWTP visits ....................................................................................................... 54
CHAPTER 4. CONCLUSIONS AND FUTURE RESEARCH NEEDS ......................................................... 56
REFERENCES ................................................................................................................................................ 59
APPENDIX A: QUESTIONNAIRE................................................................................................................ 67
APPENDIX B. KEY FIGURES OF THE WWTP SURVEY.......................................................................... 83

____________________________________________________________________________________________
Advanced operation and control methods of municipalwastewater treatment processes in Finland
4
IntroductionThe importance of instrumentation, control and automation (ICA) at municipal wastewatertreatment plants (WWTPs) has increased as treatment requirements have tightened and theprocesses have therefore become more complicated. A big effort has been done in recent yearsin research and development work in this field: the reliability and accuracy of online sensorshas increased due to continuous work of manufacturers and researchers and in turn also theapplicability of sensor use in online control increased. Development of feasible softsensors fordifferent purposes in wastewater treatment has as well made operation of the plants moreadvanced. In the past years computing power of the computers used to be a limiting factor inuse of ICA, but that is no longer case; practically free computing power is one of the mostimportant steps for possibilities of using advanced ICA not only at WWTPs but also in otherindustrial works. Technical development has also been made regarding to different actuatorsused in wastewater treatment which does enable more reliable and efficient control of theprocesses.
In this Chapter the driving motivations for the present work are explained, as well as thedefinition of the main goals are clarified.
1.1 MotivationsSince the implementation of the European Directive 91/271/CEE regarding urban wastewatertreatment, environmental water protection has gained increasing public awareness. Removalrequirements of ammonia have been changed to total nitrogen removal requirements during therecent years also at many Finnish WWTPs and the trend is likely to continue. For this reason,the number of unit processes has increased and many of them require specific conditions forsuccessful performance. Moreover, operation flexibility requires reliable online monitoringand control methods for using the plant capacity efficiently. Plant complexity and the highnumber of unit processes is one of the driving forces of increased need of ICA technology inwastewater treatment. As different unit processes are based on chemical, mechanical andbiological phenomena, operation, control and monitoring of the whole plant are highlychallenging. In addition, A WWTP is characterized by frequent variations in environmentalconditions such as feed flow rate, temperature, influent concentration of nutrients andconcentration peaks of toxic substances that may cause serious problems in a biologicalwastewater treatment. These variations can affect the process performance significantly,sometime even resulting in process failures.
As number and reliability of online measurement sensors and analysers has increased oneimportant question arising considers possibilities of utilizing the large amount of processinformation gathered. The process information should be possible to be easily refined topractical reports for various purposes and target groups relating wastewater treatment plantoperation. Another highly important use for online measurements is their control applications.Traditionally process monitoring has been the main purpose of major part of onlinemeasurements; morever, in the near future also automatic fault diagnosis is likely to be asubstantial use for the sensor measurements.
Two main motivations in the implementation of ICA strategies for modern WWTP arise:

____________________________________________________________________________________________
Advanced operation and control methods of municipalwastewater treatment processes in Finland
5
• Tighter effluent quality standards. To achieve the effluent quality set in the regulationsutilizing advanced ICA is beneficial; additionally, the effluent concentration can be keptmore stable and process faults disturbing the treatment can be decreased. As the number ofunit processes is increased becoming, for instance, also tertiary treatment processes morecommon, the control of the whole plant more grows to be complex. The effluent quality canbe controlled efficiently by using modern ICA and achieving in this way even the tightenvironmental regulations.
• Cost Reduction. It is demonstrated (e.g. Olsson et al., 2005) that a good plant managementand ICA may increase the capacity of a nutrient removal WWTP by 1030%, reducing thenecessarily need for enlargement of treatment basins when renovating the plant. Improvingthe efficiency of the processes leads to smaller area needed for new WWTPs which meansin turns lower construction costs. In the next 1020 years further understanding and use ofadvanced ICA is predicted to reduce the total system investments by another 2050%. Inaddition, significant reduction in operation costs might be achieved in nutrient removalplants relate to energy needed for aeration and various chemicals.
The wastewater treatment has become part of a production process where the quality control ofthe effluent is very important since poor operation of the treatment process can lead toimportant production losses and environmental problems, thus enhancement of optimaloperation and advanced control strategies have the potential to management of the plant in avery successful way.
1.2 ObjectivesFor a long time, the application of process control and automation over a WWTP has beenencountering in the past years several difficulties, such as: (i) process complexity (includingchemical, mechanical and biological phenomena); (ii) difficulties in controlling the process(due to the numerous parameters influencing the process for instance influent flow rate, organicand nutrient load variations, toxicity, temperature, etc.); (iii) different dynamics for a processthat only seldom is steady–state conditions. The first need and goal of the present work hasbeen the understanding of the current direction in research and development of optimalpractices and advanced process control operation, by means of an exhaustive literature reviewin this field. Taking as starting point the extensive technical report by Olsson et al. (2005), adetailed information on the research projects executed during recent years is provided in thepublications referred in the literature review.
The background information on sensors, modelling and control introduces the most importantadvanced control methods used in wastewater treatment worldwide. This gives useful cue to theplant operators and engineers, a comprehensive overview on control solutions that could besuccessfully implemented at WWTPs instead of the traditional options. In modelling sector aswell technical development has been made in recent years and some possibilities of dynamicmodelling and simulation in today and the trends of the future are introduced in this Report.
Stateoftheart surveys on ICA at WWTPs have been performed over the years with theperspective of different countries. With this regard, the objective here is to assess and documentthe current status of ICA in municipal WWTPs in Finland in order to determine successfulpractices and the needs of plant operators. This gives also the possibility to compare ICAsituation among Finnish plants and also to the practices in other countries. The background

____________________________________________________________________________________________
Advanced operation and control methods of municipalwastewater treatment processes in Finland
6
information of the plant configurations, operation and wastewater quality is useful for peopleinvolved in various sectors of wastewater treatment industry.
Eventually, recognizing the needs of further research and development in field of ICA is animportant goal of the present work since the development of ICA in wastewater treatment inFinland in the future will be practically related to the state of ICA presented in this survey.
1.3 Report overviewThis Report deals with advanced operation and control methods of municipal wastewatertreatment processes in Finland. It contains two main parts:
1. The first part reports the survey on the current status of research. The different aspect ofmodelling and simulation (Chapter 2), control strategies (Chapter 3) and data analysis(Chapter 4), are defined and the recent overcomes in academic word are analysed.
2. The second part reports the survey done in the Finland. The method of investigation isbased on a questionnaire including key elements regarding plant design, operation andutilization of ICA, and operator’s opinion which was sent to large (> 100 000 p.e.),mediumsized (30 000 – 100 000 p.e.) and small WWTPs in Finland. Onsite surveys ofsome of the most representative WWTPs were made.
Concise versions of the results reported in this work have been submitted to international andnational conferences.

____________________________________________________________________________________________
Advanced operation and control methods of municipalwastewater treatment processes in Finland
7
Part I
Literature Review

____________________________________________________________________________________________
Advanced operation and control methods of municipalwastewater treatment processes in Finland
8
Conferences on ICA in wastewater treatment have been held since 1973. Then the ICAconference took place in London under sponsorship of IAWPR, International Association onWater Pollution Research, presently called International Water Association (IWA). Back thenthe lack of adequate instrumentation for the conditions of wastewater treatment was the keyissue. As computing power of computers was low at the time, hardly any closed loop plantcontrol was performed. In 1974 according to a survey done at some fifty WWTPs 12% of plantsin USA had automatic online dissolved oxygen (DO) control implemented. IAWPRconference on instrumentation and control was held in Stockholm in 1977; by then progress inDO and pH sensors had improved significantly their use in online monitoring and control.Dynamic models of unit processes were presented. Computer was also used for several controltasks such as DO, return sludge flow rate and bypass control at a WWTP in Sweden. Waterpollution control acts and funding programs began to encourage instrumentation andautomation of large and mediumsized plants in the 1970s.
In 1985 DO and suspended solids (SS) sensors were used on a routine basis and a selftuningDO control in fullscale was reported for the first time. By then microcomputers were wellestablished at WWTPs. In 1990 computer and communication technology were significantdriving forces for more advanced control; also new sensor technology and the first versionscommercial interactive simulators were introduced. In 1993 online nutrient sensors wereavailable. The role of dynamic modelling and simulation software were recognized important indeveloping control strategies. Also new control methods such as neural networks and fuzzycontrol became more common. In 1997 significant progress in models for online control hadbeen achieved. During 2000s there has been development in online nutrient sensors andanalysers, which are more robust and reliable enabling use of them in online control. Also newoptical DO sensor types have been introduced and become more popular in wastewatertreatment.
Olsson et al. (2005) provide a detailed history of ICA in wastewater treatment and of the relatedconferences as well.

____________________________________________________________________________________________
Advanced operation and control methods of municipalwastewater treatment processes in Finland
9
Chapter 2. Modelling and Simulation
Traditionally, the formal modelling of systems has been done via a mathematical model, whichattempts to find analytical solutions enabling the prediction of the behaviour of the system froma set of parameters and initial conditions. Modelling techniques include statistical methods,computer simulation, system identification, and sensitivity analysis; however, one of these is asimportant as the ability to understand the underlying dynamics of a complex system. Modelsapplied for prediction aim at providing an accurate and fast image of a real system’s behaviourunder different conditions.
Models may be linear with respect to variables or parameters; furthermore, a model can benonlinear to parameters and linear to variables or vice versa. Linear models are used frequently,because the analytical solution can be found. For nonlinear models numerical solutions arepredominant. Term mechanistic, physiological and whitebox are used to describe that model’sstructure is based on physical, chemical and biological laws. Phenomenological, blackbox,empirical and heuristic the terms used for models that are based on empiricism rather than laws.A combination of mechanical and phenomenological approach is called a greybox modelling.
Validated process models can be used for dynamic simulations e.g. with different kinds of inputdata. In simulations the mathematical equations of process model are solved and the resultsgiven. Simulation is a reasonable way to extrapolate performance and scaling up process;additionally, it helps in understanding behaviour and mechanisms of processes. Also the effectsof system parameters and disturbances can be investigated using process simulation.
The aim of this chapter is to review the current status of modelling and simulation ofwastewater treatment process.
2.1 Activated sludge process modelsThe activated sludge process (ASP) is the most widely used biological treatment of liquidwaste, essentially because it is a cheap technology which can be adapted to any kind ofwastewater. In the activated sludge process, a bacterial biomass suspension (the activatedsludge) is responsible for the removal of pollutants. Depending on the design and the specificapplication, an activated sludge wastewater treatment plant can achieve biological nitrogenremoval and biological phosphorus removal, plus the removal of organic carbon substances.Many different activated sludge process configurations have evolved during the years:Jeppsson (1996) provides an exhaustive review on the historical evolution of the activatedsludge process.
Bioreactor modelsThere are several models describing the biological process in the activated sludge plant, thedevelopments in the family proposed by the International Water Association (IWA) represent amajor contribute. The models of ASM family (ASM1, ASM2, ASM2d, ASM3) are used inmost of the modelling and simulation studies (Henze et al., 2002); additionally, those areconsidered stateofart models of activated sludge processes and are used in most of thecommercial simulation platforms.

____________________________________________________________________________________________
Advanced operation and control methods of municipalwastewater treatment processes in Finland
10
When creating Activated Sludge Model No. 1 (ASM1) the aim for the IWA Task Group onMathematical Modelling for Design and Operation of Biological Wastewater Treatment was tocreate a common platform that could be used for future development of models for nitrogenremoval activated sludge processes; furthermore, the aim was to develop a model with aminimum of complexity. ASM1 was published in its final form in 1987. In ASM1 two kinds ofsubstrate, readily and slowly biodegradable COD (RBCOD and SBCOD), are introduced and ahydrolysis process is included. In ASM1 it is also assumed that slowly biodegradable substrateconsists fully of particulate substrate (XS). ASM1 includes nitrogen and organic matter removalwith simultaneous consumption of oxygen and nitrate as electron acceptors; however, it doesnot contain biological phosphorous removal. ASM1 was developed mainly for municipalactivated sludge plants (Henze et al., 2002; Henze et al., 2008).
Activated Sludge Model No. 2 (ASM2) was published in 1995; additionally, the modelincluded both nitrogen removal and biological phosphorus removal. The role of denitrificationin relation to biological phosphorus removal was still unclear, and Task Group decided not toinclude that element. However, the development in research was fast, and denitrifying PAOs(phosphorus accumulating organisms) were needed for simulation of many results fromresearch and practice. Because of this, the ASM2 model was expanded in 1999 into the ASM2dmodel, where denitrifying PAOs were included (Henze et al., 2002).
Activated Sludge Model No. 3 (ASM3) describes the same processes as ASM1; however,ASM3 was introduced to correct the deficiencies of ASM1. The most important reason forintroducing ASM3 was the recognition of importance of three rates of oxygen consumption inthe process: the rapid rate of oxygen consumption for degradation of RBCOD, slow rateassociated with degradation of SBCOD, and even slower endogenous oxygen uptake rate(OUR). In ASM1 there is only one oxygen consuming process, which makes calibration of themodel very difficult. Calibration of ASM3 should be easier mainly because of converting thecircular growthdeathgrowth (death regeneration) model by endogenous respiration model(Henze et al., 2008).
Secondary settler modelsActivated sludge plants transform organic matter into biomass. The effective operation of theprocess requires the biomass to be removed from the liquid stream (in the secondary settler)prior to being discharged in the receiving waters. The sedimentation of the particles in theliquor is achieved by gravity along with the density differences between the particles and theliquid. Part of the biomass is purged, while a large fraction is returned to the biological reactorto maintain the appropriate substratetobiomass ratio. This means that the settler combinesfunctions of clarification and thickening into one unit.
The complex behaviour of the secondary settler and its importance for the successful operationof the ASP have made the settling process a great challenge for researchers working in the fieldof mathematical modelling. A first physical model of batch sedimentation was developed byKynch (1952), in which the sludge transport is described by a mass balance partial differentialequation and that can be considered the origin of the solid flux theory. Different authorsintroduced later several model extensions and among the others Petty (1975) considered thecontinuous thickening of a solidliquid suspension by gravity sedimentation; Vitasovic (1991),Takács et al. (1991) and lately Diehl (2007) considered the sedimentation flux from layer to
____________________________________________________________________________________________
Advanced operation and control methods of municipalwastewater treatment processes in Finland
11
layer. Jeppsson (1996) provides an extensive review on the different modelling approaches,whereas to investigate the functioning of the settler, the IWA report (Ekama et al., 1997) givesa complete reference.
In today’s practice, Takács’ model (Takács et al., 1996) is by far the most widely usedmathematical representation of the secondary settler in published studies and commercialsoftware environments. However, some studies (as for instance Jeppsson and Diehl (1996),Queinnec et al. (2001), Verdickt and Van Impe (2002)) stress the fact that the number ofdiscretization layers is used as a model parameter in order to match the experimentalobservations. Typical number of 10 layers is used to introduce (artificial) numerical diffusionand smooth off the concentration profiles. This model is therefore used without selecting anumber of layers in agreement with numerical convergence (the number of layers should beselected large enough so that the numerical solution to the mass balance equations is computedwith an acceptable accuracy) and without distinguishing model formulation (i.e. the physicalmodel parameters) and numerical solution (i.e. the number of layers or grid points in anumerical algorithm). Currently, David et al. (2009) consider the Method of Lines, which is astraightforward twostep procedure, where the PDEs (Partial Differential Equations) are firstdiscretized in space, then integrated in time, can be used to solve the convection–diffusion PDEdescribing material transport in the secondary settler.
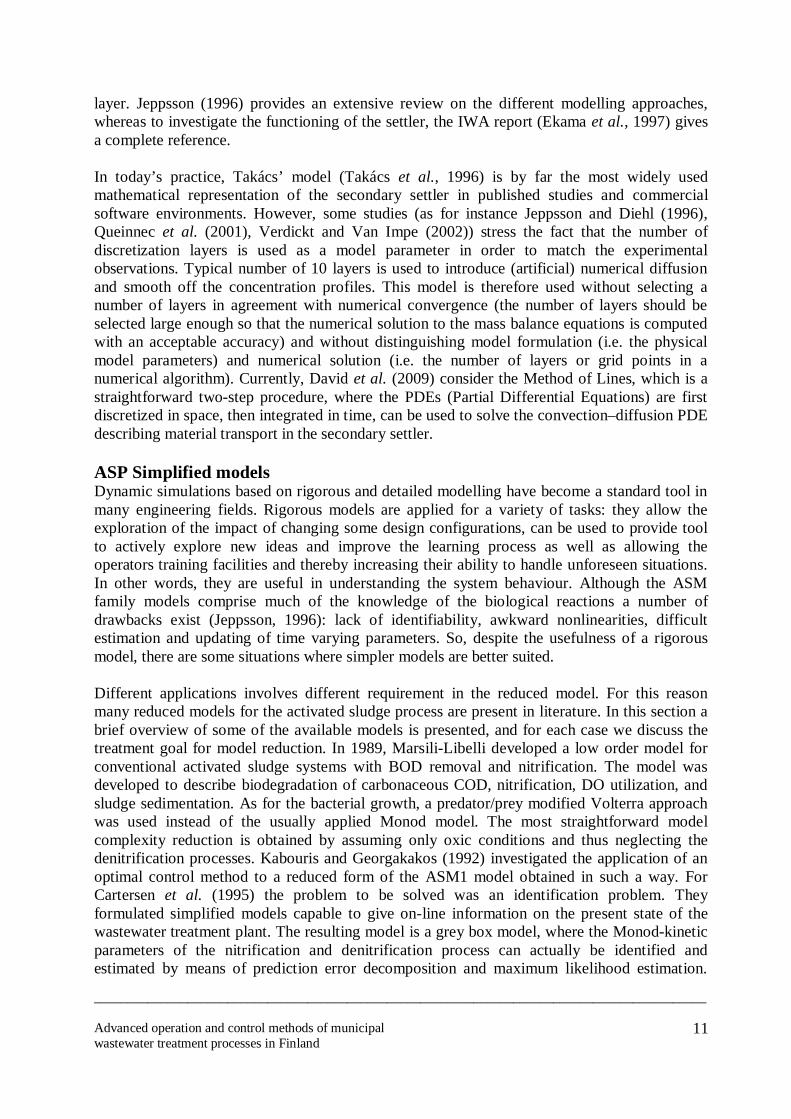
ASP Simplified modelsDynamic simulations based on rigorous and detailed modelling have become a standard tool inmany engineering fields. Rigorous models are applied for a variety of tasks: they allow theexploration of the impact of changing some design configurations, can be used to provide toolto actively explore new ideas and improve the learning process as well as allowing theoperators training facilities and thereby increasing their ability to handle unforeseen situations.In other words, they are useful in understanding the system behaviour. Although the ASMfamily models comprise much of the knowledge of the biological reactions a number ofdrawbacks exist (Jeppsson, 1996): lack of identifiability, awkward nonlinearities, difficultestimation and updating of time varying parameters. So, despite the usefulness of a rigorousmodel, there are some situations where simpler models are better suited.
Different applications involves different requirement in the reduced model. For this reasonmany reduced models for the activated sludge process are present in literature. In this section abrief overview of some of the available models is presented, and for each case we discuss thetreatment goal for model reduction. In 1989, MarsiliLibelli developed a low order model forconventional activated sludge systems with BOD removal and nitrification. The model wasdeveloped to describe biodegradation of carbonaceous COD, nitrification, DO utilization, andsludge sedimentation. As for the bacterial growth, a predator/prey modified Volterra approachwas used instead of the usually applied Monod model. The most straightforward modelcomplexity reduction is obtained by assuming only oxic conditions and thus neglecting thedenitrification processes. Kabouris and Georgakakos (1992) investigated the application of anoptimal control method to a reduced form of the ASM1 model obtained in such a way. ForCartersen et al. (1995) the problem to be solved was an identification problem. Theyformulated simplified models capable to give online information on the present state of thewastewater treatment plant. The resulting model is a grey box model, where the Monodkineticparameters of the nitrification and denitrification process can actually be identified andestimated by means of prediction error decomposition and maximum likelihood estimation.

____________________________________________________________________________________________
Advanced operation and control methods of municipalwastewater treatment processes in Finland
12
They showed for the BioDeniPho system that it is possible to find a unique solution for each ofthe unknown parameters of the model, starting from data collected in a real process. In 1995,Zhao et al. introduced a simplified ASM1 model to describe the nitrogen dynamics in analternating activated sludge process. The proposed model is represented by a set of dynamicsequations in terms of ammonia and nitrate concentrations (online measurable). Isaacs (1996)tested three modelbased control strategies on a BioDeniPho system. All controllers employ arelational model and a predictive model and different models were applied for different controlstrategies. Along the same line Julien et al. (in 1998 and in 1999) developed a reduced ordermodel for identification and control of a single activatedsludge reactor operating nitrificationand denitrification. The reduced model is split into two submodels, one threedimensional statesubmodel in aerobic conditions (considering as state variables nitrate, ammonia and dissolvedoxygen) and one twodimensional submodel in anoxic conditions, where only nitrate andammonia state variables are considered. The identifiability is based on online oxygen andnitrate concentrations data, showing that the reduced model is structurally identifiable. Lately,Gomez et al. (2000), Chachuat et al. (2003), Smets et al. (2003), Sperandio and Queinnec(2004) and Mulas et al. (2007) proposed different approach to reduce the model complexity ofthe ASM1.
An activated sludge plant in Avedøre, Denmark, was modelled using Matlab/Simulink andcontrol strategies were tested with the calibrated model. A modified activated sludge model No.2d (ASM2d) was used for modelling the activated sludge tanks and a reactive settler model formodelling the secondary clarifiers. Also online recordings of all the direct and indirect controlhandles were used as model inputs for calibration purposes. 30 days of control inputs precedingthe measurement campaign were applied to obtain proper initial conditions for the plantsimulation states (Ingildsen et al., 2006).
Before modelling a preliminary sampling campaign on influent was conducted to investigatedaily variations in the influent concentrations. After that a 13day long measurement campaignwas done; furthermore, daily flowproportional samples of the presettled influent and theeffluent were collected and analysed for different components. The proper model calibrationwas done stepwise by distinguishing three subsystems: (1) the suspended solids system(calibration of the sludge production and balances); (2) the nitrogen system (calibration ofnitrification and denitrification processes); and (3) the phosphorous system (calibration of Premoval processes). Online sensor measurements as well as laboratory measurements wereused in the calibration the three subsystems. For testing of control strategies with model ofAvedøre WWTP a benchmark system with a normal dry weather influent file and variousdisturbance tests were prepared. The standard control strategy used at the WWTP wassimulated first for a validation. Variation for influent concentrations and flow rates werecreated using a random number generator; thus, 90 days of variable influent concentration datawas created. In a successful phosphorous removal strategy also PHA (polyhydroxyalkanoate)content is taken into account; moreover, that was noticed to reduce need of precipitationchemical considerably (Ingildsen et al., 2006).
Three consulting teams conducted independent modelling projects at three different WWTPs inorder to evaluate and optimise the plant operation; two in USA (Denver, 1,800,000 p.e. andUpper Marlboro, 250,000 p.e.) and one in Finland (Espoo, 250,000 p.e.) (Phillips et al., 2009).The calibration methods and length of the sampling periods were different for each modellingcase. GPSX simulation software was used in each of the simulation cases; with different

____________________________________________________________________________________________
Advanced operation and control methods of municipalwastewater treatment processes in Finland
13
activated sludge and clarifier models. Three common factors were found to be essential tosuccess of the projects: (1) additional sampling to define dynamic model inputs and influentfractions; (2) careful planning; and (3) effective and frequent communication between all theteam members including the plant personnel.
In Espoo plant modelling case the most challenging process to calibrate was the primaryclarifier because models assume equal settling velocities for all particular COD fractions,contrary to practical observations. In modelling the Espoo WWTP it was found that externalcarbon was not optimal to dose in the last anoxic zone in order to avoid unnecessary carryoverof readily bioavailable COD to the aerobic zones; in addition, the wastage of methanol couldbe cut by 30%. It was also conducted that the yearly average nitrogen target of 70% could bemore costeffectively reached by running the plant at 80% nitrogen removal in the summer and60% nitrogen removal in the winter. Solid balance simulations showed that insufficientthickening and digestion capacity and the overflow from the storage tank before centrifugeswere the main causes of problems with solids balance control. In Denver plant modelling casethe return sludge flow was optimized; likewise, the sizes of both anaerobic and aerobic zoneswere optimized, and the risk of nitrifier washout at different design sludge retention times(SRT) evaluated. In Upper Marlboro modelling case it was showed that maintaining theexisting threesludge system provides for the most robust nutrient removal process of thealternatives evaluated. (Phillips et al., 2009)
Rodríguez et al. (2009) presented a wastewater treatment modelling methodology based onExcel and MatlabSimulink for researchers without programming expertise. The proposedframework also provides programming expert researchers a highly flexible and modifiableplatform on which to base more complex process model implementations. The use of Excelinterface for most of the implementation tasks makes the methodology accessible for nonprogramming researchers by providing them with clear overview of the models in a spreadsheetfile; in the same way, it shortens time and effort necessary to implement and modify modelstructures also for researchers with programming expertise. Most of the information definingthe model, its parameters and a feeding schedule are provided using just an Excel interface.Only the equations to calculate the rates of reactions and transfer processes have to be definedin a Matlab file. The model implementation methodology presented has been successfully usedfor a number of model implementations in research applications. It also provides a useful toolfor teaching by demonstrating the dynamics and factors affecting a wastewater treatmentprocess.
Modelling and simulation of wastewater treatment can also be combined with other software.An interactive multiobjective optimization tool for decision support regarding to WWTP designwas proposed by Hakanen et al. (2008). Moreover, in the tool GPSX simulation platform andINDNIMBUS method for solving industrial multiobjective optimization problems werecombined. The optimization problems produced by NIMBUS method are solved by using theControlled Random Search algorithm. In the case study presented a process model of nitrifyingactivated sludge plant; in addition, ASM3 and the Takacs models were used in modelling theactivated sludge process and secondary clarifier. Residual ammonia nitrogen concentration,alkalinity chemical dosing rate and aeration energy consumption were considered in theoptimization case task. In conclusion, the presented method was noticed to be promising and toprovide a good basis for further research including e.g. more complex processes, factorsaffecting investment costs and more operational variables such as other chemical doses.

____________________________________________________________________________________________
Advanced operation and control methods of municipalwastewater treatment processes in Finland
14
2.2 IWA/COST Benchmark Simulation ModelsA working group of COST Actions 624 and 682 together with the IWA Task Group forRespirometry has developed a benchmarking protocol and software tool for benchmarking, i.e.performance assessment and evaluation of control strategies for wastewater treatment systems(Copp, 2002; Alex et al., 2008). The benchmark is a simulation environment defining a plantlayout, a simulation model, influent loads, test procedures and evaluation criteria. IWA/COSTBenchmark Simulation Model has recently been extended to include a complete WWTP (i.e.wastewater and sludge treatment processes as well as interactions between them) (BSM2,Jeppson et al., 2007). A simplified phenomenological model of a sewer system is also beingadded (Olsson and Jeppson, 2006).
Based on the IWA/COST Benchmark Simulation Model No.1 (BSM1), the considered layout isreported in Figure 1, it represents a fully defined protocol that characterizes the processincluding a plant layout and two conventional control systems (Copp, 2002). The bioreactorconsists of five reactors, first two anoxic zones (prenitrification) followed by three aerobicones (nitrification). To maintain the microbiological population, the sludge from the settler isrecirculated into the anoxic basin (returned activated sludge), and part of the mixed liquor isrecycled to the inlet of the bioreactor (internal recycle). The sludge concentration is keptconstant by means of sludge withdrawn pumped continuously from the settler. As for thecontrol, a DO controller is implemented to maintain the target aeration in the bioreactor;besides, the DO level in the fifth reactor is controlled with a PI controller that manipulates theaeration coefficient for this reactor, K5
La. In addition, one control loop is used for controllingthe nitrate removal by manipulating the internal recycle flowrate.
Figure 1. Plant layout for BSM1 Benchmark Simulation Model (Alex et al., 2008).
The plant is designed for an average influent dryweather flow rate of 18 446 m3/d and anaverage biodegradable COD in the influent of 300 g/m3. The influent dynamics are defined bymeans of three files: dry weather, rain weather and storm weather; additionally, each of theinfluent files consists of data of two weeks. The biomass sludge age used in BSM1 model isabout nine days (Alex et al., 2008).
The success of BSM1 as efficient platform for control strategies comparison in biologicalnitrogen removal activated sludge plants is proven by the large number of scientific papers,

____________________________________________________________________________________________
Advanced operation and control methods of municipalwastewater treatment processes in Finland
15
already in 2004 more than 100 according to Jeppsson and Pons (2004), using the benchmark orpart of the benchmark (e.g. influent files, plant performance evaluation criteria).
The more recent BSM2 model (Jeppsson et al., 2004; Jeppsson et al., 2007) concerns the wholeplant including also primary clarifier and sludge treatment with anaerobic digestion. BSM2implementations are available for wide range of simulation platforms including the mostpopular commercial software. Even though the plant consists of several unit processes,applying a supervisory control system taking into account the interactions between them isbeneficial for optimization of the plant operation. Furthermore, BSM2 aims at describing anactivated sludge plant with an influent load of 100 000 p.e. (80 000 from households and20 000 from industrial origin) and it includes many of the main processes often used at largescale WWTPs (Figure 2).
Figure 2. Plant layout for BSM2 Benchmark Simulation Model (Jeppson et al., 2007).
The intensive use of BSM1 and BSM2 has also revealed a number of limitations, such as:• Too short evaluation period;• The seasonal effects are not taken into account;• Sensor, actuator and process faults are not included.
These represent the main reasons for the natural followup of the first benchmark with thedefinitions of the longterm Benchmark Simulation Model No. 1 (BSM1_LT). Influent relateddisturbances for BSM1_LT/BSM2 are generated with a model, and typical influent dynamicphenomena generated with the BSM1_LT/BSM2 influent disturbance model, including diurnal,weekend, seasonal and holiday effects, as well as rainfall, are illustrated with simulation resultsin Gernaey et al. (2006). As a result of their work, the seasonal effects in terms of temperaturevariations and changing influent flow rate patters are included in the evaluation period of oneyear. The average temperature is 15°C and the amplitude of sin wave shaped variation is 5°C.In addition, more than 60 control handles are available for the model.

____________________________________________________________________________________________
Advanced operation and control methods of municipalwastewater treatment processes in Finland
16
2.3 Plantwide modelsThe second Benchmark Simulation Model BSM2 briefly introduced in the previous sectionrepresents the extension of the BSM1 to more plantwide point of view and actually alsodifferent authors have faced plantwide modelling for the entire WWTP taking into account thedynamic description of the most relevant process in the water and sludge lines and the flowsamong the different lines.
In particular, three different approaches for plantwide modelling are presented and analyzed byGrau et al. (2009): (i) direct connection among standard unitprocess models (“Interfaces”approach), (ii) modelling of the whole plant based on a common components vectors usingstandard biochemical models (“Standard Supermodel” approach), and (iii) modelling of thewhole plant based on a common components vectors constructing biochemical models adaptedto the plant under study (“Tailored Supermodel” approach). In the interfaces approach commonmodels of unit processes (e.g. ASM model family) are used. Main advantages of the approachare the use of all knowledge previously acquired about the practical implementation of wellknown standard models and their simplicity; however, the main disadvantage is that all themodel components (e.g. COD fractions, the description of organic nitrogen, the description ofpH versus alkalinity) are not the same or even compatible. Therefore, general methodology forconnecting any two standard models has been proposed (ContinuityBased InterfacingMethodology, CBIM). Elemental mass and charge continuity is guaranteed by means of a set ofinstantaneous conversions from the original model components to the destination model onesby a general procedure between any two standard models. Standard and Tailored Supermodelapproaches are based on a unique model for describing the most relevant biochemical, chemicaland physicochemical processes in all unit processes of the plant. All the transformations aretherefore active in all of the streams regardless of the type of the stream or unit process.Standard Supermodel approach is based on a set of standard models that describe the mostrelevant processes within the whole WWTP. Supermodels (e.g. BNRM1, ASMD) reproduce theactivated sludge units for biological carbon, nitrogen and phosphorous removal, anaerobicdigestion, some chemical precipitation processes and additional calculations (e.g. DO, pH, pHinhibitions) that can be switched on or off depending on the case study. The main advantage ofthe approach is that the need for model interfaces is eliminated and any applicabletransformations are simply turned on or off. In contrast, the weak points of the approach arelack of flexibility for describing simpler or more complex processes. The use of supermodels isrestricted to specific simulation platforms. The construction of a Tailored Supermodel is basedon the user selecting the set of compatible transformations strictly required to reproduce theactivity of the relevant bacteria populations in the WWTP under study. The main advantage ofthe approach is the flexibility it includes to construct supermodels that are specifically adaptedto the requirements of the WWTP studied. However, the weak point is that the flexibility can beeasily misused if there is no rigorous and systematic procedure available to select thetransformations and to construct an appropriate model for each specific case.
A typical plantwide model couples an upstream activated sludge plant (including primary andsecondary clarifiers) to an anaerobic sludge digester. One of the key challenges has been thedefinition of an interface between activated sludge model (ASM1) and anaerobic digestionmodel (ADM1) the state variables of which differ to each other. A new interface andcharacterization model (“the modified Copp interface”) was proposed by Nopens et al. (2009);furthermore, the approach was demonstrated both hypothetically (BSM2 BenchmarkSimulation Model) and practically on a fullscale WWTP. ADM1 model has, as inputs, a

____________________________________________________________________________________________
Advanced operation and control methods of municipalwastewater treatment processes in Finland
17
mixture of carbohydrates, proteins, lipids, organic acids, bicarbonate and ammonium, some ofwhich are difficult or even impossible to measure; previously this has been tried to overcomeusing a generalized pool of complex material XC (“the Copp interface”). In the modified Coppinterface approach the degradable components are converted directly to sludge fractions used inADM1 model instead of using XC. The steps of converting the state variables from ASM1 toADM1 are presented in Figure 3. The behaviour of the modified Copp interface was testedexactly the same way as the Copp interface using Benchmark Simulation Model BSM2;additionally, improved degree of realism was noticed regarding to the composition of anaerobicdigester effluents and gas production. To validate the proposed model a practical test case usingdata of a fullscale digester in Brisbane, Australia, was executed. The feed of the digesterconsisted of a mixture of primary and secondary sludge. The model predictions were in goodagreement with the dynamic measurements of gas flow rates. Moreover, the new interfaceallows the use of one interface for a range of input sludge resulting in realistic gas productionwithout need for extensive parameter calibration.
Figure 3. Steps of converting state variables from ASM1 to ADM1 in the modified Coppinterface approach (Nopens et al., 2009).
2.4 Process Simulation EnvironmentThe knowledge acquired about the process in a wastewater treatment plant can now be used toimplement appropriate dynamical simulations of it. By using simulations, we can study theeffect of different environmental conditions, test the system sensitivity to different parametersand apply different control configurations and so on. Information about specific WWTPsimulators is given by Olsson and Newell (2001) and also by Copp (2002). From a practicalstand point, a simulation can be obtained in different ways either using commercial software orimplementing the ASP model in programming environment like Matlab/Simulink and/orFortran. In the following section a description of the two approaches is given.
Specific commercial environments usually contain extended libraries of predefined processmodels offering the representation of the whole wastewater treatment plant. The processconfiguration to be simulated can be easily constructed by connecting process unit blocks andpopup windows allow modifying the model parameters.
____________________________________________________________________________________________
Advanced operation and control methods of municipalwastewater treatment processes in Finland
18
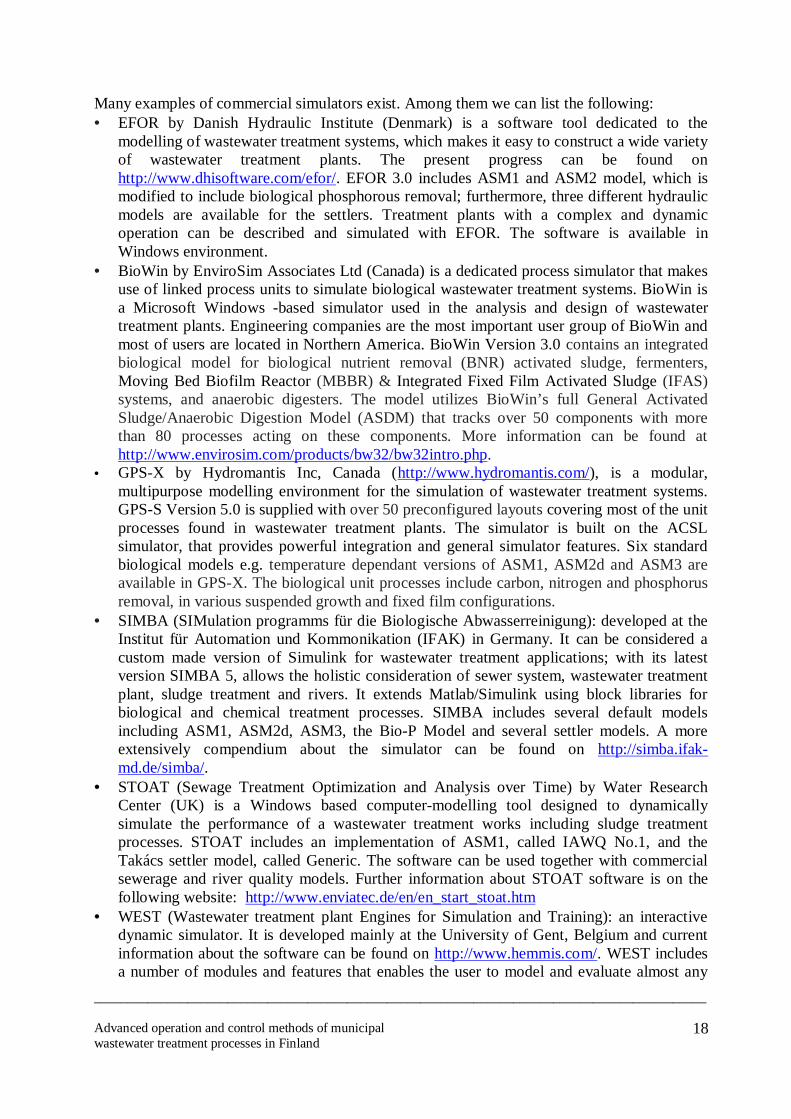
Many examples of commercial simulators exist. Among them we can list the following:• EFOR by Danish Hydraulic Institute (Denmark) is a software tool dedicated to the
modelling of wastewater treatment systems, which makes it easy to construct a wide varietyof wastewater treatment plants. The present progress can be found onhttp://www.dhisoftware.com/efor/. EFOR 3.0 includes ASM1 and ASM2 model, which ismodified to include biological phosphorous removal; furthermore, three different hydraulicmodels are available for the settlers. Treatment plants with a complex and dynamicoperation can be described and simulated with EFOR. The software is available inWindows environment.
• BioWin by EnviroSim Associates Ltd (Canada) is a dedicated process simulator that makesuse of linked process units to simulate biological wastewater treatment systems. BioWin isa Microsoft Windows based simulator used in the analysis and design of wastewatertreatment plants. Engineering companies are the most important user group of BioWin andmost of users are located in Northern America. BioWin Version 3.0 contains an integratedbiological model for biological nutrient removal (BNR) activated sludge, fermenters,Moving Bed Biofilm Reactor (MBBR) & Integrated Fixed Film Activated Sludge (IFAS)systems, and anaerobic digesters. The model utilizes BioWin’s full General ActivatedSludge/Anaerobic Digestion Model (ASDM) that tracks over 50 components with morethan 80 processes acting on these components. More information can be found athttp://www.envirosim.com/products/bw32/bw32intro.php.
• GPSX by Hydromantis Inc, Canada (http://www.hydromantis.com/), is a modular,multipurpose modelling environment for the simulation of wastewater treatment systems.GPSS Version 5.0 is supplied with over 50 preconfigured layouts covering most of the unitprocesses found in wastewater treatment plants. The simulator is built on the ACSLsimulator, that provides powerful integration and general simulator features. Six standardbiological models e.g. temperature dependant versions of ASM1, ASM2d and ASM3 areavailable in GPSX. The biological unit processes include carbon, nitrogen and phosphorusremoval, in various suspended growth and fixed film configurations.
• SIMBA (SIMulation programms für die Biologische Abwasserreinigung): developed at theInstitut für Automation und Kommonikation (IFAK) in Germany. It can be considered acustom made version of Simulink for wastewater treatment applications; with its latestversion SIMBA 5, allows the holistic consideration of sewer system, wastewater treatmentplant, sludge treatment and rivers. It extends Matlab/Simulink using block libraries forbiological and chemical treatment processes. SIMBA includes several default modelsincluding ASM1, ASM2d, ASM3, the BioP Model and several settler models. A moreextensively compendium about the simulator can be found on http://simba.ifakmd.de/simba/.
• STOAT (Sewage Treatment Optimization and Analysis over Time) by Water ResearchCenter (UK) is a Windows based computermodelling tool designed to dynamicallysimulate the performance of a wastewater treatment works including sludge treatmentprocesses. STOAT includes an implementation of ASM1, called IAWQ No.1, and theTakács settler model, called Generic. The software can be used together with commercialsewerage and river quality models. Further information about STOAT software is on thefollowing website: http://www.enviatec.de/en/en_start_stoat.htm
• WEST (Wastewater treatment plant Engines for Simulation and Training): an interactivedynamic simulator. It is developed mainly at the University of Gent, Belgium and currentinformation about the software can be found on http://www.hemmis.com/. WEST includesa number of modules and features that enables the user to model and evaluate almost any

____________________________________________________________________________________________
Advanced operation and control methods of municipalwastewater treatment processes in Finland
19
kind of wastewater treatment plant application that exists. Most of the models in WESTsimulator are open source and open code; thus, the models can be modified if necessary.WEST mainly has been used in the context of wastewater treatment research.
Matlab is a general highlevel language for technical computing. It includes a large library ofpredefined mathematical functions. Additionally, it features a family of specific toolboxes thatextent the Matlab environment to solve particular classes of problem (there are approximately40 toolboxes available). Moreover, Simulink is an addon software product to Matlab formodelling, simulating and analyzing any type of dynamic system. Matlab and Simulink arefully integrated, meaning that all functionalities of the Matlab toolboxes are available in theSimulink environment as well. Simulink provides a graphical user interface for building modelsas block diagrams and manipulating these blocks dynamically. A large number of predefinedbuilding blocks are included and it is easy to extend the functionality by customizing blocks orcreating new ones. The capabilities of Simulink may be further extended by using the Sfunctions (system functions), which can be written in Matlab language, C++ or Fortran usingpredefined syntax. Consequently, Sfunctions can be easily incorporated and a dynamicalsystem can be described as a mathematical set of equations instead of using predefined blockdiagrams.
____________________________________________________________________________________________
Advanced operation and control methods of municipalwastewater treatment processes in Finland
20
Chapter 3. Process controlIn modern wastewater treatment plants processes such as aeration, chemical feeds and sludgepumping are usually controlled by online sensor measurements. Different control algorithmsare used in manipulating actuators such as valves and pumps in order to keep processconditions favourable for demanded treatment results and costeffective. For example inaeration zones there is setpoints for dissolved oxygen (DO) concentrations and aeration iscontrolled according to difference between DO setpoint and measurement; furthermore,control algorithms are used in adjusting aeration valve positions and air compressor operation.
Conventional and some of the advanced control algorithms used in wastewater treatment arepresented in this chapter.
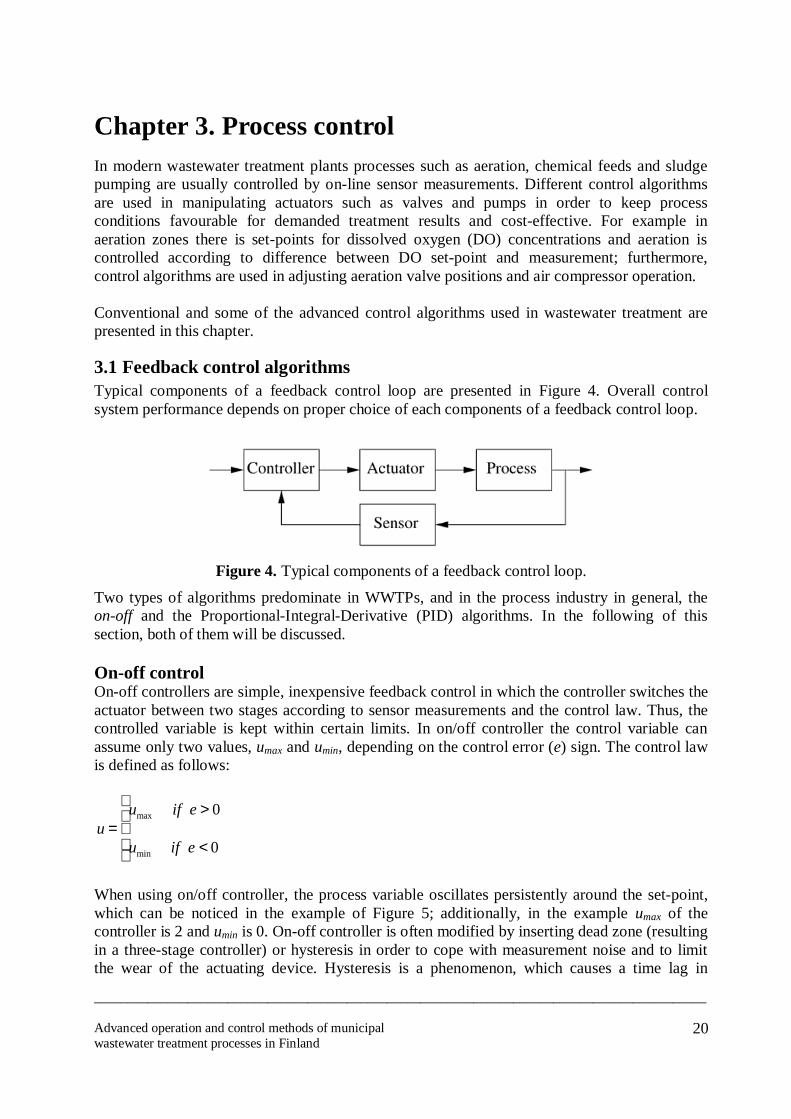
3.1 Feedback control algorithmsTypical components of a feedback control loop are presented in Figure 4. Overall controlsystem performance depends on proper choice of each components of a feedback control loop.
Figure 4. Typical components of a feedback control loop.
Two types of algorithms predominate in WWTPs, and in the process industry in general, theonoff and the ProportionalIntegralDerivative (PID) algorithms. In the following of thissection, both of them will be discussed.
Onoff controlOnoff controllers are simple, inexpensive feedback control in which the controller switches theactuator between two stages according to sensor measurements and the control law. Thus, thecontrolled variable is kept within certain limits. In on/off controller the control variable canassume only two values, umax and umin, depending on the control error (e) sign. The control lawis defined as follows:
u =umax if e > 0
umin if e < 0
When using on/off controller, the process variable oscillates persistently around the setpoint,which can be noticed in the example of Figure 5; additionally, in the example umax of thecontroller is 2 and umin is 0. Onoff controller is often modified by inserting dead zone (resultingin a threestage controller) or hysteresis in order to cope with measurement noise and to limitthe wear of the actuating device. Hysteresis is a phenomenon, which causes a time lag in

____________________________________________________________________________________________
Advanced operation and control methods of municipalwastewater treatment processes in Finland
21
application of a control action (Visioli, 2006). In spite of that, the main disadvantage of the onoff control is that it results in continuous cycling of the controlled variable and producesexcessive wear on the final control element.
Figure 5. Example of an on/off control application. Solid line: process variable; dashed line:control variable (Visioli, 2006).
Turning the aeration system on and off as the oxygen level falls below or rises above a givenDO level in the aeration tank is an typical example of onoff control in wastewater treatment.Another example is the control of the water level in the pumping station or in operating pumpsin return and excessive sludge flow control loops (Tchobanoglous et al., 2003).
PID algorithmsPID is the most common control algorithm used in process industry and wastewater treatment.The letters PID stand for proportional, integral and derivative. It is a control method in whichthe controller output is proportional to the error (P), its time history (I), and the rate at which itis changing (D). Basically, it is the combination of the three control actions, proportional,integral and derivative; moreover, the choice of the used combination depends on theapplication being the PI combination the most common. PID controller has been in use inpneumatic form, in the form of an analogue electronic circuit, as a digital circuit, and insoftware using a microprocessor (Ellis, 2004).
P term is proportional to error (e) between measured value and setpoint. Parameter KP is theproportional gain and it determinates how strong the control action of the P term is. It is typicalthat P term alone is not sufficient to compensate whole of the error variable. In the same way,the integral term integrates error variable over time. The contribution from this term isproportional to both the magnitude of the error and the duration of the error. Also, it acceleratesthe movement of the process towards setpoint and eliminates the residual steadystate errorthat occurs with a proportional (P) only controller. Likewise, derivate term D examines thechange rate of the error variable. The D term tries to predict and compensate the offset at thesame time when it is setting, while parameter KD represents the derivate gain. In brief, theproportional, integral, and derivative terms are summed to calculate the output of the PIDcontroller. A block diagram of a PID controller is presented in Figure 6.
____________________________________________________________________________________________
Advanced operation and control methods of municipalwastewater treatment processes in Finland
22
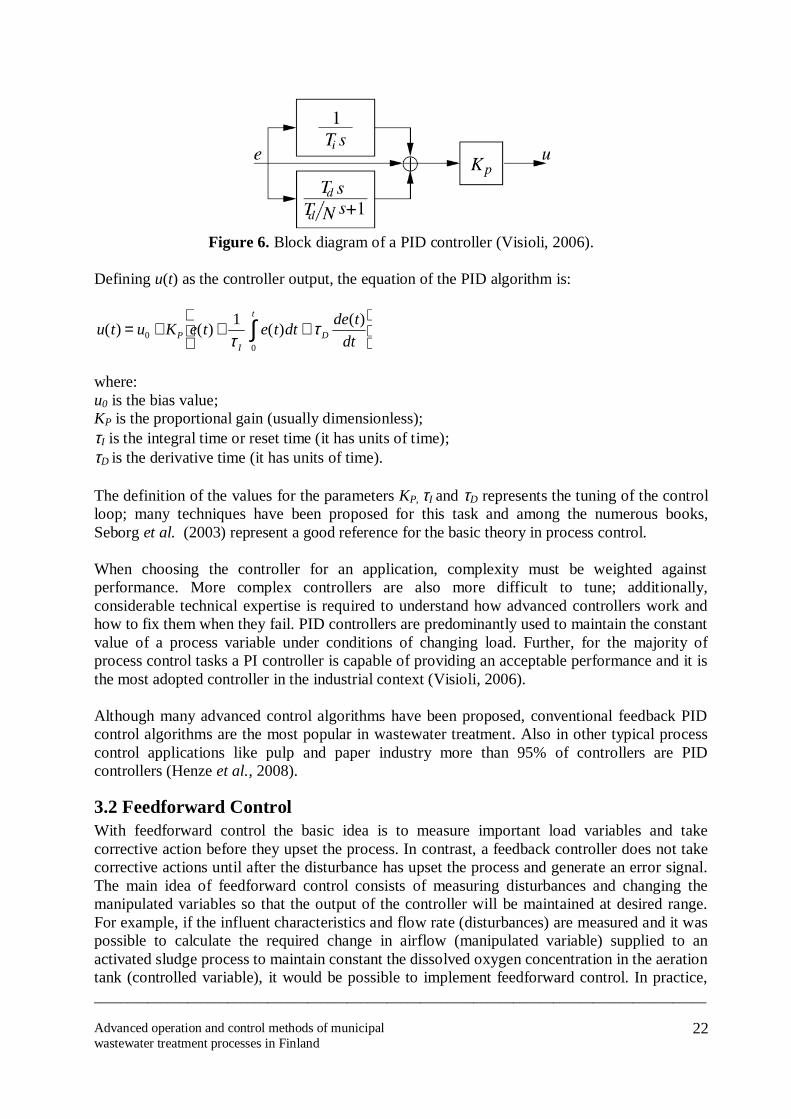
Figure 6. Block diagram of a PID controller (Visioli, 2006).
Defining u(t) as the controller output, the equation of the PID algorithm is:
u(t) = u0 + KP e(t) +1τ I
e(t)dt + τ Dde(t)
dt0
t
∫
where:u0 is the bias value;KP is the proportional gain (usually dimensionless);τI is the integral time or reset time (it has units of time);τD is the derivative time (it has units of time).
The definition of the values for the parameters KP, τI and τD represents the tuning of the controlloop; many techniques have been proposed for this task and among the numerous books,Seborg et al. (2003) represent a good reference for the basic theory in process control.
When choosing the controller for an application, complexity must be weighted againstperformance. More complex controllers are also more difficult to tune; additionally,considerable technical expertise is required to understand how advanced controllers work andhow to fix them when they fail. PID controllers are predominantly used to maintain the constantvalue of a process variable under conditions of changing load. Further, for the majority ofprocess control tasks a PI controller is capable of providing an acceptable performance and it isthe most adopted controller in the industrial context (Visioli, 2006).
Although many advanced control algorithms have been proposed, conventional feedback PIDcontrol algorithms are the most popular in wastewater treatment. Also in other typical processcontrol applications like pulp and paper industry more than 95% of controllers are PIDcontrollers (Henze et al., 2008).
3.2 Feedforward ControlWith feedforward control the basic idea is to measure important load variables and takecorrective action before they upset the process. In contrast, a feedback controller does not takecorrective actions until after the disturbance has upset the process and generate an error signal.The main idea of feedforward control consists of measuring disturbances and changing themanipulated variables so that the output of the controller will be maintained at desired range.For example, if the influent characteristics and flow rate (disturbances) are measured and it waspossible to calculate the required change in airflow (manipulated variable) supplied to anactivated sludge process to maintain constant the dissolved oxygen concentration in the aerationtank (controlled variable), it would be possible to implement feedforward control. In practice,
____________________________________________________________________________________________
Advanced operation and control methods of municipalwastewater treatment processes in Finland
23
the dynamic model of the process must be known and its mathematical model has to beavailable.
Most of the measurements of the disturbances as well as the mathematical model calculationare very difficult tasks. As a result, feedforward control has limited application in WWTPs. Thecurrent limited applications of feedforward control include control of chemical addition andcontrol of return activated sludge flow from the secondary settler to the aeration basins(Tchobanoglous et al., 2003).
In practical application, feedforward control is normally used in combination with feedbackcontrol; this combination can provide a more responsive, stable and reliable control system.Combined feedforward and PI control has been proposed e.g. for external carbon flow control(Samuelsson and Carlsson, 2001) and DO concentration control (Yong et al., 2005) in activatedsludge processes.
3.3 Advanced control algorithmsAs processing plants become increasingly complex in order to increase efficiency and reducecosts, there might be greater incentives for using advanced control. This section will emphasizeon the techniques encountered in WWTP applications.
Cascade ControlA disadvantage of feedback control is that corrective action for disturbances does not beginuntil after the controlled variable deviates from the setpoint. As discussed in the previoussection, feedforward control requires that disturbances be measured explicitly and that themodel be available to calculate the control output. An alternative approach, that cansignificantly improve the dynamic response to disturbance, employs a secondary measurementpoints and a secondary feedback control. The secondary measurement point is located so that itrecognises the upset condition sooner than the controlled variable, but disturbance is notnecessary measured. This approach is called cascade control: one feedback controller, identifiedas the primary loop, is used to calculate the setpoint of another feedback controller thatrepresents the secondary loop. Interaction among the control loops is the most pressing reasonfor utilization of cascade control.
This approach is widely used in process industries and it is particularly useful when thedisturbances are associated with manipulated variables, in wastewater treatment plants is usedmainly for the following reasons (Olsson and Newell, 1999):• Disturbance rejection: DO controllers are often cascaded onto a flow or pressure slave
slope. This filters out the disturbances caused by changes in the air supply pressure beforethe DO concentration is affected.
• Gain scheduling: one or more observable variables, called the scheduling variables, are usedto determine what operating region the system is currently in and to enable the appropriatelinear controller.
• Hysteresis removal: a secondary control loop can be added to supply the strong controlsignal and remove the oscillations. Valve positioners on control are the most commonexamples.
A further cascade control strategy is proposed Cho et al. (2002); the controller is composed oftwo ProportionalIntegral (PI) controllers to regulate the nitrate concentration in the pre

____________________________________________________________________________________________
Advanced operation and control methods of municipalwastewater treatment processes in Finland
24
denitrifying process by manipulating the external carbon dosage as reported in Figure 7. Itcontrols the nitrate concentrations in the effluent as well as in the final anoxic reactorsimultaneously to strictly satisfy the quality of the effluent as well as to remove the effects ofdisturbances more quickly. Assuming that the concentration of outflow of the fifthcompartment is the same as that in effluent due to no chemical reaction in the secondary settler.Then, the primary loop is composed of the nitrate concentration in the fifth compartment as theprocess output and the setpoint of the secondary controller as the process input. The secondaryloop consists of the nitrate concentration in the anoxic zone as the process output and the flowrate of the external carbon source as the process input. The proposed approach using only theexternal carbon source dosage shows better regulation results. It is also advantageous in themaintenance and economic aspects, using smaller number of sensors than feedforward control.
Figure 7. Configuration of cascade control loops in Cho et al. (2002).
Model predictive controlThe basic concept of model predictive controllers (MPC) is to choose number of futureadjustments of the manipulated variables to minimize the errors between the controlledvariables and their setpoints, based on the predicted response of the process. MPCstraditionally use simple form of linear process models, but in recent years also nonlinear modelshave become more common. MPC is capable of handling multivariable processes, which hasmade it a popular control method. In addition, the prediction horizon keeps being shiftedforward and for this reason MPC is also called receding horizon control. There are severalcommercial MPC software implementations, but they are relatively simple to implement foranyone familiar with modern matrix manipulation techniques. Basic structure of MPC ispresented in Figure 8.
Figure 8. Basic structure of MPC (Camacho and Bordons, 2004).
____________________________________________________________________________________________
Advanced operation and control methods of municipalwastewater treatment processes in Finland
25
All MPC algorithms possess common elements, and different options can be chosen for each ofthe elements. These elements are (Camacho and Bordons, 2004):
• Prediction model;• Objective function;• Obtaining the control law.
The model is the core of MPC; furthermore, it should be complete enough to fully captureprocess dynamics and allow the predictions to be calculated. The different strategies of MPCcan use various models to represent the relationship between the output and the measurableinputs, some of which are measurable variables and others can be considered as measurabledisturbances which can be compensated for by feedforward action. Chosen model structure isusually a compromise between process characteristics and control objectives. Developing afunctional model is the most critical and timeconsuming part of designing MPC. Whenapplying MPC, it has to be ensured that the process model employed represents the processes insufficient accuracy. The model can be separated in two parts: the actual process model and thedisturbances model, which describes e.g. the effect of nonmeasurable inputs, noise and modelerrors. (Posio, 2002; Schütze et al., 2002; Camacho and Bordons, 2004)
MPC approach to controller design involves online optimization calculations, which takeaccount of system dynamics, constraints and control objectives. Various MPC algorithmspropose different cost functions for obtaining the control law. In MPC control future controlactions are counted by minimizing objective function of performance over a certain predictionhorizon. Control calculation is carried out as a result of three steps:
1. Use of model in predicting the output variables of the controlled process as future discreteover prediction horizon.
2. Calculation on future control sequence over control horizon by minimizing given objectivefunction within constraints in a way that the predicted process output variable is as close aspossible to desired reference signal.
3. In strategy of receding horizon only the first output value of control sequence received fromminimizing procedure of objective function is implemented in process control and horizonsare slid towards future. Optimization is repeated with updated data on the next samplingtime.
Steps 1 and 2 can be understood as control actions of open loop whereas repeating calculationin step 3, implementing the first value of control sequence to system control and discarding restof the values closes the loop.
MPC is widely used in process industries in particular (Qin and Badgwell, 2003). In wastewatertreatment behaviour of the processes is often nonlinear, which makes control challenging. MPChas been used at WWTPs e.g. in controlling the pH value (Camacho and Bordons, 2004) anddissolved oxygen concentration (Cristea and Agachi, 2006).
Lately, Shen et al. (2008) applied MPC to the BSM1 wastewater treatment process to maintainthe effluent quality within regulationsspecified limits. Good performance was achieved understeady influent characteristics, especially concerning the nitrogenrelated species. The resultsshowed that the efficiency of operating biological wastewater treatment processes could be

____________________________________________________________________________________________
Advanced operation and control methods of municipalwastewater treatment processes in Finland
26
significantly influenced by an overload in a local community due to varying wastewatersources, chemical composition and flow rate. When the plant is highly loaded and if stringenteffluent fines are imposed by legislation, in coping with this problem and performing a costeffective operation, the more advanced control algorithms, such as model predictive controlscheme, are advantageous.
Fuzzy logic controlFuzzy control algorithms use fuzzy logic to allow machines to make decisions based on thepractical knowledge of a human operator. Fuzzy logic is a mathematical system that analyzesanalog input values in terms of logical variables that take on continuous values between 0 and1, in contrast to classical or digital logic, which operates on discrete values of either 0 and 1(true and false). Fuzzy control method can be implemented in similar control applications ase.g. PID control and a modelbased control system. Fuzzy control contains (nonlinear) mappingthat has been defined using fuzzy IFTHEN statements. Applying fuzzy logic calculationsenables to design a nonlinear controller, without a detailed knowledge of the operating pointnonlinearity, as would be required for a classical control design.
A fuzzy control device consists of three stages, all of which perform calculations: an inputstage, a processing stage and an output stage. The control system utilizes a database withincludes fuzzy rule base and the numerical information needed in calculation.
The control is made in terms of a rule base that performs operations on the fuzzy sets andinterference. In the input stage the input signals translated to fuzzy logic values (fuzzification).Multivalued logic inference rules are applied to develop the control action during theprocessing stage. In the output stage the fuzzy logic values are retranslated to continuoussignals (defuzzification), which are used as control outputs. A generic fuzzy system is presentedin Figure 9 (Blevins et al., 2003).
Figure 9. A generic fuzzy system with fuzzification and defuzzification units and externaldynamic filters (Verbruggen and Babuška, 1999).
At first the fuzzy sets are defined and it is decided how to logically quantify control inputs. Thetypical fuzzy sets for input signals are Negative Large, Negative Medium, Negative Small,Zero, Positive Small, Positive Medium, and Positive Large.

____________________________________________________________________________________________
Advanced operation and control methods of municipalwastewater treatment processes in Finland
27
Decision making in fuzzy control follows IFTHEN rules, for example:
IF such and such states of process variables (i.e. inputs) are
THEN such and such control actions (i.e. outputs) are needed
To establish boundaries for the set, membership functions are defined analytically for everyfuzzy set. Membership functions can be of various types: linear, parabolic, exponential ornormal distribution. Linear membership functions are used most often due to the simplicity andsatisfactory flexibility. When developing fuzzy inference rules, it is important to understandprocess behaviour. In fact, the most common shape of membership functions is triangular. Alsotrapezoidal and bell curves are used (Figure 10). (Blevins et al., 2003)
Figure 10. Various types of membership functions representing fuzzy sets (Verbruggen andBabuška, 1999).
There are many different methods of defuzzification in which the control output value isdetermined. The centroid method, in which the "center of mass" of the result provides the crispvalue, is very popular. Another approach is the height method, which takes the value of thebiggest contributor (Kova and Bogdan, 2006).
Use of fuzzy controller can be reasonable for various purposes in wastewater treatment (1) ifthere is no analytical model of the WWTP available, (2) if the model is too complicated tocompute a controller by classical methods or (3) if the control goals are not defined precisely.
Fuzzy logic control does also have some downsides, which are described in the following.(1) Knowledge acquisition can be very troublesome. It is often hard even for an experiencedoperator to express how control should work. (2) Tuning a fuzzy logic controller is difficultbecause there are no systematic tuning methods for them. Often set of rules for the control hasto be tuned many times by trial and error before the demanded level of performance isachieved. This can be troublesome and take lots of time. (3) Because fuzzy logic control doesnot exactly model the controlled process, it is difficult to prove the control to be optimal andstabile. The larger the set of rules is, the bigger the problem often is. (4) Testing the control isdifficult if the fuzzy set of rules is large. When the size of set of rules enlarges, becomes testingmore complicated because of interactions between the rules.
Fuzzy logic control has been applied e.g. for controlling of sludge height in secondary settler ofa WWTP (Traoré et al., 2006) and in optimizing volume distribution in each stage of a stepfeeding activated sludge process (Zhu et al., 2009). Fuzzy control has also been used incontrolling nitrate recirculation flow and external carbon addition in a predenitrification

____________________________________________________________________________________________
Advanced operation and control methods of municipalwastewater treatment processes in Finland
28
process using oxygen reduction potential (ORP) measurement as a control parameter (Peng etal., 2005).
Artificial neural networksNeural Network (NN) model is a complex interaction between fairly simple expressions calledneurons. NN models are able to represent both linear and nonlinear relationships. ArtificialNeural Network (ANN) is an information processing paradigm that is inspired by the waybiological nervous systems process information. ANN consists of group of artificial neurons.Neurons are simple data processing units connected to each other. Furthermore, neuron consistsof the following units: (1) synapse, (2) adder and (3) activation function (Lingireddy and Brion,2005).
Figure 11. Schematic representation of a typical ANN (Lingireddy and Brion, 2005).
ANN model is a simplified view of the structure of brain combined with mathematical logics.The network is composed of a large number of highly interconnected processing elements(neurones) working in parallel to solve a specific problem. ANNs are taught by examples,which should be selected carefully, and they can not be programmed to perform a specific task.In most cases an ANN is an adaptive system that changes its structure based on external orinternal information that flows through the network during the learning phase. Before learningANN typically starts out with randomized weights for all their neurons. The ability of ANNs toapproximate complex nonlinear relationships without prior knowledge of the model structuremakes them attractive alternative to classical modelling and control technology. ANN consistsof neurons divided to input layer, hidden layer(s) and output layer (Figure 11). The activity ofthe input units represents the raw information that is fed into the network. In the input layerthere is one neuron for each model input. There are one or more hidden layers in ANN. Thehidden layers perform a weighted sum of inputs from each neuron of the previous layer,transform the sum according to some activation function and distribute the result to each neuronof the next layer. Subsequently, the output layer produces the final output. Each neuron takesmany input signals and based on an internal weighting system, produces a single output signal,which is typically sent as input to another neuron (Lingireddy and Brion, 2005).
Radial Basis Function Networks (RBF) is type of ANNs, which have only one hidden layer.RBF has been shown to be better than traditional ANN in fault detection applications. In RBFinputs are process measurements and outputs each indicate a certain fault or operating condition(Olsson and Newell, 1999).

____________________________________________________________________________________________
Advanced operation and control methods of municipalwastewater treatment processes in Finland
29
In the process industries, one frequent application of NNs is as a soft sensor. When manyphysical measurements about the process are known, the value of an unmeasured variable canbe computed, in real time, using a neural network software program. In wastewater treatmenthybrid timedelay neural networks (TDNN) combined with principal component analysis(PCA) has been used in a soft sensor predicting effluent BOD value (Zhao and Chai, 2005).ANN has also been used in control of coagulation, flocculation and sedimentation processes inwater treatment (Lingireddy and Brion, 2005) and to keep the concentration of the recycledsludge proportional to the influent flow rate in presence of disturbances, parameter variationsand measurement noise (Baruch et al., 2005). Neural networks have great potential in control ofwastewater treatment processes in general and anaerobic sludge digestion in particular (Olssonet al., 2005).
3.4 Control applicationsIWA/COST Benchmark Simulation Models have used in number of studies on different controlstrategies during the recent years. Also other modelling and simulation environments have beenused in several of the research papers. Real plant experiments have been relative rare, and oftentesting of control strategies using dynamic simulation have preceded real plant tests.
BSM1 applicationsBSM1 protocol has been often used in studies on different control strategies, operational costestimation and risk evaluation in wastewater treatment.
Six different integrated control strategies in predenitrifying ASP were tested by Yong et al.(2006) using the IWA/COST Benchmark Simulation Model BSM1. The integrated controlstrategies concern nitrate recirculation flow rate and external carbon dosage. ASM1 model wasused for modelling the wastewater treatment process and the controllers were implementedusing Matlab/Simulink software. The proposed control strategies are presented in Figure 12.The nitrate recirculation flow rates are increased at night (lowload periods) maximizing the useof influent and intercellular COD for denitrification. During daytime (highload periods) nitraterecirculation flow rates are lower. Furthermore, external carbon dosage is low at night and highat daytime. Compared to predefined simple control example all the integrated control strategieswere noticed to improve significantly the effluent quality; the average nitrate and total nitrogenconcentrations in the effluent were reduced by 4247% and 2933% respectively. However, theeffluent ammonium concentration was increased by 3.513%.
Integrated control strategies for nitrogen removal in activated sludge processes were studiedusing BSM1 by Yong et al. (2006). The strategy no. 1 was concluded to be the best one fornitrate recirculation flow rate and external carbon dosage in terms of external carbonconsumption and plant performance criteria. The strategy makes best use of plant denitrificationcapacity and maximizes the use of influent COD for denitrification. In the control strategy no. 1there are two feedback control loops; one to determinate the flow rate of external carbon sourceto the first anoxic zone in order to keep the nitrate concentration at the defined level at the endof the second anoxic zone, and the other one to adjust the flow rate of the nitrate recirculation tomaintain the nitrate level at defined level at the end of last aerobic zone.

____________________________________________________________________________________________
Advanced operation and control methods of municipalwastewater treatment processes in Finland
30
Figure 12. Six integrated control strategies of nitrate recirculation and external carbon addition(Yong et al. 2006).
Samuelson et al. (2007) researched optimal setpoints and cost minimizing control strategies fordenitrification process in the activated sludge process using BSM1; nitrification process wasnot considered in the study. The manipulated variables are the internal recirculation flow rateand the flow rate of an external carbon source; while, the controlled variables are the nitrateconcentrations in the last anoxic zone and the effluent. Three dynamic data input files aredefined in the Benchmark Simulation Model, each describing different weather conditions. Thestationary operational costs of the denitrification process were analysed and presented instationary operational maps together with considered output signals (Figure 13). The partialcosts taken into account were: (1) pumping costs (required energy), (2) aerations costs (requiredenergy), (3) external carbon source costs, and (4) possible fee for effluent nitrate discharge. Thesimulations were done e.g. with different energy prices, with a costfree external carbon sourceand without a fee for nitrate effluent load. As a result, it was found out that costoptimal setpoint of nitrate in the anoxic zone depends on the choice of effluent nitrate setpoint.

____________________________________________________________________________________________
Advanced operation and control methods of municipalwastewater treatment processes in Finland
31
Figure 13. Stationary operational map for a grid of different values of external carbon sourceflow (Qcar) and internal recirculation flow (Qi) for the case with no nitrate fee. Solid lines showthe total cost in EUR, dashdotted lines show effluent nitrate concentration Se
NO (mg(N)/l), anddotted lines show the nitrate concentration in the last anoxic compartment San
NO (mg(N)/l)(Samuelsson et al., 2007).
There are several possibilities how to design the actual control law in order to minimizeoperational costs: (1) using two different control loops to control the effluent nitrateconcentration Se
NO and the nitrate concentration in the last anoxic compartment SanNO
separately, (2) using constant high internal recirculation flow rate (since the impact of it on totalcost is much smaller than the impact of external carbon source flow), (3) using quadric criteria,for example Linear Quadratic Controllers (LQC) or Model Predictive Controllers (MPC), online for minimization of total cost, or (4) using a simple grid search online until the optimalpoint is reached. The presented operational cost minimization tool could be valuable in runningWWTP in a more cost effective way, but before that the approach should be extended to alsoconsider nitrification process, and it should also be evaluated using online data from a fullscale WWTP (Samuelson et al., 2007).
Stare et al. (2007) proposed several control strategies for nitrogen removal. The strategies wereevaluated using BSM1 and operating cost was used as evaluation criteria; moreover, theoperating cost consists of aeration costs, sludge disposal costs, external carbon dosage costs andeffluent fines. The manipulated variables used in the study were external carbon flow rate(Qcar), DO setpoint (Soset) and oxygen transfer rate (KLa) while the other variables were set tothe constant values. The five different control strategies studied were (a) constant manipulatedvariables, (b) oxygen PI control, (c) nitrate and ammonia PI control, (d) nitrate PI and ammoniafeed forwardPI control, and (e) model predictive control (Figure 14). The more advanced thecontrol strategy is, the more online measurements and additional sensors are needed. In thecontrol strategy (e) a multivariable and nonlinear MPC was implemented.

____________________________________________________________________________________________
Advanced operation and control methods of municipalwastewater treatment processes in Finland
32
Figure 14. Control structures: (a) constant manipulated variables, (b) oxygen PI control, (c)nitrate and ammonia PI control, (d) nitrate PI and ammonia FFPI control, and (e) model
predictive control (Stare et al., 2007).Optimal operating setpoints points were determined using operational maps and each controlstrategy was simulated using the optimal setpoint values. The results showed that with nitratePI and ammonia FFPI control almost the same operating cost can be achieved as withadvanced MPC algorithms. When the plant is highly loaded the MPC algorithm was noticed tobe advantageous. Thus, for sensitive discharge points where preventing high peak values in theeffluent is important implementing an advanced control algorithms is reasonable. For lesssensitive water bodies using simple control algorithms was concluded to probably be sufficient(Stare et al., 2007).
Control of aeration volume in an ASP was investigated by Ekman et al. (2006). In the proposedcontrol strategy DO concentration in some of the compartments is determined by a higher levelcontroller driven by the DO concentration in other zones; thus, DO setpoint is timevarying forsome of the zones. BSM1 benchmark protocol was used in the research; similarly, the strategieswere also tested by test runs at a pilot plant in Hammarby Sjöstad (Stockholm). The main ideaof the suggested aeration volume control strategies can be described as follows: (1) duringperiods of low influent load a relatively low number of compartments are aerated usingcontrollers with prespecified DO setpoints, and (2) when the influent load increases, someadditional compartments are also aerated. In the suggested cascade control strategy extrasupervisory (master) PI controllers are implemented; furthermore, the supervisory controllershave to be tuned so that the inner control loop is much faster than the outer control loop. Themain idea for the cascade control of the first and the last aerobic compartments is to aerate thecompartment only when necessary. Simulation studies were conducted for the suggestedcascade control strategy, as well as for a constant DO control strategy and for a supervisory setpoint control strategy based on ammonium concentration measurements. In pilot plant test runsit was concluded that the suggested aeration control strategy gives lower effluent concentrationsand requires lesser total aeration energy compared to a traditional constant DO control. It wasalso highlighted that tuning of the aeration volume controller must be done with care.

____________________________________________________________________________________________
Advanced operation and control methods of municipalwastewater treatment processes in Finland
33
A risk assessment model for settling problems of microbiological origin in activated sludgesystems was proposed by Comas et al. (2008). Common operational problems are caused bymicroorganism population imbalances between filamentous and flocforming bacteria leadingto filamentous bulking, filamentous foaming and deflocculation. A fuzzy rulebased system forrisk assessment for settling problems was tested using BSM1. A knowledge related to risk offilamentous bulking proliferation was synthesized into a decision tree; moreover, each of thethree branches of the decision tree evaluates one of the three main causes: low DOconcentration, nutrient deficiency and low F/M (foodtomicroorganism) ratio or substratelimiting conditions. Seven variables can be used by the decision tree as indicators to assess riskof filamentous bulking: SRT, DO, F/M (removed), F/M (fed), BOD/N, BOD/P and Ss (readilybiodegradable substrate concentration). The risk estimation implies three main steps:fuzzification, fuzzy inference of the risk through Mamdani approach, and defuzzification of theoutput variable. Two case studies in modelled activated sludge environment were performedand thus detection of microbiologyrelated separation problems illustrated. The output from theproposed risk assessment system can be used as plant performance criteria together with theusual criteria: operational costs and effluent quality.
BSM2 applicationsLately, IWA/COST Benchmark Simulation Model No. 2 (BSM2) protocol has been used inplantwide studies on control strategies and performance evaluation. The plant used in theprotocol is in Figure 2.
Effects of different control strategies can be evaluated using multicriteria decision analysis(FloreAlsina et al., 2008). Evaluation of six WWTP control strategies was demonstrated usingBSM2 as a case study; in particular, environmental, legal, technical and economic objectiveswere taken into account. Plant performance evaluation was done using data of one weekdynamic simulation. Multicriteria evaluation was performed both without uncertainty and withuncertainty by means of model input probability distributions. Three classes of uncertainty weredistinguished for stoichiometric (5% upper and lower bounds), kinetic (25%) and influentfraction (50%) parameters. Different control strategies were noticed beneficial regarding todifferent objectives considered. The results were analyzed using several descriptive statisticaltools and it was possible to see how different uncertainties affected the different outcomes.Multicriteria decision analysis results in a more transparent decision making process, improvedunderstanding on the process and the tradeoffs between different objectives; additionally,uncertainty analysis allows identification of potential problems at WWTP early on.
Multivariable statistical techniques were used in analysis of plantwide WWTP controlstrategies; furthermore, the methods used were cluster analysis (CA), principal componentanalysis/factor analysis (PCA/FA) and discriminant analysis (DA). BSM2 protocol was used inevaluation of 12 different control strategies. The data generated during the last 364 of thesimulation were used for the evaluation. Variables relating to economical, environmental,technical and legal aspects were used for evaluation criteria. First, CA indicated that there werefour main types of control strategies. Next, PCA/FA showed the main correlations between theevaluation criteria and the control strategies influencing those criteria. While there were 26original variables, five principal components explained 96% of the total variability. Then, DAshowed that only six parameters were useful to discriminate within the classes obtained by CA.To summarize, the combination of these multivariable statistical techniques improved

____________________________________________________________________________________________
Advanced operation and control methods of municipalwastewater treatment processes in Finland
34
significantly the accessibility of information needed for effective evaluation control strategies(Flores et al., 2007).
Real plant control examplesA methodology to estimate the costs and benefits of advanced control for WWTPs was studiedby Devisscher et al. (2006); the methodology is called MAgIC (matrix for advancedinstrumentation and control). Wastewater treatment process was modelled by implementingSimulink and the modelling framework was based on ASM1 model. The main cost categoriesconsidered were: (1) aeration energy, (2) pumping energy, (3) mixing energy, (4) chemicals,and (5) sludge treatment and disposal. Because of few quantitative data for influentcomposition was available, a software synthetic influent generator was built and a daily patternwith variable amplitude was added to the flow rate data. Operational data was taken from dailyreports of the plant consisting of daily incoming flow rates, operational settings such as DO setpoints, waste sludge flow rates, recirculation fractions and denitrification percentages. Bothmanual and online controls were simulated; furthermore, short response time of the onlinecontrol compared to an ideal manual control was noticed to decrease aeration energy andprecipitation chemical flow rate while at same time to improve the effluent quality. Saving inaeration energy by advanced control ranged from 10 to 20%, and saving in chemicals dosing upto 30%. It was estimated that online control would become costeffective at plant sizes above50 000 p.e., if a payback period shorter than two years was required. The methodology has beenapplied to four WWTPs in Belgium; the plants had been in operation for at least two years inorder to have a sufficient amount of data.
A hierarchical twolevel control to track DO reference trajectory in activated sludge processwas proposed and investigated by Piotrowski et al. (2008). A hierarchical multilayer controlstructure presented in Figure 15 utilizes multiple time scales in the plant dynamics; the fastcontrol sublayer (FCS) and the medium control sublayer (MCS) for aeration control wereconsidered in the research. An aeration system is a complicated hybrid nonlinear dynamicalsystem with faster dynamics than the internal dynamics of the DO at a biological reactor. Theobjectives of the control are to force DO concentrations in the zones of activated sludge processto follow the prescribed references and also to minimize the associated electricity cost due toblowing air to the reactor. The control handles in typical aeration systems are: blower structureon/off, blower speeds and the angular positions of the throttling valves. In the aeration controlstructure the lower level controller (LLC, operates on fast time scale) uses the aeration controlhandles in order to produce the airflow trajectories that follow the trajectories prescribed byupper level controller (ULC, operates on slow time scale) and to minimize the electricity costsdue to aeration. There are minimum and maximum pressure constraints for airflow blown. Twotypes of blowers can be used: fixedspeed motors and variablespeed motors. A hybridnonlinear model predictive control (HNMPC) was applied for LLC because of nonlinearity ofthe inputoutput model.
The twolevel DO control structure was tested at Kartuzy WWTP in northern Poland;specifically, the treatment process used was UCT (University of Cape Town) process. Theprocess was modelled applying ASM2d model, which was calibrated on the plant operationdata; the model was implemented in a simulation package SIMBA and calculations werecarried out in Matlab and General Modelling Environmental Systems (GAMS) environment.The HNMPC optimization task at the LLC was solved using GPLEX solver. It was concludedthat the hierarchical controller optimizes the operation costs and hence does not throttle the

____________________________________________________________________________________________
Advanced operation and control methods of municipalwastewater treatment processes in Finland
35
airflow by closing valves more than necessary. As a result, the computing time needed by thecontroller to generate the control actions was noticed to be small and realtime implementationat the WWTP to be very feasible (Piotrowski et al., 2008).
Figure 15. Information structure of the twolevel hierarchical controller for DO optimisedtracking (Piotrowski et al., 2008).
A supervisory control strategy for GalindoBilbao WWTP (Spain) was designed and testedcombining model simulations, pilotplant experimentation and fullscale validation (Ayesa etal., 2006). The control strategy combines three complementary control loops in order tooptimize nitrogen removal in a predenitrifying activated sludge plant. The first controllermaintains the selected 24haveraged ammonium concentration in the effluent by choosing themost appropriate DO setpoint in the aerobic reactors. 24 hours mobileaveraged window isused to filter the typical variation in the effluent concentration created by the daily loadvariation. The second control strategy aims at the optimum use of the denitrification potential ofthe plant by selecting the most appropriate nitrate recycle flow. The objective is to maintain alow and stable concentration of nitrates at the end of the anoxic zone; additionally, the controlis based on the instantaneous value of the nitrates in the anoxic zone and does not need amobile averaged filter. The third control loop maintains the selected 24haveraged value of thetotal mass of suspended solids in the biological reactor via automated manipulation of thesludge wastage rate.

____________________________________________________________________________________________
Advanced operation and control methods of municipalwastewater treatment processes in Finland
36
Figure 16. Schematic description of supervisory control loops for (a) DO setpoint control, (b)internal recycle control and (c) sludge wastage control (Ayesa et al., 2006).
Modelling and simulation were performed using ASM1 model and WEST simulation platform;moreover, the optimum operational strategies were designed using modelbased optimizationalgorithms. The controllers were designed and verified using model simulations and pilotscaleexperimentation. Similarly, the fullscale implementation and validation of supervisory controlstrategies (Figure 16) was done at one treatment line of the GalindoBilbao WWTP. Asimultaneous reduction of both 2.0 mg/l of effluent nitrates (and consequently in total nitrogen)and a fall of 1520% in aeration has been obtained in fullscale operation, corroborating theresults estimated by simulations (Ayesa et al., 2006).
3.4 Plantwide controlPlantwide control can be defined as the combined sewer network and WWTP control andoperation (Olsson et al., 2005). By integrating controls of sewer network and WWTP capacitiesof both systems can be used more efficient. Especially at the seasons with heavy rainfalls andstorm waters WWTPs are often overloaded, which may lead to increased nutrientconcentrations in the effluent and possible washout of the activated sludge organisms. Aim ofthe integration is minimized impacts on the receiving water.
By using plantwide control the storage capacity of the sewer system (and possible equalizationbasins) is utilized. This does not only help operation at times of high flow rates; when thestorage capacity is properly managed, different wastewaters are better mixed and the load toWWTP is more equal, which easies operation. On the other hand, if WWTP and sewer networkare operated separately, the plant influent flow rate is an external disturbance. By combiningcontrol of WWTP and sewer network the influent flow becomes a manipulated variable and theexternal disturbances are located further upstream. Integrated computer system gives thenecessary information infrastructure for plantwide control. A plantwide control system

____________________________________________________________________________________________
Advanced operation and control methods of municipalwastewater treatment processes in Finland
37
assumes that unit processes are controlled locally; however, it does also consider theinteractions between different parts of the plant (Olsson and Jeppson, 2006).
Plantwide modelling has also been developed and done research on. In the models there aresewer network, wastewater treatment plant and receiving water or two of the aforementioned.Calibrating plantwide models is challenging; the individual submodels have first to becalibrated and verified and after which the complete model has to be tested and verified fordifferent situations. In Olsson and Jeppsson (2006), River Water quality Model no. 1(RWQM1) has been developed with the intended aim of compatibility with the ASM models.
Schütze et al., (2004) stated that the systematic development, evaluation and tuning ofintegrated control procedures is expected to be done with integrated simulators are currently infull development. In their work a global optimal predictive real time control (RTC) system wasimplemented in Quebec Urban Community. The system consists of finding the flow setpointsthat minimize the value of a multiobjective function, with respect to physical and operationalconstraints. The control objectives in the RTC system are in decreasing order of priority: theminimization of overflows, the maximization of the use of treatment plant capacity, theminimization of accumulated volumes and the minimization of variations of the setpoints. Thesewer network distributed control procedure is divided in three hierarchical levels: level 1consists of local control of the actuator; level 2 includes several level 1 stations; and the globaloptimal predictive RTC represents the level 3. In particular, RTC control system uses flowmonitoring, water level data, rainfall intensity data, radar rainfall images and 2h rainpredictions. The optimization problem is solved every 5 min control time step by a nonlinearprogramming algorithm. By optimizing the use of two tunnels and capacity of the WesterlyWWTP, RTC achieved 70% reduction in overflow volume in 2000. The costs of planning aRTC can be quite high, but it can help to prevent building new tanks or extending capacity ofexisting infrastructure at even higher costs, thus often resulting in significant savings. The RTCsystem has to adapt to different conditions and varying rainfall intensities and space and timedistribution. Also, the data has to be synchronized and updated more quickly for control thanfor supervisory purposes only, especially in sewer systems with short runoff concentrations andflow times.
Control structure and algorithms for optimizing control of integrated wastewater treatmentplantsewer systems (IWWTS) were designed and implemented at Kartuzy WWTP in northernPoland by Brdys et al. (2008). Control structures were combined with multivariate optimizingalgorithms. Model predictive control (MPC) was used and control strategies for threeoperational states were designed: normal, disturbed and emergency operational state. Duringhigh hydraulic loads the aim of the control system is maximizing utilization of the hydrauliccapacity of the sewer and equalization tanks and maximizing hydraulic capacity of the WWTP.The treatment process used at Kartuzy WWTP is UCT (University of Cape Town) process. Inthe multilevel hierarchical structure of the control system (Figure 17) there are three differentlevels: a supervisory control layer (global knowledge of current activity in the entire system),an optimizing control layer (control objectives split in three sublayers; slow, medium and fastprocess dynamics time scales) and a followup control layer (in which the simple controllersfollowing the setpoints are located). Firstly, Slow Control Sublayer handles objectives over ahorizon of a week up to several months; manipulated variables are sludge retention time, masssludge and pumping in/from equalization and septic tanks. Secondly, Medium Control Sublayerhandles objectives over a horizon of a day; manipulated variables are DO concentrations,

____________________________________________________________________________________________
Advanced operation and control methods of municipalwastewater treatment processes in Finland
38
recirculation flow rates and chemical precipitation. Finally, Fast Control Sublayer operatesobjectives over a horizon of one hour; it is responsible for effluent quality during heavy rainsand of short duration events, actuator constraints and meeting demands on desired DOconcentrations prescribed in the previous sublayer. A grey box model, which results from a vastsimplification of ASM2d model, was used in the research for the predictive control. Thedifferent control strategies for various operational stages were switched softly. In fact, the mainobjective of control strategy CS1 is to minimize an overall operation costs. Moreover, for CS2the main objective is to minimize the discharged pollution load and for CS3 to avoid orminimize overflows. In the simulation of the MPC SIMBA 4.0 package was used as a real plantsimulator while sequential quadratic programming (SQP) solver from TOMLAD Optimisationwas applied to carry out the optimization tasks. For the simulations a 6day long testing inputwas designed and controller was successfully validated.
Figure 17. Hierarchical intelligent control structure (Brdys et al., 2008).

____________________________________________________________________________________________
Advanced operation and control methods of municipalwastewater treatment processes in Finland
39
Chapter 4. Sensors and data analysisUntil very recently instrumentation was one of the main bottlenecks in improving wastewatertreatment automation and consequently control and monitoring were complicated tasks in theplant. Mainly due to the fact that during the last years WWTPs have been upgraded from beingrelatively simple mechanical/biological plants for removal of organic matter and suspendedsolids to being complex processes with physical, chemical and biological units, most of theplants implemented modern SCADA (supervisory control and data acquisition) systems forsubstituting old techniques for data acquisition and control. Even if the control of the plant isstill based on simple schemes, the instrumentation is no longer being considered a bottleneckfor monitoring WWTPs (Olsson et al., 2006).
Information collected in SCADA system of WWTP can be reused in soft sensors for e.g.instrument monitoring, fault detection and redundancy control. The aim of this Chapter is togive a brief but yet exhaustive overview on the used instrumentation and data analysis done inWWTPs.
4.1 Sensors and Analysers
Online sensorsAs stated by Olsson and Newell (1999), “the sensors are the eyes and ears of the controlsystem” and it is quite obvious that process control needs sensors and analyser for continuousonline implementation. Common sensors are reported in Table 1, their use is increasing foradvanced control of WWTP, and this gives rise to an important improvement in operatingsafety and better operational economy (Olsson et al., 2004).
Table 1. Commonly uses measurements in WWTPs (Olsson et al., 2004).
Flow Sludge concentrationLevel and pressure Sludge blanketTemperature NutrientspH Total N and PRedox Organic matter with UV absorbanceConductivity FluorescenceOxygen BiogasTurbidity
In particular, nutrient sensors technology is based on automated laboratory methods, it requiressample flow without suspended solids which represents in some extend the weakness in the online measurement: sampling and possible pretreatment of the sample stream. The developmentof nutrient sensors is based on the solution of these key aspects, focusing also on the reductionof chemical consumption, leaving still room for improvements.
SoftsensorsWhen nutrients analyser or generally speaking some needed measurements are not available online, in a successful manner, they can be estimated a softsensor, which represents acombination of robust hardsensors and a mathematical model defined to reconstruct the timeevolution of the unmeasured states. In this way, we can build very powerful monitoring tools,
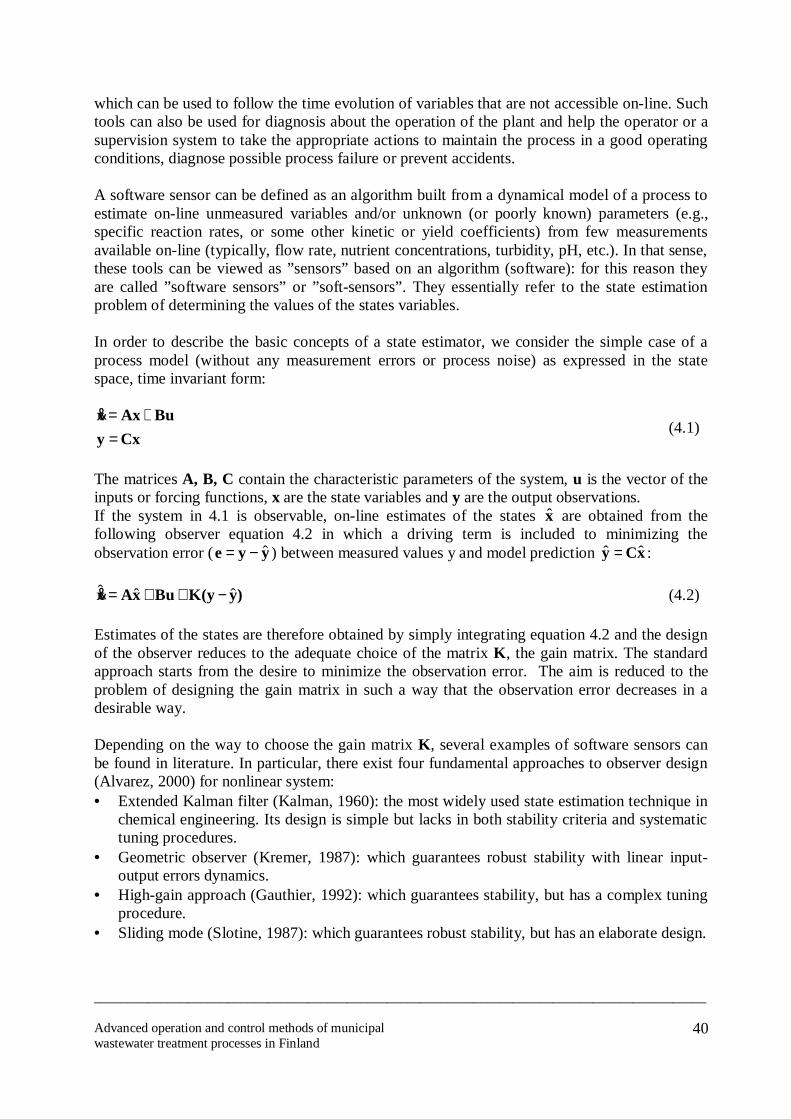
____________________________________________________________________________________________
Advanced operation and control methods of municipalwastewater treatment processes in Finland
40
which can be used to follow the time evolution of variables that are not accessible online. Suchtools can also be used for diagnosis about the operation of the plant and help the operator or asupervision system to take the appropriate actions to maintain the process in a good operatingconditions, diagnose possible process failure or prevent accidents.
A software sensor can be defined as an algorithm built from a dynamical model of a process toestimate online unmeasured variables and/or unknown (or poorly known) parameters (e.g.,specific reaction rates, or some other kinetic or yield coefficients) from few measurementsavailable online (typically, flow rate, nutrient concentrations, turbidity, pH, etc.). In that sense,these tools can be viewed as ”sensors” based on an algorithm (software): for this reason theyare called ”software sensors” or ”softsensors”. They essentially refer to the state estimationproblem of determining the values of the states variables.
In order to describe the basic concepts of a state estimator, we consider the simple case of aprocess model (without any measurement errors or process noise) as expressed in the statespace, time invariant form:
CxyBuAxx
=+=&
(4.1)
The matrices A, B, C contain the characteristic parameters of the system, u is the vector of theinputs or forcing functions, x are the state variables and y are the output observations.If the system in 4.1 is observable, online estimates of the states x are obtained from thefollowing observer equation 4.2 in which a driving term is included to minimizing theobservation error (e = y − y ) between measured values y and model prediction y = Cx :
)yK(yBuxAx ˆˆˆ −++=& (4.2)
Estimates of the states are therefore obtained by simply integrating equation 4.2 and the designof the observer reduces to the adequate choice of the matrix K, the gain matrix. The standardapproach starts from the desire to minimize the observation error. The aim is reduced to theproblem of designing the gain matrix in such a way that the observation error decreases in adesirable way.
Depending on the way to choose the gain matrix K, several examples of software sensors canbe found in literature. In particular, there exist four fundamental approaches to observer design(Alvarez, 2000) for nonlinear system:• Extended Kalman filter (Kalman, 1960): the most widely used state estimation technique in
chemical engineering. Its design is simple but lacks in both stability criteria and systematictuning procedures.
• Geometric observer (Kremer, 1987): which guarantees robust stability with linear inputoutput errors dynamics.
• Highgain approach (Gauthier, 1992): which guarantees stability, but has a complex tuningprocedure.
• Sliding mode (Slotine, 1987): which guarantees robust stability, but has an elaborate design.

____________________________________________________________________________________________
Advanced operation and control methods of municipalwastewater treatment processes in Finland
41
Many softsensor applications in wastewater treatment can be found in literature. For example,Lindberg (1997) proposed online methods for estimating the timevarying respiration rate andthe nonlinear oxygen transfer function from measurements of the dissolved oxygenconcentration. Also a work presented by Sotomayor et al. (2002) deals with oxygen estimation:they considered the design of a softsensor for online estimation of the biological activity ofmicroorganisms in an ASP, which are intimately related to the dissolved oxygen concentration.Benazzi et al. (2005) proposed a softsensor implementation based on an EKF for the onlinetracking of the total suspended solids. Aguado et al. (2006) compared different predictivemodels for nutrient estimation in a sequencing batch reactor (SBR): principal componentregression (PCR), partial least squares (PLS), and artificial neural networks (ANNs), in order tofind the most feasible softsensor for the SBR. Äijälä and Lumney (2006) investigated a flowcontrol throughout Rya WWTP in Göteburg (Sweden). The controller was implemented toreduce internal disturbances and to provide a firm foundation for more advanced processcontrol. No flow measurements was available in all the points they were needed for control; forthose points flow rate was estimated where necessary by simple flow balance models mainlybased on available online instrumentation. For pumping stations, softsensors were based onlift height and motor frequency or power. In this case, softsensors were also used for alarms,the flow control system for operating bypass water gate and adjustment of recirculation flowsetpoint of trickling filters. Soft sensors have been noticed to be robust and to reliably indicateonline measurement deviations. Nonlinear geometric observer was used for nutrientcomponent estimations by Mulas (2006), in order to predict the dynamic behaviour of nitrogencompound in activated sludge process for control purposes.
Predicting the wastewater characteristicsVariations in wastewater flow rate and concentrations of components occur daily, monthly andyearly; in certain patterns the variation can be described by time series model. A time seriesmodel to forecast influent flow rate, temperature, COD, NH4N and PO4P concentrations forseven days in advance was developed in South Korea (Kim et al., 2006). Three differentmethods were tested for developing a simple forecasting model according to the number ofmodels and forecasting steps (Figure 18). Field plant operation data of Dcity WWTP for 150days and 100 days were used for model development and model validation respectively. Theinfluent data was not measured every day; in fact, the measurement intervals were 24 days onaverage and 10 days at a maximum. Missing values were interpolated with the spline methodfor application to the time series analysis. ARIMA (autoregressive integrated moving average)analysis was also performed to generate reinterpolated values of influent characteristicsconsidered and a linear regressive model was developed. In conclusion, the method No. 3 (Onemodel and onestepahead forecasting) was considered to be the best of the three methodstested since forecasting did not result in any accumulated error and the coefficients estimationwas simple and easy.
Dellana and West (2009) have made a research on comparison of multiperiod predictive abilityof linear ARIMA models to nonlinear time delay neural network (TDNN) models in wastewatertreatment applications. In the study artificially generated data sets were used to simulatewastewater process characteristics as well as realworld wastewater data sets. TDNN wasclearly superior for single period forecasting. However, when complexity was increased theTDNN did not have an accuracy advantage over ARIMA. TDNN was more accurate for singleperiod and multiperiod predictions for measures of nitrogen, phosphorous and BOD.

____________________________________________________________________________________________
Advanced operation and control methods of municipalwastewater treatment processes in Finland
42
Figure 18. Procedure for development of time series models with three different methods (Kimet al., 2006).
As plantwide modelling and benchmarking simulations will apparently be important researchand development methods in the near future, there is still a major challenge for plantwidecontrol in real plants: predicting the influent flow rate. For this reason, using data frompumping stations in the catchments area of the plant instead of using rain gauges a majoruncertainty in the calculations is avoided (Olsson and Jeppson, 2006).
4.2 Data analysis and fault detectionSometime having a lot of measurement data available means that there is the need to extractrelevant information. In this case, instrumentation has to be combined with adequate datascreening, measurement processing and more or less sophisticated extraction of feature fromthe measurements, since the today problem is not the lack of data, but data that reveals adequateinformation.
Data screeningThe possibility to finely perform online monitoring and process control depends on the qualityof data; for this reason, data screening represents a very important task. Data screening methodsprovide the researchers, as well as the plant operators, essential means to detect potential dataproblems by identifying data entry errors, missing values, possible outliers, nonnormaldistributions, etc. A compressive but yet complete review on data screening methods used alsoin wastewater application can be found in Olsson and Newell (1999) and later in Olsson et al.(2004).
Data reconciliationMeasured data of WWTPs often contain errors, which can be reduced by using datareconciliation. This is essential before using data for modelling, process evaluation, processdesign and benchmarking purposes. Application of mass balances in difficult because of

____________________________________________________________________________________________
Advanced operation and control methods of municipalwastewater treatment processes in Finland
43
dynamic nature and variability of the influent load; additionally, accuracy of design parameterslike sludge retention time (SRT) and internal conversion rates is highly important.
For example, mass balances of Deventer WWTP in the Netherlands using biologicalphosphorous removal process were studied by implementing gross error detection and datareconciliation software Macrobal (Puig et al., 2008). The WWTP was intensively sampledduring three separate days during dry weather flow conditions. Overall flow and totalphosphorous (TP) balances contained significant errors caused by e.g. measurement errors,which could be fitted using reconciliation and balancing software; also standard deviationswere highly reduced. The SRT was calculated in four different ways; the best results wereobtained way by using the TP balance based on TP leaving the treatment process. When usingCOD measurements, the nonmeasured oxygen consumption was noticed to makereconciliation of the balance impossible.
Fault detection and diagnosisClosely linked with data acquisition is the detection of faulty behaviour from process data.Fault detection and diagnosis (FDD) methods are a family of approaches finalized to detectionand location of faults on processing systems. The term “fault” is generally defined as “anunpermitted deviation of at least one characteristic property of the system from the acceptable,usual, standard condition” (Isermann, 2006). The main aim of FDD methods consists indetermining the type, size and location of the most possible fault, as well as its time of detectionin order to improve product quality, plant efficiency, as well as ability to meet environmentaland safety constraints. Research in this field has been very active since the 1970s and numerousfault diagnosis methods are reported in the industrial and academic literature.
Interest in monitoring systems for FDD in biological processes and, specifically, WWTPs hasstarted around 30 years ago with an early application of model identification and diagnosis byBeck et al. (1978) based on a fuzzy control. Since then, several alternative approaches werepresented, mainly based on statistical considerations. Fuente et al. (1996) compare a number ofestablished techniques for estimating the process parameters when a fault occurs in a simplifiednonlinear model for a real plant. Yoo et al. (2003) proposed the identification of differentoperating conditions and discrimination between sustained and simple faults by using databased methods for dimensionality reduction and clustering. In a similar fashion, Lee et al.(2004) focused on the identification of faulty sensors and the reconstruction of themeasurements by estimating the process dynamics; here, a dynamic principal componentanalysis (PCA) was successful in effectively detecting the faults, especially when the abnormalcondition was caused by a single sensor failure. In the more recent work, Ciappelloni et al.(2006) proposed a combination of model and databased techniques to describe a pilotscaleaerobic sequence batch reactor (SBR); PCA is again used to describe different process cyclesand a decision algorithm was developed to classify different process faults. The SBR was alsostudied by Wimberger and Verde (2008), with the goal of evaluating the detectability andisolability for analytical and signalbased fault detection and isolation. A different approachwas proposed by Nejjari et al. (2008), where an extended Luenberger observer is adopted forthe residual generation of sensor faults. Zumoffen and Basualdo (2008) focused on the need foran efficient fault tolerant control on WWTP. Nevertheless, the databased approach to faultdetection methods can achieve only limited validity, mainly because vast amounts of data arerequired but not necessarily available in a WWTP. Essentially, for these reasons the causal faultdiagnosis approach is believed to have a promising potential.

____________________________________________________________________________________________
Advanced operation and control methods of municipalwastewater treatment processes in Finland
44
Part II
ICA situation at the Finnish Wastewater TreatmentPlants

____________________________________________________________________________________________
Advanced operation and control methods of municipalwastewater treatment processes in Finland
45
Stateoftheart surveys on ICA at WWTPs have been performed over the years with theperspective of different countries. Starting with one of the first overviews of ICA in theScandinavian countries by Olsson et al. (1998) and at the same time by Garrett (1998) in theUnited States, interest in the implementation of automation in WWTPs has been progressivelygrowing. An international survey was provided by Ingildsen (2002), giving an interestingpicture of the actual utilization of sensors and controls in the plants based on key performanceindicators. Jeppsson et al. (2002) took the point of view of European country conditions, wherethe focus was on the level of instrumentation used in mediumsized plants (>50 000 p.e.) foronline control. Lately, this situation has been summarized and updated by Olsson et al. (2005),whose main conclusions were that a well established level of automation based on physicalvariables and basic control of dissolved oxygen has been reached, while control based on moreadvanced sensors is still in the initial stages.
Similarly, the aim of this Part is to review the current status of ICA in municipal WWTPs inFinland. The method of investigation is based on a questionnaire including key elementsregarding plant design, operation and utilization of ICA, and operators’ opinion which was sentto large (> 100 000 p.e.), mediumsized (30 000 – 100 000 p.e.) and small WWTPs in Finland.Furthermore, onsite surveys of some of the most representative WWTPs were made.

____________________________________________________________________________________________
Advanced operation and control methods of municipalwastewater treatment processes in Finland
46
Chapter 3. ICA at Finnish ASPs
In order to investigate the situation of instrumentation, control and automation in Finland, aquestionnaire was carefully prepared in cooperation with Finnish wastewater treatment expertsand by utilizing the information of a WWTP survey previously conducted in Finland (Kangas,2004). In the questionnaire, key aspects regarding plant design, operation, and a more specificpart on ICA were included. ICA questions concerned for instance sensors, automatic analysersand their use in online control, type and usability of different controls, advanced controllersand process modelling, as well as the plant operator's attitude towards ICA. The questions alsoconcerned the configuration and operation, removal requirements, industrial wastewaters,wastewater temperature, chemical use and electricity consumption. Further, the major problemsand future expectations for WWTPs were queried. Altogether there were questions on thirtyone topics in the questionnaire, some of which were divided in to several subquestions. Theanswers of the questionnaire concern either year 2006 or 2007.
Twentyfour of the investigated plants answered the questionnaire, making a response rate of70%, and nine of them were visited (three of the plants are built inside of the bed rock). Nineplants were chosen as a representative group of Finnish municipal WWTPs of different scales,and insitu investigations were organized.
3.2 Plant configurations and operationThe design of the plant has consequences for the plant efficiency and performances, and for thisreason, plant design questions were investigated first. All of the WWTPs considered in thesurvey consist of activated sludge processes, with different configurations and basin shapes,where the main objective is total nitrogen removal (in 14 plants), ammonia removal (in fiveplants) and biological phosphorus removal (in two plants), as schematically reported in Figure19. Five of the plants have no requirement for nitrogen or ammonia removal. The WWTPsstudied have been in operation from 7 to 54 years; however, all the plants excluding the latestone have been renovated during this decade.
0
2
4
6
8
10
12
14
16
Only org.matter removal
NH4N removal Total N removal Biological Premoval
Qua
ntity
of W
WTP
s
Figure 19. Quantities of WWTPs designed for different substance removal.
Typically, the wastewater treatment line of a Finnish WWTP consists of screens, sand trap,primary clarifiers, activated sludge basins and secondary clarifiers. Moreover, some of theplants have tertiary treatment, and equalization basin or middle clarifier. Flotation is the mostcommon tertiary treatment unit in use at four of the WWTPs included in the study, while post

____________________________________________________________________________________________
Advanced operation and control methods of municipalwastewater treatment processes in Finland
47
filters are used as a tertiary treatment process at two plants. The biological treatment processconfiguration varies in the different plants as shown in Table 2. Predenitrification andsimultaneous nitrification and denitrification being the most common process types, the numberof biological treatment lines varies between 1 and 10 with an average 3.4 lines; however, thenumber of primary and secondary clarifier lines is not necessarily the same as the number ofactivated sludge lines.
The average design flow rate at WWTPs is 38 300 m3/d and the average maximum design flowrate is 2 980 m3/h. The average current flow rate at the WWTPs considered is 29 200 m3/d;however, the flow rates of the plants differ substantially with the range of average flow ratesfrom 2 150 – 260 000 m3/d. In addition, the proportion of current flow rate to design flow ratevaries from 35 to 104%, the average being 69%.
Table 2. Number of different nitrogen removal processes.
Type of treatment process NumberPredenitrification 6Simultaneous nitrification / denitrification 6Postdenitrification 2Alternate nitrification / denitrification 3Only nitrification 4
The considered average sludge production at the WWTPs is 1.2 kg TS/kg BOD7, the standarddeviation being 0.53 kg TS/kg BOD7. The water content of sludge varies from 68 to 94% whilethe average value is 76%. The sludge productions (tn/a) as dry solids and flow rates at WWTPsare presented in Figure 20.
02000400060008000
100001200014000160001800020000
1 2 3 4 5 6 7 8 9 10 11 12 13 14 15 16 17 18 19 20 21 22
Slud
ge p
rodu
ctio
n, tn
/a
0
50000
100000
150000
200000
250000
300000
Flow
rate
, m3/
d
Sludge productionFlow rate
Figure 20. Sludge productions and flow rates at WWTPs.
The mean sludge age used in plant operation during wintertime is 13.5 d and duringsummertime 9.5 d. Additionally, 10 of the plants are operated according to target sludge ageand 11 according to target sludge concentration. Regarding the share of industrial wastewater(from e.g. food, paper, chemical and textile industries) 10.5% of influent flow rate and 19.8%of influent load were found to be average values in the considered plants. The average COD/Nratio of the influent is 11.9, which is considered low for a denitrification process without theuse of an external carbon source.

____________________________________________________________________________________________
Advanced operation and control methods of municipalwastewater treatment processes in Finland
48
The usual problematic conditions at Finnish WWTPs are snowmelt and heavy rain; in such asituation, the influent flow rate can be too high, and for that reason also bypasses controlledmanually by the plants operators are common. In fact, at nine of the investigated plants thebiological part of the treatment process was bypassed during last year, whereas the wholeprocess was bypassed at ten plants, and only at six of the WWTPs were no bypasses done. Theremoval requirements of 20 WWTPs were always fulfilled during the year of the questionnairesurvey, while the regulations of three plants were violated. When the whole process is notbypassed wastewater is treated e.g. in part of the presettling lines with precipitation chemicalor in tertiary treatment unit such as flotation.
Energy and chemical consumptionsThe operation of the plant is associated with various costs, such as chemical and energyconsumption. The consumption of precipitation and alkalinity chemicals as well as an externalcarbon source varies from plant to plant. The average dosages of the most used chemicals at theinvestigated plants are presented in Figure 21a. The most commonly used precipitationchemical in Finnish WWTPs is ferrous sulphate, which is in use at 14 of the plants with anaverage dosage of 128 g/m3, whilst ferric sulphate is used in nine plants. In addition to theprecipitation chemicals shown in Figure 21a, also polymer is used for precipitation at fourplants and aluminium chloride at two plants. Polymers are fed into secondary clarifiers andused together with ferrous or ferric sulphate.
02468
10121416
Ferro
ussu
lpha
te
Ferri
csu
lpha
te
Cal
cium
hydr
oxid
e
Sod
ium
carb
onat
e
Met
hano
l
Qua
ntity
of W
WTP
s
0
50
100
150
200
250
Dos
age,
g/m
3QuantityDosage
a)
05
1015202530354045
1 3 5 7 9 11 13 15 17 19 21 23
Elec
trici
ty c
onsu
mpt
ion,
GW
h/a
0
50000
100000
150000
200000
250000
300000
Flow
rate
, m3/
d
Electricity consumptionFlow rate
b)
Figure 21. Quantity of WWTPs using different chemicals and average dosages of thechemicals (a). Electricity consumptions and flow rates at WWTPs (b).
From Figure 21a, it can be seen that calcium hydroxide is the most used alkalinity chemical (12plants); sodium carbonate is used at three of the plants; in addition, methanol is used as anexternal carbon source at four of the WWTPs. At most of the plants with a total nitrogenremoval process an external carbon source is not used; instead, several of the plants are able toutilize carbonrich industrial wastewaters from, e.g. breweries or dairies as a carbon source fordenitrification. The range of methanol dosage is 23 – 56 g/m3 the average dosage being 35 g/m3.At the WWTP with the lowest methanol consumption there is a postdenitrification process.
The electricity consumption per influent flow rate ranges from 0.17 to 1.00 kWh/m3.Additionally, seven of the WWTPs were able to specify the amount of electricity consumed inaeration, with the average share being 43.1% of total electricity consumption; furthermore, theaverage consumption of the biological part of the plant is 54.6% of total electricity consumptionat five plants able to define the number. The average consumption of sludge treatment of thetotal electricity consumption at eight of the plants is 5.8%. Six of the plants also produceelectricity onsite using biogas derived from sludge digestion; specifically, on average they

____________________________________________________________________________________________
Advanced operation and control methods of municipalwastewater treatment processes in Finland
49
produce 34.8% of the electricity consumed at the WWTP. The highest electricity productionrate among the plants considered is 49% of the electricity consumed. Electricity consumptionsand flow rates at WWTPs considered are presented in Figure 21b. It can be seen that there are afew plants with substantially different electricity consumption. The reasons for this are various;e.g. plant No. 3 in Figure 21b has only an ammonia removal requirement, plant No. 9 has nonitrogen removal requirement and plant No. 14 is a carrier process, the configuration andoperation of which differs from normal activated sludge plants.
Wastewater qualityAverage concentrations of influent wastewater at sixteen the WWTPs considered are presentedin Table 3; also average values of biological oxygen demand (BOD7) and chemical oxygendemand (CODCr) are included. The average COD/N ratio of the influent is 11.9, which is lowfor denitrification process without use of external carbon source. The range of influent COD/Nratios at varies from 8.9 to 18.4.
Table 3. Average concentrations of influent wastewater.
Substance BOD7 CODCr Tot. N NH4N Tot. P SS
Concentration, mg/l 248 582 48.0 37.9 8.3 297
Low temperature of municipal wastewater is typical in Finland. At the WWTPs considered themean wastewater temperature and the average minimum temperature are 12.3°C and 6.8°Crespectively. In addition, the average time, when temperature of wastewater is above 12°C, is6.2 months during a year. Moreover, the average share of industrial wastewater (from e.g. food,paper, chemical and textile industries) at WWTPs is 10.5% of influent flow rate and 19.8% ofinfluent load.
EmployeesAt fourteen of the WWTPs employees work on five days a week during the day in a normalsituation, at four plants on seven days a week during the day and at three plants on day andnight seven days a week (Figure 22). At one of the plants there is manning on 92.5 h/wk. Thenumber of fulltime employees at the WWTPs varies from 2 to 50 with an average 9.8 perplant. Additionally, the average flow rate per an employee is 2 450 m3/d.
0 2 4 6 8 10 12 14 16
Five days a weekduring the day
Seven days a weekduring the day
Day and nightseven days a week
Other
Quantity of WWTPs
Figure 22. Manning at the WWTPs.

____________________________________________________________________________________________
Advanced operation and control methods of municipalwastewater treatment processes in Finland
50
Wastewater qualityAverage concentrations of influent wastewater at sixteen the WWTPs considered are presentedin Table 3; also average values of biological oxygen demand (BOD7) and chemical oxygendemand (CODCr) are included. The average COD/N ratio of the influent is 11.9, which is lowfor denitrification process without use of external carbon source. The range of influent COD/Nratios at varies from 8.9 to 18.4.
Table 4. Average concentrations of influent wastewater.
Substance BOD7 CODCr Tot. N NH4N Tot. P SS
Concentration, mg/l 248 582 48.0 37.9 8.3 297
Low temperature of municipal wastewater is typical in Finland. At the WWTPs considered themean wastewater temperature and the average minimum temperature are 12.3°C and 6.8°Crespectively. In addition, the average time, when temperature of wastewater is above 12°C, is6.2 months during a year. Moreover, the average share of industrial wastewater (from e.g. food,paper, chemical and textile industries) at WWTPs is 10.5% of influent flow rate and 19.8% ofinfluent load.
3.3 Status of ICA in FinlandIn this section the results of the survey regarding the present condition of modelling, monitoringand control at the Finnish WWTPs are reported and analyzed.
SensorsA sensor inventory was given in the distributed questionnaire and it was asked to identify thevariables continuously measured and monitored in the plant. Altogether 18 different wastewatercharacteristics are measured online at the 24 WWTPs considered. The number of WWTPs atwhich sensors and online analysers are used and the number at which those are used forcontrol are presented in Figure 23a. The percentage of WWTPs at which sensors and analysersare considered to function properly is shown in Figure 23b. Also, a common practice is to havea maintenance contract with the supplier of the sensors and analysers.
Dissolved oxygen (DO), suspended solids (SS), temperature, pH and level sensors areestablished technology at WWTPs; the operators consider them to function well apart from theSS and pH sensors. Presumably the reason for this is the use of SS and pH sensors in activatedsludge basins in which there is a high concentration of solid matter. SS measurements are used,e.g. for recycle sludge pumping control. Optical DO sensors are becoming more common atFinnish WWTPs and the plant operators find them more reliable and easier to maintain thangalvanic and polarographic DO sensors.
Fourteen out of 24 plants use automatic NH4N, NO3N and PO4P online analysers, but theuse of nutrient sensors in control is not common even though the operators generally considerthe sensors to function properly. The nutrient sensors are mainly in use at the plants that have atotal nitrogen removal requirement. Moreover, the most modern online nutrient analysers atthe WWTPs visited are calibrated automatically. The usual locations of measurement fornutrient analysers are activated sludge basin and effluent, but NH4N analysers are also used inother parts of the process, e.g. primary clarifiers and influent flow at some of the plants.
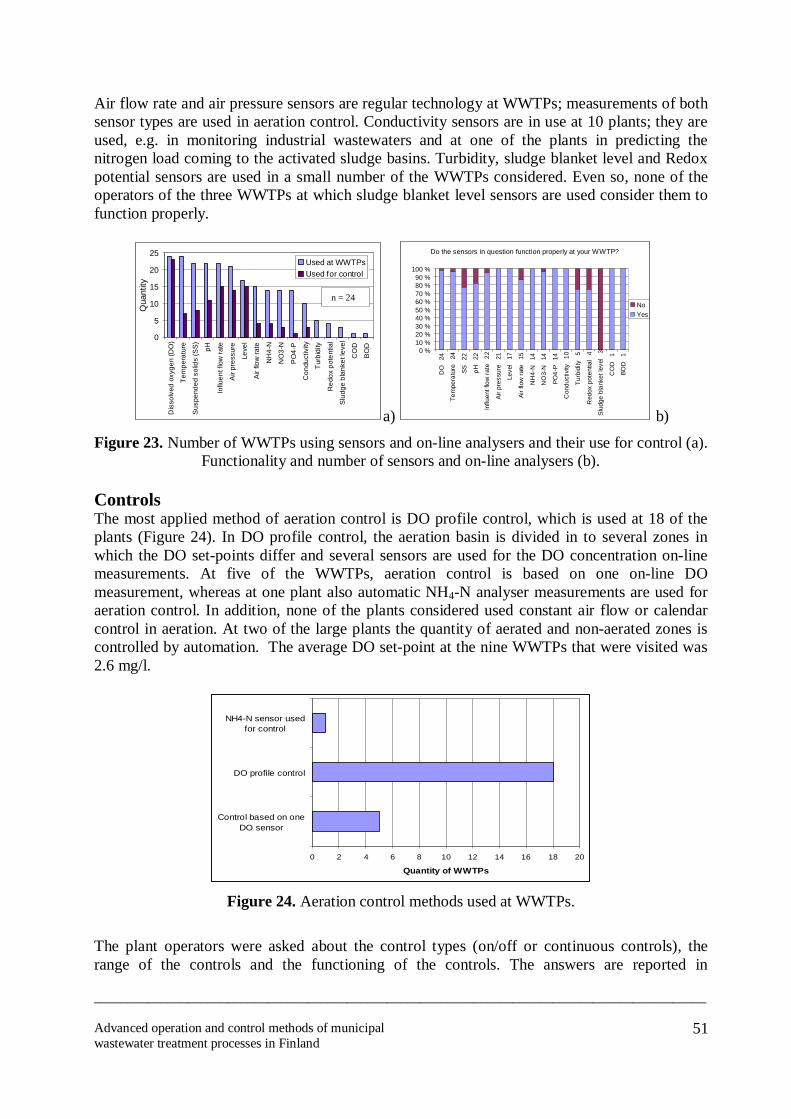
____________________________________________________________________________________________
Advanced operation and control methods of municipalwastewater treatment processes in Finland
51
Air flow rate and air pressure sensors are regular technology at WWTPs; measurements of bothsensor types are used in aeration control. Conductivity sensors are in use at 10 plants; they areused, e.g. in monitoring industrial wastewaters and at one of the plants in predicting thenitrogen load coming to the activated sludge basins. Turbidity, sludge blanket level and Redoxpotential sensors are used in a small number of the WWTPs considered. Even so, none of theoperators of the three WWTPs at which sludge blanket level sensors are used consider them tofunction properly.
0
5
10
15
20
25
Dis
solv
ed o
xyge
n (D
O)
Tem
pera
ture
Sus
pend
ed s
olid
s (S
S)
pH
Influ
ent f
low
rate
Air
pres
sure
Leve
l
Air
flow
rate
NH
4N
NO
3N
PO
4P
Con
duct
ivity
Turb
idity
Red
ox p
oten
tial
Slu
dge
blan
ket l
evel
CO
D
BO
D
Qua
ntity
Used at WWTPsUsed for control
a)
Do the sensors in question function properly at your WWTP?
0 %10 %20 %30 %40 %50 %60 %70 %80 %90 %
100 %
DO
24
Tem
pera
ture
24
SS
22
pH
22
Influ
ent f
low
rate
22
Air p
ress
ure
21
Leve
l 1
7
Air f
low
rate
15
NH
4N
14
NO
3N
14
PO4
P 1
4
Con
duct
ivity
10
Turb
idity
5
Red
ox p
oten
tial
4
Slud
ge b
lank
et le
vel
3
CO
D
1
BOD
1
NoYes
b)
Figure 23. Number of WWTPs using sensors and online analysers and their use for control (a).Functionality and number of sensors and online analysers (b).
ControlsThe most applied method of aeration control is DO profile control, which is used at 18 of theplants (Figure 24). In DO profile control, the aeration basin is divided in to several zones inwhich the DO setpoints differ and several sensors are used for the DO concentration onlinemeasurements. At five of the WWTPs, aeration control is based on one online DOmeasurement, whereas at one plant also automatic NH4N analyser measurements are used foraeration control. In addition, none of the plants considered used constant air flow or calendarcontrol in aeration. At two of the large plants the quantity of aerated and nonaerated zones iscontrolled by automation. The average DO setpoint at the nine WWTPs that were visited was2.6 mg/l.
0 2 4 6 8 10 12 14 16 18 20
Control based on oneDO sensor
DO profile control
NH4N sensor usedfor control
Quantity of WWTPs
Figure 24. Aeration control methods used at WWTPs.
The plant operators were asked about the control types (on/off or continuous controls), therange of the controls and the functioning of the controls. The answers are reported in
n = 24

____________________________________________________________________________________________
Advanced operation and control methods of municipalwastewater treatment processes in Finland
52
Figure 25a, while Figure 25b summarizes the functioning conditions of the controllers used.Apart from influent and excess sludge pumping, the majority of the controls are continuous. Apair of other controls (polymer feed, methanol feed, neutralizing influent wastewater) is notmentioned. The plant operators consider the control ranges for most of the controls to besuitable even if according to the their opinion, the most common problems with the controlrange are with precipitation chemical feed; at one plant the range is too wide and at two plantstoo narrow; also the range of aeration control valves is too wide at two plants. At two plants thereturn sludge pumping control and control of the valves used in aeration are mentioned as notfunctioning properly; nevertheless, generally the controls are considered to functionsatisfactorily. At the majority of the plants a part or all of the precipitation chemicals are fedflow proportionally.
0 5 10 15 20 25
Influent pumping
Return sludge pumping
Excess sludge pumping
Aeration, control valve
Aeration, compressors
Precipitation chemical feed
Alkalinity chemical feed
Quantity of WWTPs
On/offContinuous
a)
Does the control function properly?
0 % 20 % 40 % 60 % 80 % 100 %
Influent pumping
Return sludge pumping
Excess sludge pumping
Aeration, control valve
Aeration, compressors
Precipitation chemical feed
Alkalinity chemical feed
YesNo
b)Figure 25. Number of on/off and continuous controls (a). Functioning of the controls at
WWTPs (b).
The major part of the controls at the WWTPs is implemented by using basic feedbackcontrollers, being the tuning done from the control room by the operators. Advancedcontrollers, such as adaptive controller, fuzzy logic controller and modelbased controller, arein use at six plants for different purposes such as air flow control in aeration, mass flow ratecontrol of return sludge, centrifugal sludge dewatering, methanol feed, and precipitationchemical feed. Fuzzy logic is also used to predict the nitrogen load coming in to the activatedsludge basins at one WWTP.
AlarmThe alarm management was investigated and as result it was found that different levels ofalarms are taken into account, for instance indicating faults in the process equipment. Usually atmodern Finnish plants the treatment process can be monitored and controlled remotely, e.g. onweekends, especially for alarm purposes.
ModellingProcess modelling and simulation have been used at five of the plants; three of these have theirown modelling software in use. Three of the operators answered that modelling is also used ashelp for process control; at one plant there is an expert system and at the other two modelling isused offline in creating control strategies. The operators mentioned studying different processoperating possibilities, process design and supporting the startup of the process as uses formodelling software, whereas using modelling for dynamic setpoint setting is considered onepossible application in plant operation in the future. The plant operators found accurate modelcalibration rather challenging, which limits the use of models. In addition, the possibilities ofusing modelbased controllers have not yet been taken into account.

____________________________________________________________________________________________
Advanced operation and control methods of municipalwastewater treatment processes in Finland
53
Two of the plants at which modelling has not been used so far have considered usingmodelling, but not purchasing their own modelling software (Figure 26). Additionally, anothertwo WWTPs have thought of using modelling and purchasing their own software. Theremaining 14 plants at which modelling has not been used have not so far considered usingmodelling at their WWTPs. Two of the WWTPs considered have recently taken part in aresearch project during which the plant was modelled; however, the results of the project werenot utilized at the time of answering the questionnaire.
Have you considered of using modelling orpurchasing an own simulation software?
0 2 4 6 8 10 12 14 16
No
Yes, modelling
Yes, modellingand purchasing
a software
Quantity of WWTPs
Figure 26. Opinions on using modelling and purchasing own simulation software at theWWTPs not been modelled so far.
Attitude towards ICAAs final questions in the questionnaire, opinions on the current status of instrumentation andcontrol at the investigated plant were asked to the plant operators. It can be notice in Figure 27that the most part of them (in 13 of the plants) considers that it would probably be possible togain more from the current ICA equipment in use, giving a good attitude towards ICAimplementation and improvement in their own plants. Furthermore, most of the operatorsmoderately agreed that the importance of ICA is going to increase in the near future, but overone third of the interviewed operators strongly agreed as reported in Table 4.
How do you evaluate the use of the currentinstrumentation and automation at your plant?
0 2 4 6 8 10 12 14
It would be possible to benefit muchmore from them
It would be possible to benefit morefrom them
It would probably be possible to benefitmore from them
It would not be possible to benefit morefrom them
Figure 27. Opinions on the current instrumentation and automation by plant operators.

____________________________________________________________________________________________
Advanced operation and control methods of municipalwastewater treatment processes in Finland
54
Table 5. Opinions on importance of ICA at WWTPs in the near future: “Instrumentation,control and automation will be more important at WWTPs in the near future than they are
today”
Strongly agree 9
Mildly agree 15
Neither agree nor disagree 0
Mildly disagree 0
Strongly disagree 0
The interviewed plant operators give to ICA an important role in making a more efficientmanagement in their plants, in particular they considered that the following points can behelpfully solved by means of ICA:
1. Prediction of wastewater flow rate and load realtime;2. Utilization of automatic online analysers in control;3. Better aeration control;4. More reliable the online measurements.
In fact, infiltration into the sewage network, heavy rainfalls and storm waters are named as themost important bottleneck in operation of the plant in four of the answers. Additionally,maintenance of automation equipment and reliability of measurements are mentioned often.Even though at some of small and mediumsized plants visited the knowledge of the employeeson ICA is average, there are also exceptions; at some WWTPs development of ICA and plantoperation practices is followed closely and there is interest in implementing new technologyand practices.
At two of the WWTPs the quantity of aerated and nonaerated zones is changed by automation.Otherwise e.g. automatic control of equalization basin operation during high flow rates andautomation relating to influent pumping sequence during and after a power cut are mentionedas unusual automation. At one of the WWTPs considered there is a prediction system for futureinfluent flow rate taking also weather forecasts into account.
Considerations from the WWTP visitsNine WWTPs were visited during the project: three large, five mediumsized and one smallplant. At one of the WWTPs there was only ammonia nitrogen removal requirement and ateight plants total nitrogen removal requirement at the time of the visit. Process configurationswere various; the most typical process among the visited plants was DNprocess and otherprocess types consisted of e.g. postdenitrification process, AB process and ring channelprocess.
At majority of them new automation has been installed during the last few years and monitoringsoftware had been renewed or updated. The latest automation renewals consisted of e.g. areporting and data recorder software. The control rooms and SCADA systems at the visitedplants were generally modern and suitable for plant operation, but also variation in the level of

____________________________________________________________________________________________
Advanced operation and control methods of municipalwastewater treatment processes in Finland
55
automation and also utilization of it was noted to be remarkable; additionally, as expected, atthe large WWTPs with bigger number of employees the knowledge on ICA was better and theautomation systems were updated more regularly. Several types of sensors had been renewed atmost of the plants during the last few years; furthermore, at several plants operators said thatthe plants are forced to do this, because there are no spare parts available anymore for the oldersensor types.
Several causes for operational problems or limitations were mentioned, e.g. faulty design ofchannels or wrong location of chemical feed. Naturally also configuration of unit processes hasa major influence on the flexibility of operation of the treatment process; moreover, this is of aspecial importance in cases when a nitrification process is modified to nitrificationdenitrification process.
In the discussions had during the visits ideas for improvements for plant operation werementioned. According to one idea, chemicals would be useful to feed mass flow proportionallyinstead of volume flow proportional feeding generally used. This could be done, if there weremore reliable online nutrient measurements or softsensor nutrient estimates of influentwastewater quality.
At most of the plants there are cross flow ultra filters removing suspended solids beforepumping the samples to online nutrient analysers. The ultra filters have to be cleaned once ortwice a week and were often mentioned to be troublesome to maintain. Another more advancedfiltering solution used at one WWTP visited is an insitu membrane filtration unit, which iseasy to maintain and routine weekly cleaning is not needed. When the insitu filter is about tobe clogged up and needs cleaning, an automatic alarm signal is given for plant operators.
The general attitude at WWTP visits was that it is better to have less measurements, which areliable, than lot of measurements some of which are not reliable. The basis of use of onlinemeasurements in control and monitoring is the accuracy of the measurements.
At few plants there are also new ion selective ammonium and nitrate sensors for directmeasurement. The ion selective sensors are placed into the activated sludge basin and nofiltration or reagents are needed for the online measurement in contrast to generally usednutrient analysers; moreover, the location of the sensors can be easily changed according towhat are the needs for measurements.
At smaller plants visited bypasses of the treatment process is a typical problem during heavyrains and storm waters. At larger plants the whole process is usually not bypassed but largewater flows can be treated e.g. in part of the primary clarifier lines with precipitation chemicalor in a tertiary treatment unit. At one of the visited plants a separate Actiflo process for bypasswater treatment will be implemented in the near future.

____________________________________________________________________________________________
Advanced operation and control methods of municipalwastewater treatment processes in Finland
56
Chapter 4. Conclusions and future research needsAn extensive survey on ICA conditions at large and mediumsized Finnish municipal WWTPswas carried out and the following conclusions were drawn.
Twentyfour activated sludge plants answered a questionnaire including the questions on plantdesign, operation and ICA and nine plant visits were made. Predenitrification andsimultaneous nitrification and denitrification are most common process types in use. Averagedesign flow rate at WWTPs is 38 300 m3/d, but the range of the flow rates is broad. The meanenergy consumption at the plants is 0.5 kWh/m3. Aeration is the biggest consumer of theenergy; the average share of aeration is 43% of total energy consumption at WWTP. The shareof the electricity produced onsite using biogas is on the average 35% of the electricityconsumed at six of the plants. The average COD/N ratio of the influent is 12.1, which can beconsidered low for a total nitrogen removal process, which is in use at fourteen of the plants. Atthe WWTPs considered the mean wastewater temperature is as low as 12.3°C. The averageshare of industrial wastewater at WWTPs is 19.8% of influent load; however, at some of theplants there is carbonrich industrial wastewater, which can be used in denitrification instead ofmethanol used as an external carbon source at four of the plants.
Altogether eighteen different wastewater characteristics are measured online at the WWTPsconsidered; additionally, at fourteen plants there are automatic NH4N, NO3N and PO4P online analysers, but use of nutrient sensors in control is not common even though the operatorsgenerally consider the sensors to function properly. Reasons for this are that nutrient sensorsbeing fairly new technology at several plants and that the maintenance of nutrient sensors andsample pretreatment equipment is often considered troublesome. The most applied method toaeration control is DO profile control, which is used at eighteen of the plants; at one plant alsoautomatic NH4N analyser measurements are used for aeration control. Apart from influent andexcess sludge pumping majority of the controls are continuous; furthermore, generally the plantoperators consider the controls to function properly. Major part of the controls at the WWTPs isimplemented by using basic feedback controllers; moreover, advanced controllers are in use atsix plants. Process modelling and simulation has been used at five of the plants; only at three ofthose there is an own modelling software in use. Modelling and simulation is quite newtechnology at Finnish WWTPs, but the popularity of modelling and simulation seems to beincreasing.
The operators at thirteen of the plants consider that it would probably be possible to gain morefrom the current ICA equipment in use. This could be done e.g. with better use of onlinemeasurements in control and optimizing the control strategies at the plants. Infiltration into thesewage network and the high flow rate variations caused by heavy rainfalls and storm watersare considered as the most important bottlenecks in operation of the plant. Especially at smallerplants the problem can be severe since bypasses happen often and there is not much that can bedone at the WWTP. If the major problem is considered to concern condition and type of thesewer network, implementing advanced ICA technology at the plant does not improve thesituation essentially. Fortunately at majority of the plants the situation is not theaforementioned.
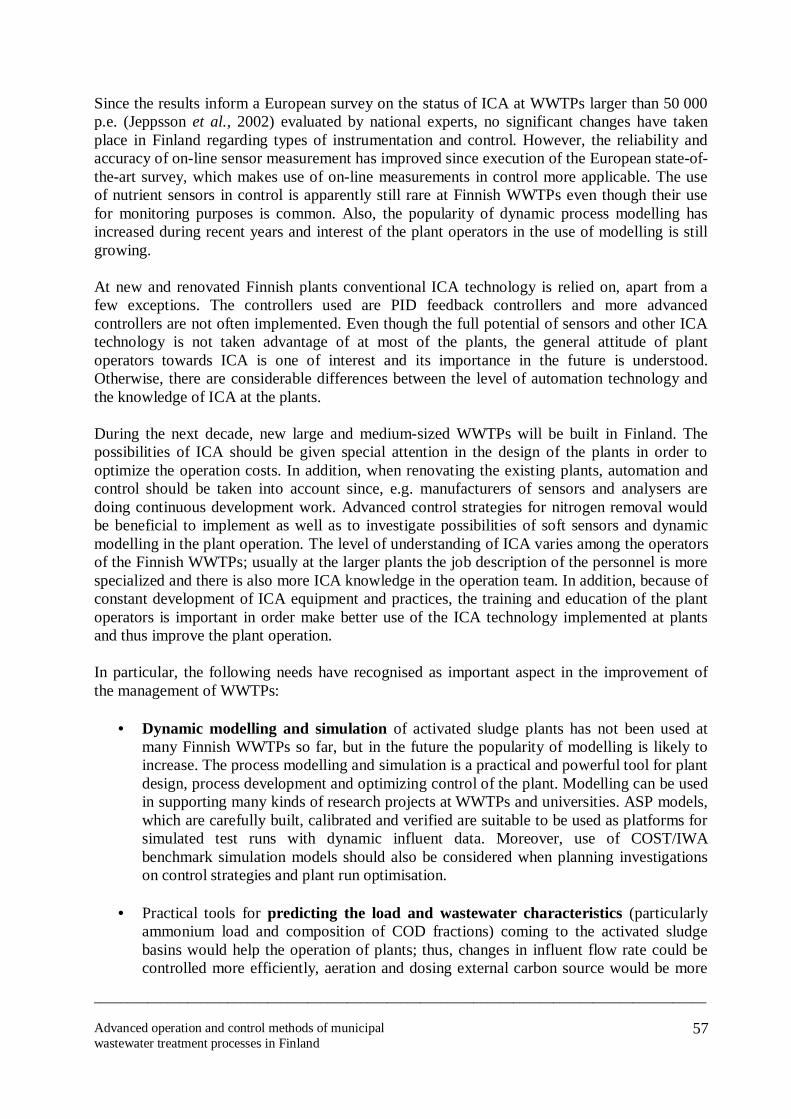
____________________________________________________________________________________________
Advanced operation and control methods of municipalwastewater treatment processes in Finland
57
Since the results inform a European survey on the status of ICA at WWTPs larger than 50 000p.e. (Jeppsson et al., 2002) evaluated by national experts, no significant changes have takenplace in Finland regarding types of instrumentation and control. However, the reliability andaccuracy of online sensor measurement has improved since execution of the European stateoftheart survey, which makes use of online measurements in control more applicable. The useof nutrient sensors in control is apparently still rare at Finnish WWTPs even though their usefor monitoring purposes is common. Also, the popularity of dynamic process modelling hasincreased during recent years and interest of the plant operators in the use of modelling is stillgrowing.
At new and renovated Finnish plants conventional ICA technology is relied on, apart from afew exceptions. The controllers used are PID feedback controllers and more advancedcontrollers are not often implemented. Even though the full potential of sensors and other ICAtechnology is not taken advantage of at most of the plants, the general attitude of plantoperators towards ICA is one of interest and its importance in the future is understood.Otherwise, there are considerable differences between the level of automation technology andthe knowledge of ICA at the plants.
During the next decade, new large and mediumsized WWTPs will be built in Finland. Thepossibilities of ICA should be given special attention in the design of the plants in order tooptimize the operation costs. In addition, when renovating the existing plants, automation andcontrol should be taken into account since, e.g. manufacturers of sensors and analysers aredoing continuous development work. Advanced control strategies for nitrogen removal wouldbe beneficial to implement as well as to investigate possibilities of soft sensors and dynamicmodelling in the plant operation. The level of understanding of ICA varies among the operatorsof the Finnish WWTPs; usually at the larger plants the job description of the personnel is morespecialized and there is also more ICA knowledge in the operation team. In addition, because ofconstant development of ICA equipment and practices, the training and education of the plantoperators is important in order make better use of the ICA technology implemented at plantsand thus improve the plant operation.
In particular, the following needs have recognised as important aspect in the improvement ofthe management of WWTPs:
• Dynamic modelling and simulation of activated sludge plants has not been used atmany Finnish WWTPs so far, but in the future the popularity of modelling is likely toincrease. The process modelling and simulation is a practical and powerful tool for plantdesign, process development and optimizing control of the plant. Modelling can be usedin supporting many kinds of research projects at WWTPs and universities. ASP models,which are carefully built, calibrated and verified are suitable to be used as platforms forsimulated test runs with dynamic influent data. Moreover, use of COST/IWAbenchmark simulation models should also be considered when planning investigationson control strategies and plant run optimisation.
• Practical tools for predicting the load and wastewater characteristics (particularlyammonium load and composition of COD fractions) coming to the activated sludgebasins would help the operation of plants; thus, changes in influent flow rate could becontrolled more efficiently, aeration and dosing external carbon source would be more

____________________________________________________________________________________________
Advanced operation and control methods of municipalwastewater treatment processes in Finland
58
easily optimized. More online information of the influent wastewater would beessential in plant operation; more reliable online measurements and softsensorscombined would make also feedforward and mass flow based control strategies moreapplicable. When considering optimisation of nutrient removal, better use of onlinemeasurements for control purposes is important; furthermore, either control strategiessuccessfully applied for real scale plants in other countries could be used also in Finlandor new strategies taking local conditions into account developed.
• Developing a general architecture for fault modelling, diagnosis and isolation inbiological wastewater treatment processes would help in more fault tolerant and stableoperation of WWTPs. Typical faults in wastewater treatment plants should first beanalysed; in addition, fault detection and diagnosis methods can be applied to theprocess depending on the encountered fault types.
• Operator support and training services need to be paid attention to help operatorstake full advantage of online measurements, to run the process with a costefficientstrategy and to manage abnormal situations. Services for the training of new operatorsand updating the skills of existing operators are also required. Training services withsimulation activities will also be useful to provide for plant operators as modelling isbecoming more common in wastewater treatment and the simulators being constantlydeveloped.
• As a typical problem at Finnish WWTPs is high flow rate peaks during heavy rains andstorm waters, the condition of sewage network should be paid attention to in order toprevent unnecessary infiltration into the sewage network. Also, more integrated controlof sewage network and wastewater treatment process would help in control ofproblematic flow rate peaks and hence to be considered as a possible future researchtopic.
• Apart from progress of the recent years, development work regarding to onlinemeasurement equipment is still needed because of challenging conditions for reliablemeasurements at WWTPs. This does not only consider sensors and automatic analysersbut also sample pretreatment and filtering equipment, which need to be maintained.

____________________________________________________________________________________________
Advanced operation and control methods of municipalwastewater treatment processes in Finland
59
ReferencesAguado D., Ferrer A., Seco A., Ferrer J., 2006. Comparison of different predictive models fornutrient estimation in a sequencing batch reactor for wastewater treatment. Chemometrics andIntelligent Laboratory Systems, 84(12), 7581.
Alex J., Benedetti L., Copp J., Gernaey K.V., Jeppsson U., Nopens I., Pons M.N., Rieger L.,Rosen C., Steyer J.P., Vanrolleghem P., Winkler S., 2008. Benchmark Simulation Model No. 1(BSM1). Dept. of Industrial Electrical Engineering and Automation, Lund University.
Alvarez J., 2000. Nonlinear state estimation with robust convergence. Journal of ProcessControl, 10(1), 59–71.
Ayesa E., De la Sota A., Grau P., Sagarna J.M., Salterain A., Suescun J. 2006. Supervisorycontrol strategies for the new WWTP of GalindoBilbao: the long run from the conceptualdesign to the fullscale experimental validation. Water Science and Technology, 53(45),193201.
Baruch I.S., Georgieva P., BarreraCortes J., de Azevedo S.F., 2005. Adaptive neural networkcontrol of biological wastewater treatment. International Journal of Computational IntelligenceSystems, 20(2), 173193.
Beck M.B., Latten A. and Tong R.M. (1978). Modelling and operational control of theactivated sludge process in wastewater treatment. International Institute for Applied SystemsAnalysis (IIASA), Professional Paper PP7810.
Benazzi F., Gernaey K.V., Jeppsson U., Katebi R., 2005. Online concentration and detection ofabnormal substrate concentration in WWTPs using a software sensor: A benchmark study. InProceedings of the 2nd Conference on Instrumentation, Control and Automation (ICA2005),Busan, Korea.
Blevins T.L., McMillan G.K., Wojsznis W.K., Brown M.W. 2003. Advanced ControlUnleashed Plant Performance Management for Optimum Benefit. ISA.
Brdys M.A., Grochowski M., Gminski T., Konarczak K., Drewa M. 2008. Hierarchicalpredictive control of integrated wastewater treatment systems. Control Engineering Practice,16(6), 751767.
Camacho E.F., Bordons C. 2004. Model Predictive Control. Springer.
Cartensen J., Harremoes P., Madsen H. 1995. Statistical identification of Monodkineticparameters from online measurements. Water Science and Technology, 31(2), 125–133.
Chachuat B., Roche N., Latifi M.A. 2003. Reduction of the ASM1 model for optimal control ofsmallsize activated sludge treatment plants, Journal of water science, 16, 837858 (In French)
Cho J.H., Sung S.W., Lee I.B., 2002. Cascade control strategy for external carbon dosage inpredenitrifying process. Water science and technology, 45(45), 5360.

____________________________________________________________________________________________
Advanced operation and control methods of municipalwastewater treatment processes in Finland
60
Ciappelloni F., Mazouni D., Harmand J. and Lardon L. 2006. Online supervision and controlof an aerobic SBR process. Water Science and Technology, 53(1), 169177
Comas J., RodríguezRoda I., Gernaey K.V., Rosen C., Jeppson U., Poch M. 2008. Riskassessment modelling of microbiologyrelated solids separation problems in activated sludgeSystems. Environmental Modelling & Software, 23(1011), 12501261.
Copp J.B. (Edit.). 2002. The COST Simulation Benchmark: Description and Simulator Manual.Office for Official Publications of the European Communities, Luxembourg.
Cristea M.V., Agachi S.P. 2006. Nonlinear model predictive control of the wastewatertreatment plant. In 16th European Symposium on Computer Aided Process Engineering and 9thInternational Symposium on Process Systems Engineering. Edited by Marquardt W., Sass R.,Pantelides C., Elsevier.
David R., Vasel J.L., Wouwer A.V., 2009. Settler dynamic modeling and MATLAB simulationof the activated sludge process, Chemical Engineering Journal, 146(2), 174183
Dellana S.A., West D. 2009. Predictive modelling for wastewater applications: Linear andnonlinear approaches. Environmental Modelling & Software, 24(1), 96106.
Devisscher M., Ciacci G., Fé L., Benedetti L., Bixio D., Thoeye C., De Gueldre G., MarsiliLibelli S., Vanrolleghem P.A. 2006. Estimating costs and benefits of advanced control forwastewater treatment plants – the MAgIC methodology. Water Science and Technology,52(45), 215223.
Ekama G.A., Barnard J.L., Gunthert F.W., Krebs P., McConquodale J.A., Parker D.S.,Wahalberg E.J. 1997. Secondary settling tanks: theory, modelling, design and operation.Technical Report 6, IWA Publishing.
Ekman M., Björlenius B., Andersson M. 2006. Control of the aeration volume in an activatedsludge process using supervisory control strategies. Water Research, 40(8), 16681676.
Ellis G. 2004. Control System Design Guide A Practical Guide. Elsevier.
Flores X., Comas J., Roda I.R., Jiménez L., Gernaey K.V. 2007. Application of multivariablestatistical techniques in plantwide WWTP control strategies analysis. Water Science andTechnology, 56(7583), 7583.
FloresAlsina X., RodríguezRoda I., Sin G., Gernaey K.V. 2008. Multicriteria evaluation ofwastewater treatment plant control strategies under uncertainty. Water Research, 42(17), 44854497.
Fuente M.J., Vega P., Zarrop M.B. and Poch M. 1996. Fault detection in a real wastewater plantusing parameterestimation techniques. Control Engineering Practice, 4(8), 10891098.

____________________________________________________________________________________________
Advanced operation and control methods of municipalwastewater treatment processes in Finland
61
Garrett M.T. 1998. Instrumentation, control and automation progress in the United States in thelast 24 years. Water Science and Technology, 37(12), 2125.
Gauthier J.P., Hammouri H., Othman S. 1992. A simple observer for nonlinear systems.application to bioreactors. IEEE Transaction on Automatic Control, 37(6), 875880.
Gernaey K., Rosen C., Jeppsson U. 2006. WWTP dynamic disturbance modelling anessential module for longterm benchmarking development. Water Science and Technology,53(45), 225234.
GòmezQuintero C., Queinnec I., Babary J.P. 2000. A reduced nonlinear model of an activatedsludge process. Proceedings of International Symposium on Advanced Control on ChemicalProcesses, Pisa, Italy.
Grau P., Copp J., Vanrolleghem P.A., Takács I., Ayesa E. 2009. A comparative analysis ofdifferent approaches for integrated WWTP modelling. Water Science and Technology, 59(1),141147.
Hakanen J., Sahlstedt K., Miettinen K. 2008. Simulationbased interactive multiobjectiveoptimization in wastewater treatment. Proceedings EngOpt 2008 – International conference onengineering optimization, Rio de Janeiro, Brazil.
Henze M., Gujer W., Mino T., van Loosedrecht M. 2002. Activated Sludge Models ASM1,ASM2, ASM2d and ASM3. Scientific and Technical Reports, No. 9, IWA Publishing.
Henze M., van Loosdrecht M.C.C, Brdjanovic D., Ekama G.A. 2008. Biological WastewaterTreatment: Principles, Modelling and Design. IWA Publishing.
Ingildsen P. 2002. Realising FullScale Control in Wastewater Treatment Systems Using In SituNutrient Sensors. PhD Thesis, Department of Industrial Electrical Engineering and Automation,Lund Institute of Technology, Lund, Sweden.
Ingildsen P., Rosen C., Gernaey K.V., Nielsen M.K., Guildal T., Jacobsen B.N. 2006.Modelling and control strategy testing of biological and chemical phosphorus removal atAvedøre WWTP. Water Science and Technology, 53(45), 105113.
Isaacs S., 1996. Short horizon control strategies for automating activated sludge process. WaterScience and Technology, 34(12), 203–212.
Isermann R. 2006, Faultdiagnosis systems: an introduction from fault detection to faulttolerance. Heidelberg: Springer.
Jeppsson U. 1996. Modelling aspects of wastewater treatment processes, PhD Thesis,Department of Industrial Electrical Engineering and Automation, Lund Institute of Technology,Lund, Sweden.
Jeppsson U., Diehl S. 1996. An evaluation of a dynamic model of the secondary clarifier, WaterScience and Technology, 34 (56), 19–26.

____________________________________________________________________________________________
Advanced operation and control methods of municipalwastewater treatment processes in Finland
62
Jeppsson U. Alex J., Pons M.N., Spanjers H. and Vanrolleghem P.A., 2002. Status and futuretrends of ICA in wastewater treatment – a European perspective. Water Science andTechnology, 45(45), 485494.
Jeppsson, U. and Pons, M.N., 2004. Editorial: The COST benchmark simulation model –current state and future perspective. Control Engineering Practice, 12(3), 299–304.
Jeppsson, U., Rosen, C., Alex, J., Copp, J., Gernaey, K.V., Pons, M.N. and Vanrolleghem,P.A., 2004. Towards a benchmark simulation model for plantwide control strategyperformance evaluation of WWTPs. Proceedings 6th Int. Symposium on Systems Analysis andIntegrated Assessment in Water Management, Beijing, China.
Jeppsson U., Pons M.N., Nopens I., Alex J., Copp J.B., Gernaey K.V., Rosen C., Steyer J.P.,Vanrolleghem P.A., 2007. Benchmark simulation model No. 2: general protocol andexploratory case studies. Water Science and Technology, 56(8), 6778.
Julien S., Babary J. P., Lessard P., 1998. Theoretical and practical identifiability of a reducedorder model in an activated sludge process doing nitrification and denitrification. Water Scienceand Technology, 37(12), 309–316.
Julien S., Lessard P., Babary J. P., 1999. A reduced order model for control of a single reactoractivated sludge process. Mathematical and Computer Modelling of Dynamical Systems, 5(4),337–350.
Kabouris J. C., Georgakakos A. P., 1992. Accounting for different time scale in activatedsludge process control. Water Science and Technology, 26(56),1381–1390.
Kalman R. E., 1960. A new approach to linear filtering and prediction problems, Transactionsof the ASME–Journal of Basic Engineering, 82(Series D), 3545.
Kangas A. 2004. Operation and implementations of wastewater treatment plants. Report of theFinnish Water and Waste Water Works Association, (in Finnish).
Kim J.R., Ko J.H., Im J.H., Lee S.H., Kim S.H., Kim C.W., Park T.J. 2006. Forecasting influentflow rate and composition with occasional data for supervisory management system by timeseries model, Water Science and Technology, 54(45), 185192.
Kova Z., Bogdan S., 2006. Fuzzy controller design: theory and applications. CRC Press.
Krener A., Isidori A, 1987. Linearization by output injection and nonlinear observers. Systemsand Control Letters, 3(1), 4752.
Kynch G.J. 1952. A theory of sedimentation, Transactions of the Faraday Society. 48, 166176.
Lee C., Choi S. W. and Lee I.B. 2004. Sensor fault identification based on timelagged PCA indynamic processes, Chemometrics and Intelligent Laboratory Systems, 70(2), 165178.

____________________________________________________________________________________________
Advanced operation and control methods of municipalwastewater treatment processes in Finland
63
Lindberg C.F. 1997. Control and estimation strategies applied to the activated sludge process.PhD thesis, System and Control Group, Uppsala University, Sweden.
Lingireddy S., Brion G.M. 2005. Artificial Neural Networks in Water Supply Engineering.ASCE Publications.
MarsiliLibelli S., 1989. Modeling, identification and control of the activated sludge process.In Advances in Biochemical Engineering/Biotechnology. 38, 90–148. SpringerVerlang, Berlin.
Mulas, M. 2006. Modelling and control of activated sludge processes. PhD thesis. University ofCagliari, Italy.
Mulas M., Tronci S., Baratti R. 2007. Development of a 4Measurable States Activated SludgeProcess Model deduced from the ASM1, Proceedings of DYCOPS, Cancun, Mexico.
Nejjari F., Puig V., Giancristofaro L. and Koehler S. 2008. Extended Luenberger observedbased fault detection for an activated sludge process. Proceedings 17th IFAC WorldCongress, Seoul, Korea.
Nopens I., Batstone D.J., Copp J.B., Jeppson U., Volcke E., Alex J., Vanrolleghem P.A. 2009.An ASM/ADM model interface for dynamic plantwide simulation. Water Research, 43(7),19131923.
Olsson G., Aspegren H. and Nielsen M.K. 1998. Operation and control of wastewater treatment– a Scandinavian perspective over 20 years. Water Science and Technology, 37(12), 113.
Olsson G., Newell B. 1999. Wastewater Treatment Systems. Modelling, Diagnosis and Control.IWA Publishing.
Olsson G., Jeppsson U. 2006. Plantwide control: dream, necessity or reality? Water Scienceand Technology, 33(3), 121129.
Olsson G., Nielsen M.K., Yuan Z., LynggaardJensen A., Steyer J.P. 2005. Instrumentation,control and automation in wastewater systems. IWA Publishing.
Peng Y., Ma Y., Wang S., Wang X. 2005. Fuzzy control of nitrogen removal inpredenitrification process using ORP. Water Science and Technology, 52(12), 161169.
Phillips H.M., Sahlstedt K.E., Frank K., Bratby J., Brennan W., Rogowski S., Pier D.,Anderson W., Mulas M., Copp J.B., Shirodkar N. 2009. Wastewater treatment modelling inpractice: a collaborative discussion of the state of the art. Water Science and Technology, 59(4),695704.
Posio J. 2002. Model predicative control. Oulu University, Control engineering laboratory,Report B No 9, (In Finnish)
Qin S.J., Badgwell T.A. 2003. A Survey of Industrial Model Predictive Control Technology.Control Engineering Practice, 11(7), 733764.

____________________________________________________________________________________________
Advanced operation and control methods of municipalwastewater treatment processes in Finland
64
Pietrowski R., Brdys M.A., Konarczak K., Duzinkiewitcz K., Chotkowski W. 2008.Hierarchical dissolved oxygen control for activated sludge processes. Control EngineeringPractice, 16(1), 114131.
Puig S., van Loosdrecht M.C.M., Colprim J., Meijer S.C.F. 2008. Data evaluation of fullscalewastewater treatment plants by mass balance. Water Research, 42(18), 46454655.
Queinnec I., Dochain D. 2001, Modelling and simulation of the steadystate of secondarysettlers in wastewater treatment plants, Water Science and Technology, 43(7), 39–46.
Rodríguez J., Premier G.C., Dinsdale R., Guwy A.J. 2009. An implementation Framework forwastewater treatment models requiring a minimum programming expertise. Water Science andTechnology, 59(2), 367380.
Samuelsson P., Carlsson B. 2001. Feedforward control of the external carbon flow rate in anactivated sludge process. Water Science and Technology, 43(1), 115122.
Samuelsson P., Halvarsson B., Carlsson B. 2007. Costefficient operation of a denitrifyingactivated sludge process. Water Research, 41(11), 23252332.
Schütze M.R., Butler D., Beck M.B. 2002. Modelling, simulation and control of urbanwastewater systems. Springer.
Schütze M., Campisano A., Colas H., Schilling W., Vanrolleghem P.A., 2004. Real timecontrol of urban wastewater systems – where do we stand today? Journal of Hydrology,299(34), 335348.
Seborg D.E., Edgar T.F., Mellichamp D.A. 2003. Process Dynamics and Control, 2nd Edition,Wiley.
Shen W.H., Chen X.Q., Corriou J.P. 2008. Application of model predictive control to theBSM1 benchmark of wastewater treatment process. Computer and chemical engineering,32(12), 28492856.
Slotine J.J.E., Hedrick J.K., Misawa E.A. 1987. On sliding observers for nonlinear systems.Journal of Dynamic Systems, Measurements and Control, 109, 245252.
Smets I.Y., Haegebaert V.J., Carrette R., Van Impe J.F. 2003. Linearization of the activatedsludge model ASM1for fast and reliable prediction, Water Research, 37(8), 18311851.
Sotomayor O.A.Z., Won Park S., Garcia C. 2002. Software sensor for online estimation of themicrobial activity in activated sludge system. ISA Transaction, 41(2), 127–143.
Spèrandio M., Queinnec I. 2004. Online estimation of wastewater nitrifiable nitrogen,nitrification and denitrification rates, using ORP and DO dynamics, Water Science andTechnology, 49(1), 3139.

____________________________________________________________________________________________
Advanced operation and control methods of municipalwastewater treatment processes in Finland
65
Stare A., Vre ko D., Hvala N., Strm nik S. 2007. Comparison of control strategies for nitrogenremoval in an activated sludge process in terms of operating costs: A simulation study. WaterResearch, 41(9), 20042014.
Tchobanoglous G., Burton F.L., Stensel H.D. 2003. Wastewater engineering: treatment andreuse, Metcalf & Eddy, Published by McGrawHill Professional.
Traoré A, Grieu S., Thiery F., Polit M., Colprim J. 2006. Control of sludge height in asecondary settler using fuzzy algorithms. Computer and chemical engineering, 30(8),12351242.
Verbruggen H.B., Babuška R. 1999. Fuzzy logic control: advances in applications. WorldScientific.
Verdickt L.B., Van Impe J.F. 2002. Simulation analysis of a onedimensional sedimentationmodel, Preprints of the 15th triennial IFAC World Congress, International Federation ofAutomatic Control (CDROM), Barcelona, Spain.
Visioli A. 2006, Practical PID Control, Springer.
Vitasovic Z.Z. 1986. An integrated control strategy for the activated sludge process, Ph.D.Thesis, Rice University, Houston, TX, USA.
Yong M., Yongzhen P., Jeppson U. 2006. Dynamic evaluation of integrated control strategiesfor enhanced nitrogen removal in activated sludge processes. Control Engineering Practice,14(11),12691278.
Yong M., Yongzhen P., Shuying W. 2005. Feedforwardfeedback control of dissolved oxygenconcentration in a predenitrification system. Bioprocess and biosystems engineering Journal,27(4), 223228.
Wimberger D. and Verde C. 2008. Fault diagnosticability for an aerobic batch wastewatertreatment process. Control Engineering Practice, 16(11), 13441353.
Yoo C., Vanrolleghem P.A. and Lee I.B. 2003. Nonlinear modelling and adaptive monitoringwith fuzzy and multivariate statistical methods in biologic wastewater treatment plants. Journalof Biotechnology, 105(12), 135163.
Zhao H., Isaacs S. H., Soeberg H., Kummel M., 1995. An analysis of nitrogen removal andcontrol strategies in an alternating activated sludge process. Water Research, 29(2), 535–544.
Zhao L., Chai T. 2005. Wastewater BOD forecasting model for optimal operation using robusttimedelay neural network. In Advances in neural networks ISNN 2005 Second internationalsymposium on neural networks, Edited by Wang J., Liao X., Yi Z., Springer.
Zhu G., Peng Y., Ma B., Wang Y., Yin C. 2009. Optimization of anoxic/oxic step feedingactivated sludge process with fuzzy control model for improving nitrogen removal. ChemicalEngineering Journal, 151(13), 195201.

____________________________________________________________________________________________
Advanced operation and control methods of municipalwastewater treatment processes in Finland
66
Zumoffen D. and Basualdo M. 2008. Improvements in fault tolerant characteristics for largechemical plants: 1. Waste water treatment plant with decentralized control. Industrial andEngineering Chemistry Research, 47(15), 54645481.
Äijälä G., Lumney D. 2006. Integrated soft sensor for flow control. Water Science andTechnology, 53(45), 473482.

____________________________________________________________________________________________
Advanced operation and control methods of municipalwastewater treatment processes in Finland
67
Appendix A: Questionnaire
KYSELY JÄTEVEDENPUHDISTAMOIDEN KONTROLLIJA AUTOMAATIOJÄRJESTELMISTÄ
Teidän yhteystietonne
Nimi TehtävänimikeSähköpostiosoite (Työ)puhelinnumero
Tietoja jätevedenpuhdistamosta
Laitoksen nimi
Osoite
Paikkakunta Postinumero

____________________________________________________________________________________________
Advanced operation and control methods of municipalwastewater treatment processes in Finland
68
Sähköisesti täytetyt kyselylomakkeet voi palauttaa liitetiedostoina [email protected].
1A. Minkälaisia mittauksia, mittalaitteita tai automaattisia analysaattoreita laitoksellanneon käytössä ja mikä on niiden lukumäärä?
Mitattu muuttuja/ käytettyjatkuvatoiminenmittalaite
Mittauspisteidenlukumäärä
Mittausten sijainti Kuinka montaamittauksistakäytetäänonlineohjaukseen?
Toimivatkomittalaitteetkunnolla?
KylläEiKylläEi
Liuennut happi(DO)
KylläEiKylläEiKylläEi
Ammonium
KylläEiKylläEiNitraattiKylläEiKylläEiFosfaattiKylläEiKylläEiKylläEi
Kiintoaine
KylläEi

____________________________________________________________________________________________
Advanced operation and control methods of municipalwastewater treatment processes in Finland
69
Mitattu muuttuja /käytetty jatkuvatoiminen mittalaite
Mittauspisteidenlukumäärä
Kuinka montaamittauksistakäytetäänonlineohjaukseen?
Toimivatkomittalaitteetkunnolla?
Tulovirtaama KylläEi
Veden pinnankorkeus KylläEi
Ilmavirtaamailmastuksessa
KylläEi
Ilmanpaineilmastuksessa
KylläEi
Sameus KylläEi
Lietepatjan korkeus KylläEi
UVabsorptio KylläEi
COD KylläEi
BOD KylläEi
Respirometri KylläEi
pH KylläEi
Redoxpotentiaali KylläEi
Johtokyky KylläEi
Metaani KylläEi
Lämpötila KylläEi
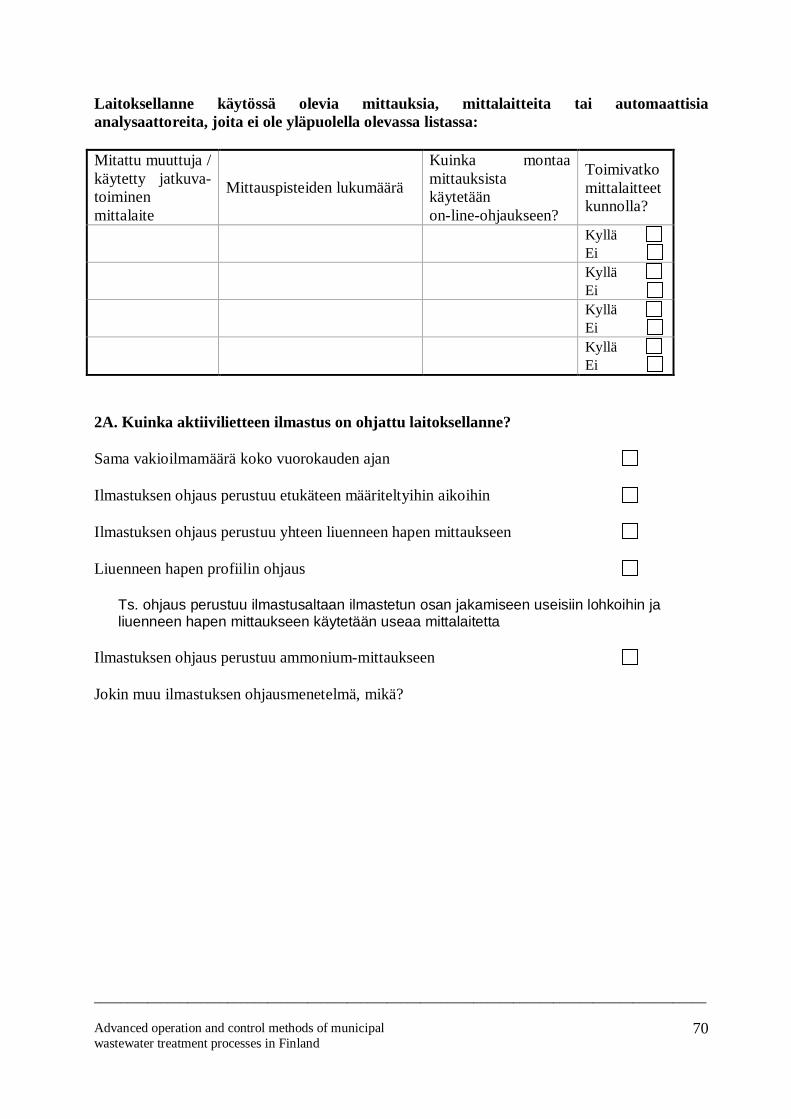
____________________________________________________________________________________________
Advanced operation and control methods of municipalwastewater treatment processes in Finland
70
Laitoksellanne käytössä olevia mittauksia, mittalaitteita tai automaattisiaanalysaattoreita, joita ei ole yläpuolella olevassa listassa:
Mitattu muuttuja /käytetty jatkuvatoiminenmittalaite
Mittauspisteiden lukumäärä
Kuinka montaamittauksistakäytetäänonlineohjaukseen?
Toimivatkomittalaitteetkunnolla?
KylläEiKylläEiKylläEiKylläEi
2A. Kuinka aktiivilietteen ilmastus on ohjattu laitoksellanne?
Sama vakioilmamäärä koko vuorokauden ajan
Ilmastuksen ohjaus perustuu etukäteen määriteltyihin aikoihin
Ilmastuksen ohjaus perustuu yhteen liuenneen hapen mittaukseen
Liuenneen hapen profiilin ohjaus
Ts. ohjaus perustuu ilmastusaltaan ilmastetun osan jakamiseen useisiin lohkoihin jaliuenneen hapen mittaukseen käytetään useaa mittalaitetta
Ilmastuksen ohjaus perustuu ammoniummittaukseen
Jokin muu ilmastuksen ohjausmenetelmä, mikä?

____________________________________________________________________________________________
Advanced operation and control methods of municipalwastewater treatment processes in Finland
71
3A. Listaus laitoksen tärkeimmistä ohjauksista
Ohjaus Ohjauksen laatu Onko ohjauksenvaihtelualue sopiva?
Toimiikoohjauskunnolla?
Tulopumppaus On/offohjaus
Jatkuva ohjaus
Alue on sopiva
Alue on liian laaja
Alue on liian kapea
Vaihtelualue on väärä
Kyllä
Ei
Palautuslietteen
pumppaus
On/offohjaus
Jatkuva ohjaus
Alue on sopiva
Alue on liian laaja
Alue on liian kapea
Vaihtelualue on väärä
Kyllä
Ei
Ylijäämälietteen
pumppaus
On/offohjaus
Jatkuva ohjaus
Alue on sopiva
Alue on liian laaja
Alue on liian kapea
Vaihtelualue on väärä
Kyllä
Ei
Ilmastus,
säätöventtiilit
On/offohjaus
Jatkuva ohjaus
Alue on sopiva
Alue on liian laaja
Alue on liian kapea
Vaihtelualue on väärä
Kyllä
Ei
Ilmastus,
kompressorit
On/offohjaus
Jatkuva ohjaus
Alue on sopiva
Alue on liian laaja
Alue on liian kapea
Vaihtelualue on väärä
Kyllä
Ei
Saostuskemikaalin
(esim. ferro) syöttö
On/offohjaus
Jatkuva ohjaus
Alue on sopiva
Alue on liian laaja
Alue on liian kapea
Vaihtelualue on väärä
Kyllä
Ei

____________________________________________________________________________________________
Advanced operation and control methods of municipalwastewater treatment processes in Finland
72
Ohjaus Ohjauksen laatuOnko ohjauksen
vaihtelualue sopiva?
Toimiiko
ohjaus
kunnolla?
Alkalointikemikaalin
syöttö
On/offohjaus
Jatkuva ohjaus
Alue on sopiva
Alue on liian laaja
Alue on liian kapea
Vaihtelualue on väärä
Kyllä
Ei
Muuta, mitä? On/offohjaus
Jatkuva ohjaus
Alue on sopiva
Alue on liian laaja
Alue on liian kapea
Vaihtelualue on väärä
Kyllä
Ei
Muuta, mitä? On/offohjaus
Jatkuva ohjaus
Alue on sopiva
Alue on liian laaja
Alue on liian kapea
Vaihtelualue on väärä
Kyllä
Ei
4A. Kuinka monta kehittynyttä säädintä laitoksellanne on käytössä?
Kokonaismäärä:
Minkälaisia kehittyneitä säätimiä laitoksellanne on ja missä ohjauksessa niitä käytetään?
Kehittyneillä säätimillä tarkoitetaan PIDsäädintä kehittyneempää menetelmää,esim. adaptiivista säätöä, sumeaa säätöä tai malleihin perustuvaa säätöä.
5A. Onko laitoksellanne käytössä automaatiota, joka reagoi poikkeuksellisiin tilanteisiintai joilla ennustetaan sellaisia? Minkälaisia?
6A. Onko laitoksellanne käytetty prosessimallinnusta?
Kyllä Ei
Onko laitoksellanne omaa mallinnusohjelmaa?

____________________________________________________________________________________________
Advanced operation and control methods of municipalwastewater treatment processes in Finland
73
Kyllä Mikä ohjelma?
Ei
Käytättekö mallinnusta apuna laitoksenne ohjauksessa?
Kyllä Ei
Mihin muihin tarkoituksiin olette käyttäneet mallinnusta?Mikäli laitoksellanne ei toistaiseksi ole käytetty mallinnusta, oletteko harkinneet sen käyttöä?
Kyllä, mallinnusta
Kyllä, mallinnusta ja oman ohjelman hankintaa
Ei

____________________________________________________________________________________________
Advanced operation and control methods of municipalwastewater treatment processes in Finland
74
Mielipiteenne
7A. Missä mielestänne on paras mahdollisuus parantaa laitoksenne suorituskykyä liittyeninstrumentaatioon, ohjaukseen ja automaatioon?
8A. Minkälaisena arvioisitte nykyisen instrumentaation ja ohjausjärjestelmän käytönlaitoksellanne?
Niistä olisi mahdollista hyötyä paljon enemmän
Niistä olisi mahdollista hyötyä enemmän
Niistä olisi luultavasti mahdollista hyötyä enemmän
Niistä ei pystytä hyötymään enempää
9A. Minkä arvioitte tärkeimmäksi pullonkaulaksi laitoksenne toiminnan parantamisessa?
10A. Minkä arvioitte suurimmaksi uhaksi tulevaisuudessa laitoksenne toiminnalle?
11A. Mitä mieltä olette tästä väittämästä? ”Instrumentaatio, ohjaus ja automaatio tulevatolemaan jätevedenpuhdistamoilla entistä tärkeämpiä lähitulevaisuudessa.”
Täysin samaa mieltä
Jokseenkin samaa mieltä
En osaa sanoa
Jokseenkin eri mieltä
Täysin eri mieltä
12A. Onko laitoksellenne asennettu uutta ohjaus tai säätötekniikkaa viimeisen viidenvuoden aikana?
Kyllä Ei

____________________________________________________________________________________________
Advanced operation and control methods of municipalwastewater treatment processes in Finland
75
Mikäli vastaus edelliseen kysymykseen on myönteinen, mitä parannuksia laitoksellanneon saavutettu uuden ohjaus tai säätötekniikan ansiosta?
Kommentteja tästä kyselylomakkeesta tai siinä olevista kysymyksistä:

____________________________________________________________________________________________
Advanced operation and control methods of municipalwastewater treatment processes in Finland
76
KYSELY JÄTEVEDENPUHDISTAMOIDENKOKOONPANOSTA JA TOIMINNASTA
Teidän yhteystietonne
Nimi TehtävänimikeSähköpostiosoite (Työ)puhelinnumero
Tietoja jätevedenpuhdistamosta
Laitoksen nimi
Osoite
Paikkakunta Postinumero

____________________________________________________________________________________________
Advanced operation and control methods of municipalwastewater treatment processes in Finland
77
Laitoksen tyyppi ja operointi
Sähköisesti täytetyt kyselylomakkeet voi palauttaa liitetiedostoina [email protected].
Jotta erilaisten puhdistamoiden ohjauksesta ja automaatiosta saataisiin edustava otosjohtopäätösten tekemiseen, pyytäisimme teitä vastaamaan seuraaviin kysymyksiin koko vuodentilastotietojen pohjalta. Olkaa hyvä ja valitkaa vuosi 2006 tai 2007 .
Mikäli joihinkin kysymyksiin löytyy vastaukset lähettämistänne vuosiraporteista taikyselylomakkeen liitteenä olevasta laitoksenne virtauskaaviosta*, voitte viitata niihin sen sijaan,että vastaatte kysymyksiin erikseen lomakkeeseen.
* Ari Kangas 2004. Jätevedenpuhdistamojen toiminta ja toteutukset, Vesi ja viemärilaitosyhdistyksen monistesarja Nro 15, 12 s.
1B. Mistä vuodesta lähtien laitoksenne on ollut käytössä?
Laitos on ollut käytössä vuodesta
2B. Mikäli laitostanne on saneerattu sen käyttöön oton jälkeen, milloin se on viimeksitapahtunut? Mitkä ovat viimeisimmät merkittävät saneeraustoimenpiteet, mahdollisetautomaation uudistukset sekä syyt niihin?
Laitosta on viimeksi saneerattu vuonna
Viimeisimmät merkittävät saneeraustoimenpiteet:
Automaation uudistukset:
Syyt saneeraukseen:
3B. Kuinka suuri osuus laitoksenne nykyisestä virtaamasta ja kuormasta (esim. BOD7 taiN) on teollisuusjätevesiä?
Teollisuusjäteveden osuus % virtaamasta
Teollisuusjäteveden osuus % kuormasta

____________________________________________________________________________________________
Advanced operation and control methods of municipalwastewater treatment processes in Finland
78
4B. Mikä on jäteveden keskimääräinen lämpötila?
Keskimääräinen jäteveden lämpötila on °C
Jäteveden lämpötila on yli 12 °C kk vuodesta
Jäteveden minimilämpötila ko. vuotena oli °C
5B. Kuinka suuren osan ajasta laitoksellanne on henkilökuntaa paikalla?
Viitenä päivänä viikossa ainoastaan päivisin
Seitsemänä päivänä viikossa ainoastaan päivisin
Seitsemänä päivänä viikossa sekä öisin että päivisin
Miehittämätön laitos
Joku muu vaihtoehto tuntia viikossa
6B. Kuinka paljon henkilökuntaa laitoksellanne työskentelee?
Täysiaikaisten työntekijöiden lukumäärä
Osaaikaisten työntekijöiden lukumäärä
7B. Mikä on laitoksenne vuosittainen sähkönkulutus?
Kokonaiskulutus kWh/vuosi
Mitä ilmoittamaanne kokonaiskulutukseen on sisällytetty?
Mikäli laitoksellanne on mitattu käsittelyprosessin eri osien sähkönkulutus, olkaa hyvä javastatkaa myös alla oleviin kysymyksiin.
Esikäsittelyn kulutus kWh/vuosi(Kokonaiskulutus ennen vesiprosessin biologista osaa)
Biologisen osan kulutus kWh/vuosi
Ilmastuksen osuus % biologisen osan kulutuksesta
Lietteen käsittelyn kulutus kWh/vuosi
Kuinka paljon sähköä tuotetaan? kWh/vuosi

____________________________________________________________________________________________
Advanced operation and control methods of municipalwastewater treatment processes in Finland
79
8B. Kuinka paljon laitoksellanne käytetään kemikaaleja vuosittain? (Saostuskemikaali,alkalointikemikaali ja ulkopuolisena hiililähteenä käytetty kemikaali)
Käyttämänne saostuskemikaali:
Saostuskemikaalin vuotuinen kulutus tonnia / vuosi
Saostuskemikaalin annostelupisteet:
Käyttämänne alkalointikemikaali:
Alkalointikemikaalin vuotuinen kulutus: tonnia / vuosi
Mikäli laitoksellanne käytetään ulkopuolista hiililähdettä (esim. metanoli) denitrifikaation ja/taibiologisen fosforinpoiston tehostamiseen, vastatkaa myös kysymyksiin alla.
Käyttämänne ulkopuolinen hiililähde:
Vuosittainen kulutus tonnia / vuosi
Hiililähteen annostelupisteet:
9B. Biologisen prosessin ajo
Mikä on biologisen prosessin keskimääräinen lieteikä?
Talvella d
Kesällä d
Mikä on biologisen prosessin pääasiallinen ajotapa?
Prosessia ajetaan tavoitelieteiän mukaan
Prosessia ajetaan tavoitelietepitoisuuden mukaan ja lieteikää lasketaan kontrolliksi
Jokin muu ajotapa, mikä?

____________________________________________________________________________________________
Advanced operation and control methods of municipalwastewater treatment processes in Finland
80
Miten ilmastettujen lohkojen määrä määräytyy? (Vastataan vain, jos laitoksella ajetaankokonaistypenpoistoa.)
Henkilökunta asettaa manuaalisesti
Automaattisesti kelloohjauksella
Automaattisesti ammoniumtyppimittauksen perusteella
Jokin muu tapa, mikä?
10B. Täyttyivätkö laitoksenne lupaehdot kyseisenä vuotena?
Kyllä Ei
Mikäli lupaehdot eivät ole täyttyneet, minkä suureen osalta ja minä ajanjaksona näin eiole tapahtunut?
11B. Kuinka usein jätevettä ohitettiin kyseisenä vuotena?
Pelkästään puhdistamon biologinen osa ohitettiin
määrä vuoden aikana
Koko käsittelyprosessi ohitettiin
määrä vuoden aikana
12B. Jos jätevedenpuhdistamollanne on jotain poikkeuksellisia piirteitä, olkaa hyvä jakuvailkaa niitä.
Epätavallisen suuria vaihteluita käsiteltävän jäteveden laadussa tai virtaamassa:
Poikkeuksellisia teollisuusjätevesiä:
Epätavallista prosessitekniikkaa:
Poikkeuksellisia lupaehtoja:
Jotain muuta, mitä?

____________________________________________________________________________________________
Advanced operation and control methods of municipalwastewater treatment processes in Finland
81
13B. Minkä tyyppinen käsittelyprosessinne on typenpoiston osalta?
Esidenitrifikaatio
Samanaikainen nitrifikaatio / denitrifikaatio
Jälkidenitrifikaatio
Vaiheittainen nitrifikaatio / denitrifikaatio
Pelkkä nitrifikaatio
Joku muu, olkaa hyvä ja tarkentakaa:
14B. Kuinka suurta virtaamaa laitoksenne on suunniteltu käsittelemään?
Keskimääräinen mitoitusvirtaama m3/vrk
Maksimimitoitusvirtaama m3/tunti
15B. Kuinka suuri on laitoksenne nykyinen toteutunut virtaama?
Nykyinen keskivirtaama m3/vrk
16B. Kyselylomakkeen liitteenä on laitoksenne prosessikaavio allastilavuuksineen jakemikaalien annostelupisteineen vuodelta 2003. Onko prosessinne edelleen samanlainenja reaktoritilavuudet samat?
Kyllä
Ei Mitä muutoksia nykyisessä prosessissanne on liitteenä olevaan prosessikaavioonverrattuna?

____________________________________________________________________________________________
Advanced operation and control methods of municipalwastewater treatment processes in Finland
82
17B. Kuinka suuria biologisten reaktoreiden (sisältäen aerobisen, anoksisen jaanaerobisen tilavuuden), selkeytysyksiköiden sekä mahdollisen tasausaltaan tilavuudetja käsittelylinjojen lukumäärät ovat? Jos laitoksellanne on käytössä jokinjälkikäsittely, olkaa hyvä ja kuvailkaa kyseistä käsittelyprosessia.
Aktiiviliete linjaa m3
Esiselkeytys linjaa m3
Jälkiselkeytys linjaa m3
Tasausallas m3
Jälkikäsittely, mikä?
18B. Mitä aineita laitoksen on suunniteltu poistavan orgaanisen aineen ja fosforin
lisäksi? (Rastittakaa kaikki sopivat vaihtoehdot)
Ammoniumtyppi (mutta ei nitraattityppeä)
Kokonaistyppi (sekä ammonium että nitraattityppi)
Fosfori (biologinen käsittely)
19B. Kuinka paljon laitoksellanne syntyy lietettä?
Kokonaispaino tonnia / vuosi
Lietteen kuivaainepitoisuus %

____________________________________________________________________________________________
Advanced operation and control methods of municipalwastewater treatment processes in Finland
83
Appendix B. Key figures of the WWTP surveyMedian Average Min Max
Design flow rate, m3/d 21 500 38 300 2 500 260 000
Max. Design flow rate, m3/h 1 550 2 980 630 25 000
Current flow rate, m3/d 13 250 29 200 2 150 260 000
Current flow rate / design flow rate, % 68 69 35 105
Sludge age during winter, total N or NH4N removal, d 14.5 15.0 6.0 30.0
Sludge age during summer, total N or NH4N removal, d 9.5 10.8 5.0 20.0
Sludge age during winter, only organic matter removal, d 5.0 8.6 3.0 20.0
Sludge age during summer, only organic matter removal, d 3.5 5.4 2.0 10.0
Average temperature of wastewater, °C 12.3 12.3 8.7 16.0
Min. temperature of wastewater, °C 7.0 6.8 3.3 10.1
Temperature of wastewater above 12°C, months per year 6.0 6.2 1.5 11.0
Share of industrial wastewater of the flow rate, % 10.0 10.5 0 30.0
Share of industrial wastewater of the load, % 15.5 19.8 0 60.0
Influent COD / total N 11.0 11.9 8.9 18.4
Sludge production, kg TS/kg BOD7 1.10 1.19 0.54 2.48
Dry solids content of sludge, % 23.6 23.5 6.0 32.0
Energy consumption / influent flow rate, kWh/m3 0.47 0.51 0.17 1.00
Setpoint of dissolved oxygen concentration in aeration, mg/l 2.5 2.6 2.0 3.1
Number of fulltime employees 6 9.8 2 50