Embed Size (px)
Citation preview

ADVANCE -post trial ObservatioNal Study
Key results
“Hot Topics in Diabetes” 50th EASD, Vienna 2014
BP Arm
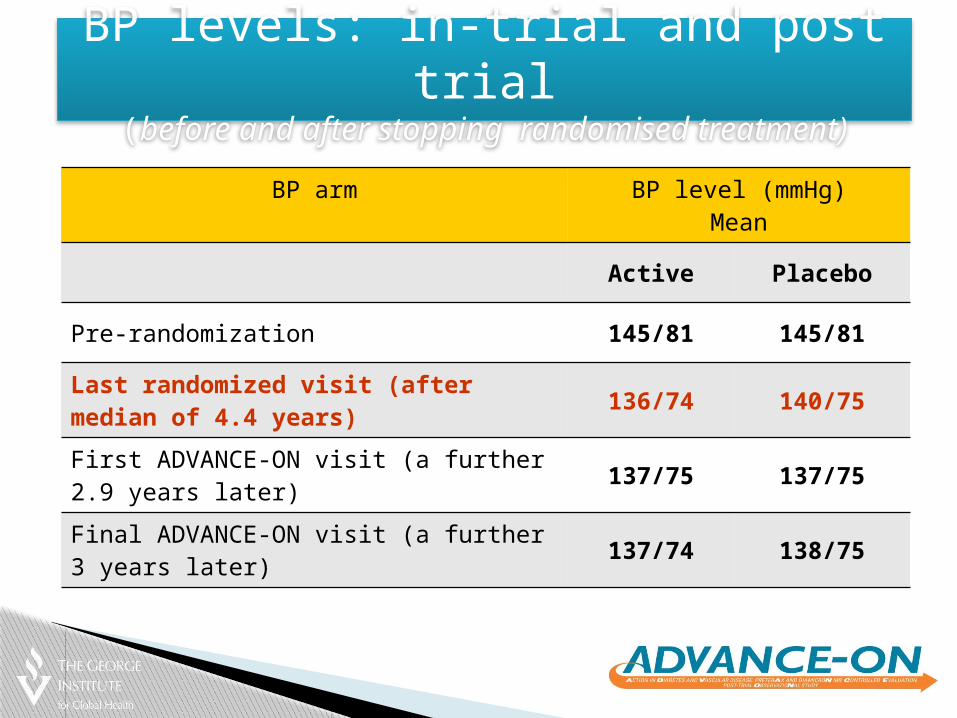
BP levels: in-trial and post trial(before and after stopping randomised treatment)
BP arm BP level (mmHg)Mean
Active Placebo
Pre-randomization 145/81 145/81
Last randomized visit (after median of 4.4 years) 136/74 140/75
First ADVANCE-ON visit (a further 2.9 years later) 137/75 137/75
Final ADVANCE-ON visit (a further 3 years later) 137/74 138/75

Mortality(Overall follow-up: median of 9.9 years)

Major Macrovascular Events (Overall Follow-up: median of 9.9 years)

Hazard ratio0.5
ard1.0 2.0
Age (years) < 65 260 (11.6%) 266 (11.7%) 0.96 (0.81, 1.14 )
≥ 65 832 (25.1%) 907 (27.5%) 0.90 (0.82, 0.98 )
Sex Male 735 (22.9%) 785 (24.5%) 0.92 (0.83, 1.02 )
Female 357 (15.1%) 388 (16.4%) 0.90 (0.78, 1.04 )
Asia Asian 345 (16.7%) 375 (18.2%) 0.91 (0.78, 1.05 )
non Asian 747 (21.3%) 798 (22.8%) 0.91 (0.83, 1.01 )
SBP (mmHg) < 140 411 (17.5%) 419 (17.8%) 0.97 (0 .85, 1.11)
≥ 140 681 (21.2%) 753 (23.4%) 0.88 (0.79, 0.97 )
HbA1c (%) < 7.2 454 (17.2%) 518 (19.1%) 0.89 (0.78, 1.01 )
≥ 7.2 634 (21.9%) 650 (22.9%) 0.93 (0.83, 1.04 )
Glucose control strategy Standard 542 (19.5%) 584 (21.0%) 0.90 (0.80, 1.01 )
Intensive 550 (19.8%) 589 (21.1%) 0.92 (0.82, 1.04 )
All participants 1092(19.6%) 1173(21.1%) 0.91 (0.84, 0.99)
Number (%) of patients who diede (%)( )Active
e tsPlacebo
(n=5569) (n=5571) HR (95% CI)Favours
Effects by Subgroups (all cause mortality: overall follow-up: 9.9 years)
P heterogeneity > 0.2 for all

Effects on Mortality (by calendar year)
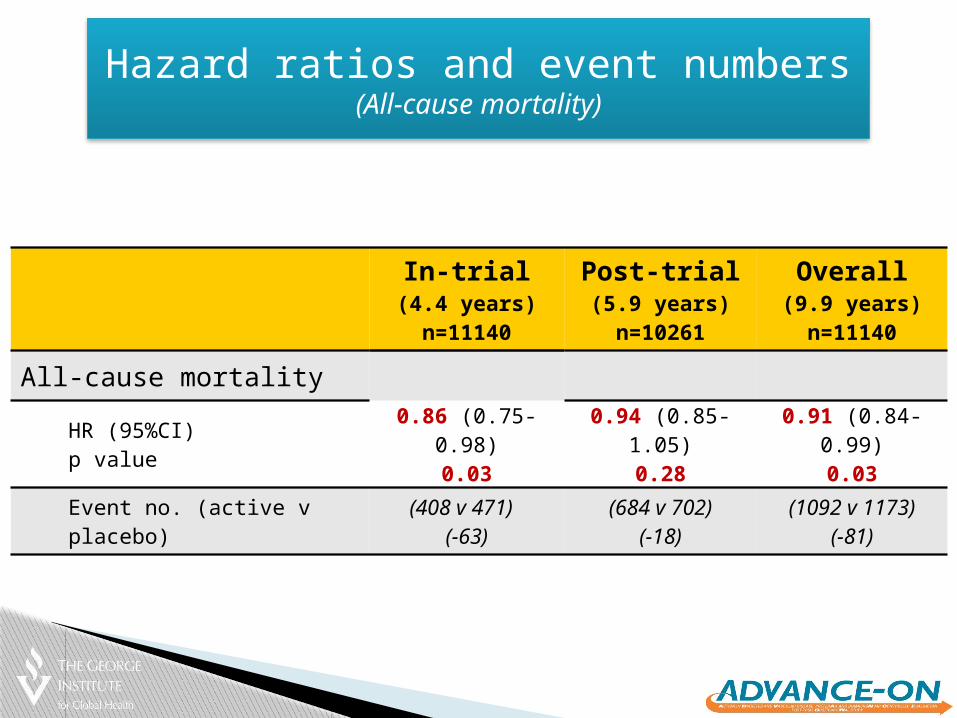
Hazard ratios and event numbers(All-cause mortality)
In-trial(4.4 years)n=11140
Post-trial(5.9 years)n=10261
Overall(9.9 years)n=11140
All-cause mortalityHR (95%CI)p value
0.86 (0.75-0.98)0.03
0.94 (0.85-1.05)0.28
0.91 (0.84-0.99)0.03
Event no. (active v placebo) (408 v 471) (-63)
(684 v 702)(-18)
(1092 v 1173)(-81)

Glucose arm

Glucose arm HbA1c level (%)Mean±SD
Standard Intensive
Pre-randomisation 7.5±1.5 7.5±1.6
Last randomised visit 7.2±1.1 6.5±0.8
First ADVANCE-ON visit 7.3±1.3 7.3±1.4
Final ADVANCE-ON visit 7.4±1.3 7.2±1.2
HbA1c levels
Any effect observed during ADVANCE-ON is attributable to the glycaemic difference achieved during ADVANCE
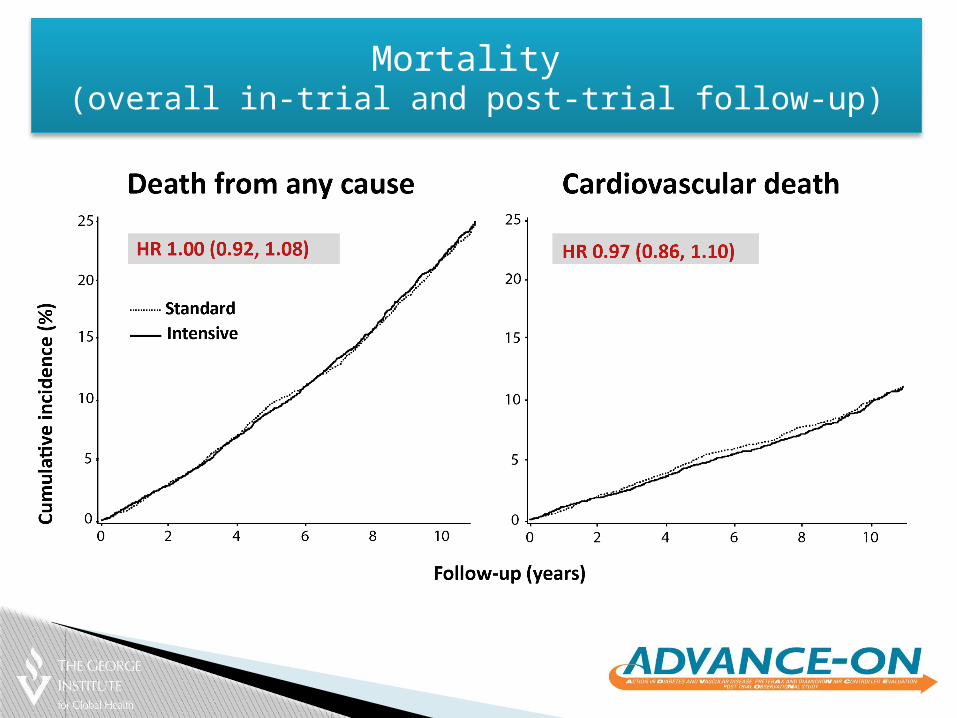
Mortality (overall in-trial and post-trial follow-up)

Major Vascular events (overall in-trial and post-trial follow-up)

Microvascular events (overall in-trial and post-trial follow-up)
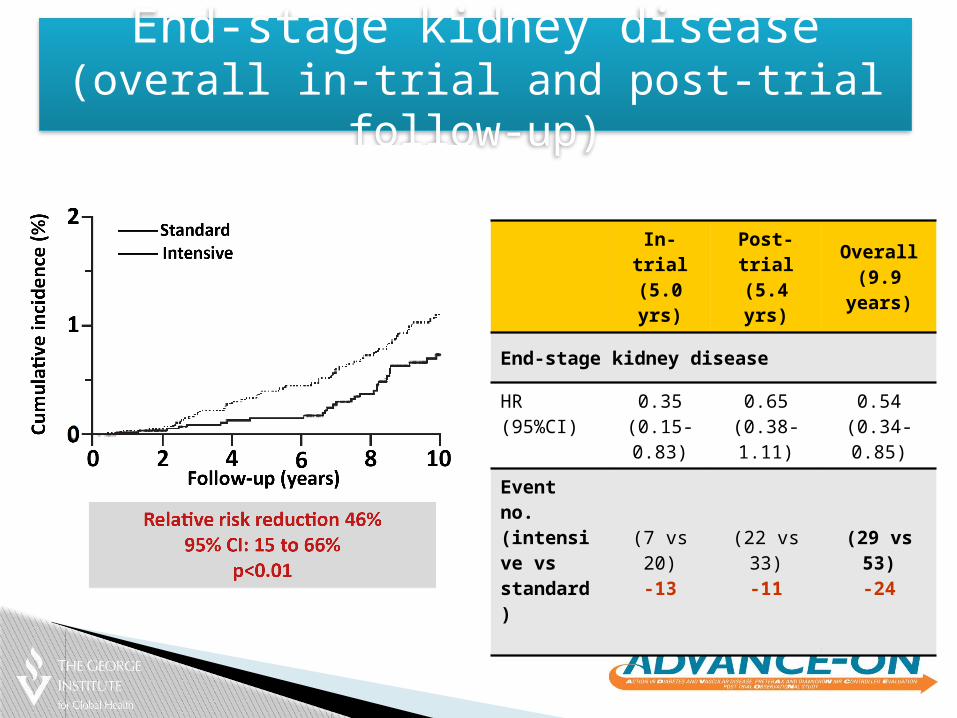
End-stage kidney disease(overall in-trial and post-trial follow-up)
In-trial(5.0 yrs)
Post-trial(5.4 yrs)
Overall(9.9 years)
End-stage kidney disease
HR (95%CI) 0.35 (0.15-0.83)
0.65 (0.38-1.11)
0.54 (0.34-0.85)
Event no. (intensive vs standard)
(7 vs 20)-13
(22 vs 33)-11
(29 vs 53)-24

Effects on Mortality by calendar year

Effects on Vascular Events by calendar year

Effects on Microvascular events by calendar year
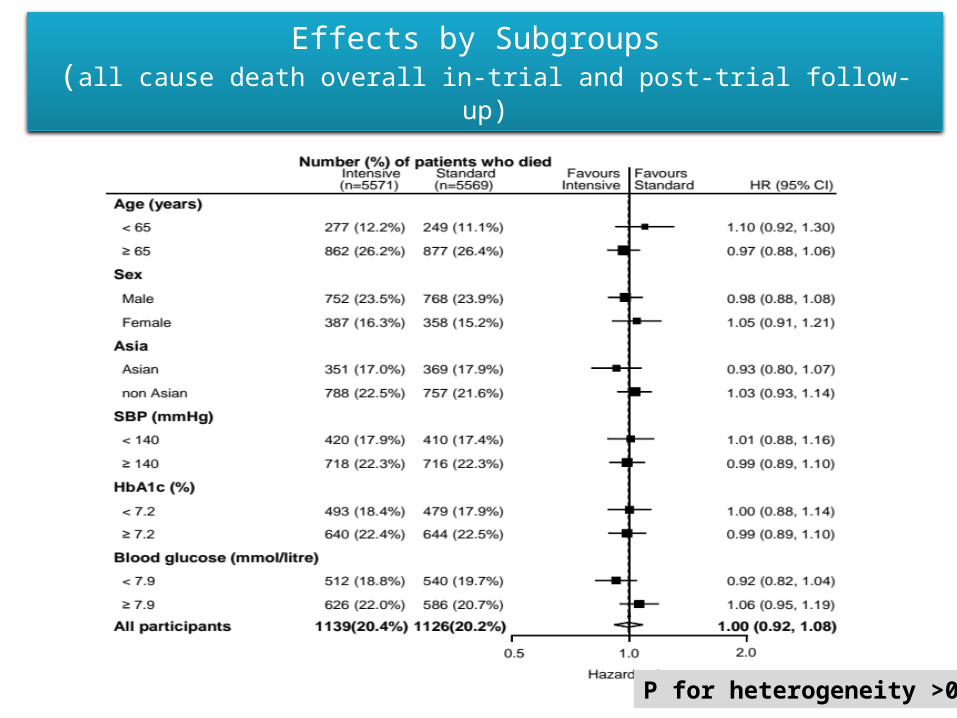
Effects by Subgroups (all cause death overall in-trial and post-trial follow-up)
P for heterogeneity >0.1

ADVANCE -post trial ObservatioNal Study
Key results
“Hot Topics in Diabetes” 50th EASD, Vienna 2014