Embed Size (px)
Citation preview

Institutionen för klinisk och experimentell medicin
Examensarbete/magisteruppsats i logopedi, 30 hp
Vårterminen 2015
Adults’ Attitudes towards Children with Unintelligible Speech Related to Cleft Palate
Kajsa Skytt
Supervisor:
Alice Lee
Abstract
A person’s speech and voice have a big impact on how the person is perceived by others.
Individuals with unintelligible speech and/or an atypical voice are often judged in more
negative terms regarding personal, physical, physiological and social traits compared to peers
with typical speech. Only few studies have considered public attitudes towards children and
adults with cleft lip and/or palate (CLP).
Also, numerous studies have investigated whether it is possible to modify a listener’s
judgements of a speaker with atypical speech or voice. Some studies have shown that the
intervention group that somehow receives information/education about the impairment actually
rates the speakers in more positive terms than the control group. However, other studies have
shown that receiving information does not change the listener’s perception of the speaker.
This study aims at investigating adults’ attitudes towards cleft palate child speakers to see if
there is (1) a correlation between the ratings made by the adult listeners and the level of the
child’s speech intelligibility, and (2) if receiving information about cleft palate – as well as the
speech difficulties associated with it – has an effect on ratings made by adult listeners. Adult
listeners (N=30, control group n=15, experimental group n=15) listened to 30 speech samples;
three speech samples from ten different children, with more or less unintelligible speech due to
a repaired cleft palate. The adults graded how they perceived the children using a seven point
differential scale with eight different adjective pairs describing different personal, physical,
psychological and social attributes.
The overall findings in this study indicate that children with unintelligible speech due to CLP
are perceived in more negative terms than their peers with typical speech in terms of personal,
social, psychological and physical traits. Although, it seems unintelligibility itself is not the
main issue as to how a listener perceives children, with or without cleft palate (even though it
might be an influence). Receiving information about cleft palate could not be concluded to
improve the listeners’ perception of children with unintelligible speech. The group that received
information about cleft lip and palate actually perceived the children in more negative terms for
the personal trait “Nice/Mean” compared to the group that did not receive such information.
However, this study is based upon a limited number of participants (n=30) which should be
considered when evaluating the results.

Copyright
The publishers will keep this document online on the Internet – or its possible replacement –
from the date of publication barring exceptional circumstances.
The online availability of the document implies permanent permission for anyone to read, to
download, or to print out single copies for his/hers own use and to use it unchanged for non-
commercial research and educational purpose. Subsequent transfers of copyright cannot revoke
this permission. All other uses of the document are conditional upon the consent of the
copyright owner. The publisher has taken technical and administrative measures to assure
authenticity, security and accessibility.
According to intellectual property law the author has the right to be mentioned when his/her
work is accessed as described above and to be protected against infringement.
For additional information about the Linköping University Electronic Press and its procedures
for publication and for assurance of document integrity, please refer to its www home page:
http://www.ep.liu.se/.
Upphovsrätt
Detta dokument hålls tillgängligt på Internet – eller dess framtida ersättare –från
publiceringsdatum under förutsättning att inga extraordinära omständigheter uppstår.
Tillgång till dokumentet innebär tillstånd för var och en att läsa, ladda ner, skriva ut enstaka
kopior för enskilt bruk och att använda det oförändrat för ickekommersiell forskning och för
undervisning. Överföring av upphovsrätten vid en senare tidpunkt kan inte upphäva detta
tillstånd. All annan användning av dokumentet kräver upphovsmannens medgivande. För att
garantera äktheten, säkerheten och tillgängligheten finns lösningar av teknisk och administrativ
art.
Upphovsmannens ideella rätt innefattar rätt att bli nämnd som upphovsman i den omfattning
som god sed kräver vid användning av dokumentet på ovan beskrivna sätt samt skydd mot att
dokumentet ändras eller presenteras i sådan form eller i sådant sammanhang som är kränkande
för upphovsmannens litterära eller konstnärliga anseende eller egenart.
För ytterligare information om Linköping University Electronic Press se förlagets hemsida
http://www.ep.liu.se/
© Kajsa Skytt

Acknowledgements
This thesis is made as a completion of the speech and language therapy course at Linköping
University, Sweden. The thesis was conducted at University College Cork (UCC), Ireland, as a
part of a research project lead by Dr Alice Lee and Prof Fiona Gibbon.
Several persons have contributed academically, practically and with support to this thesis. First,
I would like to thank my supervisor Dr Alice Lee at UCC for her time and brilliant supervision
throughout my semester at UCC. Furthermore I would like to thank Inger Lundeborg
Hammarström, Linköping University, and Prof Fiona Gibbon, UCC, for valuable input and
support.
I would also like to thank all staff at the UCC Speech and Hearing Department for a warm
welcome and a very pleasant stay in UCC, and Torbjörn Skytt for proof reading and valuable
input.
I would like to give a special thanks to all participants that took part in the study and to all of
you that helped me with the recruiting process. Without you this research would not have been
possible.
Finally, I would like to thank my family and friends for being helpful and supportive during my
time at Linköping University and UCC.
Cork, May 2015
Kajsa Skytt

Table of Contents 1 Introduction .......................................................................................................................................... 1
2 Background .......................................................................................................................................... 2
2.1 Cleft Lip and/or Palate .............................................................................................................. 2
2.2 Characteristics of Cleft Palate Speech ...................................................................................... 5
2.3 Measuring Judgements towards Individuals with Voice Disorders .......................................... 7
2.4 Judgements towards Individuals with Voice and Speech Disorders ........................................ 8
2.4.1 Changing Listeners’ Attitudes toward Voice and Speech Disorders ................................... 10
2.4.2 Judgements towards Individuals with Unintelligible Speech Related to Cleft Lip and/or
Palate ............................................................................................................................................ 11
3 Purpose ............................................................................................................................................... 11
3.1 Questions at issue ................................................................................................................... 12
4 Method ............................................................................................................................................... 12
4.1 Participants ............................................................................................................................. 12
4.2 Speech samples ....................................................................................................................... 12
4.3 Test procedure ........................................................................................................................ 14
4.4 Ethical considerations ............................................................................................................. 16
4.5 Statistical analysis ................................................................................................................... 16
5 Results ................................................................................................................................................ 17
5.1 Correlation between Speaker Intelligibility and Listeners’ Perception .................................. 17
5.2 Differences in Judgements between the Children with Typical Speech and the Children with
Cleft Palate ................................................................................................................................... 26
5.3 Comparisons between the Experimental Group and the Control Group ................................ 27
6 Discussion .......................................................................................................................................... 29
6.1 Results .................................................................................................................................... 29
6.2 Limitations of the Present Study ............................................................................................. 32
6.4 Conclusions ............................................................................................................................ 34
6.5 Future research........................................................................................................................ 35
References ............................................................................................................................................. 37
Appendix A ........................................................................................................................................... 44
Appendix B ........................................................................................................................................... 52
Appendix C ........................................................................................................................................... 53
Appendix D ........................................................................................................................................... 54
Appendix E ............................................................................................................................................ 55
Appendix F ............................................................................................................................................ 56

1
1 Introduction
Attitudes towards individuals with speech and voice problems are pre-eminently relevant to the
speech and language therapist’s work, since these attitudes clearly will affect both the patient
and the patient’s family and surroundings. Therefore, this will also affect the intervention and
the therapeutic process. Different people tend to make similar judgements towards a speaker’s
psychological, physical and social attributes, even though these judgements rarely are based on
empirical facts (Aronovitch, 1989). Previous studies have shown that people with speech and
voice disorders are often judged in more negative terms than people with normal voice and
speech (Lallh & Rochet, 2000; Lass, Ruscello, Harkins & Blankenship, 1993; Ma & Yu, 2013).
A number of studies have investigated whether it is possible to modify such negative
judgements. Some studies have suggested that informing listeners about speech or voice
disorders results in a more accepting attitude towards the speaker. Some studies have found that
listeners’ attitudes towards individuals with communication disorders because of other
disabilities are improved by information given and discussion about the disability (Ibrahim and
Herr, 1982). Similar results were found in a study by Gilmore (1974), where esophageal
speakers were significantly more accepted by listeners who received information about the
disorder compared to listeners who did not receive information. However, other studies indicate
that the receiving of information does not change a listener’s perception of a speaker with a
speech or voice disorder (Lallh, 1997; Lallh and Rochet, 2000).
Studies have mainly focused on disorders such as stuttering, dysphonia and dysarthria. Some
studies have also investigated listener’s attitudes toward hypernasal speech. The correlation
between listeners’ attitudes and unintelligible speech related to cleft palate has not been studied
very much. However, recently a study was conducted by Lee, Spivey and Gibbon (2014) about
children and their attitudes towards peers with unintelligible speech related to cleft palate. The
results of this study show that unintelligible children are more likely to be perceived and judged
in more negative terms compared to children with typical speech. The study presented in this
paper aims at a similar investigation, based upon the same speech recordings as those used by
Lee et al, but now with adult listeners. The results of the study will show whether children with
cleft palate (CP) encounter negative attitudes among adults as well or if such attitudes mainly
arise among their peers.
In addition, the study here presented aims at investigating the possibility of modifying a
listener’s judgement by giving information about the speech impairment. No previous

2
investigations have been found to include speakers with cleft lip and/or palate, how they are
perceived, and if possible bias can be prevented. If information about cleft palate can be shown
to change judgements to a more positive attitude, this can be a way to prevent children with
cleft palate from being judged in more negative terms compared to peers with typical speech.
This research is also important from an educational point of view, to teach students and
professionals about how children with cleft palate are being perceived by peers and others (i.e.,
the public). To give the reader an insight into what cleft lip and palate is, and its common
consequences, characteristics of cleft lip and palate and research related to the present study are
presented below.
2 Background
2.1 Cleft Lip and/or Palate
Cleft lip and palate (CLP) is a deformity caused by lack of closing of the palatal plates (both
the hard palate and the velum) and is ranked as one of the most prevalent birth defects (Kummer,
2008). The incidence of cleft lip, cleft palate and cleft lip and palate among infants in Europe
is approximately 1-2 per 1000 new-borns (Vanderas, 1987). Normally, the palate merges in the
second month of prenatal life but different factors interfere in the merging process. If so, a cleft
will emerge (Kummer, 2008; Mitchell and Risch, 1992).
Clefts can occur in conjunction with other congenital anomalies in addition to the cleft, and this
is termed syndromic CLP. For individuals with cleft together with other anomalies, 30% have
a CLP (Vallino-Napoli, Riley & Halliday, 2006). When occurring with other abnormalities an
isolated cleft palate is more common than CLP (Mossey & Little, 2002). A number of
congenital anomalies are reported to be related to CLP. These include for instance congenital
heart diseases such as Tetralogy of Fallot (Wyse, Mars, al-Mahdawi, Russel-Eggitt & Blake,
1990) and ectodermal dysplasia (Suzuki et al., 2000), van der Woude syndrome (Kondo et al.,
2002) and chromosomal defects such as 22q11 deletion syndrome (Ben-Shachar et al., 2008),
SUMO1 syndrome (Pauws & Stanier, 2007) and Wolf-Hirschhorn syndrome (Battagliak Filippi
& Carey, 2008).
CLP can also occur as an isolated defect, which is commonly known as non-syndromic CLP.
Examples of causes for non-syndromic CLP are alcohol consumption during pregnancy, genetic
factors (Bezerra et al., 2014) and lack of folic acid which can cause damage to DNA (Bezerra
et al., 2014; Brooklyin, Aravinthan, Adhisivam & Chand, 2014). The fissure may occur to the

3
soft palate only, or towards and through the hard palate. If so, the nasal cavity is open to the
mouth, and the septum may be absent. (Kummer, 2008).
Individuals with CLP are at risk for eating problems, conductive hearing loss, speech problems
and dental anomalies (Estrem & Broen, 1989; Kummer, 2008; Mackay, Mazahari, Graham,
Jeffords, Leber, Gorman, & Saggers, 1999). Depending on the hearing status of the child with
CP, language development might also be affected (Kummer, 2008). It may also be associated
with social and psychological issues (Mackay et al., 1999). CLP often requires multidisciplinary
treatment and craniofacial surgery, dental treatment and speech and hearing intervention
(Marazita & Mooney, 2004).
2.1.1 Classifications of Cleft Lip and Palate
Depending on embryology, physiology and anatomy, CLP may be classified into four general
categories: (1) Cleft involving the lip and alveolus, (2) Cleft involving the lip and palate, (3)
Cleft where the palate alone is affected and (4) Congenital insufficiency of the palate
(Berkowitz, 2006). A complete cleft lip (CL) extends from the vermilion border to the floor of
the nose. Minimal clefts, where only the vermilion border is included, require less surgery and
will most likely not have as large consequences as those of a greater cleft. There are unilateral
and bilateral clefts. The unilateral clefts occur at one side only while the bilateral cleft occurs
at both sides. In a bilateral CL a median portion of the lip is isolated in the midline of the upper
lip that remains attached to the premaxilla and the columella (Berkowitz, 2006). There is a
strong correlation between the completeness of the cleft and the effects at the alveolar process.
The dental defects can be assessed by the number of teeth and the shape, structure, shape and
the position of the teeth in the dental arch (Berkowitz, 2006).
When a unilateral CLP is complete there is a direct connection between the oral and nasal
cavities on the cleft side of the palate. At the opposite side the nasal septum is attached to the
palatal process and separates the oral cavity from the nasal chamber. If the CLP is incomplete
it may be symmetrical or asymmetrical depending on whether both sides mirror each other or
not. If complete CLP, both nasal chambers are in direct communication with the oral cavity.
The turbinate are clearly visible within both nasal cavities and the nasal septum forms a midline
structure that is firmly attached to the base of the skull. Here, the premaxilla’s size and shape
can differ and depending on this the dental status may differ (Berkowitz, 2006). The most
common type of CLP is unilateral clefts (80-85%) (Hagberg, Larson & Milerad, 1998). Fifty
percent of all patients with cleft lip also have a cleft palate (Stanier & Moore, 2004). Clefts that

4
include the lips are more common in males, while an isolated cleft palate is more common
among females. Also, males with CLP tend to have more severe clefts than do females (Fogh-
Andersen, 1942).
In an isolated cleft palate (CP) neither the lip nor the alveolar process is affected. The fusion of
the palates proceeds from front to back, which means that the CP may occur in the soft palate
or the hard and the soft palate, but never the hard palate alone. The cleft may extend from the
uvula towards the soft and the hard palate. If a midline notching is present that may reveal a
submucous cleft. In other more extreme forms the CP may extend to the nasopalatine foramen
and in such cases the nasal chambers will be in direct communication with the oral cavity
(Berkowitz, 2006).
2.1.2 Hearing Loss associated to Cleft Palate
Hearing is often affected by CP. When swallowing, the eustachian tubes do not open properly
because of the anatomic dysfunctions caused by CP and the fluid produced by the middle ear
cannot drain through the eustachian tubes properly. Because of this, many children with CP
develop middle ear effusion (Kummer, 2008). This, in turn, leads to a chronic conductive
hearing loss if pressure equalization tubes are not placed in the middle ear (Valtonen, Dietz &
Qvarnberg, 2005). Pressure equalization tubes are therefore placed earlier and more often in
children with CP compared to typically developing children. Despite this, children with CP are
more likely to fail hearing screenings (Broen, Moller, Carlstrom, Doyle, Devers & Keenan,
1996).
Middle ear effusion that causes mild to moderate hearing loss seems to be associated with
delays in cognitive and linguistic development. Because of this, meticulous treatment and
monitoring of middle ear otitis is recommended to counteract hearing loss and thereby speech
and language delays (Broen et al., 1996). In addition, research in the area of hearing impairment
has shown that individuals with hearing impairment or deafness are at higher risk of being
socially isolated and/or unemployed (Schein, 1979). Since hearing loss is common among
individuals with CLP, this is a most relevant aspect for individuals with CLP and the
development of their social life.
Because of the anatomic dysfunctions in CLP, and also because of the often fluctuating hearing
loss, the CLP may cause atypical speech. The timing for the surgery and the closure of the
palate seems to have an impact on speech development (Berkowitz, 2006). At what age the cleft
is repaired by surgical closure depends on the width of the cleft. Also, such surgery is performed

5
at different stages and in different ways depending upon cultural preferences and also it varies
with geographic location. There is no evidence that any particular surgery preference is more
successful than any other. Clefts including the hard palate are frequently and simultaneously
closed with the soft palate cleft. Very wide clefts might need a greater palatal growth and
therefore the surgical closure may need to be conducted when the child is between 5 and 6 years
of age. Until the palate is closed a pharyngeal extension can be worn to decrease the problems
related to the CP (Berkowitz, 2006). However, children with CP will be behind their non CP
peers in the acquisition of certain early developed phonemes, due to the CP. The delay will
persist until the palate is closed and also for some postoperatively (Kummer, 2008).
2.2 Characteristics of Cleft Palate Speech
Deviant speech characteristics for cleft palate speech include hypernasality, hyponasality,
audible nasal air emission and/or nasal turbulence, constant production errors and voice
disorder. These, individually or combined, might affect the intelligibility of the speech (Karling,
Larson, Leanderson & Henningsson, 1993).
Infants with CP have an inadequate sound production mechanism, and frequently also impaired
hearing, which puts them at risk for delays in phonological development (O’Gara & Logemann,
2008). The speech abnormalities arise most likely even when the baby develops babbling. For
example, babies with cleft palate often use less or no anterior sounds, and these sounds are
among the first to appear in typical speech (Estrem & Broen, 1989). The speech sounds that are
developed by infants with CLP are depending on the infant’s response to the atypical anatomy
during phonological development (Harding & Grunwell, 1996). The infant may use atypical or
compensatory articulation to produce meaningful speech (O’Gara & Logemann, 1988). Overall,
babies with cleft palate tend to produce more nasals, glides and the glottal fricative [h] and
fewer multisyllabic constructions and high pressure consonants (e g /k/, /s/, and /t/) than do
babies with typical speech. However, despite the constraint on their sound producing abilities,
babies with cleft palate reduplicate and vary their use of consonants within the same utterance
as typically developing babies (Chapman, 1991).
Before the cleft has been repaired the oral and nasal opening makes it impossible for the child
to produce high pressure consonants. To be able to produce speech similar to the perceptual
speech models, the child can either have a sound producing system lacking high pressure
consonants, thereby getting a limited number of speech sounds, or it might develop

6
compensatory strategies making pressure changes in the mouth to be able to produce an
increased number of speech sounds (Trost-Cardamone, 1990).
Once the cleft has been repaired, usually around 10-12 months of age, most children will have
an adequate structure for speech and sound production. However, even when the cleft is
repaired some articulatory difficulties may remain. The developmental stage where stop
plosives are usually produced and practiced through normal babbling occurs when the child is
around 6 months of age, and therefore children with CLP will have missed out on this
developmental stage (Kummer, 2008). Also, some children continue to use the same
compensatory strategies as before the surgery even if no longer necessary. If so, the child will
need help from a speech and language therapist to change these patterns and instead develop
new ones. Early and intense intervention for speech and language disorders in children with
CLP has been shown to be important. Therapy for children with repaired CLP should mainly
focus upon reaching a level corresponding to typical speech and language use by the time they
start school, however it is likely that many children will have some remaining speech
difficulties (Kuehn & Moller, 2000).
When beginning to use words, children with cleft palate tend to target more words with word-
initial nasals, approximants and vowels but use fewer words with word-initial stops, fricatives
and affricatives. Children with typical speech, in turn, tend to target more words with initial
consonants articulated in the centre of the oral tract, while children with cleft palate target more
words with initial phonemes articulated at the periphery of the oral tract. Though, this applies
to children with cleft palate as a group, not to all specific individuals (Estrem & Broen, 1989).
Also, articulation in children with CLP is more glottal before the cleft palate has been repaired
(O’Gara & Logemann, 1998). The cleft causes lack of bone structures in the palate and because
of this there will be a lack of areas for proper articulation training, thus learning how to produce
consonants with the tongue against the hard palate might be different from typical learning
(Trost-Cardamone, 1990).
Another reason for remaining speech difficulties can be that the closing of the cleft is still not
complete, which will be the case if the soft palate and the throat wall are unable to complete a
closure between the mouth and the nasal cavity. This condition is known as velopharyngeal
inadequacy (Peterson-Falzone, Hardin-Jones & Karnell, 2000). When velopharyngeal
inadequacy occurs, the voice will be hypernasal and there will also be audible nasal airflows
which might affect speech intelligibility. Velopharyngeal inadequacy is, for most children with
CLP, the single most important factor for how intelligible and acceptable the child’s speech

7
will become (Peterson-Falzone et al., 2000). If velopharyngeal inadequacy occurs, the child
may use a passive or an active strategy to produce speech. A passive strategy means that the
child does not make an effort to reduce the unavoidable consequences of oral-nasal coupling,
with the consequence of voicing of consonants and nasalization of vowels, as well as nasal
turbulence. If the child uses an active strategy it tries to prevent the effects of oral-nasal
coupling, which is usually done by changing the place or the manner of articulation using
compensatory articulation (Hutters & Bronsted, 1987). Reduced velopharyngeal function is
treated by the use of speech improving surgery, most common is pharyngeal flap surgery
(Sloan, 2000).
Individuals with CLP often show more shyness than do their peers. Also experience of bullying
and teasing due to the CLP has been shown to be common (Noar, 1991). In turn, several studies
suggest that people with speech and voice disorders often are perceived by listeners in more
negative terms than people with typical speech and voice (Doody, Kalinowski, Armson &
Stuart, 1993; Dorsey & Guenther, 2000; Franck, Jackson, Pimentel & Greenwood, 2003; Hall,
1991; Lass et al., 1993; McDonald & Frick, 1954; Williams & Dietrich, 1999). Children with
speech-, language- or voice difficulties have been reported to not be readily accepted by their
peers and classmates (Davis, Howell & Cooke, 2002; Marge, 1966; Perrin, 1954) and to have
a lower social status among peers (Woods & Carrow, 1959). It is important that teachers and
health professionals are provided with tools making them able to handle conflicts and problems
that arise.
2.3 Measuring Judgements towards Individuals with Voice Disorders
To investigate how people with different voice disorders are perceived by others, a tool for
measuring attitudes is needed. Osgood, Suci and Tannenbaum (1957) developed such a method;
a semantic differential scale where the listener is provided with contrasting adjective pairs, i.e.
“Nice/Mean”, “Strong/Weak”. The adjectives are assigned with an ordinal rating scale, and the
participant is asked to evaluate the object using a series of bipolar rating scales. In this way, the
direction and the intensity of listeners’ attitudes can be measured and characterized.
The efficiency of the semantic differential scale depends upon the adjectives included.
According to Osgood et al. (1957) the adjectives being used should be limited and contrasted
to make sure that a broad representation is provided, thus avoiding making the test sessions too
long and exhausting for the participants. This kind of judgement assessment is the most
8
commonly used method when measuring listeners’ attitudes towards atypical speech and voice,
and is therefore also used in the paper presented here.
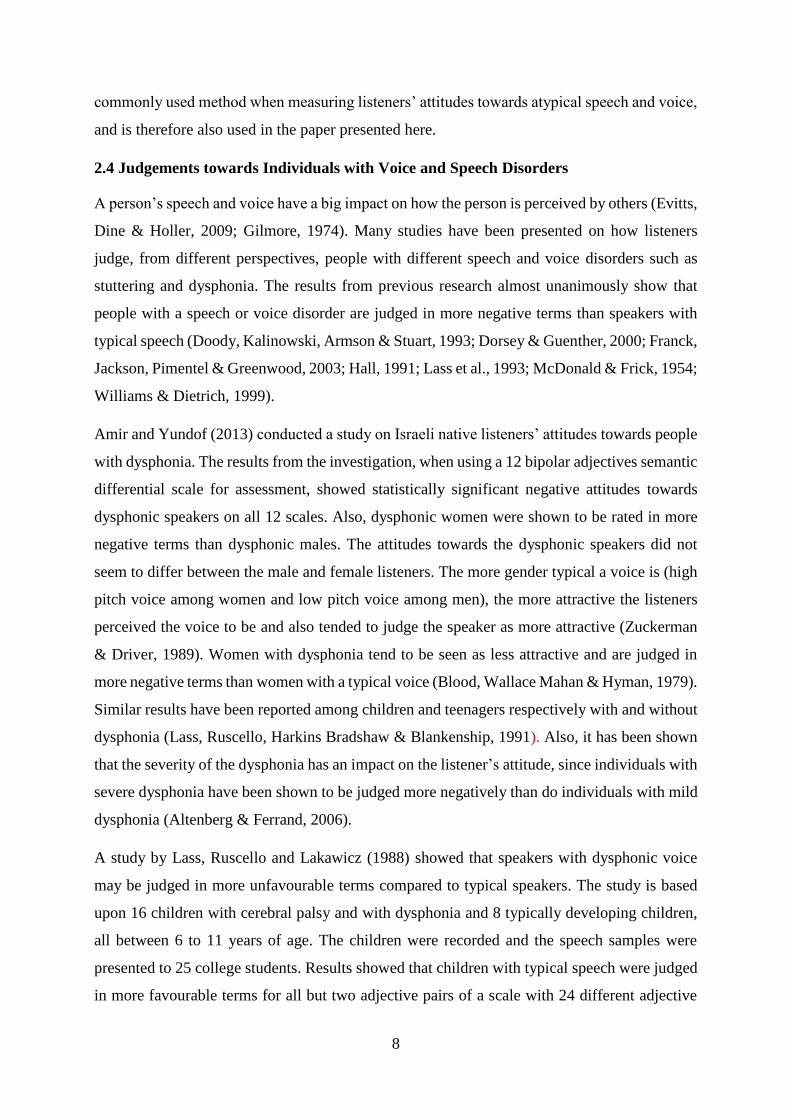
2.4 Judgements towards Individuals with Voice and Speech Disorders
A person’s speech and voice have a big impact on how the person is perceived by others (Evitts,
Dine & Holler, 2009; Gilmore, 1974). Many studies have been presented on how listeners
judge, from different perspectives, people with different speech and voice disorders such as
stuttering and dysphonia. The results from previous research almost unanimously show that
people with a speech or voice disorder are judged in more negative terms than speakers with
typical speech (Doody, Kalinowski, Armson & Stuart, 1993; Dorsey & Guenther, 2000; Franck,
Jackson, Pimentel & Greenwood, 2003; Hall, 1991; Lass et al., 1993; McDonald & Frick, 1954;
Williams & Dietrich, 1999).
Amir and Yundof (2013) conducted a study on Israeli native listeners’ attitudes towards people
with dysphonia. The results from the investigation, when using a 12 bipolar adjectives semantic
differential scale for assessment, showed statistically significant negative attitudes towards
dysphonic speakers on all 12 scales. Also, dysphonic women were shown to be rated in more
negative terms than dysphonic males. The attitudes towards the dysphonic speakers did not
seem to differ between the male and female listeners. The more gender typical a voice is (high
pitch voice among women and low pitch voice among men), the more attractive the listeners
perceived the voice to be and also tended to judge the speaker as more attractive (Zuckerman
& Driver, 1989). Women with dysphonia tend to be seen as less attractive and are judged in
more negative terms than women with a typical voice (Blood, Wallace Mahan & Hyman, 1979).
Similar results have been reported among children and teenagers respectively with and without
dysphonia (Lass, Ruscello, Harkins Bradshaw & Blankenship, 1991). Also, it has been shown
that the severity of the dysphonia has an impact on the listener’s attitude, since individuals with
severe dysphonia have been shown to be judged more negatively than do individuals with mild
dysphonia (Altenberg & Ferrand, 2006).
A study by Lass, Ruscello and Lakawicz (1988) showed that speakers with dysphonic voice
may be judged in more unfavourable terms compared to typical speakers. The study is based
upon 16 children with cerebral palsy and with dysphonia and 8 typically developing children,
all between 6 to 11 years of age. The children were recorded and the speech samples were
presented to 25 college students. Results showed that children with typical speech were judged
in more favourable terms for all but two adjective pairs of a scale with 24 different adjective

9
pairs. These two pairs were “Loud-Quiet” and “Youthful-Mature”. This is also supported by
Ma and Yu (2013), who investigated the attitudes towards children with dysphonia among
primary-school teachers, speech-language therapy students and university students in general.
The judgements were based upon 12 voice samples (whereof 6 were from children with typical
voices and 6 were from children with dysphonia) using a semantic differential scale with 22
bipolar adjective pairs. The study shows that the mean attitude ratings were significantly more
negative for the children with dysphonic voices. It is also concluded that the ratings made by
the three different student groups did not significantly differ from one another.
Attitudes and judgements towards stuttering have also been investigated in several studies.
Woods and Williams (1976) made a study of attitudes towards stutterers and found that there
is an existing generally unfavourable personality stereotype of stutterers. This stereotype was
not affected by the listener’s exposure level to stutterers. Franck et al. (2003) conducted a study
on children’s attitudes towards a stuttering adult and which produced similar findings to Woods
and Williams (1976). The study showed that school aged children judged an adult man in more
negative terms when he was stuttering compared to when he had fluid speech. Silverman (1976)
investigated the attitudes among two groups of students towards lateral lisping. One group
listened to a female speaker with typical speech, and the other group to the same speaker who
simulated a lateral lisp. The results showed that the reading with a lateral lisp was rated in more
negative terms than the reading with typical speech. Even when it comes to minor speech
problems listeners’ perception of a person tend to be more negative (Burroughs & Small, 1991).
More negative judgements were observed when a speaker misarticulated 1 out of 98 words.
These studies all show that atypical voice or speech is most likely to influence negatively the
perception of individuals’ physical, psychological and social appearance. Also, these negative
attitudes toward people with voice disorders seem to exist in most parts of the world according
to several studies (Amir & Levine-Yundof, 2013; Lass, Rusccello & Lakawicz, 1988; Ma &
Yu, 2013). However, there might be cultural differences in the preconceptions of people with
untypical speech or voice. For example, Bebout and Arthur (1992) showed that Asian listeners
are more likely than a North-American listener to believe that a person stuttering can stutter
less if they try harder. The study also shows that listeners with Chinese as their native language
were more likely to believe that speakers with cleft palate and hearing impairment were
emotionally disturbed, than were listeners from other language groups. However, there seems
to be no research indicating negative preconceptions about people with untypical speech or

10
voice are lacking in any culture. The fact such negative attitudes are common also shows the
importance of early identifiication and intervention of different voice disorders.
It is most important to make teachers and health professionals aware of the existence of these
attitudes and the problems connected to them, including making them aware of their own
attitudes towards children and adults with unintelligible speech and with voice disorders. Many
studies investigating attitudes toward people with communication disorders have shown that
the attitudes can be changed (Gilmore, 1974; Ibrahim & Herr, 1982). If so, it is highly relevant
to investigate how this can be performed in order to be able to reduce the negative attitudes a
speaker with a speech or voice disorder may face.
2.4.1 Changing Listeners’ Attitudes toward Voice and Speech Disorders
Ibrahim and Herr (1982) made a study based upon attitudes toward people with communication
disorders among undergraduate speech pathology students and audiology students. One control
group and two intervention groups were being used in the study: a) an experimental group that
role-played a specific communication disorder, and b) an informational group that received
information and engaged in discussion about people with communication disorders. The result
showed a significant difference between the attitudes in the control group compared to the two
intervention groups, where the intervention groups had more positive attitudes toward people
with communication disorders. Similar results were found in a study by Gilmore (1974)
investigating listeners’ attitudes towards speakers with esophageal voice, where esophageal
speakers were significantly more accepted by the listeners that received information about the
disorder compared to the listeners who did not receive such information.
However, other studies have found that increased information about speech or voice disorders
does not change a listener’s perception of the speaker. In a study by Lallh (1997) university
students got to listen to speech samples of women with normal voice, dysphonia due to vocal
nodules and hypernasal voice due to velopharyngeal incompetence derived from focal injury.
The listeners were assigned into one out of two listener groups, one group that received two
pages of information about the speech disability and one group that received two pages of
neutral information. The judgements from the two listener groups did not differ from each other.
Lallh and Rochet (2000) studied attitudes among university students toward women with
resonance disorders (hoarseness/breathiness or moderate hypernasality) were measured. The
students were divided into two groups (one control group and one intervention group). The
intervention group received two pages of information about the disorder before they were to do

11
the judgements using a semantic differential scale. The results showed no significant difference
in the judgements between the two groups, which supports the findings made by Lallh (1997).
2.4.2 Judgements towards Individuals with Unintelligible Speech Related to Cleft Lip
and/or Palate
Since the speech and voice abnormalities associated with CLP often cause more or less
unintelligible speech it is likely that CLP, just as for example dysphonia, stuttering and other
voice disorders, may have an impact on how listeners perceive a speaker with CLP. However,
research on attitudes towards individuals with unintelligible speech related to cleft palate is not
as widespread as the research on the attitudes toward other speech and voice difficulties.
A recent study was conducted by Lee, Gibbon and Spivey (2014) about children’s attitudes
towards peers with unintelligible speech related to cleft lip and/or palate. The study investigated
whether children were judging peers in more negative terms because of unintelligible speech.
Ninety children listened to 10 speech samples from 10 different children, each including 3
recorded sentences, and rated 8 different personal traits (adjective pairs) that they thought
described the speakers, on a three point scale (“Mean”, “Do not know” or “Nice”). The children
in the study by Lee et al. (2014) were divided into three different age groups: age 7-8, 9-10 and
11-12. The judgements made by the children aged 7-8 years showed a significant correlation
for pairs “Mean/Kind” and “Shy/Outgoing”. For the children aged 9-10 years old there was a
significant correlation for the adjective pair “No Friends/Friends”. The children aged 11-12
years made ratings with a strong correlation for pairs “Ugly/Good Looking” and “No
Friends/Friends”. The study concluded that children show less accepting attitudes towards peers
with reduced speech intelligibility compared to peers with typical speech.
3 Purpose
The purpose of the study presented here is to investigate if adults perceive children with
unintelligible speech related to CP in other terms than they perceive children with typical
speech. The study also aims at investigating if there is a difference between judgements made
by adults having received information about cleft palate and its possible effects on speech,
compared to adults having received no such information.

12
3.1 Questions at issue
Is there a correlation between the ratings made by the adult listeners and the level of the
child’s speech intelligibility?
Does receiving information about cleft palate and speech difficulties associated with it,
have significant effect on ratings made by the adult listeners?
4 Method
4.1 Participants
The listener group consisted of 30 adults above 18 years of age (n=30) of which 18 were women
and 12 men. They were all recruited in county Cork (southern Ireland) but were of different
nationalities. Most participants were Irish, the majority from the Republic of Ireland but some
also from Northern Ireland. Also, some participants were from the United Kingdom and some
from the United States of America. The recruitment was made via e-mail, sent to students and
staff at University College Cork. The e-mail included information about the study and asked
the respondents to take part in the study. Respondents were chosen among people over 18 years
of age with English as their native language, no background with working or studying in the
sectors of health or child welfare and no history of hearing impairment.
4.1.1 The participant groups
The listeners were randomly divided into two groups. Group 1, the experimental group, read
two information brochures: (1) “What is Cleft Lip & Palate?” and (2) “Cleft Lip & Palate –
Speech & Hearing Concerns” (Appendix A), both developed by The Cleft Lip & Palate
Association of Ireland (2004). Group 2 served as a control group and did not receive the
brochures. The judgements made by listeners within the two groups were analysed to find
possible differences between them.
4.2 Speech samples
Each listener listened to 10 speech samples consisting of 3 sentences each. These speech
samples were recordings from 8 children with repaired cleft palate and 2 typically developing
children, 7 boys and 3 girls between 6-14 years of age. The samples with typical speech were
included in order to form a set of speech samples that varied from typical speech to very
unintelligible speech. These recordings were pre-existing samples collected from children from
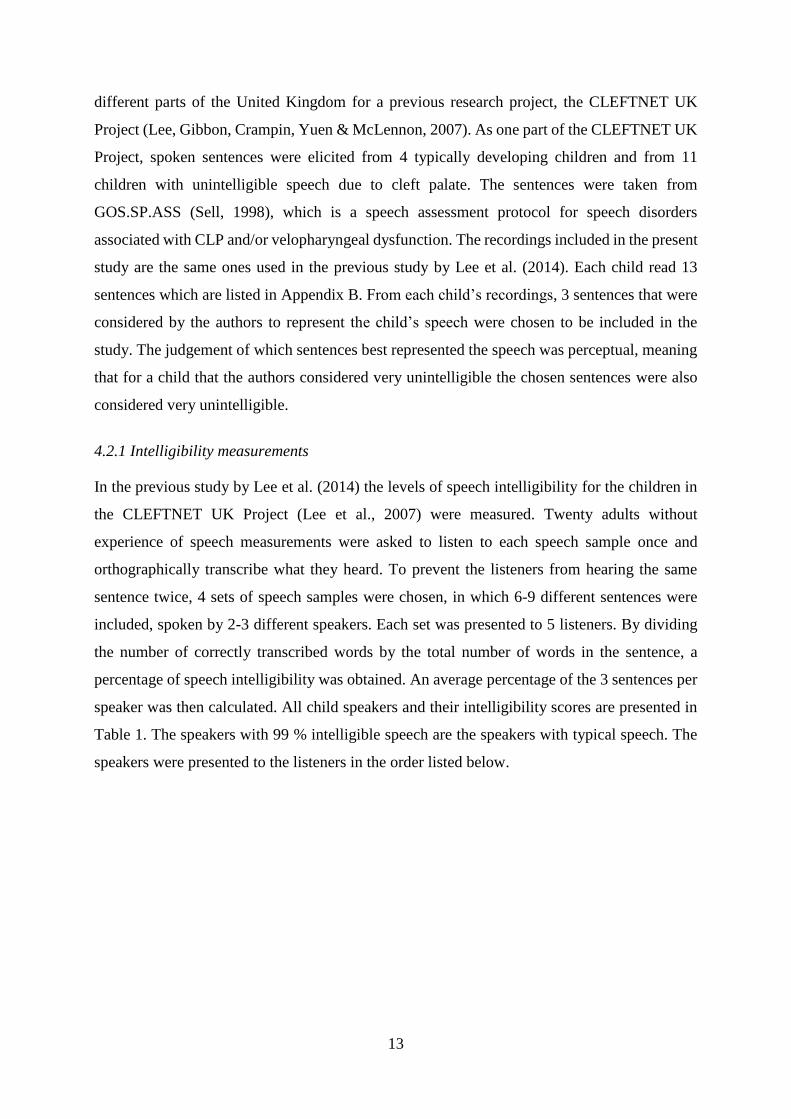
13
different parts of the United Kingdom for a previous research project, the CLEFTNET UK
Project (Lee, Gibbon, Crampin, Yuen & McLennon, 2007). As one part of the CLEFTNET UK
Project, spoken sentences were elicited from 4 typically developing children and from 11
children with unintelligible speech due to cleft palate. The sentences were taken from
GOS.SP.ASS (Sell, 1998), which is a speech assessment protocol for speech disorders
associated with CLP and/or velopharyngeal dysfunction. The recordings included in the present
study are the same ones used in the previous study by Lee et al. (2014). Each child read 13
sentences which are listed in Appendix B. From each child’s recordings, 3 sentences that were
considered by the authors to represent the child’s speech were chosen to be included in the
study. The judgement of which sentences best represented the speech was perceptual, meaning
that for a child that the authors considered very unintelligible the chosen sentences were also
considered very unintelligible.
4.2.1 Intelligibility measurements
In the previous study by Lee et al. (2014) the levels of speech intelligibility for the children in
the CLEFTNET UK Project (Lee et al., 2007) were measured. Twenty adults without
experience of speech measurements were asked to listen to each speech sample once and
orthographically transcribe what they heard. To prevent the listeners from hearing the same
sentence twice, 4 sets of speech samples were chosen, in which 6-9 different sentences were
included, spoken by 2-3 different speakers. Each set was presented to 5 listeners. By dividing
the number of correctly transcribed words by the total number of words in the sentence, a
percentage of speech intelligibility was obtained. An average percentage of the 3 sentences per
speaker was then calculated. All child speakers and their intelligibility scores are presented in
Table 1. The speakers with 99 % intelligible speech are the speakers with typical speech. The
speakers were presented to the listeners in the order listed below.

14
Table 1.
Speech Intelligibility Level per Speaker (Lee et al., 2014)
Speaker Speech Intelligibility Level
S1 (Typical) 99 %
S2 (Typical) 99 %
S5 73 %
S4 81 %
S3 85 %
S6 63 %
S8 36 %
S10 32 %
S9 35 %
S7 40 %
Speakers are presented in the same order as presented to listeners.
4.3 Test procedure
In the present study, the adult listeners attended one individual session each. They were asked
to listen to the speech samples one by one, with a total of 10 samples (each sample included
three sentences through headphones, spoken by one of the 10 children). The instructions given
to the listeners are attached in Appendix C. After each speech sample the listener filled in a
semantic differential scale with seven bipolar adjectives that describe different personality and
social qualities (e.g. whether the child is clever or not clever, healthy or sick, etc.). The listener
was asked to judge the speech using a seven-point scale depending on what he or she believed
described the child, based on the recording. The semantic differential scale used for the study
is attached in Appendix D and the bipolar adjectives for the judgement are listed in Table 2.

15
Table 2.
Bipolar Adjectives Pairs for Adult Raters’ Judgements
Traits Bipolar adjective pair
Personality
Appearance
Intelligence
Other
Naughty
Happy
Mean
Good looking
Not Clever
No friends
Healthy
Shy
Good
Sad
Kind
Ugly
Clever
Friends
Sick
Outgoing
The adjective pairs were adopted from a study by Ruscello, Lass and Brown (1988) and also
from Turnbaugh, Guitar and Hoffman (1979) and were adapted for the previous study about
children’s attitudes conducted by Lee et al. (2014). For that study, some changes were made in
the adjective pairs; “Cruel/Kind” was changed to “Mean/Kind”, “Shy/Bold” to
“Shy/Outgoing”, “Unfriendly/Friendly” to “No friends/Friends” and “Dull/Intelligent” to “Not
clever/Clever”. These changes were made to ensure the child raters understood all of the
adjective pairs, and to make the adjectives more appropriate for describing a child. For example,
it was considered to be more common to describe a child as naughty or mean rather than bad or
cruel.
A laptop computer (HP Pavilion 13 x360 PC) and headphones (HeadMax PX40) were used to
present the speech samples to the participants. All speech samples were adjusted to a level of
70 dB and when the speech samples were presented to the participants, the participant was
allowed to adjust the volume before the session started. Also, the participants could repeat the
speech samples if they wished to.

16
4.4 Ethical considerations
All participants filled out a consent form to approve their participation in the study. All
participation was voluntarily and the participant could at any time choose to cancel his or her
participation. All data was anonymised and a participant’s individual responses cannot be
traced. The collected data will be saved at the Speech and Hearing Department at University
College Cork for at least five years.
Ethical approval was given by the Clinical Research Ethics Committee of the Cork Teaching
Hospitals prior to participant recruitment in March 2015.
4.5 Statistical analysis
In order to avoid any bias in assigning the listeners to the experimental group and the control
group, a randomized distribution was made (using Microsoft Excel 2010). For the randomized
distribution each participant was assigned a random number (=rand) and thereafter the
participants were numerically sorted after their random number. The participants from the first
half of the list were assigned to Group 1 (the experimental group) and those from the second
half to Group 2 (the control group). This randomisation was made for groups of 10 to make
sure that both groups had equal amounts of participants even if the study failed to recruit as
many participants as it originally intended to (i.e. 70 participants).
A Spearman rank order correlation test was undertaken in SPSS 2.0 to determine the
relationship between the level of speech intelligibility and the judgements made by the listeners.
The Spearman rank order correlation test investigates the strength of correlation between two
ordinal variables. In order to prevent overall Type I error rate, Bonferroni Correction was used
to determine the significance level that should be used to determine statistical significance. A
customary probability level of 0.05 was selected and divided by 8 (the number of adjective
pairs) and the significance level was therefore set to p=0.05/8=0.00625. Regarding the
correlation coefficient there are different levels of strength of relationships. A correlation
coefficient between 0.1-0.29 is considered as weak, 0.3-0.49 as medium and 0.5-1 as strong
(Cohen, 1999).
A Mann Whitney U-test was performed to determine differences in ratings between the children
with CP compared to the children with typical speech. A customary probability level of 0.05
was selected. The Mann Whitney U-test was also used to see if there was any difference in the
judgements made by the two groups of listeners. For this a Bonferroni Correction was used,
and the significance level was set to 0.00625 (see above).
17
In total there were 2400 social acceptance ratings available for quantitative analysis (30
participants x 10 speech samples x 8 adjective pairs).
5 Results
5.1 Correlation between Speaker Intelligibility and Listeners’ Perception
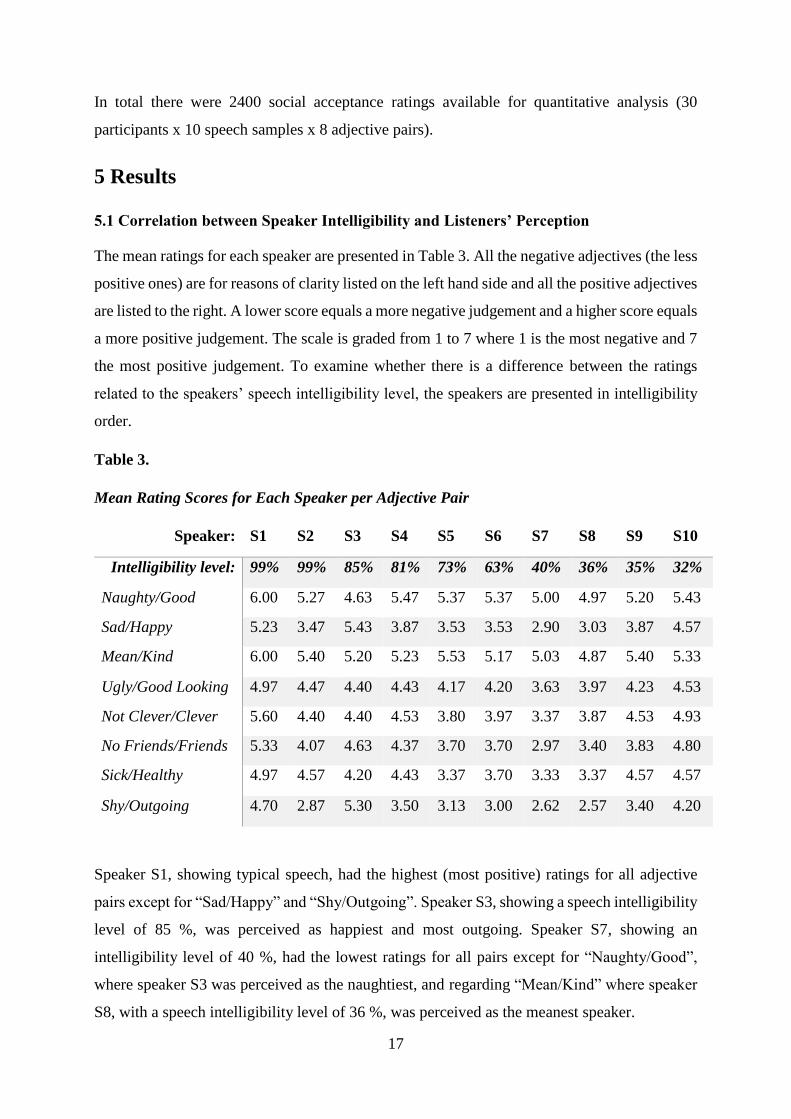
The mean ratings for each speaker are presented in Table 3. All the negative adjectives (the less
positive ones) are for reasons of clarity listed on the left hand side and all the positive adjectives
are listed to the right. A lower score equals a more negative judgement and a higher score equals
a more positive judgement. The scale is graded from 1 to 7 where 1 is the most negative and 7
the most positive judgement. To examine whether there is a difference between the ratings
related to the speakers’ speech intelligibility level, the speakers are presented in intelligibility
order.
Table 3.
Mean Rating Scores for Each Speaker per Adjective Pair
Speaker: S1 S2 S3 S4 S5 S6 S7 S8 S9 S10
Intelligibility level: 99% 99% 85% 81% 73% 63% 40% 36% 35% 32%
Naughty/Good 6.00 5.27 4.63 5.47 5.37 5.37 5.00 4.97 5.20 5.43
Sad/Happy 5.23 3.47 5.43 3.87 3.53 3.53 2.90 3.03 3.87 4.57
Mean/Kind 6.00 5.40 5.20 5.23 5.53 5.17 5.03 4.87 5.40 5.33
Ugly/Good Looking 4.97 4.47 4.40 4.43 4.17 4.20 3.63 3.97 4.23 4.53
Not Clever/Clever 5.60 4.40 4.40 4.53 3.80 3.97 3.37 3.87 4.53 4.93
No Friends/Friends 5.33 4.07 4.63 4.37 3.70 3.70 2.97 3.40 3.83 4.80
Sick/Healthy 4.97 4.57 4.20 4.43 3.37 3.70 3.33 3.37 4.57 4.57
Shy/Outgoing 4.70 2.87 5.30 3.50 3.13 3.00 2.62 2.57 3.40 4.20
Speaker S1, showing typical speech, had the highest (most positive) ratings for all adjective
pairs except for “Sad/Happy” and “Shy/Outgoing”. Speaker S3, showing a speech intelligibility
level of 85 %, was perceived as happiest and most outgoing. Speaker S7, showing an
intelligibility level of 40 %, had the lowest ratings for all pairs except for “Naughty/Good”,
where speaker S3 was perceived as the naughtiest, and regarding “Mean/Kind” where speaker
S8, with a speech intelligibility level of 36 %, was perceived as the meanest speaker.
18
Whether the social acceptance judgements correlate with the speaker’s level of speech
intelligibility was determined with a Spearman rank order correlation test. The results from this
are presented in Table 4 below.
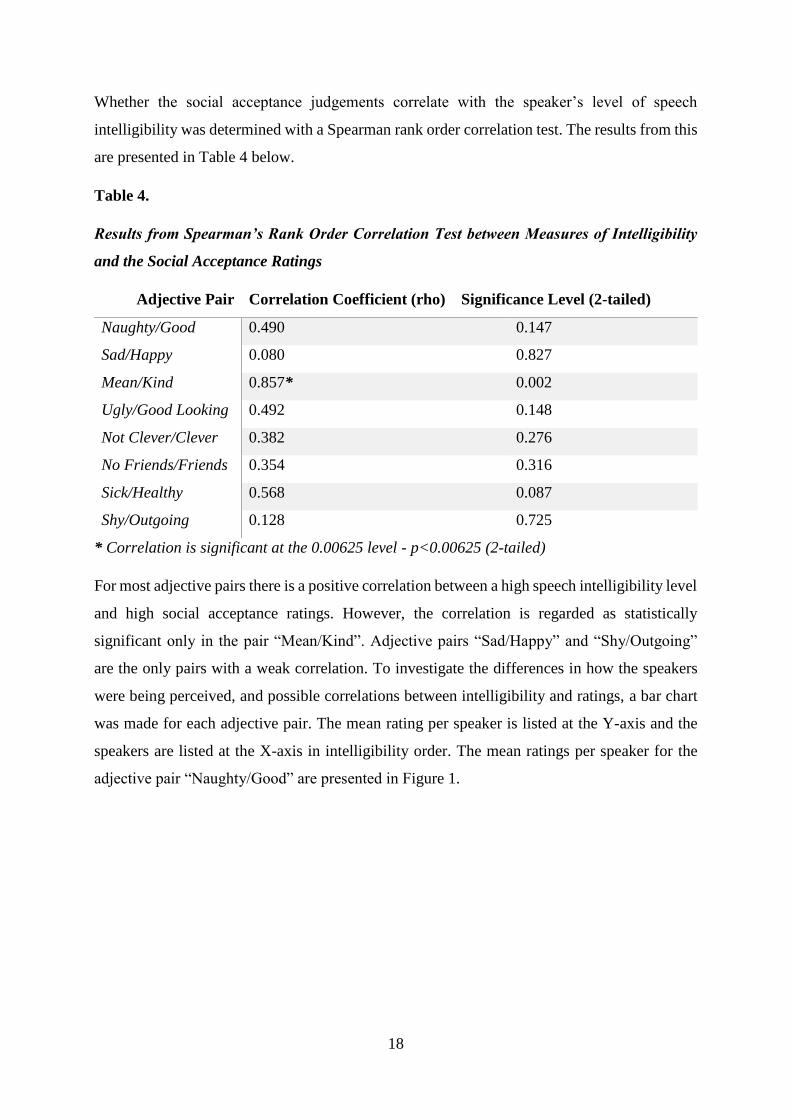
Table 4.
Results from Spearman’s Rank Order Correlation Test between Measures of Intelligibility
and the Social Acceptance Ratings
Adjective Pair Correlation Coefficient (rho) Significance Level (2-tailed)
Naughty/Good 0.490 0.147
Sad/Happy 0.080 0.827
Mean/Kind 0.857* 0.002
Ugly/Good Looking 0.492 0.148
Not Clever/Clever 0.382 0.276
No Friends/Friends 0.354 0.316
Sick/Healthy 0.568 0.087
Shy/Outgoing 0.128 0.725
* Correlation is significant at the 0.00625 level - p<0.00625 (2-tailed)
For most adjective pairs there is a positive correlation between a high speech intelligibility level
and high social acceptance ratings. However, the correlation is regarded as statistically
significant only in the pair “Mean/Kind”. Adjective pairs “Sad/Happy” and “Shy/Outgoing”
are the only pairs with a weak correlation. To investigate the differences in how the speakers
were being perceived, and possible correlations between intelligibility and ratings, a bar chart
was made for each adjective pair. The mean rating per speaker is listed at the Y-axis and the
speakers are listed at the X-axis in intelligibility order. The mean ratings per speaker for the
adjective pair “Naughty/Good” are presented in Figure 1.

19
Figure 1.
Bar Chart for Mean Ratings per Speaker for Adjective Pair “Naughty/Good”
All speakers were rated in relatively positive terms (high scores) for the adjective pair
“Naughty/Good”. Speaker S3 had the lowest rating (mean 4.63) and as stated above, speaker
S1 (typical speech) had the highest rating (mean 6.00). There is no clear relationship between
the speech intelligibility and the ratings to be seen in the diagram. For this pair the Spearman
rank order correlation test shows a correlation coefficient of 0.49 which is considered a medium
strong correlation. There is though no significant result (p=0.147>0.00625) to be found.
The ratings for adjective pair “Sad/Happy” are presented in Figure 2.
20
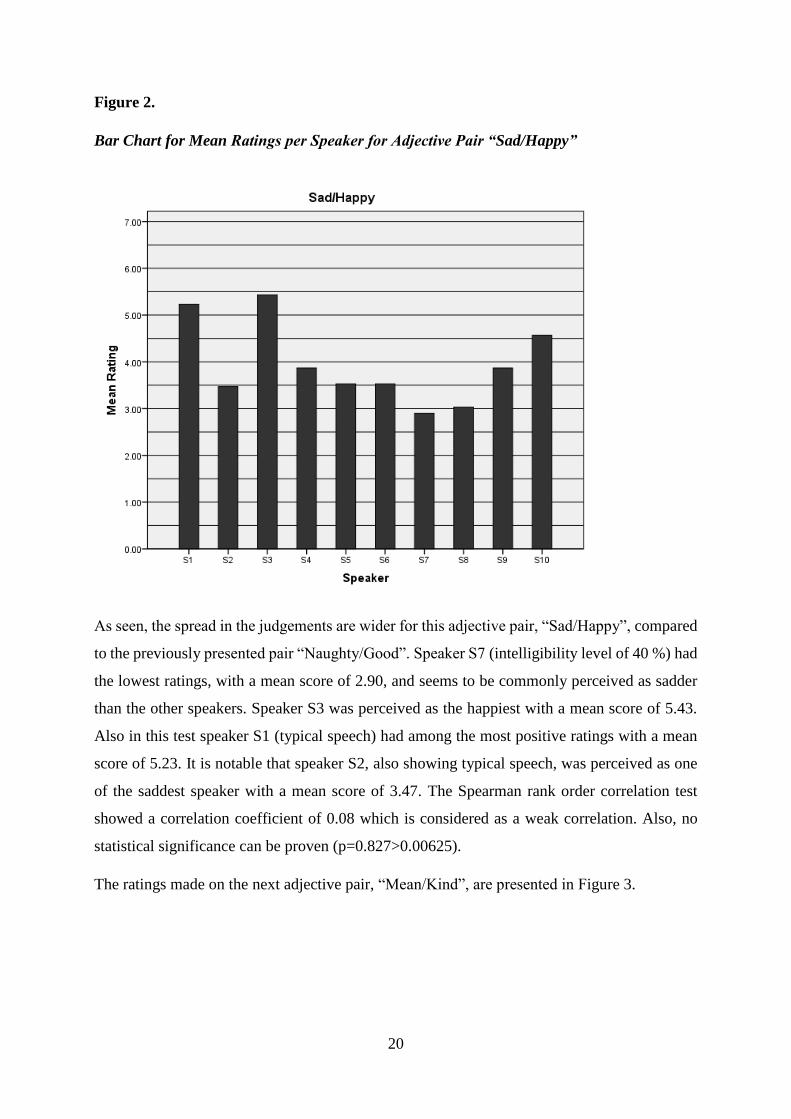
Figure 2.
Bar Chart for Mean Ratings per Speaker for Adjective Pair “Sad/Happy”
As seen, the spread in the judgements are wider for this adjective pair, “Sad/Happy”, compared
to the previously presented pair “Naughty/Good”. Speaker S7 (intelligibility level of 40 %) had
the lowest ratings, with a mean score of 2.90, and seems to be commonly perceived as sadder
than the other speakers. Speaker S3 was perceived as the happiest with a mean score of 5.43.
Also in this test speaker S1 (typical speech) had among the most positive ratings with a mean
score of 5.23. It is notable that speaker S2, also showing typical speech, was perceived as one
of the saddest speaker with a mean score of 3.47. The Spearman rank order correlation test
showed a correlation coefficient of 0.08 which is considered as a weak correlation. Also, no
statistical significance can be proven (p=0.827>0.00625).
The ratings made on the next adjective pair, “Mean/Kind”, are presented in Figure 3.

21
Figure 3.
Bar Chart for Mean Ratings per Speaker for Adjective Pair “Mean/Kind”
Just as with the former adjective pair ”Naughty/Good” the ratings for this adjective pair,
“Mean/Kind”, tend to be quite high (rated in positive terms). The mean scores for all speakers
except for speaker S8, who has an intelligibility level of 36 %, are above 5. Just as for the
previous adjective pairs, speaker S1 is judged in more positive terms than the other speakers
with a mean score of 6. There is no clear relationship detected between speech intelligibility
and the listeners’ ratings. Speaker S10, who is the most unintelligible speaker, has a mean score
almost as high as speaker S2, who is a typical speaker. The correlation between the ratings
made by the listeners and the speaker’s speech intelligibility levels for adjective pair
“Mean/Kind” is 0.857, according to the Spearman rank order correlation test. This means there
is a strong correlation between high intelligibility and high rating scores (positive judgements).
Also, the correlation is statistically significant (p=0.002<0.00625) which indicates that children
with unintelligible speech are perceived as meaner than children with typical speech.
In figure 4, the ratings on adjective pair “Ugly/Good Looking” for each child are presented.

22
Figure 4.
Bar Chart for Mean Ratings per Speaker for Adjective Pair “Ugly/Good Looking”
As for all the previous adjective pairs, speaker S1 (typical speech) is rated most positively, in
this case more good looking, than the other speakers. Speaker S2 (typical speech) had a mean
score of 4.47 and was perceived as uglier than the most unintelligible speaker (S10). Therefore,
no strong relationship can be detected between speech intelligibility and how a listener
perceives a speaker’s physical appearance. Speaker S7 is perceived most negatively with a
mean score of 3.63. For this adjective pair the Spearman rank order correlation test shows a
correlation coefficient of 0.492 which is considered a medium strong correlation between high
intelligibility and high rating scores. There is though no statistical significance for this result
(p=0.148>0.00625).
The results for adjective pair “Not Clever/Clever” for each speaker are presented in Figure 5.

23
Figure 5.
Bar Chart for Mean Ratings per Speaker for Adjective Pair “Not Clever/Clever”
Speaker S1 (typical speech) is clearly perceived as the cleverest speaker with a mean score of
5.60. Speaker S10 (most unintelligible) was perceived as the second cleverest speaker with a
mean score of 4.93. Speaker S7 (40 % intelligible speech) was, as for pairs “Ugly/Good
Looking” and “Sad/Happy”, perceived most negatively with a mean rating of 3.37. No clear
relationship can be detected between the level of speech intelligibility and how clever a speaker
is perceived by a listener. The Spearman rank order correlation test gave a correlation
coefficient of 0.382. This shows a medium strong correlation between high intelligibility and
being perceived as cleverer than unintelligible peers. No statistical significance could be proven
(p=0.276>0.00625).
Whether the children are perceived of as having friends or not is shown in Figure 6, where
results for the adjective pair “No Friends/Friends” are presented.
24
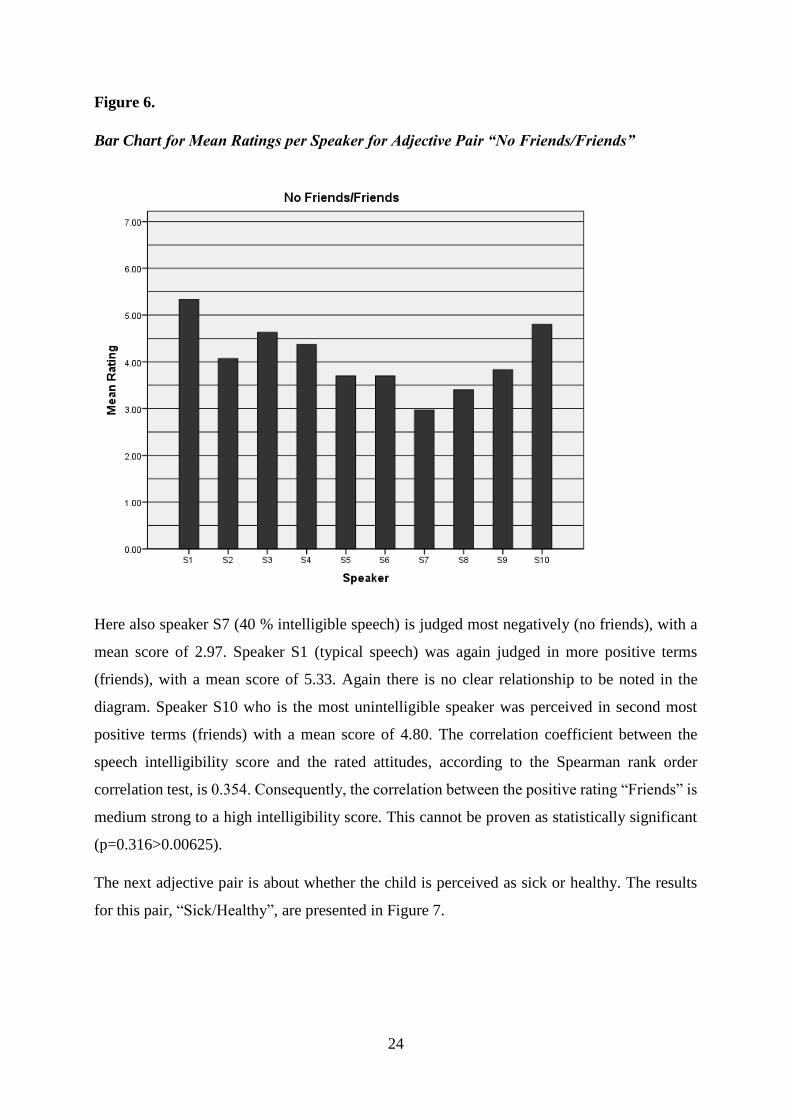
Figure 6.
Bar Chart for Mean Ratings per Speaker for Adjective Pair “No Friends/Friends”
Here also speaker S7 (40 % intelligible speech) is judged most negatively (no friends), with a
mean score of 2.97. Speaker S1 (typical speech) was again judged in more positive terms
(friends), with a mean score of 5.33. Again there is no clear relationship to be noted in the
diagram. Speaker S10 who is the most unintelligible speaker was perceived in second most
positive terms (friends) with a mean score of 4.80. The correlation coefficient between the
speech intelligibility score and the rated attitudes, according to the Spearman rank order
correlation test, is 0.354. Consequently, the correlation between the positive rating “Friends” is
medium strong to a high intelligibility score. This cannot be proven as statistically significant
(p=0.316>0.00625).
The next adjective pair is about whether the child is perceived as sick or healthy. The results
for this pair, “Sick/Healthy”, are presented in Figure 7.

25
Figure 7.
Bar Chart for Mean Ratings per Speaker for Adjective Pair “Sick/Healthy”
Speakers S5 (73 % intelligible speech), S7 (40 % intelligible speech) and S8 (36 % intelligible
speech) are the children that are perceived as the sickest with mean scores of 3.37, 3.33 and
3.37. The speakers with the highest level of speech intelligibility (S1, S2, S3 and S4) are among
the speakers that are perceived as the healthiest. But, speakers S2, S9 and S10 all have a high
mean score of 4.57, even though speaker S2 has an intelligibility level of 99 % while speakers
S9 and S10 are the most unintelligible speakers. According to the Spearman rank order
correlation test there is a strong correlation, 0.568, between the more positive judgement
“Healthy” and a high speech intelligibility, and vice versa. This cannot be proven to be
statistically significant (p=0.087>0.00625).
The last adjective pair is “Shy/Outgoing” and the results from this pair are presented in figure
8.

26
Figure 8.
Bar chart for Mean Ratings per Speaker for Adjective Pair “Shy/Outgoing”
The rating scores for this pair are quite widespread. The speakers judged as the shyest ones are
speaker S8 (36 % intelligible speech) with a mean score of 2.62 and speaker S7 (40 %
intelligible speech) with a mean score of 2.57. These two speakers are among the most
unintelligible ones. It is notable that speaker S2 (typical speech) also had a quite low mean
score, 2.87. This is the only pair where speaker S1 (typical speech) was not perceived in most
positive terms. Speaker S3 was perceived as most outgoing with a mean score of 5.30. No clear
correlation between intelligibility and the ratings was found. According to the Spearman rank
order correlation test the correlation between intelligibility and the positive rating “Outgoing”
(and vice versa) is weak, with a coefficient of 0.128. This result could not be proven to be
statistically significant (p=0.725>0.00625).
5.2 Differences in Judgements between the Children with Typical Speech and the
Children with Cleft Palate
To investigate possible differences between how the listeners perceived the speakers with CP
compared to how they perceived those with typical speech, a Mann Whitney U-test was
performed. The results shows a statistically significant difference between the ratings for the

27
children with CP and the typical speakers (p=0.000<0.05). It seems based upon this that
children with CP are perceived in more negative terms than children with typical speech.
5.3 Comparisons between the Experimental Group and the Control Group
The judgements made by the two listener groups are presented in Table 6.
Table 6.
Mean Ratings per Listener Group for each Adjective Pair
Adjective Pair Experimental Group
Mean Ratings
Control Group
Mean Ratings
Naughty/Good 5.07 5.47
Sad/Happy 3.95 3.94
Mean/Kind 4.95 5.68
Ugly/Good Looking 4.42 4.18
Not Clever/Clever 4.27 4.41
No Friends/Friends 4.30 3.86
Sick/Healthy 3.91 4.30
Shy/Outgoing 3.51 3.55
To investigate whether there is a difference between the two groups, the mean ratings per group
and adjective pair are presented in a bar chart in Figure 9. The mean ratings are presented on
the Y-axis and the adjective pairs on the X-axis. The white bars represent the ratings made by
the experimental group (group 1) and the black bars represent the ratings made by the control
group (group 2).
28
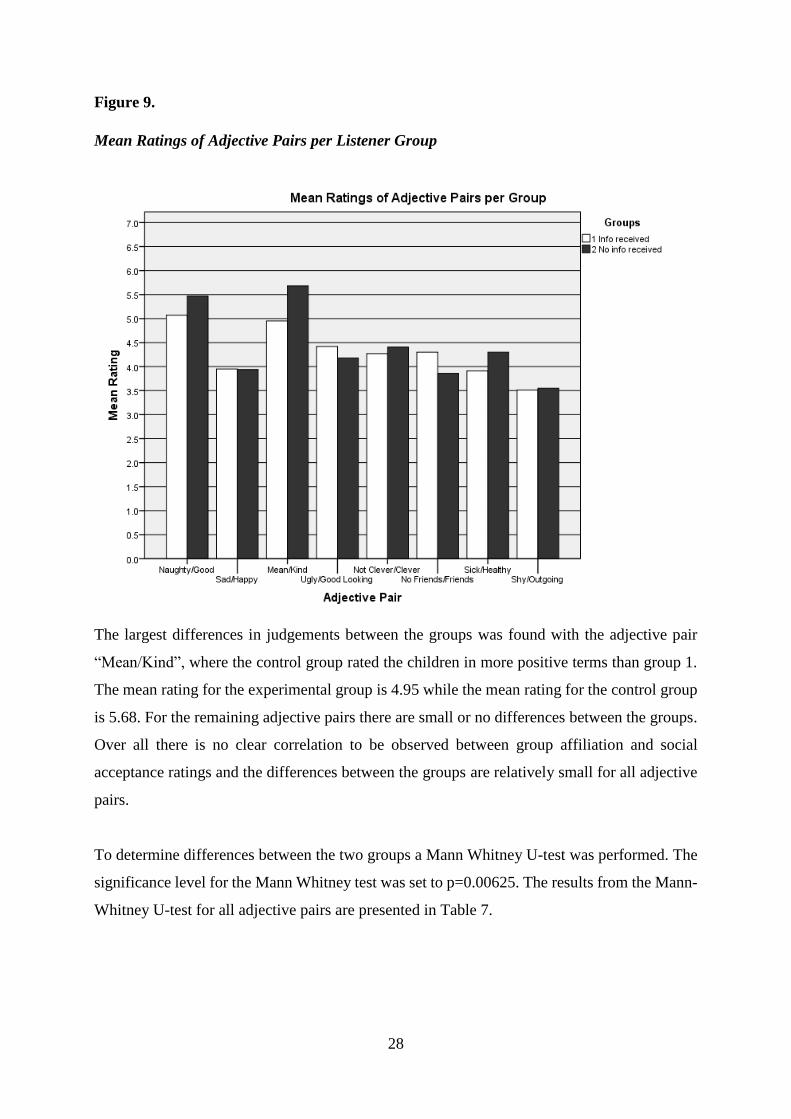
Figure 9.
Mean Ratings of Adjective Pairs per Listener Group
The largest differences in judgements between the groups was found with the adjective pair
“Mean/Kind”, where the control group rated the children in more positive terms than group 1.
The mean rating for the experimental group is 4.95 while the mean rating for the control group
is 5.68. For the remaining adjective pairs there are small or no differences between the groups.
Over all there is no clear correlation to be observed between group affiliation and social
acceptance ratings and the differences between the groups are relatively small for all adjective
pairs.
To determine differences between the two groups a Mann Whitney U-test was performed. The
significance level for the Mann Whitney test was set to p=0.00625. The results from the Mann-
Whitney U-test for all adjective pairs are presented in Table 7.

29
Table 7.
Mann-Whitney U-test: Differences Between Group Judgements for each Adjective Pair
Adjective Pair Asymp. Significance (2-tailed)
Naughty/Good 0.009
Sad/Happy 0.960
Mean/Kind 0.001
Ugly/Good Looking 0.119
Not Clever/Clever 0.393
No Friends/Friends 0.022
Sick/Healthy 0.040
Shy/Outgoing 0.857
The results show that there were significant differences between the groups for one adjective
pair only: “Mean/Kind” (p=0.001<0.00625). For all the other adjective pairs there are no
significant judgement differences between the two groups.
In other words the listeners belonging to the control group rated the speakers as more kind to a
greater extent as compared to the experimental group.
6 Discussion
6.1 Results
For most adjective pairs high social acceptance judgements had a correlation with highly
intelligible speech and vice versa. The correlation was statistically significant for one adjective
pair only: “Mean/Kind” (correlation coefficient 0.857, p=0.002<0.00625). This indicates that
the more unintelligible a child’s speech is because of the CP, the meaner he or she is perceived
by adult listeners. A strong correlation was also found for adjective pair “Sick/Healthy”
(correlation coefficient 0.568). For all remaining pairs except for “Sad/Happy” and
“Shy/Outgoing” there was a medium strong correlation between a high level of speech
intelligibility and high social judgement ratings. There was no clear correlation for adjective
pairs “Sad/Happy” and “Shy/Outgoing” (0.080 and 0.128).

30
Compared to the previous study by Lee et al. (2014), where children’s attitudes towards the
same speech recordings as used in this investigation were being studied, there are some
differences and similarities to be noted. The social acceptance judgements made by the children
aged 7-8 years showed a significant correlation for pairs “Mean/Kind” and “Shy/Outgoing”.
For the children aged 9-10 years old there was a significant correlation for adjective pair “No
Friends/Friends”. The children aged 11-12 years made ratings with a strong correlation for pairs
“Ugly/Good Looking” and “No Friends/Friends”.
For the present study adjective pair “Shy/Outgoing” is one of the two pairs showing weak or
no correlation between intelligibility and judgements. These results do not correspond to the
findings of Lee et al. (2014) where children aged 7-8 years judged the speaker with more
unintelligible speech as more shy than their typical speaking peers. It seems therefore likely
that an adult listener pays attention to other attributes in speakers’ speech and voice when
making such judgements.
Both adult and child listeners (referring to the previous study by Lee et al., 2014) seem to have
perceived some of the speakers differently compared to the other speakers with similar speech
intelligibility level. For example the most unintelligible speaker, S10 who has a speech
intelligibility level of 32 %, was in most cases perceived in more positive terms than many of
the more intelligible speakers. In the previous study with the child listeners it was hypothesized
that the speaker’s prosody may be a parameter that affects the listener’s perception of a speaker.
This might also be an explanation why speaker S2, who is one of the two speakers with typical
speech, in several cases was rated in more negative terms than the other typical speaker S1 and
other speakers with more unintelligible speech. For example, speaker S2 was perceived as very
shy.
A strong statistically significant difference was found looking at how children with CP were
perceived compared to children with typical speech. This also indicates that listeners take other
things than unintelligibility into consideration when making a judgement of a speaker. Other
aspects of the speech and voice can be presumed to have an impact on how the speaker is
perceived by the listener. For example, it has been shown that latency and intonation affect the
listener’s perception judging how likely it is that the speaker knows the answer to a certain
question (Brennan & Williams, 1995) and might therefore also have an effect in other ways.
Also, the dialect of the speaker might have an impact on how they are perceived by listeners
(Tucker & Lambert, 1969). Atypical speech and voice attributes, such as atypical articulation,

31
phonation and resonance, might also have an impact on how a listener perceives a speaker (Lass
et al., 1988).
The correlation between judgements and speech intelligibility is stronger among child listeners.
One reason might be that the child listeners had a 3-point scale while the adult listeners had a
7-point scale. The number of points used has been suggested to have an impact on the results
(Dawes, 2008). Since the adult listeners had two options respectively between the neutral
response (grade 4) and the extremes (grade 1 and 7) it is likely that they used the extremes to a
smaller extent than do child listeners using the 3-point scale, which might affect the results.
Also, research has shown that whether the scale is labelled or not has an impact on the results
(Weijters, Cabooter & Schillewaert, 2010). Since the child listeners had a three point labelled
scale (e.g. “Nice”, “Don’t know” and “Mean”) it is likely that this is a reason for the differences
in the judgements between the adult and the child listeners. Another explanation for the
differences between the child and the adult listeners could be that the adult listeners adjust their
ratings depending on how they think that they are expected to judge children, while children
often express their direct feeling. The adult listeners were asked not to adjust their opinions but
to go with their first instinct, but nevertheless some adjustments might have been made.
Overall, it seems that adult listeners tend to give more positive judgements than do child
listeners. This indicates that adults consider other factors when making judgements. They might
also have a greater insight about unintelligible speech; that it does not necessarily have anything
to do with the speaker’s personal attributes, which are no different from those of a typical
speaker. It is also likely that the adult listeners have a greater insight about speech difficulties
and that they do not necessarily mirror other social, psychological or physiological attributes.
Regardless, it seems adult listeners show a more positive attitude (i.e. give higher ratings)
towards children with unintelligible speech related to CP than do child listeners. Previous
research has shown that judgements toward dysphonic speakers do not differ between younger
(18-40 years old) and older adult listeners (above 40 years of age) (Amir & Levine-Yundof,
2013). Since the results presented in this report indicate that there might be differences in how
child and adult listeners perceive a speaker, this is suggested to be an area for further research.
The ratings made by the adult listeners for the trait “Ugly/Good Looking” are all at a mean
score somewhere in the middle of the scale, which indicates that the adults either could not, or
did not want to make a judgement of a child’s physical appearance just from hearing the child’s
voice. Many adults expressed being more or less uncomfortable with making this judgement.
Many of the listeners gave comments about this adjective pair and said that it was very hard, or
32
that they felt bad, making that judgement about a child based on the child’s voice. This is
supported by the fact that most ratings for this adjective pair were somewhere in the middle,
between 3 and 5. This might indicate that listeners did not feel that they were able to (or did not
want to) make a judgement of a child’s physical appearance without actually being able to see
the child. For this pair, some listeners made comments. For example, one speaker said “It feels
mean to rate whether a child is good looking or not only by listening to its speech” while another
said “I don’t think there are any ugly children”.
The differences between the experimental listener group and the control group in this study, do
not completely correspond to previous findings. In the earlier studies the results indicated that
the intervention group (the group that receives information with the main purpose to affect
social acceptance judgements) made more positive judgements (Gilmore, 1974; Ibrahim &
Herr, 1982), or that the judgements did not differ between the intervention group and the control
group (Lallh, 1997; Lallh & Rochet, 2000). The present study indicates that receiving (reading)
information about CLP does not change listeners’ perception of a speaker in a more positive
direction. For adjective pair “Mean/Kind” the experimental group (the group that received
information) made significantly more negative judgements compared to the control group. This
might be caused by the limited listener groups (N=30, n=15). No other studies have been found
showing that listeners receiving information would cause a downgraded perception of the
speaker’s social appearance, and an explanation of such an effect cannot easily be found. With
the exception of the adjective pair “Mean/Kind” no difference has been detected between the
listener groups’ judgements. This supports the result from Lallh and Rochet’s (2000) study with
similar listener groups, including one group that received written information about the reason
for the atypical voice. No differences between the groups were found.
6.2 Limitations of the Present Study
Overall the results might have been more applicable for larger populations if the study had
included larger listener groups. It is also possible that the results would have shown more
statistically significant results if a bigger listener group had been recruited. It had been intended
to include 70 participants but because of time limitations and difficulties in finding volunteer
participants, the final participant group consisted of 30 adult listeners.
When presenting data for participants all speech samples were played in the same order. It is
possible that this might have affected the listeners’ judgements, since the two most intelligible
speakers were presented at the beginning of the research sessions. It might have been better to

33
make sure that there were some unintelligible speakers before, between and after the intelligible
ones, to avoid the typical speakers setting some kind of ‘standard’ for a typical child voice.
Another option is to present speech samples of one of the children again, to be able to measure
intrarater reliability. Because of the difficulties finding participants and the fact that the sessions
already took around half an hour in the experimental group, adding more speech samples (and
therefore more time) might have resulted in test sessions being too long. Also, since some of
the sentences occurred more than one time in the different speech samples, it is possible that
this might have had an impact on how unintelligible the speakers perceived the children, and
this might have been taken into consideration. The sentences in the present study were chosen
by a perceptional judgement made by Lee et al. (2014). A more reliable method to decide which
sentences best represented the children’s speech could for example have been to have more than
one person listen to the entire set of samples and thereafter chose the sentences that most
listeners considered most representative for each child. However, since the intelligibility
measurements are made for the chosen sentences only and not for the entire set of sentences,
this likely did not affect the results for the present study.
Also, methods of measuring speech intelligibility and how valid the methods are should be
considered. Speech evaluations made by listeners are subjective and are therefore influenced
by setting and experience. Thus speech assessments tend to vary and the validity of results can
be questioned (Lohmander & Olsson, 2004). To make the intelligibility measurements less
subjective, an automatic speech recognition system can be used together with listener
judgements of intelligibility. Automatic speech recognition systems have been evaluated for
patients with CLP by Schuster et al. (2006) and Schuster et al. (2011), and have been shown to
be useful for speech intelligibility measurement for the CLP population. However, the method
to measure speech intelligibility in the present study was used so that listeners without education
in the area could be compared to how listeners with similar attributes perceived the speech
intelligibility. This kind of measurement is also used in other studies (Osberger & Kent, 1992;
Osberger, Maso & Sam, 1993). Nervertheless it is possible that another way of measuring the
intelligibility would show a different result for the present study.
Regarding the assessment measure, a 7-point differential scale (as used in the present study) is
recommended for research, but a further improvement might be to have a labelled scale since
this has been shown to give more reliable results (Weijters, Cabooter & Schillewaert, 2010).
However, some studies indicates that a 10-point scale is more reliable than a 7-point scale, since
this gives more options and also since a 10-point scale lacks a middle point which forces the

34
respondent to give a slightly positive or negative answer (Cummins & Gullone, 2000). It is also
possible that using a visual analogue scale might have given a different result, partly since this
has also lacks a clear middle score. However, these two types of scales have been shown to give
similar results (Harland, Dawkin & Martin, 2014).
Another thing that might have affected the results is that the trait “mean” might carry different
meanings. Some of the listeners may be of the opinion that “mean” is similar to greedy or stingy,
while others may think it means that a person is bad. Whether another trait is to be preferred
when making these kinds of measurements might be taken into consideration for future studies.
Overall, the adjective pairs used for the study were initially meant for child listeners. It is
possible that other adjective pairs would have been more useful for a study with adult listeners,
but in order to be able to eventually conduct further research on possible differences between
the child and adult listeners it was considered suitable to use the same adjective pairs.
The listener group mostly included university staff or students, which might have had an impact
on the results. Ma and Yu (2011) investigated if there were any differences in how primary
school teachers, speech-language therapists and general university students judged children
with dysphonia, but found no differences. No studies that the author is aware of have focused
on cleft palate speakers, and it might be interesting to investigate if there are any differences in
how different groups of listeners judge this group of speakers, to see if there is a difference
from other speaker groups. Also, most participants were Irish but some were from the United
Kingdom or the United States of America. Studies have shown that listeners with different
nationalities perceive speakers in different ways. Bebout and Arthur (1992) showed that
Chinese listeners are more likely than other language groups to believe that a speaker with CP
and hearing impairment is emotionally disturbed. Since the present study does not consider
different English speaking nationalities, this might be an interesting area for further research.
6.4 Conclusions
The overall findings of this study indicate that children with unintelligible speech related to
CLP are judged in more negative terms than their peers with typical speech. These findings are
also supported by earlier research. Although, it seems that unintelligibility is not the main factor
for how a child with or without cleft palate is perceived even though it might have some impact.
Statistical significance was proven for the personal trait “Mean/Kind”, where a strong
correlation between unintelligible speech and more negative judgements was found. A strong,
but not statistically significant, correlation was also found for the personal traits “Sick/Healthy”.

35
A medium strong correlation was found for the traits “Naughty/Good”, “Ugly/Good Looking”,
“Not Clever/Clever” and “No Friends/Friends”. The traits “Sad/Happy” and “Shy/Outgoing”
had a weak correlation therefore it seems that unintelligibility does not have an impact on how
adults perceive children judging these traits.
The second question at issue was, “Does receiving information about cleft palate, and the
speech difficulties associated with it, have an effect on the ratings made by the adult listeners?”.
It can be concluded that the intervention group having received information about CLP made
more negative ratings than the control group for adjective pair “Mean/Kind”. Since this
discovery has not been found in earlier research, it might be that the size of the groups (n=15)
has affected the results. Anyhow, according to the findings, receiving written information about
cleft lip and palate does not change a listener’s rating of an unintelligible speaker’s personal
traits.
The results from this study gives health care professional an insight into how patients with CLP
are treated and perceived by people around them. This is important to take into consideration
when planning treatment and intervention, and when discussing matters with patients and their
relatives. By having an insight into what might be an issue for the patient, it is also easier to
plan intervention and education people around them to prevent these negative responses.
6.5 Future research
Since the results from this study indicate that children with cleft palate are being judged in more
negative terms, without necessarily being dependent upon the child’s level of speech
intelligibility, a suggested area for future research is to investigate what are the speech and
voice attributes that really affect a listeners’ perception of a speaker. One idea could be to
compare the judgements made by listeners with the severity of the speaker’s speech disorder,
and/or the type of atypical attributes (i.e. articulation, level of nasality etc).
Further research is also needed about the possibilities of modifying a listener’s judgement
towards a speaker with unintelligible speech (in this case CLP). Earlier research has found a
variety of results and it seems that just receiving written information about the speech disorder
does not change the listeners’ perception of an unintelligible speaker. Finding other ways to
change listeners’ judgements would be useful for professionals as well as for people with
unintelligible speech and their families and friends.

36
Another area for further research is to study different groups of listeners and their attitudes
towards children with unintelligible speech related to CLP. The study presented here
investigates adults’ attitudes in general, but it would be highly interesting also to investigate
attitudes among, for example, teachers and health professionals. This would also make
professionals involved with CLP speakers and the CLP speakers’ relatives and peers aware of
the difficulties and problems CLP speakers face, which in turn might help prevent possible
negative judgements and treatment. It would also be interesting to make a deeper investigation
about possible differences between how children and adults respectively perceive speakers with
speech or voice disorders.

37
References
Altenberg, E. P., & Ferrand, C. T. (2006). Perception of individuals with voice disorders by
monolingual English, bilingual Cantonese–English, and bilingual Russian–English
women. Journal of Speech, Language, and Hearing Research, 49(4), 879-887.
Amir, O., & Levine-Yundof, R. (2013). Listeners' attitude toward people with dysphonia.
Journal of Voice, 27(4), 524-532.
Anne, D. S. (1999). GOS. SP. ASS.'98: an assessment for speech disorders associated with cleft
palate and/or velopharyngeal dysfunction (revised).International Journal of Language &
Communication Disorders, 34(1), 17-33.
Aronovitch, C. D. (1976). The voice of personality: Stereotyped judgments and their relation
to voice quality and sex of speaker. The Journal of social psychology, 99(2), 207-220.
Battaglia, A., Filippi, T., & Carey, J. C. (2008, November). Update on the clinical features and
natural history of Wolf–Hirschhorn (4p‐) syndrome: Experience with 87 patients and
recommendations for routine health supervision. In American Journal of Medical Genetics
Part C: Seminars in Medical Genetics (Vol. 148, No. 4, pp. 246-251). Wiley Subscription
Services, Inc., A Wiley Company.
Bebout, L., & Arthur, B. (1992). Cross-cultural attitudes toward speech disorders. Journal of
Speech, Language, and Hearing Research, 35(1), 45-52.
Ben-Shachar, S., Ou, Z., Shaw, C. A., Belmont, J. W., Patel, M. S., Hummel, M., ... & Patel,
A. (2008). 22q11. 2 distal deletion: a recurrent genomic disorder distinct from DiGeorge
syndrome and velocardiofacial syndrome. The American Journal of Human
Genetics, 82(1), 214-221.Berkowitz, S. (2006). Cleft lip and palate: diagnosis and
management. Springer Science & Business Media. Page 66-75.
Bezerra, J. F., Oliveira, G. H. M., Soares, C. D., Cardoso, M. L., Ururahy, M. A. G., Neto, F.
P. F., ... & Hirata, M. H. (2014). Genetic and non‐genetic factors that increase the risk of
non‐syndromic cleft lip and/or palate development. Oral diseases.
Blood, G. W., & Hyman, M. (1977). Children’s perception of nasal resonance.Journal of
Speech and Hearing Disorders, 42(3), 446-448.
Blood, G. W., Mahan, B. W., & Hyman, M. (1979). Judging personality and appearance from
voice disorders. Journal of Communication Disorders, 12(1), 63-67.
38
Brennan, S. E., & Williams, M. (1995). The feeling of Another′ s Knowing: prosody and filled
pauses as cues to listeners about the metacognitive states of speakers. Journal of memory
and language, 34(3), 383-398.
Broen, P. A., Moller, K. T., Carlstrom, J., Doyle, S. S., Devers, M., & Keenan, K. M. (1996).
Comparison of the hearing histories of children with and without cleft palate. The Cleft
palate-craniofacial journal, 33(2), 127-133.
Brooklyin, S., Jana, R., Aravinthan, S., Adhisivam, B., & Chand, P. (2014). Assessment of folic
acid and DNA damage in cleft lip and cleft palate. Clinics and practice, 4(1).
Burroughs, E. I., & Small, L. H. (1991). LISTENERS'REACTIONS TO MILD
MISARTICULATION OF/I. Perceptual and motor skills, 73(1), 184-186.
Chapman, K. L. (1991). Vocalizations of toddlers with cleft lip and palate. The Cleft palate-
craniofacial journal, 28(2), 172-178.
Cohen, J. (2013). Statistical power analysis for the behavioral sciences. Academic press.
Cummins, R. A., & Gullone, E. (2000, March). Why we should not use 5-point Likert scales:
The case for subjective quality of life measurement. InProceedings, second international
conference on quality of life in cities (pp. 74-93).
Davis, S., Howell, P., & Cooke, F. (2002). Sociodynamic relationships between children who
stutter and their non‐stuttering classmates. Journal of Child Psychology and
Psychiatry, 43(7), 939-947.
Doody, I., Kalinowski, J., Armson, J., & Stuart, A. (1993). Stereotypes of stutterers and
nonstutterers in three rural communities in Newfoundland.Journal of Fluency
Disorders, 18(4), 363-373.
Dorsey, M., & Guenther, R. K. (2000). Attitudes of professors and students toward college
students who stutter. Journal of Fluency Disorders, 25(1), 77-83.
Estrem, T., & Broen, P. A. (1989). Early speech production of children with cleft
palate. Journal of Speech, Language, and Hearing Research, 32(1), 12-23.
Evitts, P. M., Van Dine, A., & Holler, A. (2009). Effects of audio-visual information and mode
of speech on listener perceptions of alaryngeal speakers.International journal of speech-
language pathology, 11(6), 450-460.

39
Fogh-Andersen, P. (1942). Inheritanceof Harelip andCleft Palate. ArnoldBusck, Copenhagen.
Franck, A. L., Jackson, R. A., Pimentel, J. T., & Greenwood, G. S. (2003). School-age
children’s perceptions of a person who stutters. Journal of Fluency Disorders, 28(1), 1-15.
Gilmore, S. I. (1974). Social and vocational acceptability of esophageal speakers compared to
normal speakers. Journal of Speech, Language, and Hearing Research, 17(4), 599-607.
Hagberg, C., Larson, O., & Milerad, J. (1998). Incidence of cleft lip and palate and risks of
additional malformations. The Cleft palate-craniofacial journal,35(1), 40-45.
Hall, B. J. C. (1991). Attitudes of fourth and sixth graders toward peers with mild articulation
disorders. Language, Speech, and Hearing Services in Schools, 22(1), 334-340.
Harding, A., & Grunwell, P. (1996). Characteristics of cleft palate speech.International Journal
of Language & Communication Disorders, 31(4), 331-357.
Harland, N. J., Dawkin, M. J., & Martin, D. (2014). Relative utility of a visual analogue scale
vs a six-point Likert scale in the measurement of global subject outcome in patients with
low back pain receiving physiotherapy. Physiotherapy.
Hutters, B., Bau, A., & Brøndsted, K. (2001). A longitudinal group study of speech
development in Danish children born with and without cleft lip and palate. International
Journal of Language & Communication Disorders, 36(4), 447-470.
Ibrahim, F. A., & Herr, E. L. (1982). Modification of Attitudes toward Disability: Differential
Effect of Two Educational Modes. Rehabilitation Counseling Bulletin, 26 (1), 29-36.
Jocelyn, L. J., Penko, M. A., & Rode, H. L. (1996). Cognition, communication, and hearing in
young children with cleft lip and palate and in control children: a longitudinal
study. Pediatrics, 97(4), 529-534.
Kondo, S., Schutte, B. C., Richardson, R. J., Bjork, B. C., Knight, A. S., Watanabe, Y., ... &
Murray, J. C. (2002). Mutations in IRF6 cause Van der Woude and popliteal pterygium
syndromes. Nature genetics, 32(2), 285-289.
Kuehn, D. P., & Moller, K. T. (2000). Speech and language issues in the cleft palate population:
the state of the art. The Cleft palate-craniofacial journal, 37(4), 348-348.
Kummer, A.W. (2008). Cleft palate and craniofacial anomalies: effects on speech and
resonance. (2. ed.) Clifton Park, NY: Thomson Delmar Learning.
40
Lallh, A.K. (1997). The Effect of Exposure to Information on Listeners' Attitudes Toward
Speakers with Voice or Resonance Disorders. Doctoral dissertation, University of Alberta.
Lallh, A. K., & Rochet, A. P. (2000). The effect of information on listeners' attitudes toward
speakers with voice or resonance disorders. Journal of Speech, Language, and Hearing
Research, 43(3), 782-795.
Lass, N. J., Ruscello, D. M., Bradshaw, K. H., & Blankenship, B. L. (1991). Adolescents'
perceptions of normal and voice-disordered children. Journal of Communication
Disorders, 24(4), 267-274.
Lass, N. J., Ruscello, D. M., Harkins, K. E., & Blankenship, B. L. (1993). A comparative study
of adolescents' perceptions of normal-speaking and dysarthric children. Journal of
communication disorders, 26(1), 3-12.
Lass, N. J., Ruscello, D. M., & Lakawicz, J. A. (1988). Listeners' perceptions of nonspeech
characteristics of normal and dysarthric children. Journal of communication
disorders, 21(5), 385-391.
Lee, A., Gibbon, F., Crampin, L., Yuen, I., & McLennon, G. (2007). The National CLEFTNET
project for individuals with speech disorders associated with cleft palate. Advances in
Speech-Language Pathology, 9(1), 57-64.
Lee, A., Spivey, K., & Gibbon, F. (2014, November). Children’s attitudes towards peers with
cleft lip and/or palate. Paper presented at The 2014 ASHA (American Speech-Language-
Hearing Association) Convention, Orlando, USA.
Lohmander, A., & Olsson, M. (2009). Methodology for perceptual assessment of speech in
patients with cleft palate: a critical review of the literature.
Ma, E. P. M., & Yu, C. H. Y. (2013). Listeners' attitudes toward children with voice
problems. Journal of Speech, Language, and Hearing Research, 56(5), 1409-1415.
Mackay, D., Mazahari, M., Graham, W. P., Jeffords, K., Leber, D., Gorman, P. & Saggers, G.
(1999). Incidence of operative procedures on cleft lip and palate patients. Annals of plastic
surgery, 42(4), 445-448.
Marge, D. K. (1966). The social status of speech-handicapped children. Journal of Speech,
Language, and Hearing Research, 9(2), 165-177.

41
Marazita, M. L., & Mooney, M. P. (2004). Current concepts in the embryology and genetics of
cleft lip and cleft palate. Clinics in plastic surgery, 31(2), 125-140.
McDonald, E. T., & Frick, J. V. (1954). Store clerks' reaction to stuttering.Journal of Speech
and Hearing Disorders, 19(3), 306-311.
McKinnon, S. L., Hess, C. W., & Landry, R. G. (1986). Reactions of college students to speech
disorders. Journal of Communication Disorders, 19(1), 75-82.
Mitchell, L. E., & Risch, N. (1992). Mode of inheritance of nonsyndromic cleft lip with or
without cleft palate: a reanalysis. American journal of human genetics, 51(2), 323.
Mossey, P. A., & Little, J. (2002). Epidemiology of oral clefts: an international
perspective. Cleft lip and palate: from origin to treatment, 2002, 127-158.
Noar, J. H. (1991). Questionnaire survey of attitudes and concerns of patients with cleft lip and
palate and their parents. The Cleft Palate-Craniofacial Journal,28(3), 279-284.
O’Gara, M. M., & Logemann, J. A. (1988). Phonetic analyses of the speech development of
babies with cleft palate. Cleft Palate J, 25(2), 122-134.
Osberger, M. J., & Kent, R. D. (1992). Speech intelligibility in the hearing impaired: Research
and clinical implications. Intelligibility in speech disorders, 233-265.
Osberger, M. J., Maso, M., & Sam, L. K. (1993). Speech intelligibility of children with cochlear
implants, tactile aids, or hearing aids. Journal of Speech, Language, and Hearing
Research, 36(1), 186-203.
Osgood, S., & Suci, G. J. (1957). Tannenbaum. The measurement of meaning.Urbana:
University of Illinois Press.
Pauws, E., & Stanier, P. (2007). FGF signalling and SUMO modification: new players in the
aetiology of cleft lip and/or palate. TRENDS in Genetics, 23(12), 631-640.
Peterson-Falzone, S. J., Hardin-Jones, M. A., Karnell, M. P., & McWilliams, B. J. (2001). Cleft
palate speech (pp. 266-291). St. Louis: Mosby.
Ruscello, D. M., Lass, N. J., & Brown, J. (1988). College students’ perceptions of stutterers.
NSSLHA Journal, 16, 115-120.
Schein, J. D. (1979). Society and culture of hearing impaired people. Hearing and hearing
impairment, 479-487.

42
Schuster, M., Maier, A., Bocklet, T., Nkenke, E., Holst, A., Eysholdt, U., & Stelzle, F. (2012).
Automatically evaluated degree of intelligibility of children with different cleft type from
preschool and elementary school measured by automatic speech recognition. International
journal of pediatric otorhinolaryngology, 76(3), 362-369.
Schuster, M., Maier, A., Haderlein, T., Nkenke, E., Wohlleben, U., Rosanowski, F., ... & Nöth,
E. (2006). Evaluation of speech intelligibility for children with cleft lip and palate by means
of automatic speech recognition.International journal of pediatric
otorhinolaryngology, 70(10), 1741-1747.
Silverman, E. M. (1976). Listeners’ impressions of speakers with lateral lisps. Journal of
Speech and Hearing Disorders, 41, 547–552.
Sloan, G. M. (2000). Posterior pharyngeal flap and sphincter pharyngoplasty: the state of the
art. The Cleft palate-craniofacial journal, 37(2), 112-122.
Stanier, P., & Moore, G. E. (2004). Genetics of cleft lip and palate: syndromic genes contribute
to the incidence of non-syndromic clefts. Human molecular genetics, 13(suppl 1), R73-
R81.
Suzuki, K., Hu, D., Bustos, T., Zlotogora, J., Richieri-Costa, A., Helms, J. A., & Spritz, R. A.
(2000). Mutations of PVRL1, encoding a cell-cell adhesion molecule/herpesvirus receptor,
in cleft lip/palate-ectodermal dysplasia. Nature genetics, 25(4), 427-430.
The Cleft Lip and Palate Association of Ireland. (2004). Brochure: What is Cleft Lip & Palate?
Leaflet no. 2.
The Cleft Lip and Palate Association of Ireland. (2004). Brochure: Cleft Lip & Palate – Speech
and Hearing Concerns. Leaflet no. 5.
Trost-Cardamone, J. E. (1990). The development of speech: assessing cleft palate
misarticulations. Cleft Lip and Palate: A System of Management. Baltimore: Williams and
Wilkins, 340-349.
Tucker, G. R., & Lambert, W. E. (1969). White and Negro listeners' reactions to various
American-English dialects. Social forces, 47(4), 463-468.
Turnbaugh, K. R., Guitar, B. E., & Hoffman, P. R. (1979). Speech clinicians’ attribution of
personality traits as a function of stuttering severity. Journal of Speech and Hearing
Research, 22, 37-45.

43
Vallino-Napoli, L. D., Riley, M. M., & Halliday, J. L. (2006). An epidemiologic study of
orofacial clefts with other birth defects in Victoria, Australia. The Cleft palate-craniofacial
journal, 43(5), 571-576.
Valtonen, H., Dietz, A., & Qvarnberg, Y. (2005). Long‐Term Clinical, Audiologic, and
Radiologic Outcomes in Palate Cleft Children Treated with Early Tympanostomy for Otitis
Media with Effusion: A Controlled Prospective Study. The Laryngoscope, 115(8), 1512-
1516.
Vanderas, A. P. (1987). Incidence of cleft lip, cleft palate, and cleft lip and palate among races:
a review. Cleft palate J, 24(3), 216-225.
Weijters, B., Cabooter, E., & Schillewaert, N. (2010). The effect of rating scale format on
response styles: The number of response categories and response category
labels. International Journal of Research in Marketing, 27(3), 236-247.
Williams, D. F., & Dietrich, S. (1996). Effects of speech and language disorders on raters'
perceptions. Journal of communication disorders, 29(1), 1-12.
Woods, F. J., & Carrow, M. A. (1959). The choice-rejection status of speech-defective
children. Exceptional Children, 25, 279-283.
Woods, C. L., & Williams, D. E. (1976). Traits attributed to stuttering and normally fluent
males. Journal of Speech and Hearing Research, 19, 267–278.
Wyse, R. K., Mars, M., Al-Mahdawi, S., M. Russell-Eggitt, I., & Blake, K. D. (1990).
Congenital heart anomalies in patients with clefts of the lip and/or palate. The Cleft Palate-
Craniofacial Journal, 27(3), 258-265.
Zuckerman, M., & Driver, R. E. (1989). What sounds beautiful is good: The vocal attractiveness
stereotype. Journal of Nonverbal Behavior, 13(2), 67-82.

44
Appendix A
Information Brochure given to Participants in Group 1 (Experimental Group)

45

46

47

48

49

50

51

52
Appendix B
Recorded Sentences (Lee et al., 2007) from GOS.SP.ASS (Sell, 1998)
1. My Daddy mended a door
2. Funny Sean is washing a dirty dish
3. Cheeky Charlie’s watching a football match
4. The phone fell off the shelf
5. Tiny Tim is putting a hat on
6. I saw Sam sitting on a bus
7. Jolly John’s got a magic badge
8. Baby Gary’s got a bag of lego
9. Happy Karen is making a cake
10. The hamster scrambled up Stewart’s sleeve
11. The nasty boy tossed the basket into the box
12. Bouncy Bob is a baby boy
13. The puppy is playing with a rope

53
Appendix C
Protocol The participants were given the following instructions.
Initial instructions to Group 1 and 2:
“You are going to hear some speech samples. The samples are short sentences read by children,
whereof most of the children have more or less unintelligible speech because of a repaired cleft
palate. Your task is to listen to the speech samples and after each sample you will be asked to
fill in this scale [show the Semantic Differential Scale to the participant] depending on which
attributes you think applies best on the child you just heard. It is very important that you go
with your first instinct, do not modify your answers depending on how you think others would
like you to answer.”
Following instructions to Group 1:
”Also, I would like you to read these information brochures before we start listening to the
speech samples. You do not need to rush and please ask if you find anything in the text unclear. I
will leave you and come back in about 5 minutes and see if you are done with the reading, there
is no rush though and I will give you more time if you need it. [Give information paper and
leave the room for about 5 minutes.] Are you done reading? […] Okay, now you will hear three
sentences read by the first child, listen to the speech samples and thereafter you will fill in the
semantic differential scale.”
Following instructions to Group 2:
“You will now hear three sentences read by the first child, listen to the speech samples and
thereafter you will fill in the semantic differential scale.”
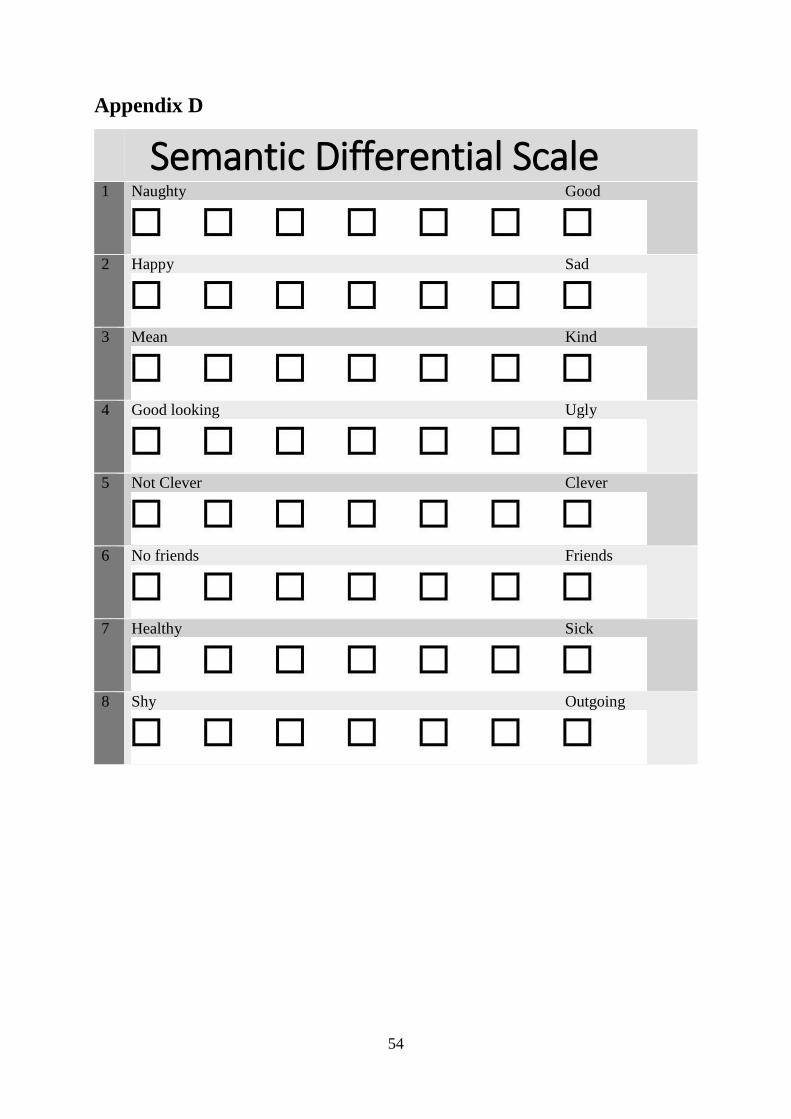
54
Appendix D
Semantic Differential Scale 1 Naughty Good
2 Happy Sad
3 Mean Kind
4 Good looking Ugly
5 Not Clever Clever
6 No friends Friends
7 Healthy Sick
8 Shy Outgoing

55
Appendix E
Information sheet A study about adults’ attitudes towards children with unintelligible speech
My name is Kajsa Skytt and I am a Speech and Language Student at Linköping University,
Sweden. As a part of my degree course I am undertaking a research project at University
College Cork. The title of my project is: “Adults’ attitudes towards children with
unintelligible speech”.
This study will investigate how adults’ perceive children with unintelligible speech.
I am looking for adult volunteer listeners to participate in the study. Participation in the
study means you will come to Department of Speech and Hearing Sciences in Brookfield
Health Sciences Complex UCC for about 30 minutes, at a time in March 2015 that suits
you. During the study you will listen to some speech samples and you will be asked to give
your opinions regarding the personality and social characteristics of each speakers. I do
not anticipate any risks associated with participation in the study.
I am looking for volunteers who fulfil the following criteria:
Are over 18 years old
Have English as your native language
Do not work or study in the health care sector
Do not work or study in the children care sector
Have no history of hearing, speech or language impairment
Participation in the study are voluntarily and you are, at any point, allowed to discontinue
participation. All results are anonymised. Your name will be replaced with a participant
number and it will not be possible for you to be identified in the reports of the data
gathered.
The results will be reported as a master thesis, which will be published online.
If you are interested in participating in this research, please reply to
[email protected] and we will set up a date that suits you. While participating you
will be asked to fill in the consent form below. Thank you very much in advance for your
participation!
If you would like to contact another person who knows about this project, you are
welcome to contact Dr Alice Lee Contact details are given below.
Kind regards,
Kajsa Skytt

56
Appendix F
Adults’ Attitudes towards Children With Unintelligible Speech
Consent Form
I have read and understood the information sheet and this consent form. I have had an
opportunity to ask questions about my participation.
I understand that I am under no obligation to participate in this study.
I understand that I have the right to withdraw from this study at any point without
giving any reason.
I understand that the results obtained will be reported as a master thesis, which will be
published online; however, all information and results will be anonymised and no
identifying information will be included in any reports of the study.
I am above 18 years old, English is my native language, I do not work or study in the area
of health care or children welfare and I have no history of hearing impairment.
I agree to participate in this study.
Name
Signature of participant
Signature of researcher
Location and date
Thank you for participating!