Embed Size (px)
Citation preview

Page 1 of 16
Next release: This series has been discontinued
Release date: 1 May 2018
Contact: Emyr John [email protected] +44 (0) 1633 456501
Statistical bulletin
Adult drinking habits in Great Britain: 2017Annual data on alcohol consumption by adults, including changes in drinking patterns in recent years and data for those who do not drink.
Correction
1 May 2018
A correction has been made to Figure 5, which incorrectly showed data for the whole population. The figure has now been updated to show data for consumers of alcohol.
We apologise for any inconvenience.

Page 2 of 16
Table of contents
1. Main points
2. Things you need to know about this release
3. Discontinuation of this bulletin and alternative sources of data
4. In Great Britain, an estimated 29.2 million adults drank alcohol
5. Similar proportions of reported alcohol consumption when looking across regions of England
6. In the week prior to interview, 7 in 10 people working in managerial and professional occupations said they drank alcohol
7. Further data on drinking habits
8. Other relevant sources of data
9. Quality and methodology

Page 3 of 16
1 . Main points
In Great Britain, 57.0% of Opinions and Lifestyle Survey respondents aged 16 years and over in 2017 drank alcohol, which equates to 29.2 million people in the population.
Young people aged 16 to 24 years in Great Britain are less likely to drink than any other age group; when they do drink, consumption on their heaviest drinking day tends to be higher than other ages.
20.4% of survey respondents reported that they did not drink alcohol at all.
England had the highest proportion of adults who said they drank alcohol in the previous week (57.8%), followed by Scotland (53.5%) and then Wales (50.0%); of the English regions, among consumers of alcohol, binge drinking was more common in the North West and least common in the South East.
People working in managerial and professional occupations, in addition to the highest earners, were most likely to say they drank alcohol in the past week.
2 . Things you need to know about this release
Our describes alcohol consumption data for adults aged 16 years and over in Great Adult drinking habits seriesBritain from the (OPN). This monthly omnibus survey, run by the Office for National Opinions and Lifestyle SurveyStatistics (ONS), conducts face-to-face interviews and concerns self-reported alcohol consumption. In 2017, the findings are based on the responses of around 7,100 people who were asked about their drinking habits in the week prior to interview.
The commentary in this bulletin is based on conclusions drawn from “weighted” population counts. When conducting social surveys, it is not possible to interview everyone in the population, as this would be too expensive; “weighting” makes the sample more representative of the population.
In this bulletin, our definition of binge drinking is based on that detailed in the . government’s Alcohol strategySpecifically, this concerns males who exceeded eight units on their heaviest drinking day (around four pints of normal strength beer or three-quarters of a bottle of wine) and females who exceeded six units on their heaviest drinking day (around three pints of normal strength beer or two large glasses of wine). The latest government
recommend individuals to not regularly exceed 14 units of alcohol per week and that these units guidelinesshould be spread over three or more days. OPN data cannot be used to help monitor against these guidelines as it measures alcohol consumption on just one given day in the week prior to interview.
It is likely that the data reported here underestimate actual drinking levels, but can be used to show people’s perceptions of drinking. Social surveys consistently produce estimates of alcohol consumption that are lower than the levels indicated by alcohol sales data. This is likely to be because people either knowingly or unknowingly underestimate their alcohol consumption. Despite this, our data give an insight into people’s perceptions of their drinking habits.
3 . Discontinuation of this bulletin and alternative sources of data
Please note that this will be the last statistical release on adult drinking habits in Great Britain. The decision to discontinue this release has not been taken lightly. The reasons for the decision are detailed in this section.
Our current questions on alcohol consumption are outdated
Page 4 of 16
Our data, which measure alcohol consumption on the heaviest drinking day, do not reflect the latest government guidelines, which are focused on drinking habits over several days.
The data are not being used to support government policy
Discussions with key government users have revealed that the (OPN) data were Opinions and Lifestyle Surveynot an important source of evidence for policymakers, with users preferring to use data from other sources such as the Health Survey for England and devolved health surveys.
We are unable to justify the cost for redesign or future running costs
The data described in this release were collected as part of a face-to-face interview on the OPN. As part of an , the OPN is due to be redeveloped. Given that our data are not ONS Data Collection Transformation programme
being used to support government policy and alternative data sources are readily available, we are unable to justify the investment that would be needed to modernise and redevelop our alcohol consumption questions.
Data on alcohol consumption are readily available elsewhere
To improve coherence for users, government producers of health statistics have been encouraged to reduce competing estimates. The following sources provide information on drinking habits in each country of Great Britain.
Health Survey for England
The is a series of annual surveys about the health of people living in England, Health Survey for England (HSE)commissioned by NHS Digital. Data on the proportion of adults who drank alcohol in the previous week are
. HSE data are also featured in NHS Digital’s annual report, Statistics on Alcohol, which available from 1998brings a variety of into one place.statistics on alcohol
Scottish Health Survey
The , commissioned by the Scottish Government, provides a detailed picture of the health Scottish Health Surveyof the Scottish population in private households and is designed to make a major contribution to the monitoring of health in Scotland. Data on alcohol consumption can be found in the Scottish Health Survey 2016: Volume 1:
and are available from 2003.Main Report
National Survey for Wales
The , commissioned by the Welsh Government, involves around 10,000 people a year National Survey for Walesacross the whole of Wales and questions them on a variety of topics including housing, culture and Welsh language, as well as population health. The , including that on alcohol consumption, is available to latest dataexplore.
Page 5 of 16
1.
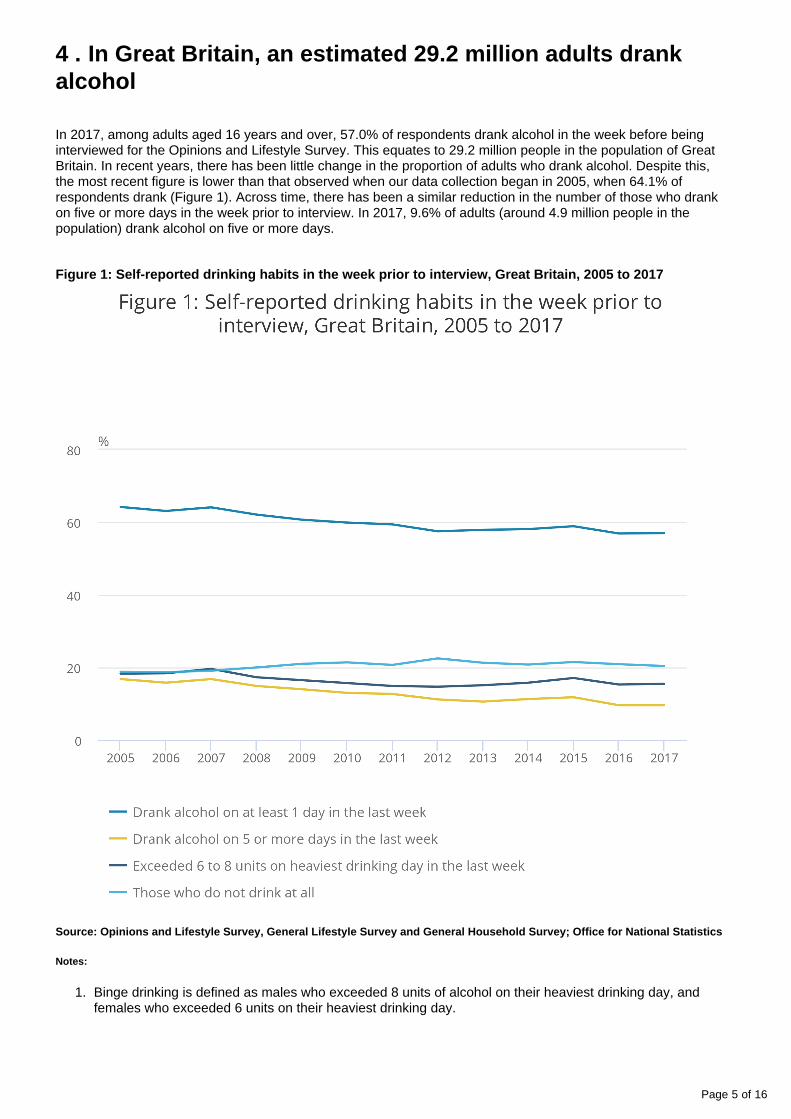
4 . In Great Britain, an estimated 29.2 million adults drank alcohol
In 2017, among adults aged 16 years and over, 57.0% of respondents drank alcohol in the week before being interviewed for the Opinions and Lifestyle Survey. This equates to 29.2 million people in the population of Great Britain. In recent years, there has been little change in the proportion of adults who drank alcohol. Despite this, the most recent figure is lower than that observed when our data collection began in 2005, when 64.1% of respondents drank (Figure 1). Across time, there has been a similar reduction in the number of those who drank on five or more days in the week prior to interview. In 2017, 9.6% of adults (around 4.9 million people in the population) drank alcohol on five or more days.
Figure 1: Self-reported drinking habits in the week prior to interview, Great Britain, 2005 to 2017
Source: Opinions and Lifestyle Survey, General Lifestyle Survey and General Household Survey; Office for National Statistics
Notes:
Binge drinking is defined as males who exceeded 8 units of alcohol on their heaviest drinking day, and females who exceeded 6 units on their heaviest drinking day.

Page 6 of 16
Men are more likely to drink alcohol than women
When looking at self-reported drinking behaviour by sex, the latest data show that 61.9% of men and 52.4% of women drank alcohol in the week prior to interview. Looking at drinking habits by age, the highest consumption was found among those aged 45 to 64 years, with 64.6% saying they drank alcohol in the past week; the lowest was found among those aged 16 to 24 years, with 47.9% saying they drank alcohol in the past week.
Since 2005, teetotalism has increased for those aged 16 to 44 years and fallen for those aged 65 and over
In 2017, the proportion of adults who said that they did not drink alcohol at all – those claiming to be teetotal – was 20.4%. This equates to approximately 10.4 million people in the population of Great Britain. A higher proportion of women reported being teetotal (22.6%) when compared with men (18.1%).
The time series for self-reported teetotalism began in 2005. When looking at changes in self-reported teetotalism by age across time (see Figure 2), teetotalism has generally increased among those aged 16 to 64 years. In contrast, among those aged 65 years and over, the proportion of adults who reported not drinking at all has fallen significantly by around 5 percentage points from 29.4% in 2005 to 24.2% in 2017. This finding is largely explained by a significant reduction in self-reported teetotalism among women in this age group. Of women aged 65 years and over, 37.2% reported not drinking at all in 2005; in 2017, this figure was just 27.9%.
Figure 2: The proportion (%) of adults who reported not drinking at all by age, Great Britain, 2005 and 2017
Source: Opinions and Lifestyle Survey and General Household Survey; Office for National Statistics

Page 7 of 16
On their heaviest drinking day, 16-to-24-year-olds are more likely to “binge” on alcohol
Among adult drinkers, 28.7% of men and 25.6% of women binged alcohol on their heaviest drinking day. Despite finding that those aged 16 to 24 years were the least likely to say they drank in the week prior to interview, when they did drink they were the most likely to binge on alcohol, something that is true for both sexes (see Figure 3). Drinkers aged 65 years and over were the least likely to binge, however, among males aged 65 years and over, the proportion that binged (14.7%) was almost double that found for females of the same age (7.6%).
The generally higher levels of binge drinking among those aged 16 to 24 years could be due to the data capturing those who tend to drink excessively on Friday or Saturday nights and then not much else during the rest of the week. Data from other sources, which measure drinking habits on more than one day, show that the most harmful
, as these individuals are more likely to drink every day.drinking tends to be among middle-aged drinkers

Page 8 of 16
1.
Figure 3: Among those who said they drank alcohol, the proportion (%) of adults who exceeded 6/8 units on their heaviest drinking day, by sex and age, Great Britain, 2017
Source: Opinions and Lifestyle Survey, Office for National Statistics
Notes:
Binge drinking is defined as males who exceeded 8 units of alcohol on their heaviest drinking day, and females who exceeded 6 units on their heaviest drinking day.
5 . Similar proportions of reported alcohol consumption when looking across regions of England
Of the constituent countries, in 2017, England had the highest proportion of adults who said they drank alcohol in the previous week (57.8%); this was significantly higher than that found in Wales (50.0%). In Scotland, 53.5% of adults drank alcohol in the previous week.

Page 9 of 16
Looking at drinking habits across English regions (see Figure 4), similar proportions of adults said they drank alcohol in the week before interview. The lowest proportions were found in the North East, West Midlands and London, where around 55% of adults in each region said they drank in the last week. The highest proportions were found in the South West, the South East, and Yorkshire and The Humber, where around 61% in each region said they drank in the previous week.
Figure 4: Proportion (%) of adults who drank alcohol in the previous week, areas of Great Britain, 2017
Source: Opinions and Lifestyle Survey, Office for National Statistics
One in three drinkers in the North West of England “binged” alcohol on their heaviest drinking day
When looking at drinkers who “binged” on their heaviest drinking day, of the constituent countries of Great Britain, excessive drinking was more common in Scotland (37.3%), followed by Wales (30.4%) and then England (26.2%). The proportion for Scotland was significantly higher than that found for England.
Of the English regions, the highest proportion of drinkers who “binged” on their heaviest drinking day was in the North West, with 33.3% reported to have done so. This proportion was significantly higher than that in the South East, where self-reported consumption was the lowest, with 18.6% of drinkers binging on alcohol.

Page 10 of 16
1.
Figure 5: Proportion (%) of drinkers who exceeded 6/8 units on their heaviest drinking day, areas of Great Britain, 2017
Source: Opinions and Lifestyle Survey, Office for National Statistics
Notes:
Binge drinking is defined as males who exceeded 8 units of alcohol on their heaviest drinking day, and females who exceeded 6 units on their heaviest drinking day.
When considering drinking habits across Great Britain, it is worth bearing in mind that the findings will be impacted by cultural differences. Data from the 2011 Census show that London is one of the most ethnically
; this could explain why London, in 2017, had the highest percentage of teetotalism across Great diverse areasBritain (26.6%). In addition, our data for 2017 show that drinking in the past week was more common among those who reported being White (61.0%) relative to those who reported being any other ethnicity (30.5%). Furthermore, the level of teetotalism was lower amongst those who are White (15.8%) compared with all other ethnicity groups (50.6%).

Page 11 of 16
6 . In the week prior to interview, 7 in 10 people working in managerial and professional occupations said they drank alcohol
People’s drinking habits are associated with a variety of different factors such as education level, relationship status and household (for example, whether they live alone; whether they have dependent children). To further understand drinking behaviour, in this section we describe data on socio-economic status and income.
When looking at drinking habits by socio-economic status, in 2017, around 7 in 10 people (69.5%) who said they worked in managerial and professional occupations drank alcohol in the week before interview (see Figure 6). This group represents a wide range of jobs, such as doctors, lawyers, architects, nurses and teachers. In contrast, 51.2% (around one in two) of people working in routine and manual occupations said they drank; this group includes jobs such as labourers, bar staff, lorry drivers, receptionists and care workers.
Figure 6: Proportion (%) of adults who drank alcohol by socio-economic status, Great Britain, 2017
Source: Opinions and Lifestyle Survey, Office for National Statistics

Page 12 of 16
The relationship between socio-economic classification and drinking habits is complex and will be associated with a variety of different factors. One factor is income; in 2017, our data show that 34.0% of respondents working in managerial and professional occupations reported earning £40,000 and above, compared with just 5.4% of those working in routine and manual occupations. When looking at the proportion of adults who said they earned £40,000 and above, almost four in five (78.9%) said they drank in the previous week (see Figure 7).
Figure 7: Proportion (%) of adults who drank alcohol by income, Great Britain, 2017
Source: Opinions and Lifestyle Survey, Office for National Statistics
The relationship between drinking habits and socio-economic status will also be associated with other characteristics such as age. Among 2017 respondents, when looking at the distribution of socio-economic status by age, managerial and professional occupations tended to have fewer people aged 16 to 24 years; our data show drinking is less common in this age group.
Our analysis on socio-economic status is based on the National Statistics Socio-Economic Classification (NS-. This measures the employment relations and conditions of occupations; it is designed to show the SEC)
structure of socio-economic positions in modern societies and helps to explain variations in social behaviour and other social phenomena.

Page 13 of 16
7 . Further data on drinking habits
The data related to the discussions in this bulletin can be found in the accompanying datasets, they are available separately for Great Britain and England respondents. As well as the points discussed, there are also tables available on:
Drinking habits and economic activity, 2014 to 2017
Drinking habits, by highest achieved qualification level, 2014 to 2017
Drinking habits by relationship status, 2014 to 2017
Drinking habits by age and whether person lives alone, 2014 to 2017
Drinking habits, by sex and whether dependent children live in the household, 2014 to 2017
Types of drink consumed on heaviest drinking day in the week before interview, by binge-drinking status, 2014 to 2017
Drinking habits and cigarette smoking, 2014 to 2017
To make full use of the survey, we’ve also produced some supplementary analyses (non-National Statistics classification), that include tables on:
Drinking habits by ethnicity, Great Britain, 2016 to 2017
Drinking in pregnancy, Great Britain, 2015 to 2017
Proportion of the population who did or did not exceed 14 units on their heaviest drinking day in the week before interview, by sex, Great Britain, 2016 to 2017
8 . Other relevant sources of data
There are a number of additional sources of data produced across government, which can also be used to understand drinking habits and its wider effects on health. These include:
Page 14 of 16
Statistics on Alcohol, England 2018 – produced by NHS Digital, this annual compendium pulls together data from different sources regarding drinking-related data including alcohol-related hospital admissions and deaths, alcohol-related prescriptions, drinking behaviours among adults and children, expenditure and affordability
Local Alcohol Profiles for England – Public Health England’s Local Alcohol Profiles contain a number of indicators, which detail the impact of harmful drinking across local authority areas in England; the constituent countries of Great Britain each have their own health surveys
Alcohol-specific deaths in the UK: registered in 2016 – produced by Office for National Statistics, this statistical bulletin provides mortality statistics that are known to be direct consequences of alcohol misuse
MESAS monitoring report 2017 – produced by the Public Health Observatory, NHS Health Scotland, the publication brings together the latest available data on important alcohol indicators in Scotland including alcohol consumption and alcohol-related deaths
Population Health (lifestyle) in Wales (PDF, 1.2MB) – produced by the Welsh Government using data from the National Survey for Wales, the release contains figures on lifestyle-related behaviours including alcohol consumption, smoking, exercise and healthy eating
9 . Quality and methodology
The report contains important Opinions and Lifestyle Survey Quality and Methodology Information (QMI)information on:
the strengths and limitations of the data and how it compares with related data
uses and users of the data
how the output was created
the quality of the output including the accuracy of the data
Coherence
There are a number of other sources of alcohol consumption data. Some of these have been listed in this section, together with a brief explanation of their comparability with the Opinions and Lifestyle Survey (OPN).
Health Survey for England (NHS Digital), National Survey for Wales (Welsh Government) and Scottish Health Survey (Scottish Government)
The OPN collects data using Computer Assisted Personal Interviewing (CAPI). This is the main method used on the Health Survey for England (HSE), the Scottish Health Survey (SHeS), and the National Survey for Wales.
Alcohol consumption data collected using CAPI tend to be lower than those using paper questionnaires. More information about these differences can be found in An Analysis of Mode Effects Using Data From the Health
.Survey for England 2006 and the Boost Survey for London
More information on each of these surveys, and the data collected, can be found on the , NHS Digital Welsh and websites.Government Scottish Government

Page 15 of 16
Reliability
It is likely that the estimates underestimate drinking levels to some extent. Social surveys consistently produce estimates of alcohol consumption that are lower than the levels indicated by alcohol sales data. This is likely to be because people either consciously or unconsciously underestimate their alcohol consumption.
Accuracy
Differences referred to in this bulletin are based on unrounded figures. A difference that is described as “statistically significant” has been assessed using 95% confidence intervals, or in other words, significantly different at 5% significance level (p less than 0.05). If a difference is said to be statistically significant, it is unlikely that it could have occurred by chance alone. Confidence intervals give a measure of the statistical precision of an estimate and show the range of uncertainty around the estimated figure. As a general rule, if the confidence interval around an estimate overlaps with the interval around another, there is no significant difference between the two estimates.
Confidence intervals have been supplied for the last three years (2015 to 2017) in the accompanying data tables.
Assumed levels of alcohol in beverages
Table 1 shows the assumed number of units for each measure of each drink type collected on the Opinions and Lifestyle Survey.

Page 16 of 16
Table 1: Assumed alcohol content of drinks and measures collected on the Opinions and Lifestyle Survey
Type of drink Measure Assumed units of alcohol
Normal strength beer, stout, lager or cider Half-pint 1.0
Normal strength beer, stout, lager or cider Pint 2.0
Normal strength beer, stout, lager or cider Small can 1.5
Normal strength beer, stout, lager or cider Large can 2.0
Normal strength beer, stout, lager or cider Bottle 1.5
Normal strength beer, stout, lager or cider Schooner 1.3 1
Strong beer, stout, lager or cider Half-pint 2.0
Strong beer, stout, lager or cider Pint 4.0
Strong beer, stout, lager or cider Small can 2.0
Strong beer, stout, lager or cider Large can 3.0
Strong beer, stout, lager or cider Bottle 2.0
Strong beer, stout, lager or cider Schooner 2.7 2
Spirits or liqueurs Standard 25ml measure 1.0
Sherry or martini Glass 1.0
Wine (including champagne and babycham) Small glass (125ml) 1.5
Wine (including champagne and babycham) Medium glass (175ml) 2.0
Wine (including champagne and babycham) Large glass (250ml) 3.0
Wine (including champagne and babycham) Bottle 9.0
Wine (including champagne and babycham) Unknown glass size 2.0
Alcopops Small can 1.5
Alcopops Standard bottle 1.5
Alcopops Large bottle 3.5
Source: Opinions and Lifestyle Survey, Office for National Statistics
Notes:
1. A schooner is 2/3 of a pint. When people said that they drank normal strength beer, stout, lager or cider in schooners, a value of 4/3 (four divided by three) units was used for each schooner that was consumed
2. A schooner is 2/3 of a pint. When people said that they drank strong beer, stout, lager or cider in schooners, a value of 8/3 (eight divided by three) units was used for each schooner that was consumed