Embed Size (px)
Citation preview
Adsorption and Catalysis
Dr. King Lun YeungDepartment of Chemical Engineering
Hong Kong University of Science and Technology
CENG 511 Lecture 3
Physical Adsorption
Texture and morphology– specific surface area of catalyst
– pore size
– pore shape
– pore-size distribution (same size or various sizes?)
– pore volume
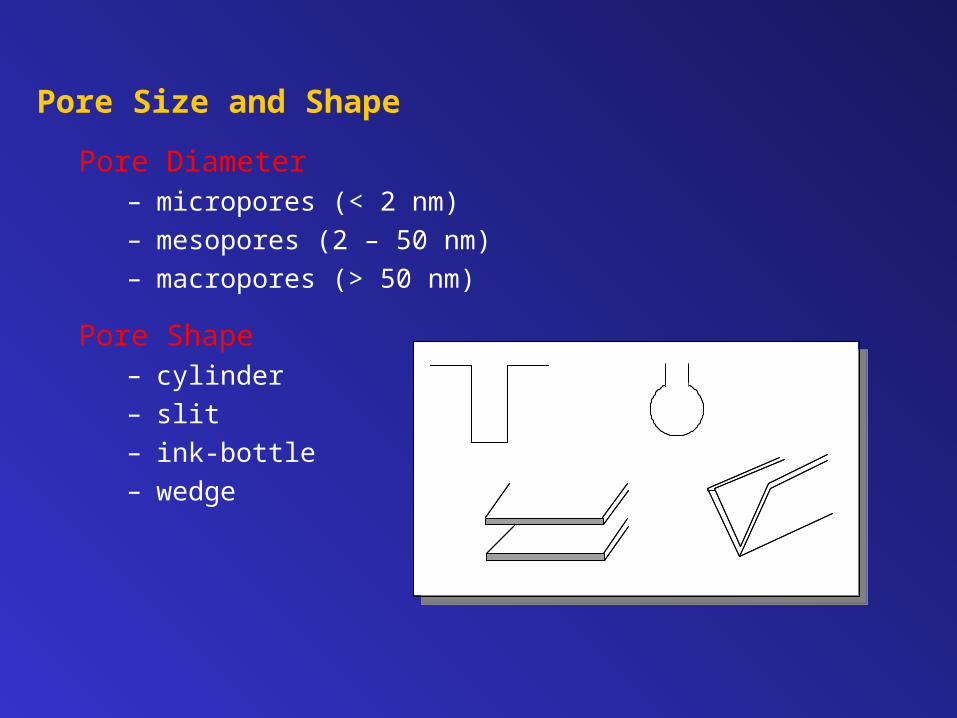
Pore Size and Shape
Pore Diameter– micropores (< 2 nm)
– mesopores (2 – 50 nm)
– macropores (> 50 nm)
Pore Shape– cylinder
– slit
– ink-bottle
– wedge

Pore Size and Shape
Pore Structure
Silica Carbon Zeolite

Pore Size and Shape
Why is it important?
it dictates the diffusion process through the material.
Configurational diffusion
Surface migration
1000 100 10 1 0.1
10-4
10-8
10-12
10-16
1000 100 10 1 0.1
100
50
0
Ea (kJ/mol)
D (m2/s)
Pore diameter (nm) Pore diameter (nm)
Moleculardiffusion Knudsen
diffusion
Surfacemigration

Pore Size and Shape
Why is it important?
directly affect the selectivity of the catalytic reaction.
Reactant selectivity
+
Product selectivity
CH3OH +
Restricted transition-state selectivity

Pore Size and Shape
Measurement Techniques
1 10 100 1000 10000
Pore diameter (nm)
Micro Meso Macro2 50
N2 capillary condensation
Hg porosimetry
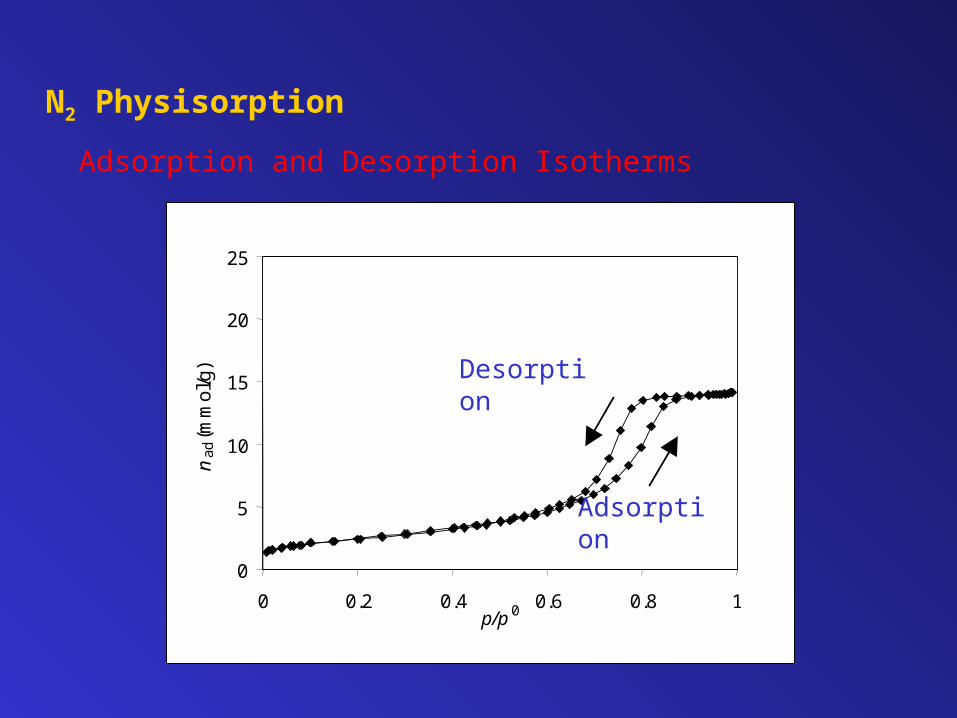
N2 Physisorption
Adsorption and Desorption Isotherms
0
5
10
15
20
25
0 0.2 0.4 0.6 0.8 1p/p 0
na
d (m
mo
l/g) 1
Adsorption
Desorption
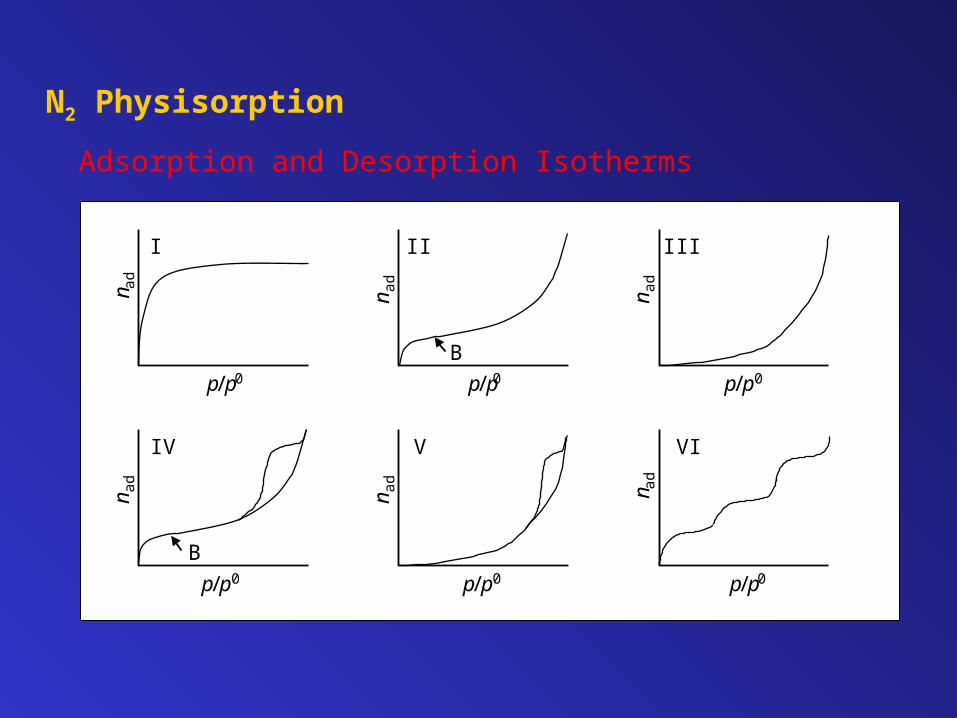
Adsorption and Desorption Isotherms
III
nad
p/p0
VI
n ad
p/p0
V
n ad
p/p0
I
n ad
p/p0 p/p
II
nad
0
B
IV
n ad
p/p0
B
N2 Physisorption

Isotherms
Assumptions:
• homogeneous surface
(all adsorption sites energetically identical)
• monolayer adsorption (so no multilayer adsorption)
• no interaction between adsorbed molecules
pK
pKnnn mmad
1
I
n ad
p/p0
Type I Langmuir Adsorption Isotherm
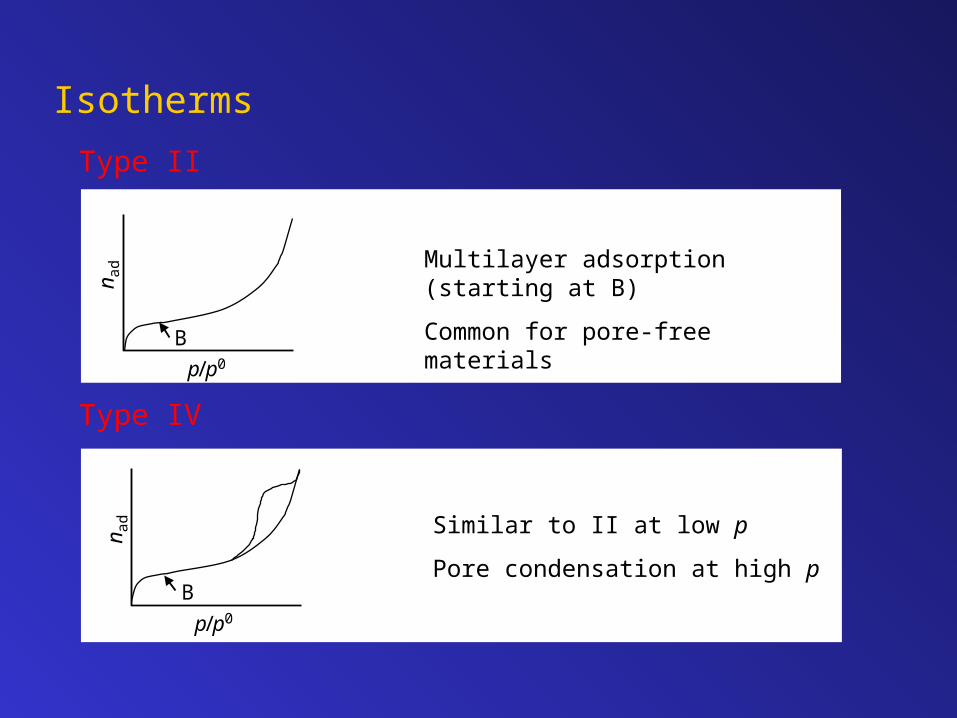
Isotherms
Multilayer adsorption (starting at B)
Common for pore-free materials
p/p
nad
0
B
Type II
Type IV
Similar to II at low p
Pore condensation at high p
n ad
p/p0
B

Isotherms
Type III
Type IV
nad
p/p0
Strong cohesion force between adsorbed molecules, e.g. when water adsorbs on hydrophobic activated carbon
n ad
p/p0
Similar to III at low p
Pore condensation at high p
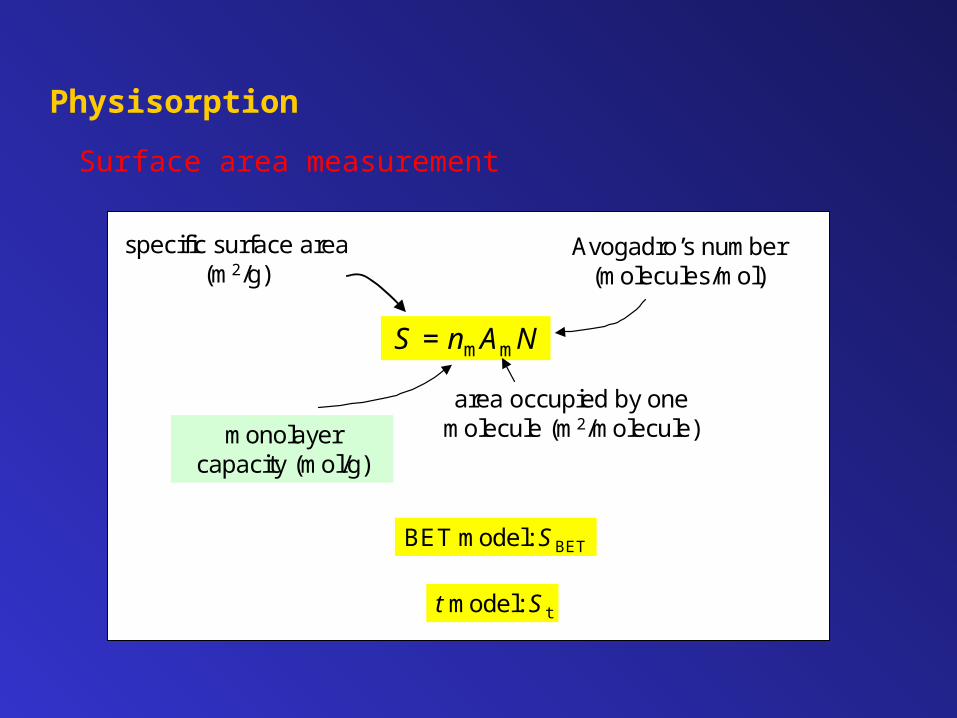
Physisorption
Surface area measurement
S = nmAmN
monolayercapacity (mol/g)
specific surface area(m2/g)
area occupied by onemolecule (m2/molecule)
Avogadro’s number(molecules/mol)
BET model: SBET
t model: St
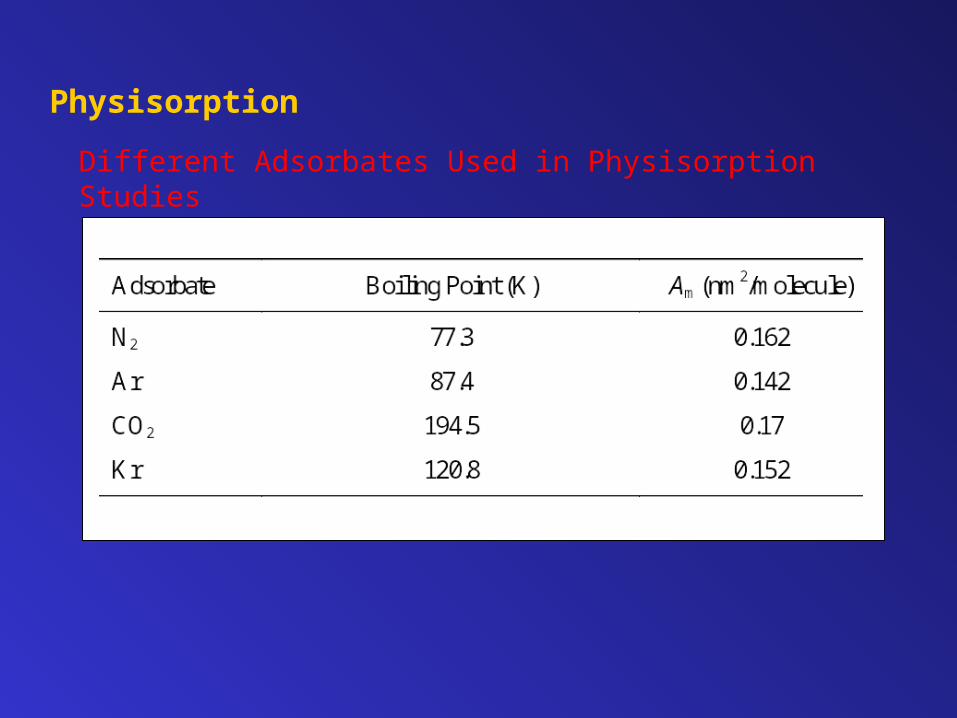
Physisorption
Different Adsorbates Used in Physisorption Studies
N2 Physisorption
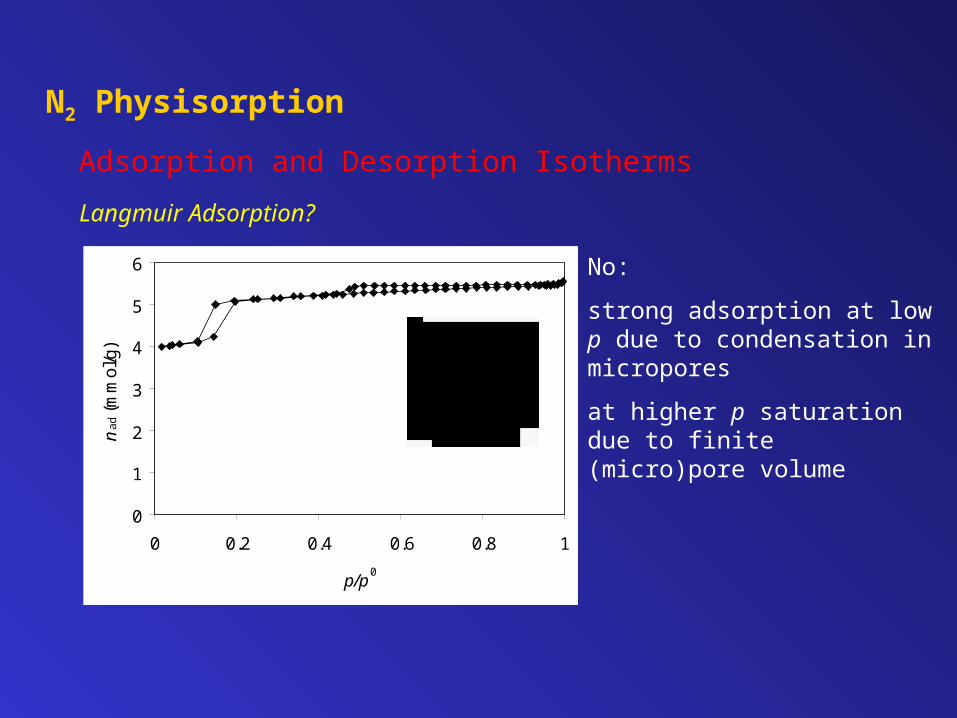
Adsorption and Desorption Isotherms
Langmuir Adsorption?
No:
strong adsorption at low p due to condensation in micropores
at higher p saturation due to finite (micro)pore volume
0
1
2
3
4
5
6
0 0.2 0.4 0.6 0.8 1
p/p0
nad
(m
mol
/g) 1
a ba b
Z e o l i t e
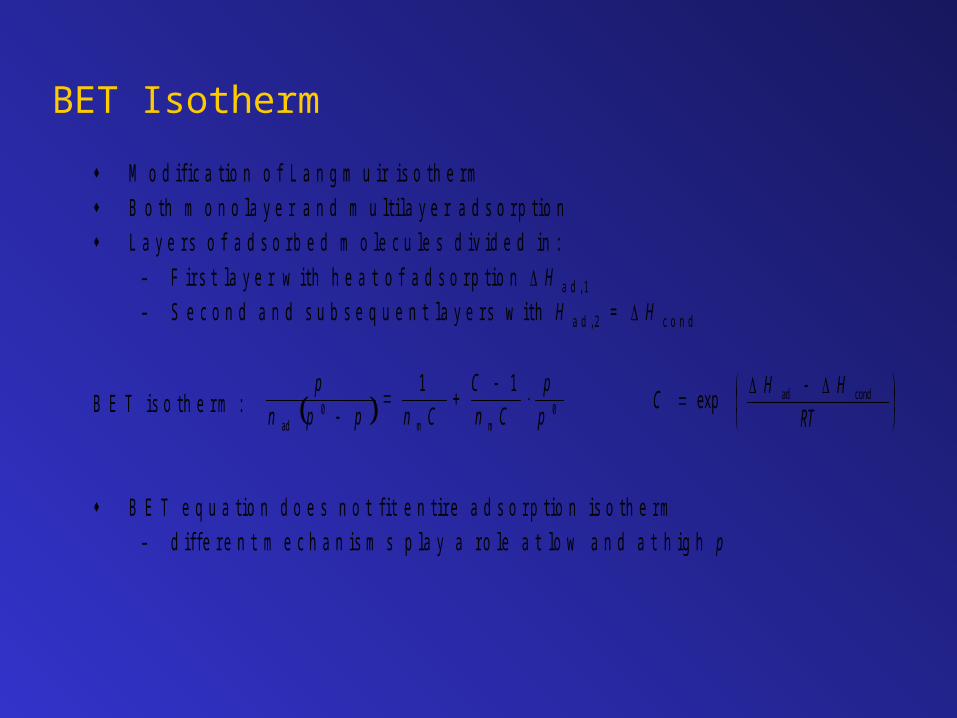
BET Isotherm
M o d i f i c a t i o n o f L a n g m u i r i s o t h e r m
B o t h m o n o l a y e r a n d m u l t i l a y e r a d s o r p t i o n
L a y e r s o f a d s o r b e d m o l e c u l e s d i v i d e d i n :
– F i r s t l a y e r w i t h h e a t o f a d s o r p t i o n H a d , 1
– S e c o n d a n d s u b s e q u e n t l a y e r s w i t h H a d , 2 = H c o n d
B E T i s o t h e r m :
B E T e q u a t i o n d o e s n o t f i t e n t i r e a d s o r p t i o n i s o t h e r m
– d i f f e r e n t m e c h a n i s m s p l a y a r o l e a t l o w a n d a t h i g h p
0mm
0ad
11
p
p
Cn
C
Cnppn
p
RT
HHC condadexp

r e a l i t y m o d e l 5
4 3
2 1
0
...321 210mad nni
1-nn1-n1
0
nn1-n1
0101
0
111
00
pKpk
kkpk
pKpk
kkpk
d
and
na
d
ada
1 s t l a y e r
n t h l a y e r
F o r e v e r y l a y e rL a n g m u i r m o d e l
A s s u m e
RT
H
RT
H
RT
H
KKK
KK
condn
ads
ee
e
0,n0,nn
0,11
0
0
0m
ad
111pp
C
pp
pp
C
n
nRT
HH
Ccondads
e
w i t h
BET Isotherm

BET IsothermNonporous Silica and Alumina
p/p0
n ad/
n m
(B) (A)
Low p/p0:
• filling of micropores
• favoured adsorption at most reactive sites (heterogeneity)
High p/p0:
• capillary condensation
Range 0.05 < p/p0 < 0.3 is used to determine SBET
BET equation

Pore Size and Surface Area
Material Mean dp (nm) SBET (m2/g)
Catalyst supports
Silica gel 10 200
6 400
4 800
-Al2O3 10 150
5 500
Zeolite 0.6-2 400-800
Activated carbon 2 700-1200
TiO2 400-800 2-50
Aerosil SiO2 - 50-200
Catalysts
MeOH synthesis (Cu/ZnO/Al2O3) 20 80
NH3 synthesis (Fe/Al2O3/K2O) 100 10
Reforming (Pt/Re/Al2O3) 5 250
Epoxidation (Ag/-Al2O3) 200 0.5

Pore Size DistributionKelvin Equation

Pore Size DistributionKelvin Equation
Cylindrical pore
Ink-bottle pore
Pore with shape of interstice between close-packed particles
Adsorbed layertdpdm
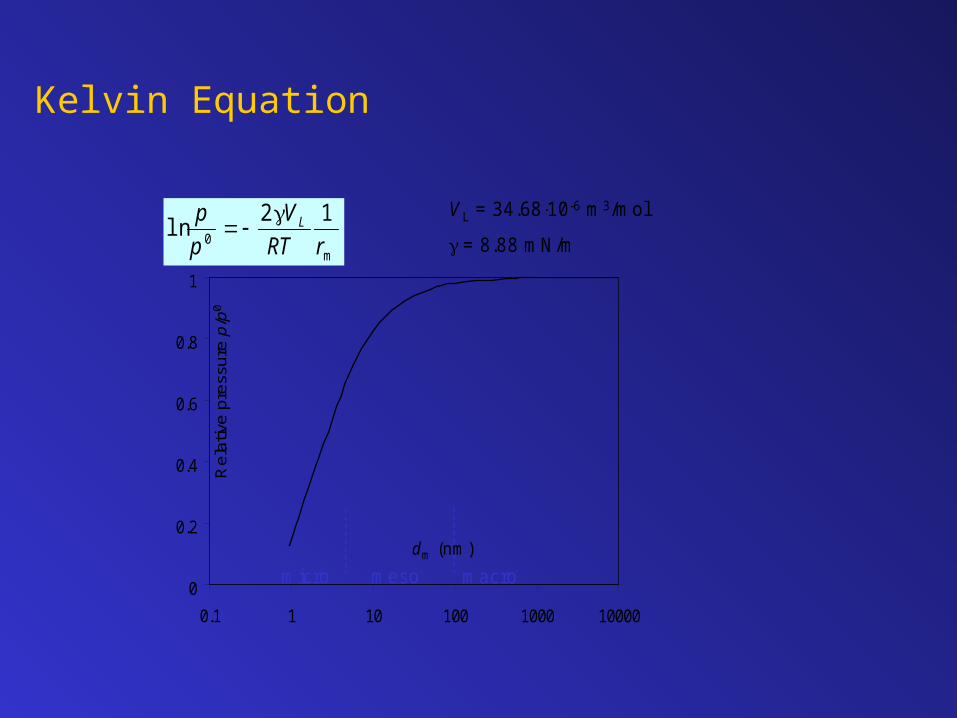
Kelvin Equation
m0
12ln
rRT
V
p
p L
micro meso macro
VL = 34.6810 -6 m 3/mol
= 8.88 mN/m
dm (nm)
Rel
ativ
e pr
essu
re p
/p0
0
0.2
0.4
0.6
0.8
1
0.1 1 10 100 1000 10000
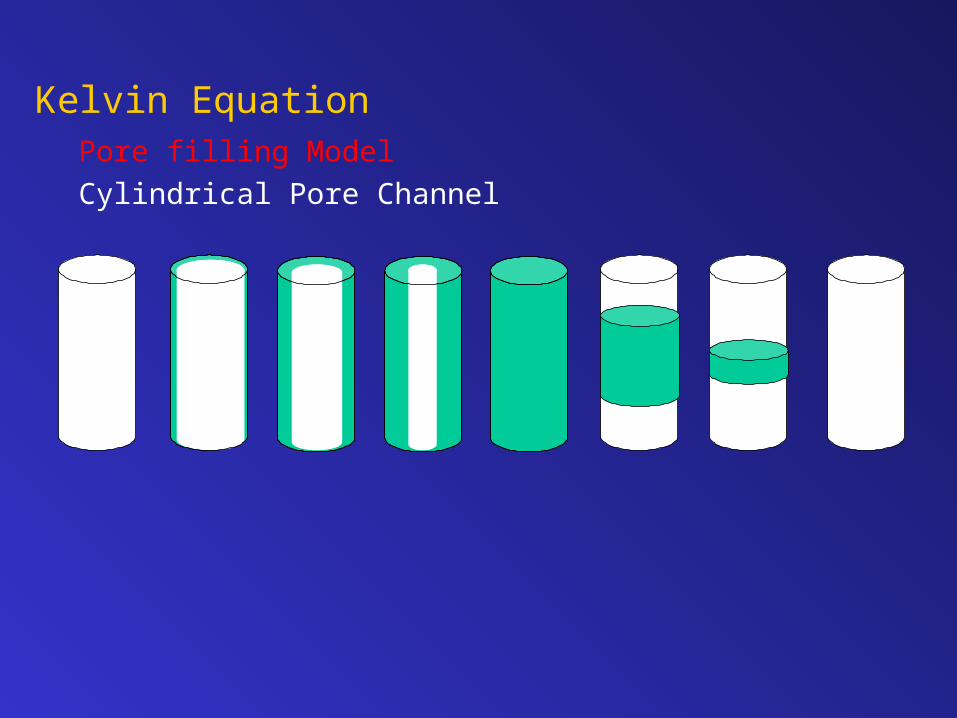
Kelvin EquationPore filling Model
Cylindrical Pore Channel
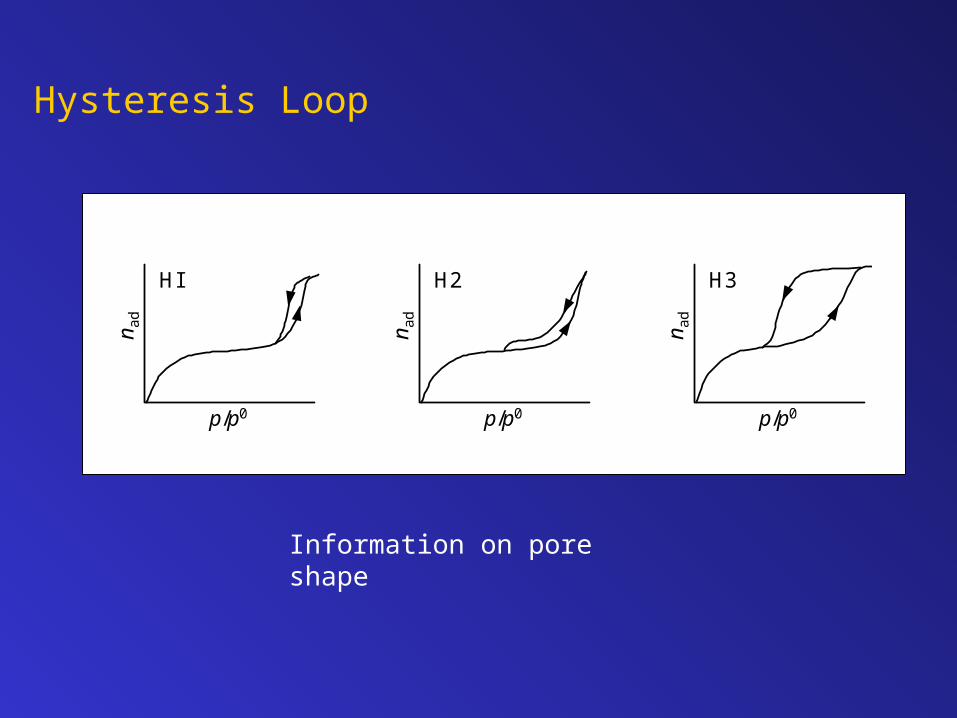
Hysteresis Loop
HI
n ad
p/p0
H2
n ad
p/p0
H3
n ad
p/p0
Information on pore shape

Pore Size Distributiont-Method
nm354.0m
ad n
nt
t
nS
NAt
nS
NAnS
ad6t
m9ad
t
mmt
1073.5
10354.0
nad
t
Proportional to St
Note:
nad is experimental result
t is calculated from correlation t versus p
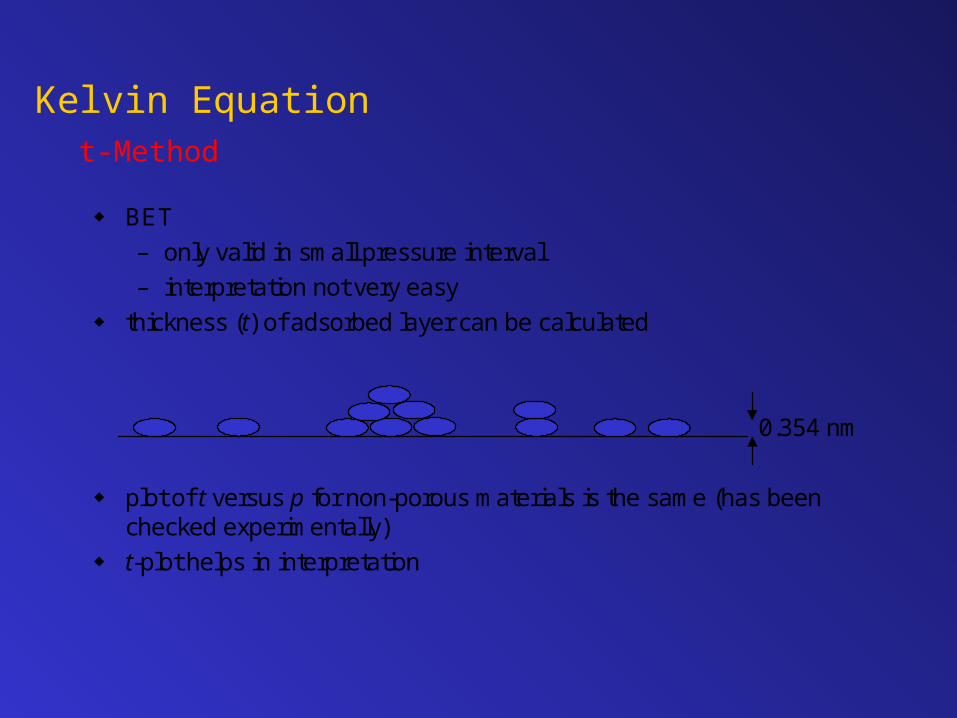
Kelvin Equationt-Method
BET
– only valid in small pressure interval
– interpretation not very easy
thickness (t) of adsorbed layer can be calculated
plot of t versus p for non-porous materials is the same (has beenchecked experimentally)
t-plot helps in interpretation
0.354 nm

Kelvin EquationShape of t-plots
nm354.0m
ad n
nt
t
n a d
t
n a d
t
n a d
N o n - p o r o u s M i c r o p o r o u sM i c r o - a n d
m e s o p o r o u s
S t
S m e s o p o r e s
p
n a d
A d s o r p t i o n i s o t h e r m
t = f ( p )
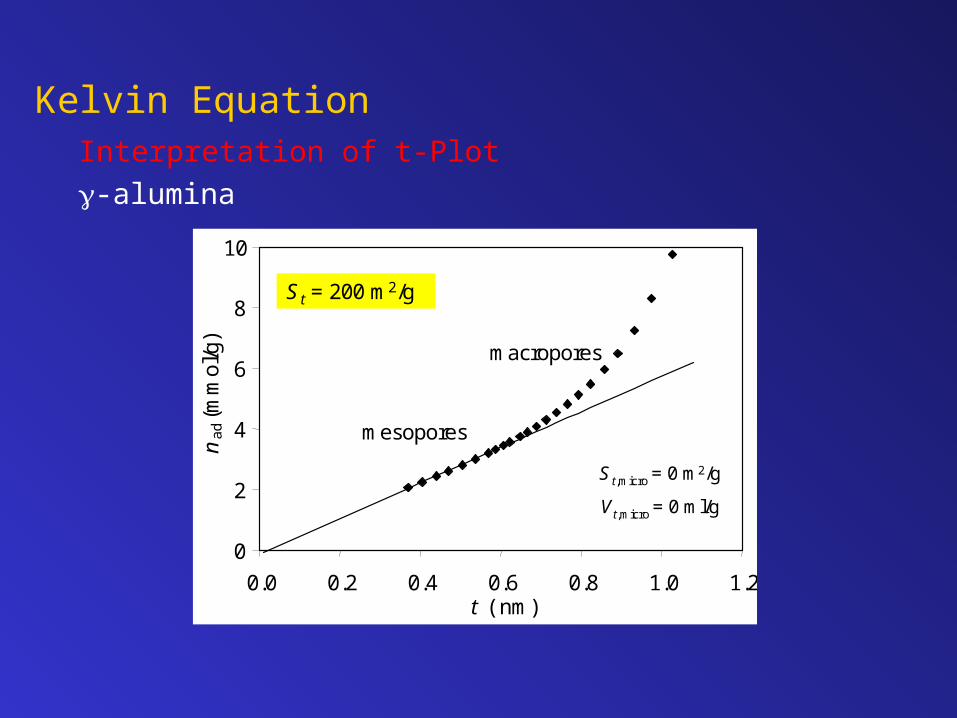
Kelvin EquationInterpretation of t-Plot
-alumina
0
2
4
6
8
10
0.0 0.2 0.4 0.6 0.8 1.0 1.2t ( nm)
na
d (m
mol
/g)
St,micro= 0 m2/g
V t,micro = 0 ml/g
mesopores
macropores
St,micro = 0 m2/g
Vt,micro = 0 ml/g
St = 200 m2/g

Kelvin EquationPore Size Distribution
-alumina
0.0
0.1
0.2
0.3
0.4
0.5
1 10 100 1000
dp (nm)
dV/d
d (m
l/g/n
m)
r = t + 2V
RTIn P0
P
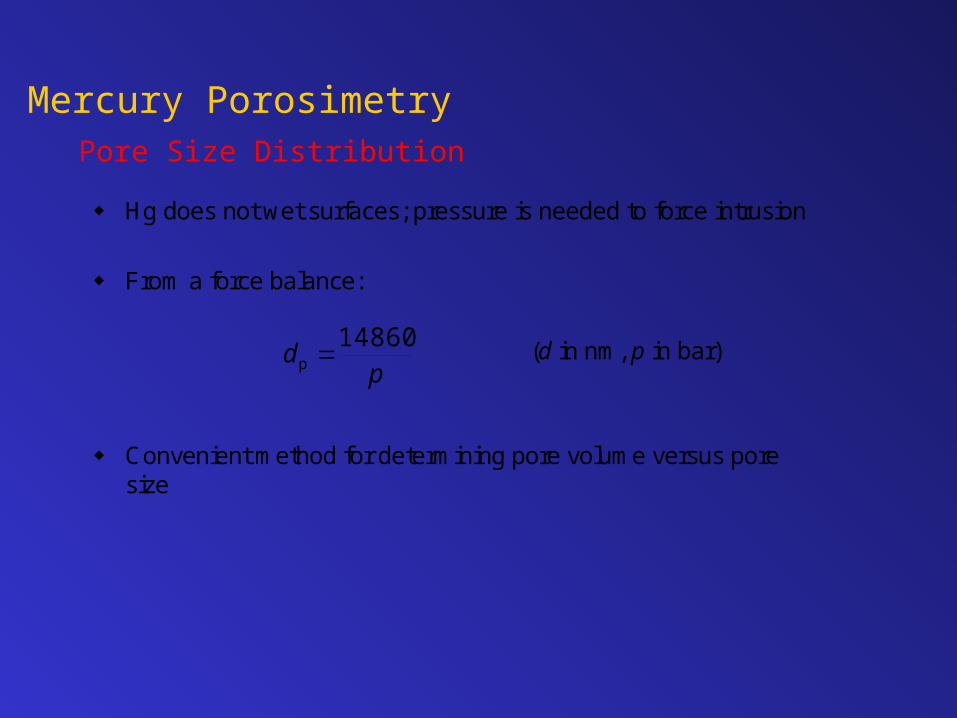
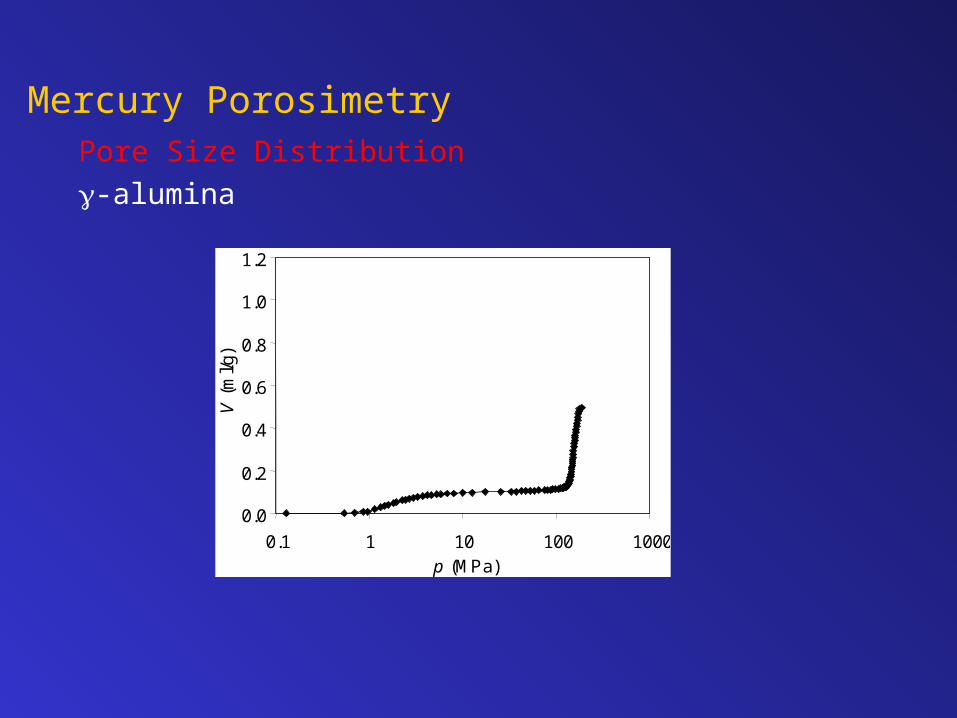
Mercury PorosimetryPore Size Distribution
Hg does not wet surfaces; pressure is needed to force intrusion
From a force balance:
(d in nm, p in bar)
Convenient method for determining pore volume versus poresize
pd
14860p
0.0
0.2
0.4
0.6
0.8
1.0
1.2
0.1 1 10 100 1000p (MPa)
V (
ml/g
)
Mercury PorosimetryPore Size Distribution
-alumina
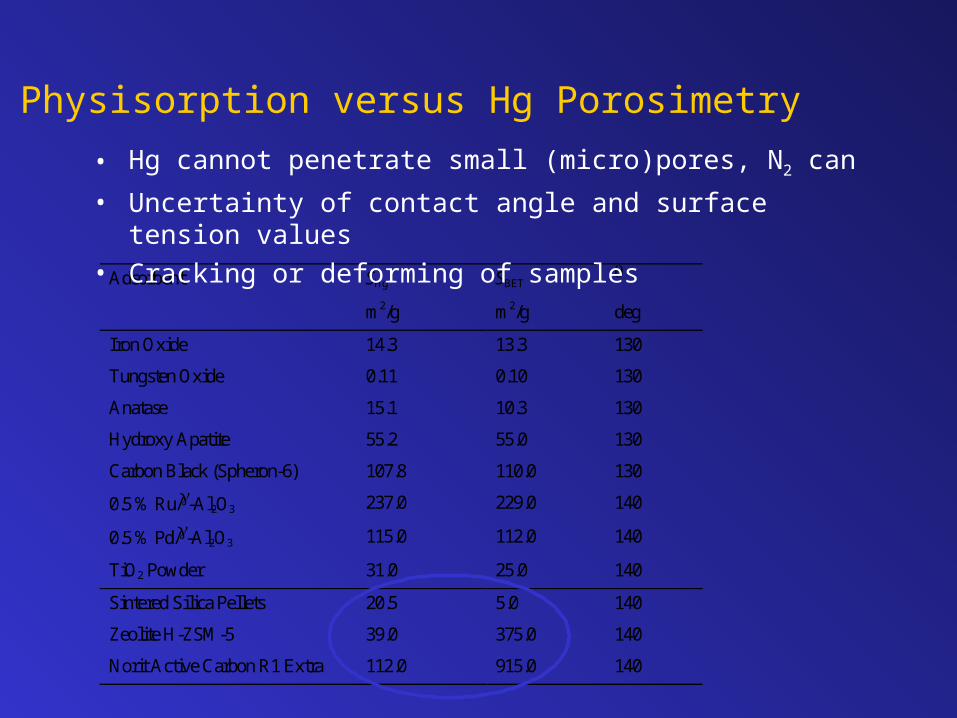
N2 Physisorption versus Hg Porosimetry
Adsorbent SHg SBET
m2/g m2/g deg
Iron Oxide 14.3 13.3 130
Tungsten Oxide 0.11 0.10 130
Anatase 15.1 10.3 130
Hydroxy Apatite 55.2 55.0 130
Carbon Black (Spheron-6) 107.8 110.0 130
0.5 % Ru/-Al2O3 237.0 229.0 140
0.5 % Pd/-Al2O3 115.0 112.0 140
TiO2 Powder 31.0 25.0 140
Sintered Silica Pellets 20.5 5.0 140
Zeolite H-ZSM-5 39.0 375.0 140
Norit Active Carbon R1 Extra 112.0 915.0 140
• Hg cannot penetrate small (micro)pores, N2 can
• Uncertainty of contact angle and surface tension values
• Cracking or deforming of samples

Texture Data on Common Catalysts
N2-physisorption Hg-porosimetry
SBET St Vp dp SHg Vp dp
m2/g m2/g ml/g nm m2/g ml/g nm
Wide Pore Silica 78 52 0.91 47 80 0.92 54
-Alumina 196 202 0.49 10 163 0.49 10
-Alumina 9 8 0.12 112 12 0.48 150
Active Carbon 1057a 28 0.51 2 0.6 0.46 106
Raney Ni 76 - 0.14 5.80 - - -
ZSM-5 345 344 0.19 0.58 11 1.1 820b
a p/p0 range of 0.01-0.1 was used in the calculation.b intraparticle voids.
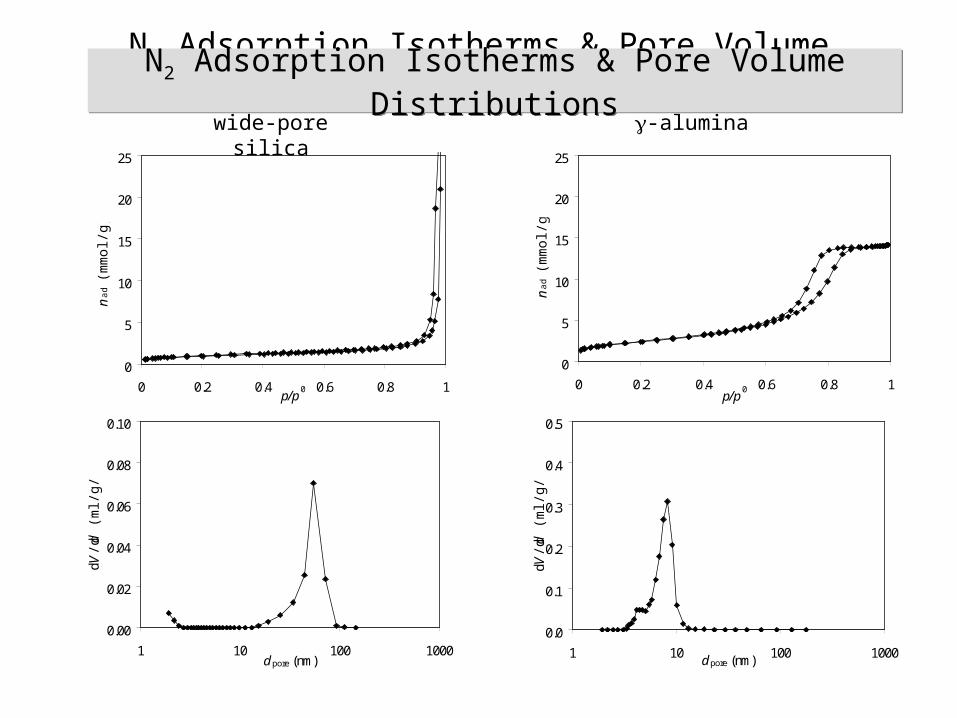
N2 Adsorption Isotherms & Pore Volume Distributions
0
5
10
15
20
25
0 0.2 0.4 0.6 0.8 1p/p
0
nad
(m
mol
/g) 1
wide-pore silica -alumina
0
5
10
15
20
25
0 0.2 0.4 0.6 0.8 1p/p
0
nad
(m
mol
/g) 1
0.00
0.02
0.04
0.06
0.08
0.10
1 10 100 1000d pore (nm)
dV/d
d (
ml/
g/nm
)
0.0
0.1
0.2
0.3
0.4
0.5
1 10 100 1000d pore (nm)
dV/d
d (
ml/
g/nm
)
N2 Adsorption Isotherms & Pore Volume DistributionsN2 Adsorption Isotherms & Pore Volume Distributions
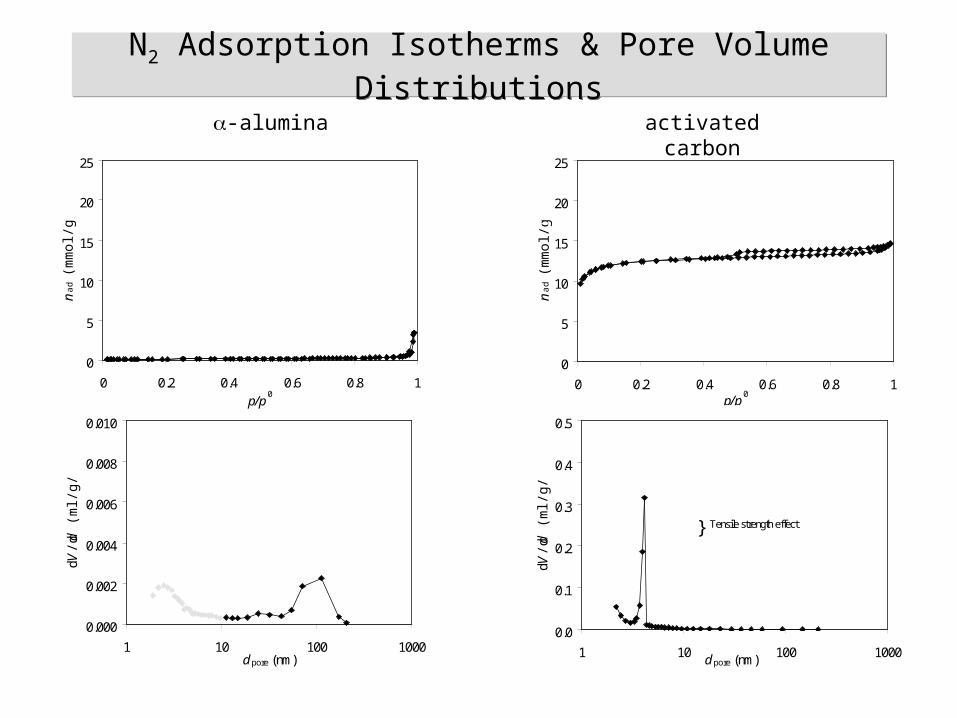
N2 Adsorption Isotherms & Pore Volume DistributionsN2 Adsorption Isotherms & Pore Volume Distributions
-alumina activated carbon
0
5
10
15
20
25
0 0.2 0.4 0.6 0.8 1p/p
0
nad
(m
mol
/g)
1
0
5
10
15
20
25
0 0.2 0.4 0.6 0.8 1p/p
0
nad
(m
mol
/g) 1
0.000
0.002
0.004
0.006
0.008
0.010
1 10 100 1000d pore (nm)
dV/d
d (
ml/
g/nm
)
0.0
0.1
0.2
0.3
0.4
0.5
1 10 100 1000d pore (nm)
dV/d
d (
ml/
g/nm
)} Tensile strength effect

Raney Ni ZSM-5
0
5
10
15
20
25
0 0.2 0.4 0.6 0.8 1p/p
0
nad
(m
mol
/g) 1
0
5
10
15
20
25
0 0.2 0.4 0.6 0.8 1p/p
0
nad
(m
mol
/g) 1
0.00
0.02
0.04
0.06
0.08
0.10
1 10 100 1000d pore (nm)
dV/d
d (
ml/
g/nm
)
0
2
4
6
8
10
0.0 0.5 1.0 1.5 2.0d pore (nm)
dV/d
d (
ml/
g/nm
)
N2 Adsorption Isotherms & Pore Volume DistributionsN2 Adsorption Isotherms & Pore Volume Distributions

wide-pore silica -alumina
0.0
0.2
0.4
0.6
0.8
1.0
1.2
0.1 1 10 100 1000p (MPa)
V (
ml/
g)
0.0
0.2
0.4
0.6
0.8
1.0
1.2
0.1 1 10 100 1000
p (MPa)
V (
ml/
g)
0
0.02
0.04
0.06
0.08
1 10 100 1000 10000
d pore (nm)
dV/d
d (
ml/
g/nm
)
0.0
0.1
0.2
0.3
0.4
0.5
1 10 100 1000 10000d pore (nm)
dV/d
d (
ml/
g/nm
)
Hg Intrusion Curves & Pore Volume DistributionsHg Intrusion Curves & Pore Volume Distributions

Hg Intrusion Curves & Pore Volume DistributionsHg Intrusion Curves & Pore Volume Distributions
-alumina activated carbon
0.0
0.2
0.4
0.6
0.8
1.0
1.2
0.1 1 10 100 1000p (MPa)
V (
ml/
g)
0.0
0.2
0.4
0.6
0.8
1.0
1.2
0.1 1 10 100 1000p (MPa)
V (
ml/
g)
0.000
0.001
0.002
0.003
0.004
0.005
1 10 100 1000 10000d pore (nm)
dV/d
d (
ml/
g/nm
)
0.000
0.002
0.004
0.006
0.008
0.010
1 10 100 1000 10000d pore (nm)
dV/d
d (
ml/
g/nm
)

Raney Ni ZSM-5
0.0
0.2
0.4
0.6
0.8
1.0
1.2
0.1 1 10 100 1000
p (MPa)
V (
ml/
g)
0.0
0.2
0.4
0.6
0.8
1.0
1.2
0.1 1 10 100 1000p (MPa)
V (
ml/
g)
0.00
0.02
0.04
0.06
0.08
0.10
1 10 100 1000 10000
d pore (nm)
dV/d
d (
ml/
g/nm
)
0
0.001
0.002
0.003
0.004
0.005
1 10 100 1000 10000 100000d pore (nm)
dV/d
d (
ml/
g/nm
)
Hg Intrusion Curves & Pore Volume DistributionsHg Intrusion Curves & Pore Volume Distributions

BET- & t-plotsBET- & t-plotswide-pore silica -alumina
0.0
0.1
0.2
0.3
0.4
0.5
0.00 0.05 0.10 0.15 0.20 0.25 0.30
p/p 0
p/[
nad
(p0 -p
)] (
g/m
mol
)
S BET = 78 m2/g
C = 146
0.0
0.1
0.2
0.3
0.4
0.5
0.00 0.05 0.10 0.15 0.20 0.25 0.30p/p 0
p/[
nad
(p0 -p
)] (
g/m
mol
)
S BET = 196 m2/g
C = 97
0.0
0.5
1.0
1.5
2.0
2.5
0.0 0.2 0.4 0.6 0.8 1.0 1.2t ( nm)
nad
(mm
ol/g
)
S t,micro=28 m2/g
V t,micro = 0.013 ml/g
0
2
4
6
8
10
0.0 0.2 0.4 0.6 0.8 1.0 1.2t ( nm)
nad
(mm
ol/g
)
S t,micro= 0 m2/g
V t,micro = 0 ml/g

-alumina activated carbon
0.0
0.1
0.2
0.3
0.4
0.5
0.00 0.05 0.10 0.15 0.20 0.25 0.30p/p
0
p/[
nad
(p0 -p
)] (
g/m
mol
)
S BET = 9.3 m2/g
C = 142
0.0
0.1
0.2
0.3
0.4
0.5
0.00 0.05 0.10 0.15 0.20 0.25 0.30
p/p0
p/[
nad
(p0 -p
)] (g
/mm
ol)
SBET = 1057 m2/gC = 1057
p/p0 = 0.01 - 0.1
0.00
0.05
0.10
0.15
0.20
0.25
0.0 0.2 0.4 0.6 0.8 1.0 1.2t ( nm)
nad
(m
mol
/g)
S t, micro= 1.4 m2/g
V t,mcro = 0.001 ml/g
0
5
10
15
0.0 0.2 0.4 0.6 0.8 1.0 1.2t ( nm)
nad
(m
mol
/g)
S t,micro = 856 m2/g
V t,micro = 0.42 ml/g
BET- & t-plotsBET- & t-plots

Raney Ni ZSM-5
0.0
0.1
0.2
0.3
0.4
0.5
0.00 0.05 0.10 0.15 0.20 0.25 0.30
p/p 0
p/[
nad
(p0 -p
)] (
g/m
mol
)
S BET = 76 m2/g
C = 46
0.0
0.1
0.2
0.3
0.4
0.5
0.00 0.05 0.10 0.15 0.20 0.25 0.30p/p
0
p/[
nad
(p0 -p
)] (
g/m
mol
)
SBET = 345 m2/g
C = -245
p/p0 : 0.01 -0.1
0
1
2
3
4
5
0.0 0.2 0.4 0.6 0.8 1.0 1.2t ( nm)
n ad
(mm
ol/g
)
St,micro = 0 m2/g
Vt,micro = 0 ml/g
0
2
4
6
0.0 0.2 0.4 0.6 0.8 1.0 1.2t ( nm)
n ad
(mm
ol/g
)
St ,micro= 344 m2/g
Vt ,micro = 0.18 ml/g
BET- & t-plotsBET- & t-plots

ChemisorptionSurface Characterization
• Specific surface area of phases
• Types of active sites
• Number of active sites
• Reactivity of active sites
• Stability of active sites
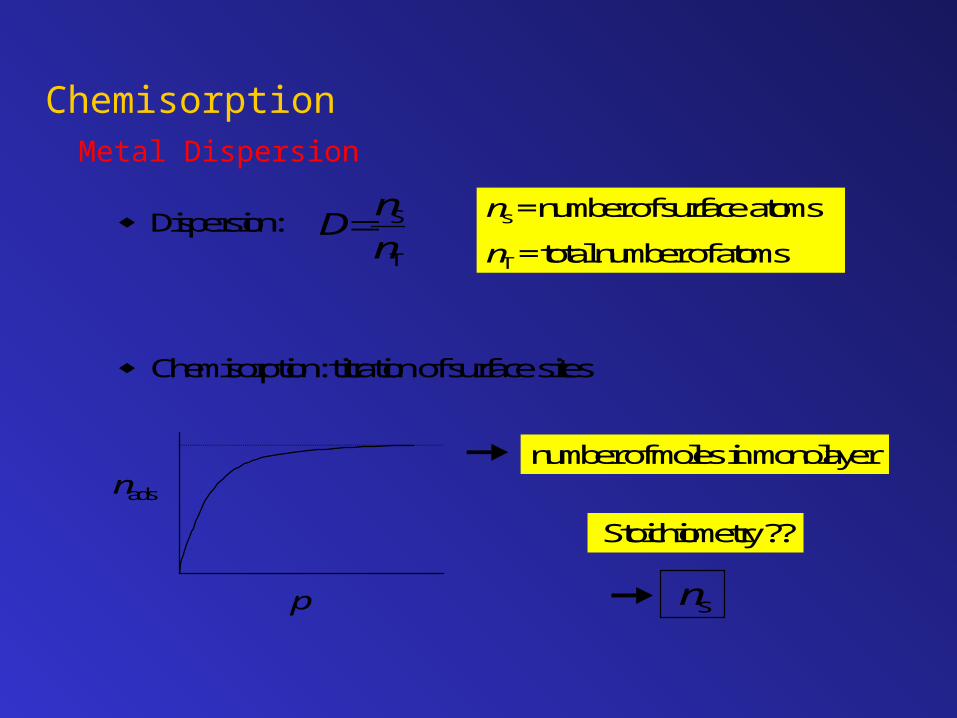
ChemisorptionMetal Dispersion
Dn
n S
T
Dispersion:
Chemisorption: titration of surface sites
ns = number of surface atoms
nT = total number of atoms
p
nads
number of moles in monolayer
Stoichiometry ??
ns
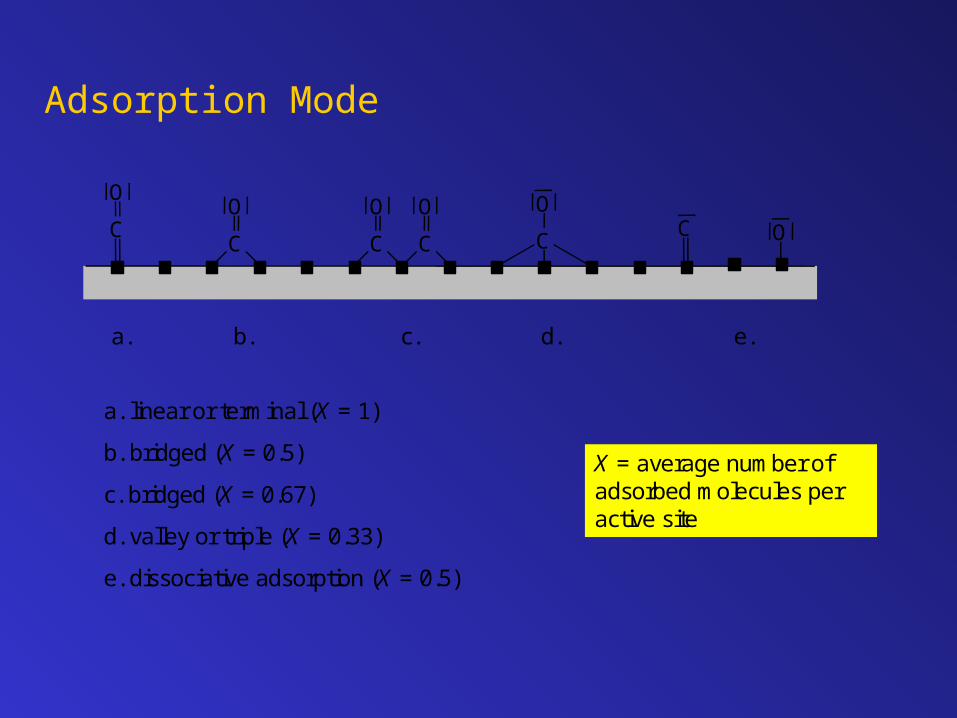
Adsorption Mode
O
CC
O
C
O
C
O
C
OC O
a. b. c. d. e.
a. linear or terminal (X = 1)
b. bridged (X = 0.5)
c. bridged (X = 0.67)
d. valley or triple (X = 0.33)
e. dissociative adsorption (X = 0.5)
X = average number ofadsorbed molecules peractive site

Adsorption Stoichiometry
Metal N2O/Me H/Me CO/Me
Pt 1 1
Cu 0.5 poor H2 dissociationcatalyst
1
Ni 0.67 1 carbonyl formation!
Rh d > 2 nmRh d < 2 nm
12
1

Particle Size and Dispersion
dV
S DVS 61A
A
Dn
n S
T
D most fundamental parameter
dVS most convenient for measuring directly (XRD, EM)
dVS(nm)
D
Ni
Pt
15
10
5
00.0 0.5 1.0
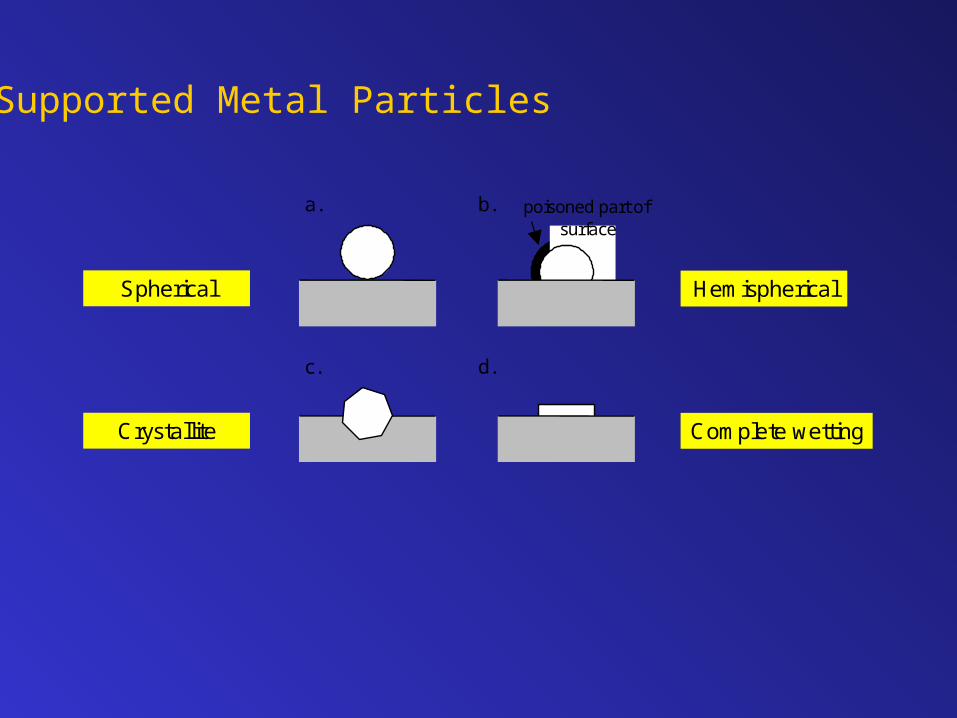
Supported Metal Particles
a.
c.
b.
d.
poisoned part ofsurface
Spherical
Crystallite
Hemispherical
Complete wetting

Number of Surface Atoms
Metalpart. size ca 5 nm33% (111) plane33% (100) plane33% (110) plane
(atoms.nm-2)
part. size ca 15 nm70% (111) plane25% (100) plane5% (110) plane
(atoms.nm-2)
Co 15.1 -
Ni 15.4 17.5
Pt 12.5 14.2
Pd 12.7 14.5
Ru 16.3 -
Rh 13.3 15.5
Cu 14.7 16.7
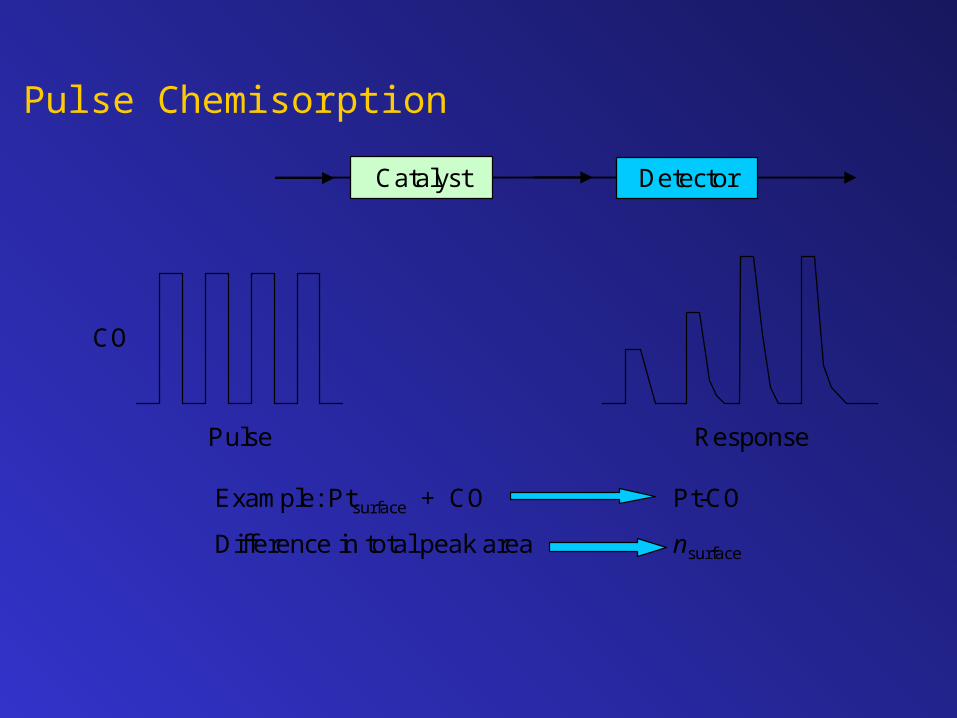
Pulse Chemisorption
Catalyst Detector
CO
Pulse Response
Example: Ptsurface + CO Pt-CO
Difference in total peak area nsurface

Pulse Chemisorption
0.0
1.0
0 1Time of analysis
Det
ecto
r si
gnal
CO chemisorption on reduced 5wt% Pt/Al2O3
TCD signals after CO pulses
0.00
0.02
0.04
0.06
0.08
0 0.5 1 1.5
Pulsed volume (ml)n
ad (
mm
ol/g
)
S Pt = 3 m2/g
D Pt = 24 %
SPt = 3 m2/g
DPt = 24 %
CO chemisorption on reduced 5wt% Pt/Al2O3
Cumulative amount of chemisorbed CO
Monolayer capacity: 0.06 mmol / g Pt
On-line Thermoconductivity Detector
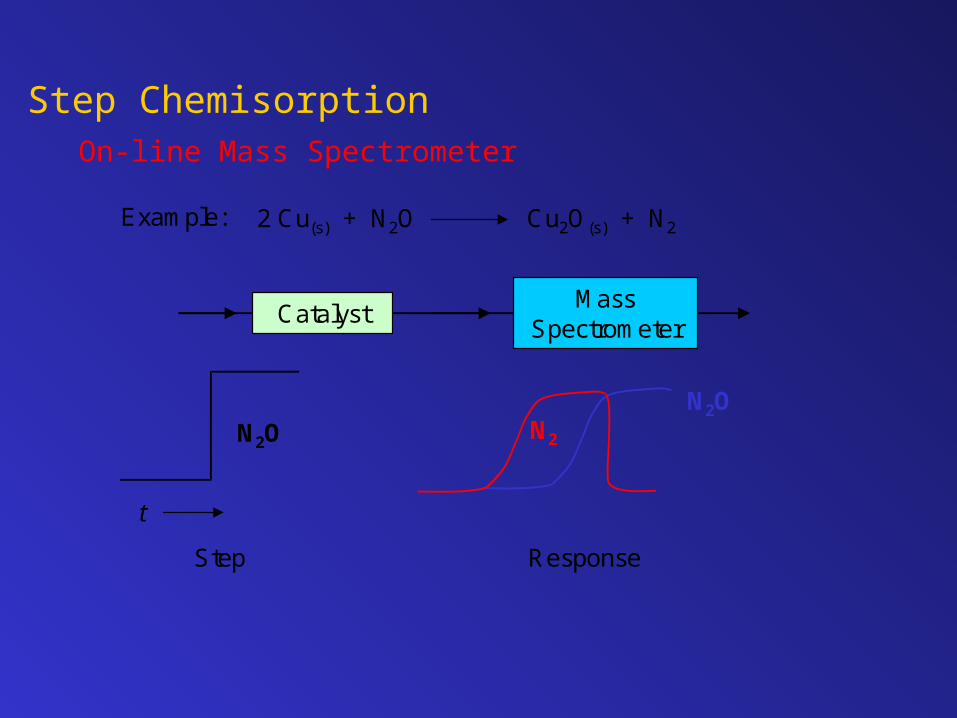
Step ChemisorptionOn-line Mass Spectrometer
Example: 2 Cu(s) + N2O Cu2O(s) + N2
CatalystMass
Spectrometer
t
N2ON2O
N2
Step Response

Temperature Programmed DesorptionAdsorption Site Differentiation
NH3 desorption from HZSM-5
Weak acid sites
Strong acid sites
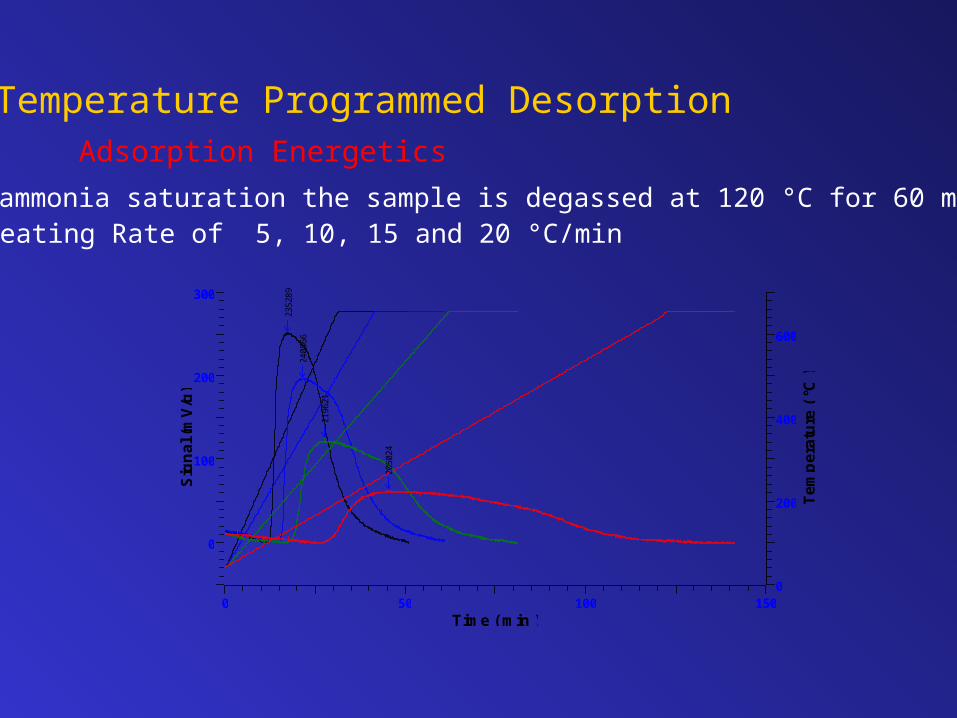
Temperature Programmed DesorptionAdsorption Energetics
After ammonia saturation the sample is degassed at 120 °C for 60 minutes
2352
89
2408
66
2196
21
2050
24
150Time ( min )
0 50 100 150
300
Sig
na
l (m
V/g
)
0
100
200
300
600
Te
mp
era
ture
( °
C )
0
200
400
600
Heating Rate of 5, 10, 15 and 20 °C/min

Temperature Programmed DesorptionAdsorption Energetics
Desorption Energy Calculation
9.8
10
10.2
10.4
10.6
10.8
11
11.2
0.0015 0.00155 0.0016 0.00165 0.0017 0.00175 0.0018 0.00185 0.0019
1/Tp (K)
Ln
(Tp
2/b
eta)
Beta (K/min) Tp °C Tp K Tp2 1/Tp K Ln(Tp2/beta) 5 266 539 290521 0.0018552 10.9699
10 311 584 341056 0.0017123 10.4372 15 356 629 395641 0.0015898 10.1802 20 382 655 429025 0.0015267 9.9735
Beta = heating rate [K / min]Tp = maximum desorption peak temperatureEd = Desorption energy [Kj / mole]A = Arrhenius factorR = 8.314451 [J / mol K]
12.49A factor
24.51Ed (kJ/mole)
5.4639Intercept
2948.07Slope
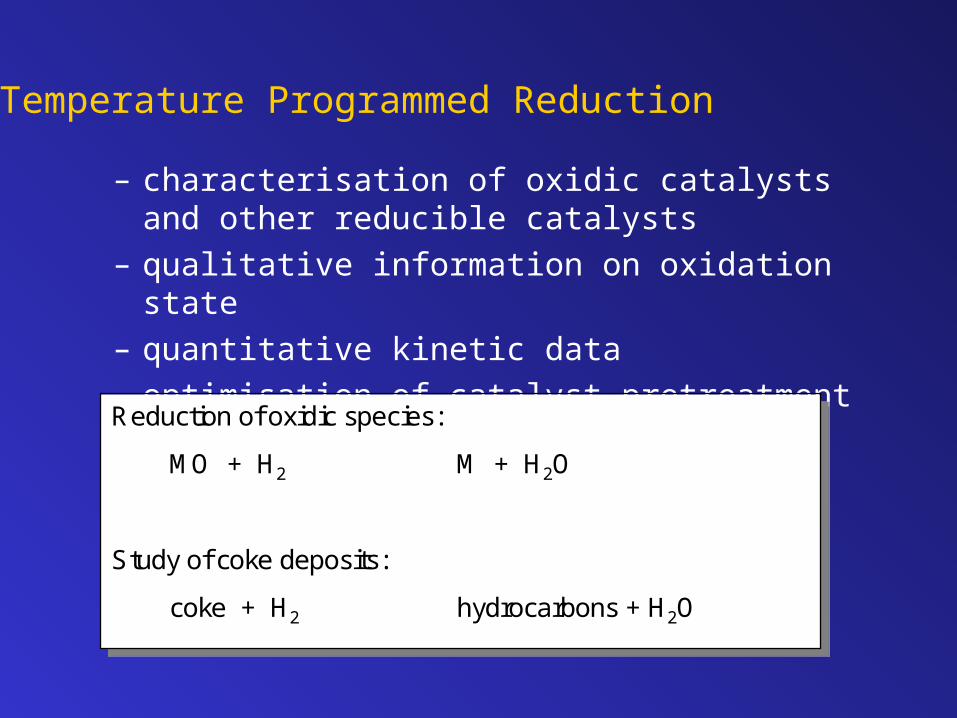
Temperature Programmed Reduction
– characterisation of oxidic catalysts and other reducible catalysts
– qualitative information on oxidation state
– quantitative kinetic data
– optimisation of catalyst pretreatment
Reduction of oxidic species:
Study of coke deposits:
Reduction of sulphides:
MO + H2 M + H2O
coke + H2 hydrocarbons + H2O
MS + H2 M + H2S
Reduction of oxidic species:
Study of coke deposits:
Reduction of sulphides:
MO + H2 M + H2O
coke + H2 hydrocarbons + H2O
MS + H2 M + H2S
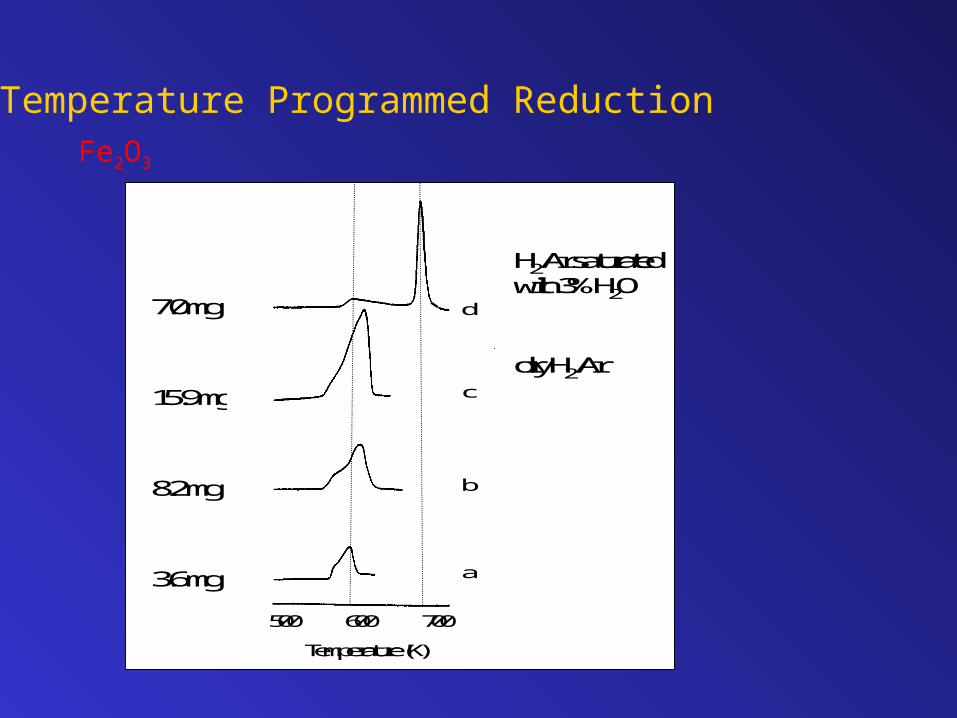
Temperature Programmed ReductionFe2O3
7.0 mg
15.9 mg
8.2 mg
3.6 mg
H2/Ar saturatedwith 3% H2O
dry H2/Ar
500 600 700
Temperature (K)
d
c
b
a

Temperature Programmed ReductionFe2O3
0.2 K/min3.6 mg
0.5 K/min2.8 mg
1.0 K/min1.8 mg
2.0 K/min0.91 mg
5.0 K/min0.19 mg
10.0 K/min0.08 mg
500 600 700
Temperature (K)
f
c
b
a
d
e
Dry H2/Ar
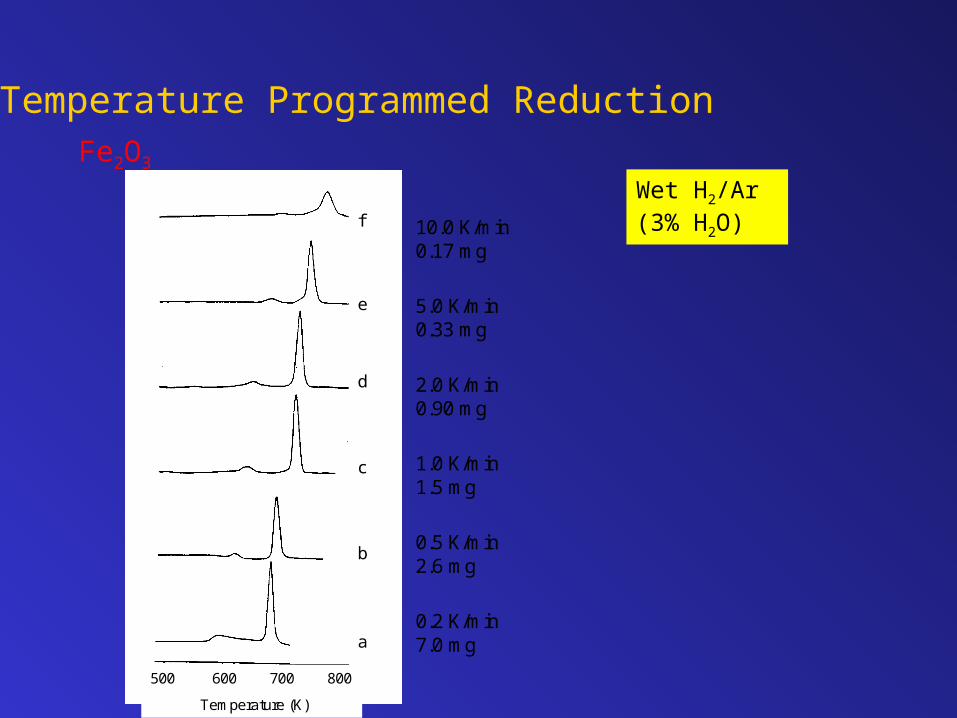
0.2 K/min7.0 mg
0.5 K/min2.6 mg
1.0 K/min1.5 mg
2.0 K/min0.90 mg
5.0 K/min0.33 mg
10.0 K/min0.17 mg
500 600 700 800
Temperature (K)
f
c
b
a
d
e
Wet H2/Ar (3% H2O)
Temperature Programmed ReductionFe2O3
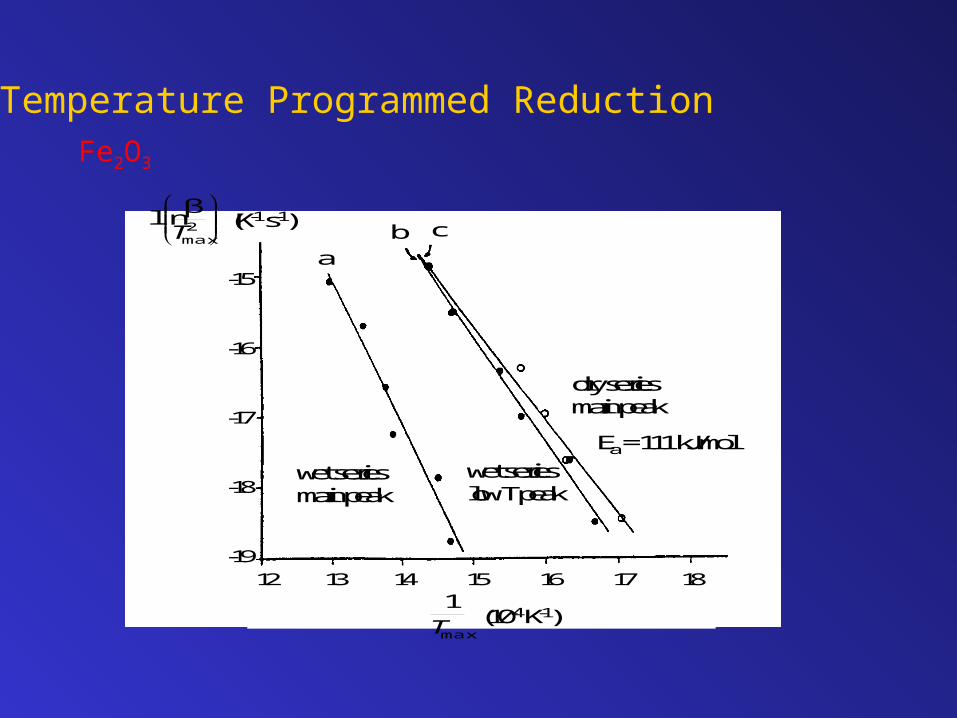
ab c(K-1 s-1)
-15
-16
-17
-18
-19
2max
βln
T
max
1T
(10-4 K-1)
12 13 14 15 16 17 18
wet seriesmain peak
wet serieslow T peak
dry seriesmain peak
Ea = 111 kJ/mol
Temperature Programmed ReductionFe2O3

Kinetic Models for ReductionModel f() g()nth Order
Random nucleationUnimolecular decay law
Phase boundary controlled reaction(contracting area)
Phase boundary controlled reaction(controlled volume)
Two dimensional growth of nuclei(Avrami-Erofeev)
Three dimensional growth of nuclei(Avrami-Erofeev)
One dimensional diffusionParabolic law
Two dimensional diffusion
Three dimensional diffusion(Jander)
Three dimensional diffusion(Ginstling-Brounshtein)
(1-)n
(1-)
(1-)1/2
(1-)2/3
2(1-)[-ln(1-)]1/2
3(1-)[-ln(1-)]2/3
1/2
-1/ln(1-)
[3(1-)2/3]/ [2(1-(1-)1/3)]
3/[2((1-)-1/3 -1)]
(1-(1-)1-n)/(1-n)
-ln(1-)
2(1-(1-)1/2)
3(1-(1-)1/3)
[-ln(1-)]1/2
[-ln(1-)]1/3
2
(1-)ln(1-) +
[1-(1-)1/3]2
1-2/3 - (1-)2/3

Infrared Spectroscopy
Applications:
Catalyst characterisation– direct measurement of catalyst IR spectrum– measurement of interaction with “probe” molecules:
• NH3, pyridine: acidity• CO, NO: nature of active sites (e.g. Pt on alumina)
Mechanistic studies– adsorbed reaction intermediates– deactivation by strongly adsorbing species
Analysis of reactants and products (in situ reactionmonitoring
Electromagnetic Spectrum
UV Visible IR
4000 - 400 cm-1
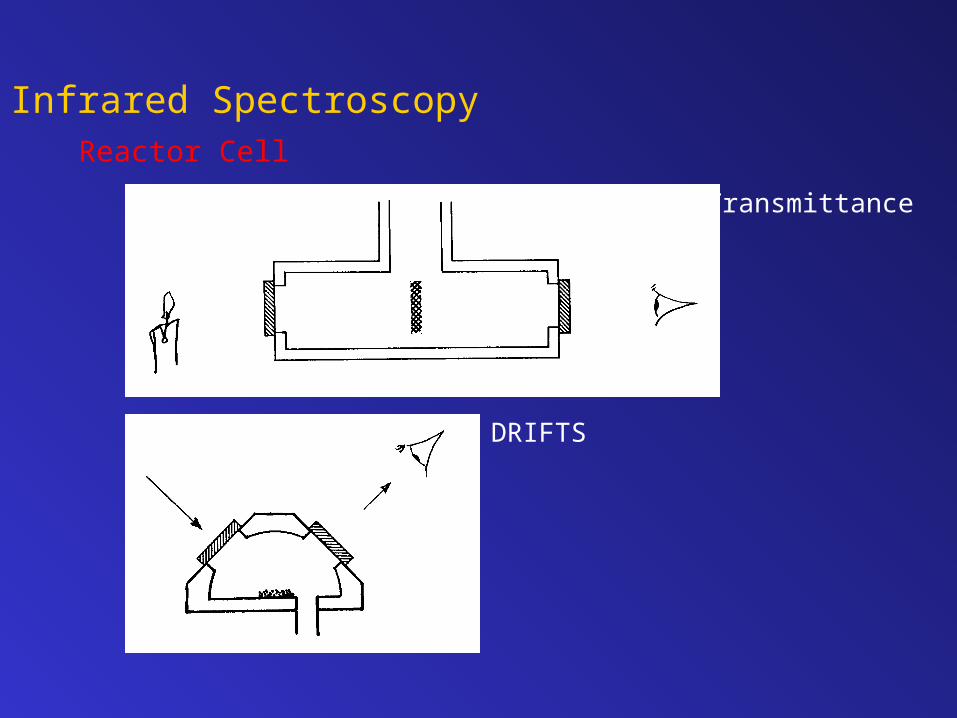
Infrared SpectroscopyReactor Cell
DRIFTS
Transmittance
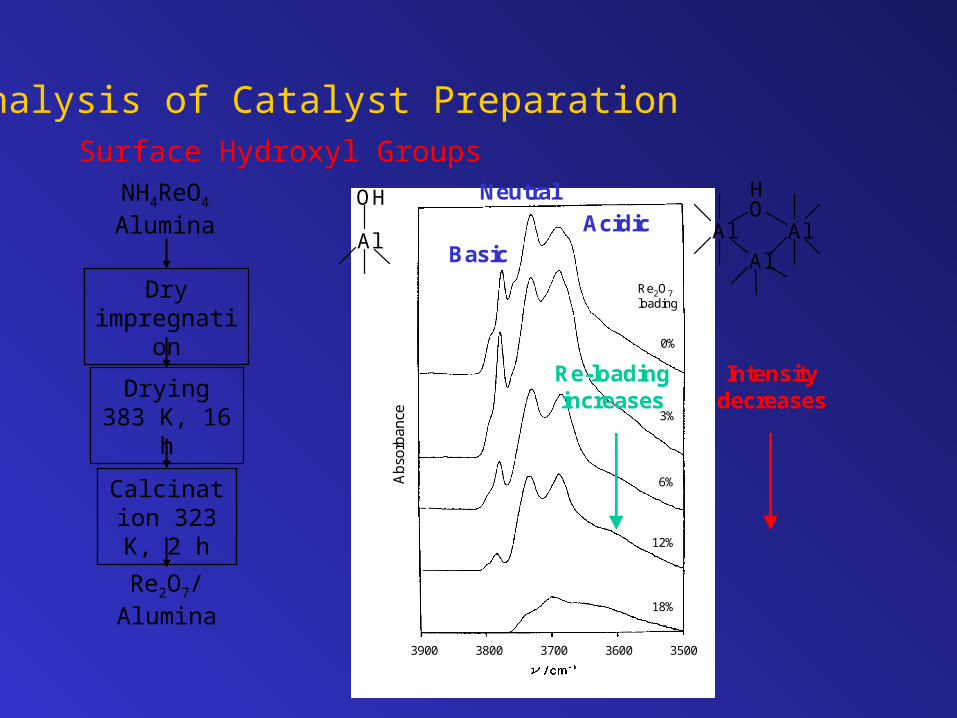
Analysis of Catalyst PreparationSurface Hydroxyl Groups
NH4ReO4
Alumina
Dry impregnation
Drying 383 K, 16 h
Calcination 323 K, 2 h
Re2O7/
Alumina
Abs
orba
nce
3900 3800 3700 3600 3500
0%
3%
6%
12%
18%
Re2O7loading
Basic
Neutral
AcidicAl
OH
AlO
Al
Al
H
Intensitydecreases
Re-loadingincreases
Re
OO O
O
A l
Re
OO O
O
A l A l
Re
O HOO
O
A l3+
–
+
a b cR eO 4 on Lew is s ite
no t ac tive
B as ic -O Hsubstitu ted by R eO 4
s ligh tly ac tive
A c id ic -O Hsubstitu ted by R eO 4
active
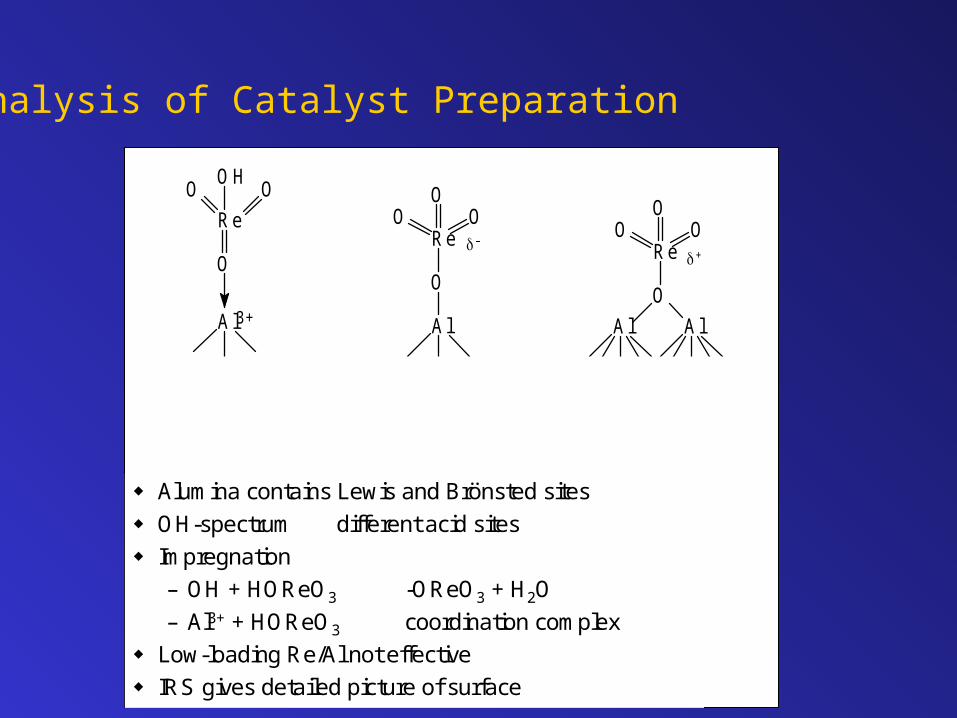
Analysis of Catalyst Preparation
Alumina contains Lewis and Brönsted sites
OH-spectrum different acid sites
Impregnation
– OH + HOReO3 -OReO3 + H2O
– Al3+ + HOReO3 coordination complex
Low-loading Re/Al not effective
IRS gives detailed picture of surface

IR Probe MoleculeAcidity Measurement
N
Pyridine adsorbs on acid sites
Spectrum changes
N
Lewis acid
N
Brönsted acid
Different IR Spectra
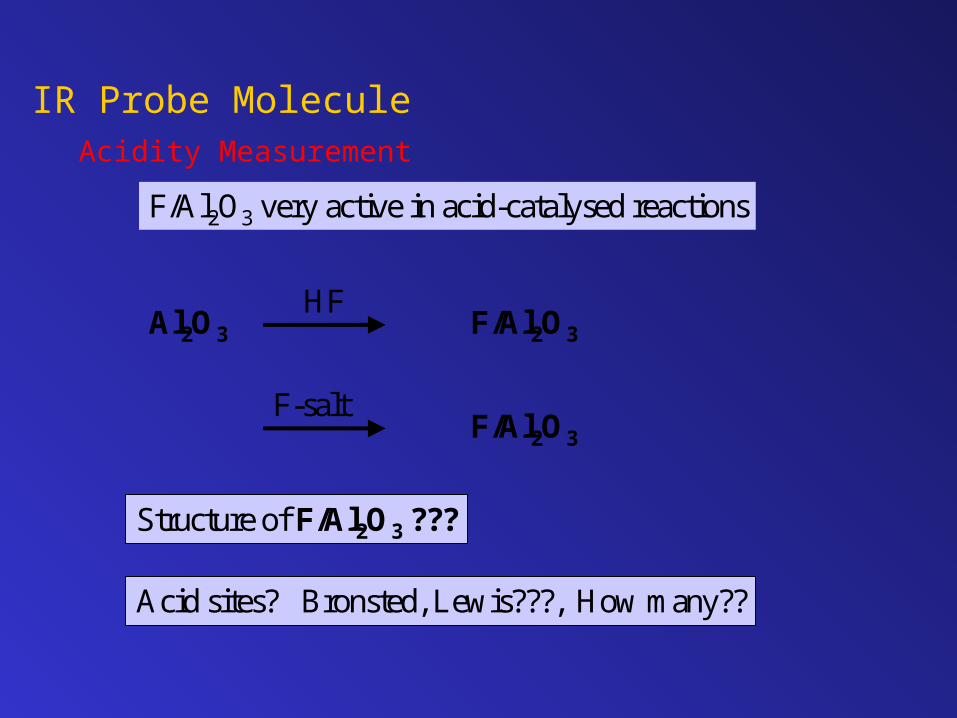
F/Al2O3 very active in acid-catalysed reactions
Al2O3 F/Al2O3
F/Al2O3
HF
F-salt
Structure of F/Al2O3 ???
Acid sites? Bronsted, Lewis???, How many??
IR Probe MoleculeAcidity Measurement

Kelvin EquationPore Size Distribution
no reaction with HCl with BH3
1438 vs 1487 vs 1458 s1482 m 1536 s 1488 s1585 vs 1610 m 1587 m1601 m 1636 m 1621 vsvs: very strong; s: strong; m: medium
N
B
ClClCl
N
H+ Cl-1700 1600 1500 1400
(cm-1)
B
B
L L
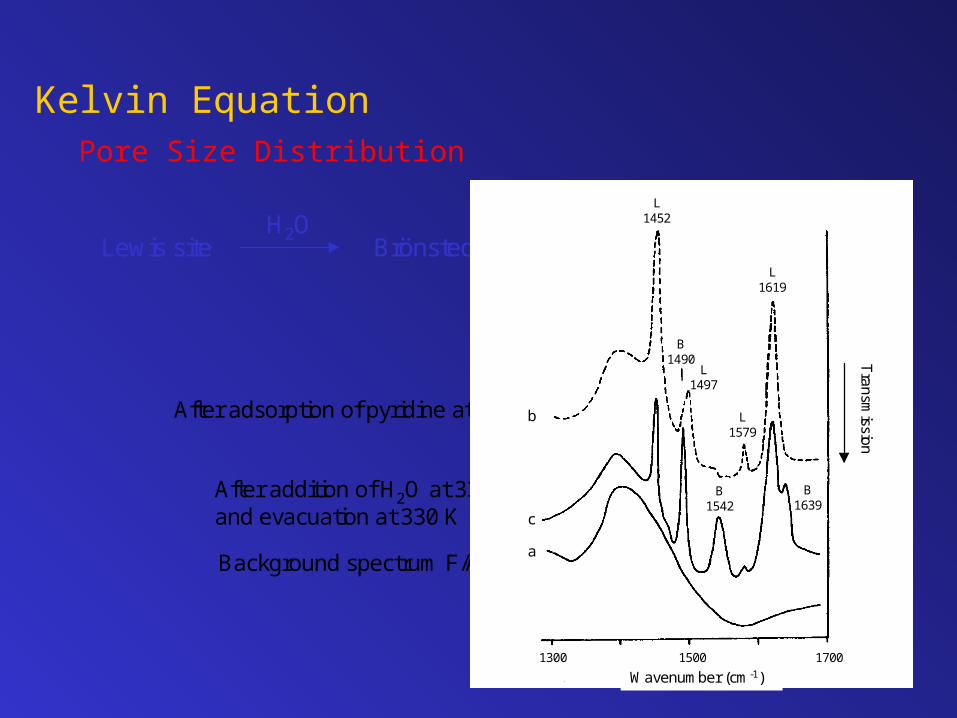
Kelvin EquationPore Size Distribution
Background spectrum F/Al2O3
After addition of H2O at 330 Kand evacuation at 330 K
After adsorption of pyridine at 330 K
Lewis site Brönsted siteH2O
Wavenumber (cm-1)1300 1500 1700
Transm
ission
L1452
L1619
B1639
B1490
L1497
L1579
B1542
b
c
a

In-Situ Reaction Study
UV / min
0
26
46
66
86
106
126
146
166
186
UVair 60
Figure 2a TCE on P-11t on 21/3/01
800 1200 1600 2000 2400
Wavenumber / (cm-1)
2345
2365
950 1263850
1413
1589
2400 2800 3200 3600 4000
Wavenumber / (cm-1)
1415
1610
1649
1747
1787
3105
1234
1568
1602
3452
32982978
3751 3868
TCE Photocatalytic Oxidation
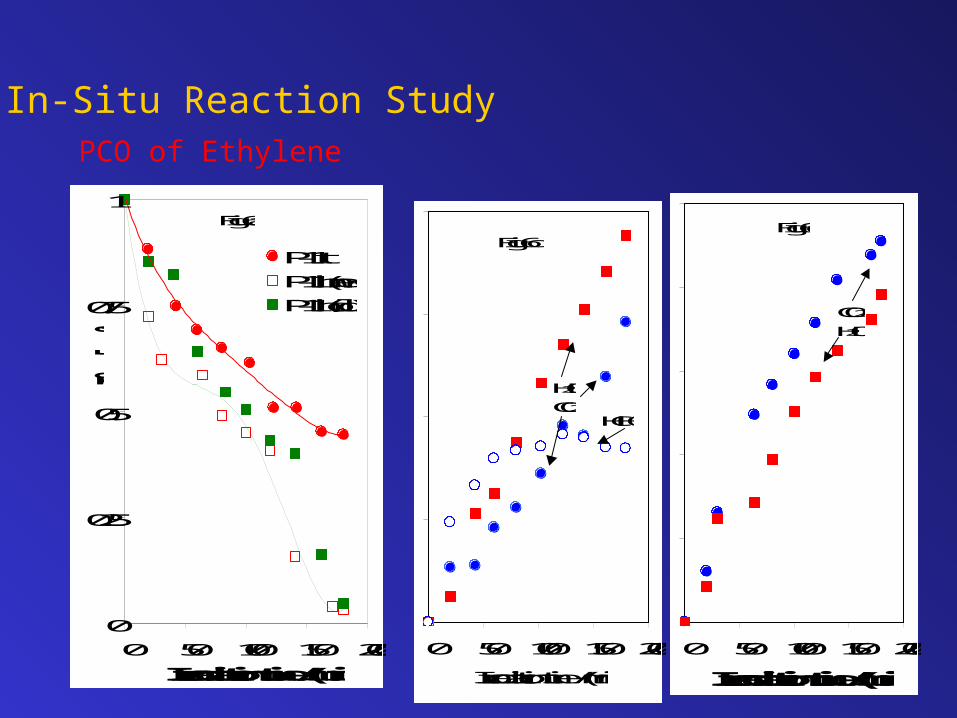
In-Situ Reaction StudyPCO of Ethylene
0
0.25
0.5
0.75
1
0 50 100 150 200
Irradiation time / (min)
I95
0(=
C-H
)
P-11t
P-11h(new)
P-11h(old)
Fig. 6a
0 50 100 150 200
Irradiation time / (min)
CO2
H2O
Fig. 6c
0 50 100 150 200
Irradiation time / (min)
Fig. 6c
H2O
CO2HCHO
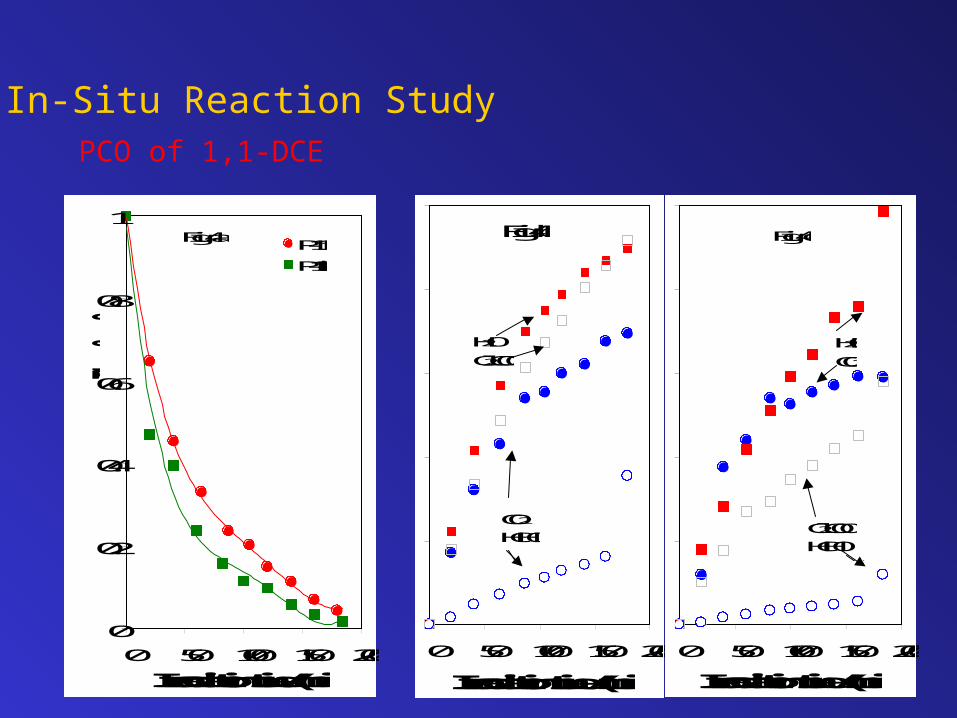
In-Situ Reaction StudyPCO of 1,1-DCE
0 50 100 150 200
Irradiation time / (min)
CO2HCHO
H2O
Cl2COO
Fig. 4b
0
0.2
0.4
0.6
0.8
1
0 50 100 150 200
Irradiation time/ (min)
I10
95
(-C
Cl)
P-11t
P-11h
Fig. 4a
0 50 100 150 200
Irradiation time / (min)
H2O
CO2
Fig. 4c
Cl2COO
HCHO

In-Situ Reaction StudyPCO of cis-1,2-DCE
0 50 100 150 200
Irradiation time / (min)
H2OHCHO
CO2
Cl2CCO
Fig. 2c
0 50 100 150 200
Irradiaition time /(min)
H2OHCHO
CO2
Cl2CCOO
Fig. 2b
0
0.2
0.4
0.6
0.8
1
0 50 100 150 200Irradiation time / (min)
I 86
4(C
lC
-H
)
P-11t
P-11hFig. 2a

In-Situ Reaction StudyPCO of trans-1,2-DCE
0
0.25
0.5
0.75
1
0 50 100 150 200
Irradiation time / (min)
I89
8(C
lC
-H
)
Fig. 3a
0 50 100 150 200
Irradiation time / (min)
CO2
Cl2COO
H2OHCHO
Fig. 3b
0 50 100 150 200
Irradiaiton time / (min)
Fig. 3c
Cl2COO
CO2
HCHOH2O
H2O
HCHO
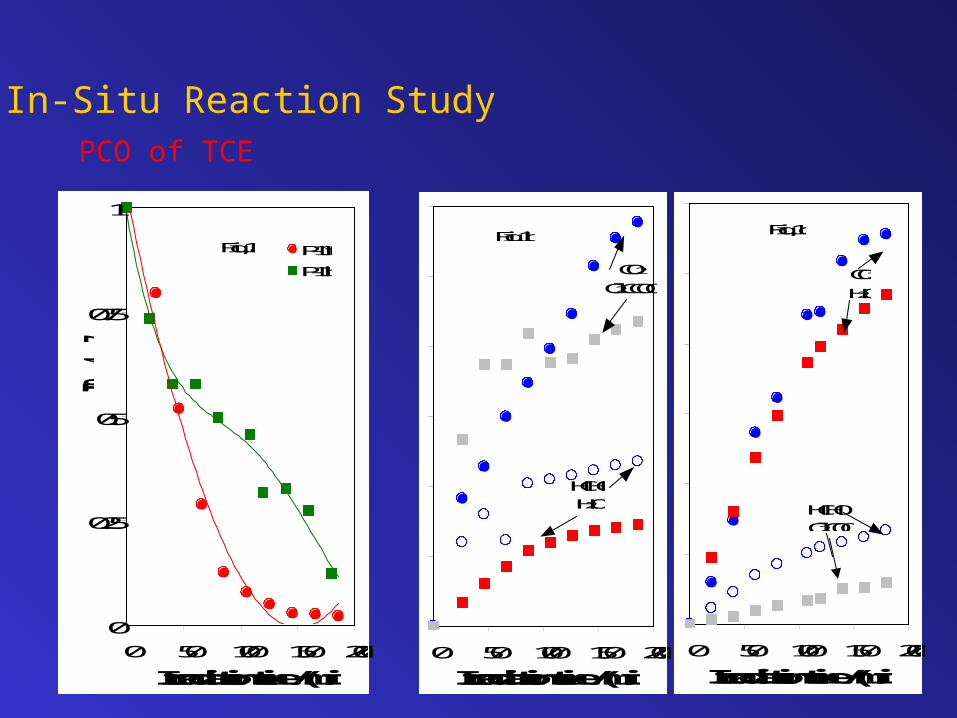
In-Situ Reaction StudyPCO of TCE
0 50 100 150 200
Irradiation time / (min)
CO2
Cl2CCOO
HCHOH2O
Fig. 1b
0 50 100 150 200
Irradiation time / (min)
CO2
H2O
Fig. 1c
HCHOCl2COO
0
0.25
0.5
0.75
1
0 50 100 150 200
Irradiation time / (min)
I94
7(C
lC
-H
)
P-11t
P-11h
Fig. 1a

In-Situ Reaction StudyPCO of Tetrachloroethylene
0
0.2
0.4
0.6
0.8
1
0 50 100 150 200
Irradiation time / (min)
I92
1?(H
-C
Cl)
P-11t
P-11h
Fig. 5a
0 50 100 150 200
Irradiation time / (min)
CO2
H2O
HCHO
Fig. 5c
0 50 100 150 200
Irradiation time / (min)
Fig. 4b
CO2HCHO
H2O


![Yeung Singapore Revised[1]](https://img.dokumen.tips/doc/110x75/577d20ad1a28ab4e1e937e54/yeung-singapore-revised1.jpg)