Embed Size (px)
Citation preview

East Tennessee State UniversityDigital Commons @ East
Tennessee State University
Electronic Theses and Dissertations Student Works
8-2017
Administrator and Teacher Attitudes TowardInclusionHeather N. LeMayEast Tennessee State University
Follow this and additional works at: https://dc.etsu.edu/etd
Part of the Special Education and Teaching Commons
This Dissertation - Open Access is brought to you for free and open access by the Student Works at Digital Commons @ East Tennessee StateUniversity. It has been accepted for inclusion in Electronic Theses and Dissertations by an authorized administrator of Digital Commons @ EastTennessee State University. For more information, please contact [email protected].
Recommended CitationLeMay, Heather N., "Administrator and Teacher Attitudes Toward Inclusion" (2017). Electronic Theses and Dissertations. Paper 3278.https://dc.etsu.edu/etd/3278

Administrator and Teacher Attitudes Toward Inclusion
______________________________
A dissertation
presented to
the faculty of the Department of Educational Leadership and Policy Analysis
East Tennessee State University
In partial fulfillment
of the requirements for the degree
Doctor of Education in Educational Leadership
______________________________
by
Heather LeMay
August 2017
________________________________
Dr. Virginia Foley, Chair
Dr. John Boyd
Dr. James Lampley
Dr. Arnold Nyarambi
Key Words: Special Education, Attitudes, Teachers, Administrators, Inclusion

2
ABSTRACT
Administrator and Teacher Attitudes Toward Inclusion
by
Heather LeMay
This study was designed to examine the attitudes of teachers and administrators toward
inclusion in the classroom. Specifically this study analyzed grade level, years of teaching
experience, and levels of education to examine the manner in which these factors relate to
attitudes of teachers and administrators toward inclusion.
Participants in this study were located in 3 school districts in East Tennessee. All data
were collected through an online survey distributed to prek-12 teachers by way of email
from school principals. The analysis of data was based on the responses of 183 teachers
and administrators from these 3 school districts. Findings indicated that education level
did not play a significant role in the attitudes, training, or resources dimensions of the
study. However, participant role and years of experience did play a significant role in the
participants’ attitudes toward inclusion. Administrators held more positive attitudes
toward inclusion than teachers and reported having more resources on inclusion than
teachers. Those participants with 0-15 years of experience held more positive attitudes on
inclusion than those with 16-30 plus years of experience.

3
DEDICATION
I dedicate this work to my family and friends who have stuck by me through life’s
adventures and overwhelming odds. While hard work and dedication have made this
opportunity possible, the love and support I have received from those who spend each
day with me has helped make my dream come true.
First, I would like to recognize my mother, Pamela LeMay. You have put up with
so much from me since I was born, but through it all you were my biggest supporter. You
never doubted me or my abilities. You unwavering support and encouragement have kept
me going even when I thought I was not going to be able to make it. I don’t know where
I would be without you. Your confidence in me has given me the courage to follow my
dreams. I will be forever grateful.
Second, I would like to recognize my dad, Michael LeMay. You have been right
next to Mom the entire time, quietly listening to me as I struggle through the some of the
toughest times in my life. You are always there when I need you. You have made this
dissertation possible, literally by building me an office to write in. I had a place to go that
I called my own and that made all the difference. Your wisdom has been invaluable but
so has your ability to be a sounding board when I needed ideas. I would not be here if it
was not for you and Mom and I don’t think thank you is enough to express my full
gratitude. I love you both so much.
Third, I would like to recognize my brother, Matthew LeMay, sister in law,
Amanda LeMay, as well as my niece and nephew, Holden and Hollie. On days I was
writing and did not think I was going to be able to finish, you were right there on

4
FaceTime offering support, encouragement, and a whole lot of laughs. You allowed my
brain to take a break and have some fun when I was overly stressed. Your calls meant
more than you will ever know. I appreciate your constant support and encouragement
through this daunting process.
Fourth, I would like to thank the most amazing support system anyone could ask
for. Keyo, you have been there for every step of this process with nothing but love and
encouragement. You were my rock when I was sure I wasn’t going to be able to finish.
Without you checking on me, pushing me to achieve, and giving me pep talks when I was
sure I was ready to quit, I don’t know where I would be. When I was scattered and
anxious you were a calming force that brought everything back into perspective. There
are so many things I could say to describe you, but you are simply the best.
Finally, I would like to thank my South Side school family. All of you were there
for this adventure and made it possible for me to complete. Dr. Littleford, thank you will
never be enough. You have been one of my biggest supporters since I started working for
you and I could not have asked for a better principal. I don’t think you know how much
you have impacted my life. I will never forget you. Each one of you at South Side has
played a vital role in this journey and I hope you know how grateful I am to have met
each and every one of you.

5
ACKNOWLEDGEMENTS
I would like to express my gratitude to those who have supported me and
encouraged me on a daily basis to continue to pursue my dreams. A special word of
thanks goes out to my committee chair, Dr. Virginia Foley. The support and guidance
you have shown to me throughout the dissertation process has been tremendous. Your
guidance began at the start of the ELPA program and has continued on to the end. I
would not be here today if it was not for you and your dedication to your students. You
were more than a professor. Your dedication to making me the best teacher,
administrator, doctor, and person I could be was evident from the very first class. Thank
you for seeing past me as a student and seeing me as a person. You have changed me for
the better and I hope you know how much you have impacted my life.
I would also like to thank my committee members: Dr. John Boyd, Dr. James
Lampley, and Dr. Arnold Nyarambi. All of you have been just as committed to seeing me
finish as I have been. You were all there every time that I had a question or concern. Dr.
Lampley, no one knew better than you just how bad I was at statistics, however that never
scared you. I also appreciate how patient you have been with me in your teachings.

6
TABLE OF CONTENTS
Page
ABSTRACT ............................................................................................................... 2
DEDICATION ........................................................................................................... 3
ACKNOWLEDGEMENTS ....................................................................................... 5
LIST OF TABLES ..................................................................................................... 9
LIST OF FIGURES ................................................................................................... 10
Chapter
1. INTRODUCTION ............................................................................................. 11
Statement of the Problem .............................................................................. 12
Definition of Terms ...................................................................................... 13
Research Questions ...................................................................................... 14
Significance of the Study .............................................................................. 15
Limitations and Delimitations ...................................................................... 15
Organization of the Study ............................................................................. 16
2. LITERATURE REVIEW ................................................................................. 17
Introduction .................................................................................................. 17
Laws Related to Special Education ............................................................... 17
Plessy v. Ferguson ............................................................................. 17
Brown v. Board of Education ........................................................... 19
PARC v. Common Wealth of Pennsylvania ..................................... 20
Mills v. Board of Education ............................................................. 21
Education of All Handicapped Children Act .................................... 22
Individuals with Disabilities Education Act ..................................... 24
No Child Left Behind ........................................................................ 26
Self-Contained Classroom ............................................................................ 27
Philosophy of Inclusion ................................................................................ 28

7
The Inclusive Setting .................................................................................... 30
Inclusion Models .......................................................................................... 30
Coteaching .............................................................................................. 30
Benefits of Inclusion ..................................................................................... 34
Weaknesses of Inclusion .............................................................................. 35
Teachers’ Attitudes Toward Inclusion ........................................................ 36
Administrators’ Attitudes Toward Inclusion ................................................ 39
Summary ....................................................................................................... 45
3. RESEARCH METHODS .................................................................................. 46
Research Design ........................................................................................... 46
Population ..................................................................................................... 46
Instrumentation .............................................................................................. 47
Data Collection ............................................................................................. 48
Research Questions and Null Hypotheses ..................................................... 49
Data Analysis ................................................................................................ 51
Reliability and Validity ................................................................................ 52
Summary ....................................................................................................... 52
4. FINDINGS ....................................................................................................... 54
Research Question 1 ..................................................................................... 54
Research Question 2 ...................................................................................... 56
Research Question 3 ...................................................................................... 58
Research Question 4 ...................................................................................... 60
Research Question 5 ...................................................................................... 61
Research Question 6 ...................................................................................... 63
Research Question 7 ...................................................................................... 65
Research Question 8 ...................................................................................... 66
Research Question 9 ...................................................................................... 68

8
5. SUMMARY, CONCLUSIONS, AND RECCOMENDATIONS FOR
PRACTICE AND FUTURE RESEARCH ....................................................... 70
Conclusion .................................................................................................... 70
Discussion ..................................................................................................... 71
Recommendations for Practice ..................................................................... 72
Recommendations for Future Research ........................................................ 74
Summary ....................................................................................................... 76
REFERENCES .................................................................................................... 77
APPENDICES ..................................................................................................... 83
Appendix A: Copy of Teacher Technology Survey ..................................... 83
Appendix B: Johnson City Schools Approval Letter ................................... 91
Appendix C: Putnam County Schools Approval Letter ................................ 92
Appendix D: Greeneville City Schools Approval Email .............................. 93
Appendix E: Greeneville City Schools Approval Email ............................... 94
VITA ................................................................................................................... 95
9
LIST OF TABLES
Table Page
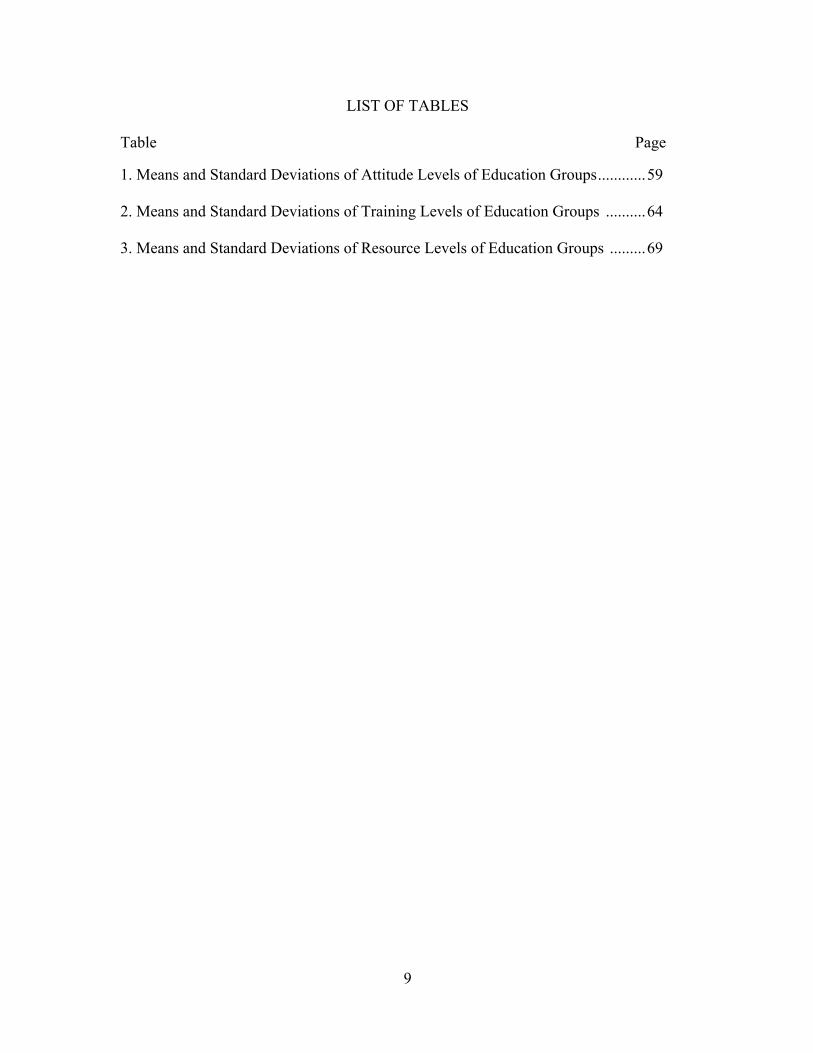
1. Means and Standard Deviations of Attitude Levels of Education Groups ............ 59
2. Means and Standard Deviations of Training Levels of Education Groups .......... 64
3. Means and Standard Deviations of Resource Levels of Education Groups ......... 69

10
LIST OF FIGURES
Figure Page
1. Comparison of Attitudes Toward Inclusion of Administrators and Teachers ....... 56
2. Comparison of Attitudes Toward inclusion of years of experience ...................... 58
3. Comparison of Training on Inclusion of Administrators and Teachers ................ 61
4. Comparison of Training on Inclusion and Years of Experience ........................... 63
5. Comparison of Resources for Inclusion of Administrators and Teachers ............ 66
6. Comparison of Resources for Inclusion and Years of Experience ........................ 68

11
CHAPTER 1
INTRODUCTION
Inclusion is a highly controversial topic in schools in part due in part to a lack of a
clear outline from federal mandates on how inclusion should be implemented in each
school (Bosch, 2015). The first law guiding special education was the Education for All
Handicapped Children Act (EAHCA) in 1975, which advocated mainstreaming children
with disabilities, but did not mandate the inclusion tenants (Coates, 1985). In 1990 the
EAHCA was renamed the Individuals with Disabilities Education Act (IDEA) (Rivera-
Tubbs, 2012). Jenkins (2012) stated that IDEA made guidelines for Free Appropriate
Public Education (FAPE) and provided stipulations regarding equal access to the general
education setting regardless of the child’s disability. One of the requirements of IDEA
was that students be placed in the least restrictive environment (LRE) if they were not
eligible for a general education placement. If a general education placement was ruled out
then a multidisciplinary team would meet to determine the most appropriate placement
for the student (Lorio, 2011). While there are many provisions in the law mandating the
inclusion of students with disabilities in a general education setting the extent to which
they are included is not dictated. School administrators determine the range of services
possible in the school, and the Individualized Education Plan (IEP) team determines
which services provide the LRE for the student. There are a variety of ways that inclusion
can be implemented which means that inclusion is not a universally applied program.
Some follow a partial inclusion model by which students attend some classes but the
majority of the time spent in a general education setting is in specials classes, electives,
lunch, and school wide events (Bosch 2015). Other schools may not practice any form of

12
inclusion and may not have any time by which students with disabilities are in a general
education setting. Inclusion has the potential to reach a large number of students at a
variety of levels. While the primary purpose of inclusion should be to meet the academic
needs of students with disabilities in the least restrictive environment, it also has the
potential to serve as a way to teach social skills and to model the appropriate behavior of
their typically developing peers. Inclusion falls under a broad spectrum of possibilities.
The law lays out no specific mandates as to how inclusion is to be implemented in each
school (Williams, 2015). The extent to which each student is served within an inclusive
setting becomes an IEP team decision and within the model of inclusion that the school
or district follows.
Statement of the Problem
According to Washington (2010), the decision on which model of inclusion to
follow is completely the prerogative of the administrator in each school. Therefore, it is
important to examine administrators’ and teachers’ attitudes toward inclusion. If
administrators or teachers have an overall negative attitude, they are probably not
implementing a large amount of inclusion in their school; thus students could be missing
out on opportunities to grow and learn from their typically developing peers (Bruce,
2010). Some administrators or teachers may have an overly positive view; their schools
potentially could be implementing full inclusion which may not be what is best for the
student with disabilities to be in that setting full time. It is, therefore, important to identify
the perceptions of these administrators and teachers.

13
This study was designed to examine the attitudes of teachers and administrators
toward inclusion in the classroom. Specifically this study analyzed grade level, years of
teaching experience, and levels of education to examine the manner in which these
factors relate to attitudes of teachers and administrators toward inclusion.
Definition of Terms
To ensure a clear understanding of terms used in the study, the following list of
definitions are included.
1. Dimension 1: Refers to the participant’s personal attitudes toward the inclusion of
students with disabilities in a general education setting.
2. Dimension 2: Refers to the participant’s perceptions of the resources provided whether
it be paraprofessionals, learning strategies, hands on materials for learning etc.
3. Dimension 3: Refers to the amount of training administrators and teachers have on
inclusion and implementation of inclusion either provided through their collegiate
studies, on the job training, or provided by their school district.
4. Free Appropriate Public Education (FAPE): The administration of Special education
and related services provided in accordance with an IEP, are free to the family, and meet
standards of the State Department of Education (Wright & Wright, 2007).
5. Inclusion: The placement of students with disabilities in general education classrooms
with students without disabilities who are also the same age (Reynolds & Fletcher-
Janzen, 2000).

14
6. Individualized Education Plan (IEP): A plan written for educating each child with a
disability, prior to being placed in a special education program (Reynolds & Fletcher-
Janzen, 2000).
7. Least Restrictive Environment (LRE): “Legal requirement to educate children with
disabilities in general education classrooms with children who have no disabilities, to the
maximum extent possible” (Wright & Wright, 2007, p. 427).
Research Questions
1. Is there a significant difference in the mean score for Dimension 1, Attitudes toward
Inclusion, on the inclusion survey between administrators and teachers?
2. Is there a significant difference in the mean score for Dimension 1, Attitudes toward
Inclusion, on the inclusion survey between the two groups indicating years of
experience?
3. Is there a significant difference in the mean score for Dimension 1 (Attitudes toward
Inclusion) on the inclusion survey among participants’ levels of education?
4. Is there a significant difference in the mean score for Dimension 2, Resources Provided
for Inclusion, on the inclusion survey between administrators and teachers?
5. Is there a significant difference in the mean score for Dimension 2, Resources Provided
for Inclusion, on the inclusion survey between the two groups indicating year of
experience?
6. Is there a significant difference in the mean score for Dimension 2, Resources Provided
for Inclusion, on the inclusion survey among participants’ levels of education?

15
7. Is there a significant difference in the mean score for Dimension 3, Training Provided
for Inclusion, on the inclusion survey between administrators and teachers?
8. Is there a significant difference in the mean score for Dimension 3, Training Provided
for Inclusion, on the inclusion survey between the two groups indicating years of
experience?
9. Is there a significant difference in the mean score for Dimension 3, Training Provided
for Inclusion, on the inclusion survey among participants’ levels of education?
Significance of the Study
Bosch (2015) stated that a negative perception towards inclusion can be related to
a lack of resources and training provided to teachers and administrators. Bosch noted
attitudes toward inclusion directly affect the successfulness of the inclusive setting.
Teachers report feeling that school administrators do not offer adequate support for
inclusion students. Bosch also noted this lack of support leaves teachers overwhelmed
and insecure about their ability. If the reasons behind a negative perception can be
revealed, support can be offered in those areas. This new support could potentially
change attitudes and perceptions and increase the effectiveness of an inclusive setting.
Limitations and Delimitations
There are certain limitations and delimitations that exist in regard to this study.
The population of this study was delimited to all teachers and administrators in three
school districts in East Tennessee during the 2016-2017 school year. Due to the
delimitations the responses and data may not reflect the attitudes and perceptions of other
teachers and administrators in the surrounding area, state or nation. Limitations of the

16
study were that all teachers and administrators in all three districts were invited to
participate in the survey. However, those who chose not to participate may have different
responses than those who chose to participate.
Organization of the Study
This study is organized into five chapters. Chapter 1: Introduction includes the
Purpose of the Study, Statement of the Problem, Significance of the Study, Research
Questions, Limitations, Definition of Terms, and Organization of the Study. Chapter 2:
Literature Review includes the Introduction, History of Special Education and the Law,
Inclusion, Strengths of Inclusion, Weaknesses of the Inclusion, Teachers’ Attitudes
towards Inclusion, and Administrators’ Attitudes towards Inclusion. Chapter 3: Methods
includes the Research Design, Population, Development of Survey Instrument, Data
Collection Procedures, Research Questions and Null Hypotheses, Data
Analysis, and a Summary. Chapter 4: Results includes the Introduction and presentation
of the data for Research Questions 1–24. Chapter 5: Findings includes the Discussion,
Recommendations, and Conclusions are reviewed in this chapter.

17
CHAPTER 2
LITERATURE REVIEW
Introduction This study was designed to examine the attitudes of teachers and administrators
toward inclusion in the classroom. Specifically this study analyzed grade level, years of
teaching experience, and levels of education to examine the manner in which these
factors relate to attitudes of teachers and administrators toward inclusion.
In order to understand this study in the proper context, a review of literature was
conducted. This literature review begins as a historical timeline that lists pertinent laws
and court cases related to special education followed by inclusion, inclusion models,
benefits and weaknesses of inclusion, and finally, research on teacher and administrator
perceptions on inclusion.
Laws Related to Special Education
Examining the legislative battles fought for children with disabilities is vital in
understanding the evolution of special education in the realm of public education. For this
reason, several landmark court cases and laws have been reviewed and are presented
below.
Plessy v. Ferguson
In 1896 the Supreme Court handed down a decision that solidified the concept of
separate but equal (Gasman & Hilton, 2012). This decision made segregation not only
acceptable, but a social norm, especially in southern states (Rubin, 2016). Plessy v.
18
Ferguson was the first case presented before the Supreme Court that argued segregation
(Elliot, 2001).
In 1892, an African American male, Plessy, refused to give his seat up on a train
(Swann-Wright, 2013). Plessy was 7/8 white and 1/8 African American, though those
whom interacted with him could not detect his race (Gasman & Hilton, 2012). Homer
Plessy felt he was entitled to every right that was secured to the citizens of the white race.
After refusing to give up his seat he was forcibly removed from the train by law
enforcement and placed in a local jail. Homer Plessy’s court case was heard at a state
level before arriving at the Supreme Court by which it was supported and upheld (Swann-
Wright, 2013). The court ruled that it was legal for states to provide separate facilities for
African Americans as long as they were equal.
This court case made it constitutional for states to segregate based on race
(Rusthoven, 2014). This directly discredited the Fourteenth Amendment’s guarantee to
equal protection of the law. The court ruling of separate but equal strengthened the
states’ role of controlled segregation and discrimination (Foy, 2008). Foy reported this
ruling led to rapidly increasing Jim Crow laws in the following years. Vasillopulos
(1994) stated that not one time during the ruling or proceedings did the court recognize
that the segregation itself was an admission of inequality. Plessy v. Ferguson remained an
active law until 1954 when the Supreme Court overturned the decision in Brown v. Board
of Education.
It is also important to note that during this era of segregation based on
race, children with disabilities were also segregated based on ability-disability
dichotomy. Inclusion was not yet a philosophy and practice in our educational system.

19
Brown v. Board of Education
In 1950 an African American man named Oliver Brown attempted to enroll his 8
year old daughter in a white school (Warren, 1954). This decision was made because of
the school’s proximity to his home since the all black school was more than a mile away.
After being refused admission to the school based on race, Brown, with the help of other
African American families and NAACP, sued the Topeka School District.
Before the Supreme Court in 1952 and 1953, special counsel Thurgood Marshall
argued that segregated public schools violated the 14th Amendment’s right to equal
protection. Marshall contended that public school settings that were segregated could not
be made equal, hence depriving students of the protection that these laws provide. The
basis for the argument rested on Marshall’s statement that segregation based on a child’s
race deprived the minority group of equal educational opportunities. Warren argued that
the court’s decision of the doctrine of separate but equal set in place by Plessy v.
Ferguson has no place in the field of public education. The plaintiffs were, therefore,
deprived of equal protection set in place by the 14th amendment.
The ruling made by the Supreme Court in Brown v. Board of Education has been
a landmark decision in special education law (Perry, 2005). While the focus of Brown v.
Board of Education was on racial desegregation, cases directly following Brown v. Board
of Education include those for students with disabilities. Special education owes debt to
and was born out of the civil rights movement (Skiba et al., 2008). In the wake of Brown
v. Board of Education, other legislation provided equal access to education such as
separate special education classrooms and ability grouping that was keeping students
segregated from their white peers. Pickren (2004) stated that Brown v. Board of

20
Education was a shining moment in the United States for the Civil Rights Movements
and all minority groups. Pickren noted nearly 50 years later, the promise of Brown. v.
Board of Education has yet to be fulfilled. Brown v. Board of Education asserted a need
for equal opportunities in the realm of education for students who were previously
excluded (Ferri & Connor, 2005) and laid claim to the idea that segregation was harmful
and inherently unequal. The case and the aftermath have been critiqued for more than 50
years and there is no doubt that the case had a significant and lasting impact on American
schools and children (Shealey et al., 2005b).
PARC v. Common Wealth of Pennsylvania The 1971 case of Pennsylvania Association for Retarded Children (PARC) v.
Commonwealth of Pennsylvania contested the law that allowed schools the right to deny
services to students who have not attained the mental age of 5 years old by the time they
have enrolled in first grade (Martin, Martin, & Terman, 1996). PARC argued that
students with intellectual disabilities were not being afforded the opportunity to receive
publicly supported education and that the state was ignoring and delaying their obligation
to provide public education to these students (Yell, Rogers, & Rogers, 1998). This
exclusion from public education was in direct violation of the equal protection clause in
the Fourteenth Amendment. Several witnesses testified on behalf of the plaintiffs, stating
that all children with intellectual disabilities are capable and can benefit from a training
and education program. The witnesses also stated that education cannot be solely defined
as the instruction of academics, which allowed the introduction of experiences such as

21
vocational, functional and adaptive skills including learning to clothe and feed
themselves.
The state came to a consent agreement to provide access to free public education
to children with intellectual disabilities through the age of 21. The case established a
standard that each child must be offered an education appropriate to their learning
capabilities in the least restrictive environment (Martin et al., 1996). The consent also
stated it would provide education programs most like those offered to peers without
disabilities (Yell et al., 1998). This ruling goes hand in hand with another pivotal court
case that came the following year, Mills v. Board of Education.
Mills v. Board of Education
In the year following PARC another court case ruled in favor of students with
disabilities. In 1972 the parents of seven children, ranging in age from 8 – 16 with a
variety of metal disabilities, sued the District of Columbia public school system. The suit
was filed on behalf of all out-of- school students with disabilities (Yell et al., 1998).
These parents represented students that had a range of disabilities from behavior issues,
epilepsy, physical impairments, intellectual disability, and hyperactivity.
The District of Columbia school system refused to enroll students and even
expelled others solely on the basis of their disabilities (Martin et al., 1996). The school
district stated that over 12,340 students were not going to be served in the 1971-1972
school year due to budget. The U.S. District Court ruled that school districts were
prohibited by the Constitution from deciding that their funding was inadequate. Under the
protection of the Fourteenth Amendment, inadequate resources were not a reason to deny

22
service to students with disabilities. The burden of insufficient funding should not fall
heavier on the children with disabilities than their peers without disabilities. The class
suit charged the school district with denying students access to public school without due
process (Yell et al., 1998). The ruling of Mills was far reaching and pivotal in that
children with disabilities would now have a form of education that was not only
meaningful to them but equal (Martin et al., 1996). It also meant that if there was a
change in their status for reasons such as expulsion, transfer, suspension, or reassignment,
each child was entitled to full procedural protections. These protections include notice of
changes, ability to gain access to school records, and the right to be represented by legal
counsel at a hearing to determine changes to the Individualized Education Plan (IEP).
The safeguards introduced by Mills became the framework for the due process
component of the Education of All Handicapped Children Act (Yell et al., 1998). By the
year 1973 over 30 federal court decisions had upheld the foundational principles of
PARC and Mills.
Education of All Handicapped Children Act
President Ford signed the Education of All Handicapped Children Act (EAHCA,
Public Law 94-142) into law on November 29, 1975. This law mandated for the first time
that children with disabilities be provided with free appropriate public education (FAPE)
(Jimenez, Graf, & Rose, 2007). PL 94-142 was a landmark case because it guaranteed
access to public education to children, who prior to this legislation, were excluded
because they did not “fit” into schools (Keogh, 2007). While there are several important
aspects of this law, one of the largest challenges was making the curriculum accessible to

23
students with disabilities. The law sought to provide support in that area by using an
initiative called Universal Design for Learning (Jimenez et al., 2007). This called for
teachers to make the curriculum accessible to each student no matter their ability level,
learning style, or culture. In addition to the mandate that provided access to general
education settings PL 94-142 also provided several other mandates (Thomason, 2009).
These mandates include:
1. All children ages 5-18 have access to a free appropriate public education setting
with a focus on special education. They must also have nondiscriminatory
evaluation procedures for children with disabilities to be identified and to aid in
placement decision.
2. Students with disabilities are to be educated in accordance with their
established Individualized Education Plans (IEPs). Plans must be developed by a
team that includes the parents as well as educational professionals and the student
when appropriate.
3. Educational services provided to the student must be conducted in the Least
Restrictive Environment (LRE).
4. Parents and students must be given access to procedural due process.
5. Parents must participate in shared decision making in regard to the student
(p.24)
The PL 94-142 provided federal funding to states to aid in educating students with
disabilities (Yell et al., 1998). In order for each state to receive funding they were
required to submit a plan to the Bureau of Education for the Handicapped. This plan was
to outline the procedures to be used to educate students with disabilities in accordance the

24
guidelines set by the Education of All Handicapped Children Act. If the plan was
approved, federal funding would be provided to each state with the understanding that the
state would guarantee a free appropriate public education. All but one state, New
Mexico, submitted plans that were eventually approved. New Mexico decided not to
accept these funds and was later sued by the New Mexico Association for Retarded
Children. The plaintiffs won, which required New Mexico to provide a free appropriate
public education. Soon afterwards New Mexico submitted a plan for approval.
Individuals with Disabilities Education Act
The Education for All Handicapped Children Act was renamed the Individuals
with Disabilities Education Act (IDEA) in 1990 (Rivera-Tubbs, 2012). Along with
defining the rights of students and parents with disabilities this legislation also increased
the amount of public school special education programs. The Individuals with Disabilities
Education Act provided federal funding to cover the costs that incurred from educating
students with disabilities, for instructional services, and assessment in public schools
(Lorio, 2011). Since the P.L. 94-142 legislation, there were several amendments to the
law. Each change expanded special education while clarifying its intentions. Jenkins
(2012) stated that IDEA made guidelines for FAPE more clear and provided stipulations
for improved outcomes and equal access to the general education setting regardless of the
child’s disability. This initiative also created thirteen distinct disability categories for
children to be served under and allowed for the establishment of an Individualized
Education Plan (IEP) that would meet the unique needs of each student. An additional
amendment to IDEA in 1997 made the primary focus outcomes of students with
disabilities (Lorio, 2012).

25
IDEA was renamed the Individuals with Disabilities Education Improvement Act
(IDEIA) in 2004, though most still refer to this piece of legislation by IDEA. Under
IDEIA schools were responsible for remaining in compliance with the law in order to
receive federal funding (Lorio, 2011). The 2004 IDEIA illustrated these six principles:
1. Free appropriate public education (FAPE)
2. Appropriate Evaluation
3. Individualized Education Plan (IEP)
4. Least Restrictive Environment (LRE)
5. Parent and Student participation in decision making
6. Procedural Safeguards (p.27)
One of the main foci of IDEIA was that students be placed in the least restrictive
environment (LRE) if they were not eligible for a general education placement. If a
general education placement was ruled out, then a multidisciplinary team would meet to
determine the most appropriate placement for the student (Lorio, 2011). In IDEIA, the
least restrictive environment was defined as:
To the maximum extent appropriate, children with disabilities, including children in public or private institutions or other care facilities, are educated with children who are not disabled, and special classes, separate schooling or other removal of children with disabilities from the regular education environment occurs only when the nature or severity of the disability of a child is such that education in regular classes with the use of supplementary aids and services cannot be achieved satisfactorily. (The 108th Congress, 2004, STAT. 2878 p. 118)
IDEIA required that, in the event that a student was placed in a setting other than a
general classroom, the appropriate placement would be chosen with the understanding
that while services continued the goal would remain of gradually moving the student to

26
the least restrictive environment (Lorio, 2011). The assimilation of students without
discrimination based on their disability was encompassed in the term “Inclusion”
(Chandler, 2015).
No Child Left Behind The next significant piece of legislature to follow IDEA was the reauthorization
of the Elementary and Secondary Education Act (ESEA) with the No Child Left Behind
Act (NCLB). On January 8th, 2002, President Bush signed into law the No Child Left
Behind Act that redefined the roles of K-12 public schools and sought to close the
achievement gap that existed between students of low socioeconomic status and their
peers. NCLB was created for the purpose of helping all children, regardless of race,
economic status, ethnicity, or disability reach full potential (Kaufman & Blewett, 2012).
Savich (2008) stated that NCLB was put into law to ensure that all children would have
an equal, fair, and significant opportunity to high quality education. The NCLB also
sought to ensure grade level achievement in core subject areas by all students by the year
2014 (Washington, 2011). Therefore, all students, by the year 2014, would need to
achieve a score of proficient or above on state mandated tests (Webb, 2006). The
philosophy of inclusion of students with disabilities in a general education classroom was
present in NCLB (Harris, 2009). As well as higher standards set for students with
disabilities, NCLB called for less exclusion and more inclusion (Savich, 2008). Chandler
(2015) echoed these words by stating that NCLB created academic achievement
standards that school districts and local schools were held to, ensuring their academic
achievement is high and that student with disabilities are not under-served and remained

27
in appropriate placement. NCLB mandated that all students be taught a challenging
curriculum (Gloeckler & Daggett, 2004). Hallahan, Kauffman, and Pullen (2009) noted
the need for high standards was a necessary and positive change for education, however,
educators were teaching standards to the students with disabilities that matched their
current grade level, which did not match the children’s current performance levels.
Washington (2011) proclaimed that the Individuals with Disabilities Education
Act and No Child Left Behind were two of the most significant federal statutes. Although
they both have similar goals of improving education, the approach is different. It is
important to understand these differences when looking at the history of educational
legislature. IDEA focuses on children with disabilities, while NCLB encompasses all
children. IDEA is very specific and focuses on educating a child through an
individualized education plan (IEP), and has an emphasis on specific services. NCLB
approaches education with a more global view by focusing on closing achievement gaps,
test scores, and scores of all demographic groups to specific levels.
Self-Contained Classroom
Today’s special education classes serve a wide variety of disabilities ranging from
mild, such as learning disabilities, to medically fragile students with severe to profound
disabilities. The education of these students often happens in a special classroom or even
in separate schools (Washington, 2010). The setting, that has only students with
disabilities, is called a self-contained classroom. Self-contained classrooms provide
academic instruction on the core subject areas of math, social studies, reading, science,
and literacy. However in the past two decades, special education advocates have pushed

28
to have students with disabilities educated in a general education setting with support.
According to Kurth, Born, and Love (2016) little is known about what happens in
a self-contained classroom. The purpose of a self-contained classroom is to provide grade
level content at the present functioning level of the students. While academics remain the
priority, skills such as home living, budgeting, job skills, personal hygiene, and other life
skills are a focus of this classroom as well. Self-contained classrooms have an average of
5-15 students, considerably fewer than a general education setting. Self-contained
classrooms are served by a special education teacher and para-professionals (Lane et al.,
2005). The students represented in these classrooms have been tested and evaluated by an
IEP team along with evaluation professionals and have been identified with a severe to
profound disability. Students in a self-contained classroom represent 1% of the school
population and do not take state mandated tests. Instead, these students participate in
portfolio assessments to show growth. In most schools students in a self- contained
classroom participate in inclusion through school wide assemblies, meals, extracurricular
activities, and elective classes.
Philosophy of Inclusion
Over the past several decades there has been an increased educational interest in
inclusion (Ryan, 2010). Inclusion has been a part of the education system for some time
now, and is generally associated with students who have special needs, are exceptional,
or differently-abled. The inclusion of students with disabilities has been the central theme
of policy debates in education, especially in reference to student access to the general
education setting (Obiakor, 2011). Inclusive education implies that regardless of

29
strengths, weaknesses, or ability levels all students become part of the school community.
Inclusion is based on the principle that all students are valued for their unique abilities
and are accepted as important members of the student body. According to Harris (2009),
schools have a duty to include students with disabilities in the general education setting to
the maximum extent possible.
One aspect that makes inclusion challenging for school districts is the lack of a
universal definition or clearly defined policy at the federal level (DeMatthews &
Mawhinney, 2013). The word “inclusion” does not exist in IDEA and is rarely used in
case law. The widely accepted understanding of inclusion comes from the definition that
IDEA gives to the Least Restrictive Environment (LRE). The lack of a clear definition
coupled with broad language allows districts to implement inclusion according to
perceptions of least restrictive environment. According to DeMatthews and Mawhinney,
school districts have a large amount of flexibility when drafting policies and programs
related to inclusion. Though there may not be a set of characteristics that specifically
describe inclusive settings, one defining practice is that students with disabilities should
be in the general education setting to the maximum extend appropriate and not isolated in
special classes (Washington, 2010).
The Inclusive Setting
The term “inclusion” indicates that students with disabilities should be educated
alongside their age-appropriate peers in a general education setting. Jenkins (2012) stated
that content should be taught to students in inclusion by a highly qualified, general
education teacher who provides accommodation in accordance with the child’s IEP. For

30
over two decades, inclusion has been gaining momentum. Jenkins explained that the
expansion of inclusive education practices have spurred new research. More students than
ever are being educated in an inclusive setting. Approximately 96% of general education
teachers have taught a student with disabilities at some point in their classroom.
Approximately 95% of students with disabilities ages 6-21 are being served in regular
schools. In addition, 59% of students with learning disabilities are receiving their
instruction in a general education setting. In today’s schools, more than ever, students
with disabilities are being served in a general education setting by general education
teachers. In spite of the drawbacks or weaknesses, inclusion offers a large amount of
strengths as well.
Inclusion Models
CoTeaching
Throughout the years, instructional practices have been developed to meet the
needs of students with disabilities in a general education setting through inclusion. This is
a shift from the traditional model by which students with disabilities were served solely
in self-contained classrooms. This shift occurred after federal legislation required that
students be served in the Least Restrictive Environment (Murray, 2012). This reform
expanded the responsibility of educating students with disabilities from just special
education teachers. Inclusion broadened the role of the special education teacher and
made collaboration between special education and general education teachers a
requirement in order to deliver instruction in an effective inclusive setting. This model of

31
collaboration and delivery of instruction is called coteaching (Volonino & Zigmond,
2007).
In 1995 the National Center on Educational Restructuring and Inclusion reported
that the most frequently used special education service delivery model for inclusive
classrooms was coteaching. Since that study, the popularity of coteaching has only
increased (Murray, 2012).
Coteaching provides the opportunity for students with disabilities to be educated
in a general education classroom by a highly qualified teacher. Kloos and Zigmond
(2008) cited numerous researchers (Darling-Hammond & Youngs, 2002; Floden, &
Ferrini-Mundy, 2002; Sanders & Horn, 1998) who have shown that “highly qualified
teachers significantly increase student performance for students without disabilities in the
general education classroom. In these settings, teacher quality contributed more to
student achievement than did any other factor, including student background, class size,
and class composition” (p.12).
Coteaching typically indicates that two teachers share a classroom. One teacher is
the special education teacher and the other is the general education teacher or content
area teacher. The premise of the model lies in the ability of these two teachers combing
their expertise; the general education teacher’s expertise in the core knowledge of the
subject and research based instructional techniques, and the special educations teacher’s
expertise in the area of the adaptation or modification of curriculum and instruction
students with various disabilities (Murray 2012). As stated by Kloos and Zigmond (2008)
Theoretically, coteaching draws on the strengths of both the general educator, who understands the structure, content, and pacing of the general education curriculum, and the special

32
educator, who identifies the unique learning needs of individual students and enhances curriculum and instruction to match those needs. Coteaching accomplishes multiple objectives. First, students with disabilities are taught the general education curriculum by a general education content specialist. Second, it provides students with disabilities (and their at-risk but not-yet-identified peers) greater access to that curriculum through the special education teacher who provides help and support (Thousand & Villa, 1989) (p. 13).
Fattig and Taylor (2008) identified additional advantages to coteaching.
Coteaching allows teachers to model team work for students. Students are able to see two
adults in their rooms working in tandem, problem solving, and communicating.
Coteaching also meets the needs of a greater variety of students by designing curriculum
adaptions to meet the different learning needs of all students in the class, not just students
with disabilities. Classroom teachers are usually responsible for multiple things such as
grading papers, providing feedback, and creating lessons, but coteaching allows for a
division of some of these responsibilities. Lastly coteaching aids in the management of
challenging behaviors. Teachers can share ideas on addressing challenging behaviors as
well as use the expertise of the special education teacher to identify the cause of the
behaviors and hopefully extinguish them.
Coteaching has several configurations that administrators and teachers can choose
to use. Scruggs, Mastropieri, and McDuffie (2007) identified these models as follows:
• One teach, one assist (or “drift”) – This is a model by which one teacher,
(usually the general education teacher) takes primary responsibility for
delivering instruction, and student support is provided by the special
education teacher when needed.

33
• Station teaching – the co-teachers collaborate in the creation of centers
that address the skills they are teaching, and the co-teachers provide
support to individuals at the different stations.
• Parallel teaching - a model by which co- teachers divide the class either
into homogeneous or heterogeneous groups and provide instruction at the
same time to the different groups.
• Alternative teaching- is a model similar to the idea of pull out instruction,
by which one the teachers takes a small group into a different setting to
teach or reteach a concept to a select group of students for a limited time.
• Team teaching (or interactive teaching) – is characterized by both co-
teachers equally share the teaching responsibilities and are both actively
involved in the leading instructional activities (p. 392).
The most popular model utilized in schools is the one teach, one assist model
(Cook & Friend, 1995; Scruggs et al., 2007; Zigmond & Magiera, 2001). The most
logical reason for this occurrence is because the one teach, one assist model does not
require extensive training and is simple to implement. Traditionally, the general
education teacher, also known as the content expert, is the one providing instruction to
the entire class while the special education teacher circulates the room and provides
support for individual students. This model allows more students to receive support and
allow for the continuation of instruction (Murray, 2012). The drawback of this method is
that it is very expensive to implement and does not always fully exploit the entire skill set
of the special education teacher as well as other coteaching models do.
34
Benefits of Inclusion
According to Bailey and Winton (1987), research supports the positive effects of
the inclusion of children with disabilities. The benefits of inclusion are not only to
children with disabilities but to typically developing children, classroom teachers and the
community as a whole. Inclusion not only maximizes growth, but builds a sense of
community as well. Washington (2010) stated that inclusion benefits students with
disabilities as well as teachers and society. Inclusion provides students with disabilities
the opportunity to belong to a diverse human family, a diverse environment that is not
only stimulating but provides opportunities to learn and grow. Inclusion provides the
opportunity to develop friends, enhance self-respect, be educated with peers of the same
age, and models of positive behavior and learning. When implemented properly inclusion
has the potential to scaffold learning for students with disabilities and help them reach
academic levels that were previously out of reach. A study by Fedrico et al. (2000)
showed not only social but academic growth of students with disabilities in an inclusive
setting. Teachers reported that at the beginning of the year students with disabilities
wanted the teacher to read the majority of the material aloud. However, as the year
progressed these students relied less on their teacher. Teacher participants agreed that
their new independence was due to the high standards placed on them in the inclusive
setting.
Inclusion benefits general education students with the opportunity to experience
diversity. Along with acceptance, inclusion teaches general education students that
everyone is unique with different learning styles, as well as promotes empathy and the
ability to be sensitive to others’ limitations (Washington, 2010).

35
Inclusion also helps teachers appreciate diversity. When teachers recognize that
all students have strengths and understand the importance of differentiated and
individualized instruction, they increase opportunities for learning as well as enhance
accountability for all students, not just students with disabilities. Inclusion benefits the
overall school community by promoting social values and equality (Washington, 2010).
Weaknesses of Inclusion
While inclusion can benefit some students with disabilities, this is not always the
case. Not all students with disabilities will show progress in a general education setting.
Some disabilities can have the opposite effect and hinder student progress instead of
allowing those students to grow and flourish. In this situation, the student would be better
served in a self-contained classroom that can meet the needs of the individual
(Washington, 2010). Crossley (2002) argued that the academic benefits should not be the
sole consideration for an inclusion placement, but the social benefits that the student with
disabilities can acquire as well.
Other researchers have also found issues with the inclusion movement.
Zimmerman (2002) stated that even though there are many educators who agree with the
premise of inclusion, it can also create a backlash for teachers. Zimmerman suggested
that one area of concern was how teachers provide students with disabilities the services
they require, while still educating the rest of the students. Teachers often perceive having
students with disabilities in their classroom as a disadvantage to other general education
students in that class.

36
Bateman and Bateman (2002) stated while observing inclusion programs, there
were notable disadvantages. Some inclusion advocates report that regardless of the
student’s behavioral challenges he or she should be included in a general education
setting. This creates a large disadvantage when the student becomes disruptive which
causes the teacher to frequently stop and address the behavior. The frequent interruptions
cause teaching to become sporadic and does not allow academic content to be taught at
the pace needed. Irmsher (2005) suggested that educators and parents believe that the
inclusion of students with disabilities can lower the standard of learning in the classroom.
Therefore, inclusion is found to have both strengths and weaknesses for students.
Each situation must be looked at on an individual basis and a decision made that is
appropriate for every child who will be a part of the general education setting, including
the student with the disability.
Teachers’ Attitudes Toward Inclusion
Successful integration of students with disabilities into a general education setting
were found to be affected by teachers’ attitudes toward inclusion (Darrow, 2009) and are
predictive of effective teaching in an inclusive classroom (Kuyim & Desai, 2007). Ross –
Hill (2009) concluded that when it came to the inclusion of students with disabilities,
more resistance came from general education teachers than special education teachers. A
study from Bennett (1996) showed that overall attitudes of general education teachers
toward inclusion were negative. This is a direct contrast of the generally positive attitudes
toward inclusion held by special education teachers.

37
Familia-Garcia (2001) assessed attitudes of general education teachers towards
the inclusion of students with disabilities into their classrooms. Over 50% of the teachers
in the study refused to implement inclusive practices within their classroom because they
believed these practices would not work. More than 80% of the teachers stated that if
forced to work with students with disabilities in an inclusive setting they would change
schools or retire.
Scruggs and Mastropieri (1996) studied over 10,000 general education teachers
were surveyed to gain an understanding of teachers’ attitudes towards educating students
with disabilities in their classrooms. Two thirds of the teachers accepted the general idea
of teaching students with disabilities in their classrooms. Over half of the teachers
surveyed also agreed that inclusive practices were beneficial for students with disabilities.
However, it is noted that one-fourth of those teachers doubted their teaching abilities to
work with students with disabilities and did not feel they had adequate training to meet
the needs of students with intellectual or behavioral disabilities.
The attitudes of teachers towards students with disabilities influence their
interactions with students, thus affecting the growth and academic progress of that
student. Students with disabilities who are perceived negatively by teacher may be
subjected to lower expectations, higher levels of criticism, and more negative attention
(Bosch, 2015). Negative attitudes can also lead to less positive reinforcement from
teachers. Negative attitudes held by general education teachers can be attributed to the
overwhelming demands placed on teachers by adding students with disabilities to their
classrooms.

38
The successful implementation of an inclusive classroom is directly dependent on
the attitudes and perception of teachers and administrators (Bochenek, 2008). Bennett
(1996) indicted that a negative attitude held by general education teachers was directly
related to an unsuccessful integration of students with disabilities. According to Subban
and Sharma (2005) general education teachers expressed a need for more in depth
information on the correct way to include students with disabilities. A lack of experience
or knowledge on the inclusive classroom has been a leading reason general education
teachers are reluctant to embrace the concept of inclusion (Bosch, 2015). Vaidya and
Zaslavsky (2000) reported that general education teachers were unaware of the
challenges they would encounter when creating inclusive classroom settings. Further,
Bosch (2015) stated that general education teachers were unprepared and unsure of how
to meeting the educational goals of students with disabilities.
Another factor adding to negative perceptions of inclusion by general education
teachers is the severity of the student’s disability. A literature review was completed by
Avramidis and Norwich (2002) of general education teachers’ attitudes towards inclusion
of students with more severe disabilities. Avramidis and Norwich stated that the implied
responsibilities and obligations associated with students with severe disabilities became
an overwhelming concern to general education teachers. Negative attitudes held by
teachers were exacerbated by the concern of the responsibility of inclusion students. The
study by Darrow (2009) revealed that the severity of the disability influenced teachers’
attitudes toward the inclusion of students with disabilities. Further, Kavale (2000)
reported that the perceptions teachers had toward teaching the individual were affected by
the severity of the disability. These studies supported the conclusion that negative

39
attitudes held by general education teachers can adversely affect the implementation of
inclusive practices.
Harris (2009) stated that teachers’ attitudes towards inclusion might be the
determining factor in the ultimate success or failure of inclusion programs. One of the
most important factors in determining the success of the program is teacher attitudes
towards inclusion. General education teachers are an integral part of positive
implementation of inclusion practices. Harris supported the concept that teachers are the
key to successful inclusion programs. Positive attitudes by teachers coupled with a
commitment to teaching students with disabilities are pivotal in determining the extent to
which students with disabilities are accepted as part of the school community.
Another important role in the development of positive attitudes towards inclusion
is teacher preparation. (Harris, 2009). Teacher preparation affects the levels of knowledge
and confidence general education teachers have to meet the needs of the diverse learning
styles represented in their classroom by students with disabilities. The level of support
that teachers receive also influences teacher attitudes towards inclusion. Research by
Kavale and Forness (2000) stated the main reasons general education teachers hold
negative attitudes towards inclusion are inadequate training, lack of support, and a lack of
time to collaboratively plan with other teachers, both general and special education.
Administrators’ Attitudes toward Inclusion
Well-trained teachers as well as well-trained administrators are the key pieces to
implementing the mandate of inclusion and LRE (Harris, 2009). Administrators must
have a pedagogical, legal, and cultural knowledge (Collins & White, 2001). Guzman and

40
Schofield (1995) cited the principal as critical for the successful implementation of
inclusion. Administrators must display a positive attitude and commitment towards
inclusion as well as possess the skills and knowledge to lead staff in the development and
creation of an inclusive learning environment (Harris, 2009). Early research, conducted
in the 1980s by Leibfried (1984) and Sergiovanni (1984), indicated that administrators
play a major role in shaping teachers’ behaviors, attitudes, and the overall school climate.
A climate of acceptance for all students is only created when administrators have a
positive attitude towards inclusion. Research indicated that administrators with positive
attitudes were more willing to provide opportunities for students with disabilities to
remain in a general education setting (Harris, 2009). The effectiveness of inclusion relies
heavily on the principal.
Attitude is also imperative to the successful implementation of inclusion.
Gameros (1995) examined administrators’ attitudes and found a vital part of an inclusive
school environment to be their vision and leadership. A study by Villa, Thousand,
Meyers and Nevin (1996) surveyed 680 regular educators and administrators in the
United States. The research concluded that administrators who had more positive
attitudes toward inclusion were directly associated with more experience with students
with disabilities, greater administrative support, and more time for collaboration. York
and Tunidor (1995) also reported that principal attitudes are critical. Interviews were
conducted asking administrators, teachers, parents, students, and support staff their
perceptions toward inclusion and factors that aid in the successful implementation on an
inclusive program. Factors that were perceived by participants as necessary were
adequate time for collaboration, skills, and attitudes.

41
Praisner (2000b) studied 750 elementary school administrators from the
Commonwealth of Pennsylvania. Praisner developed a web-based survey called the
Principal and Inclusion Survey (PIS) to determine the extent that experience and training
attributed to administrators’ attitudes towards inclusion. Four hundred and eight surveys
were returned. The purpose of the study was to determine whether collegiate special
education classes earned, age, and years of service had any correlation to administrators’
attitudes towards inclusion. Neither a positive nor negative view was shown which
determined that administrators were noncommittal. A neutral attitude was determined by
76.6% neutral attitude, 21.1% positive attitude, and 2.7% negative attitude on
inclusionary practices. Praisner concluded that despite administrators not supporting
inclusion, most administrators were open to the idea. The study did reveal a positive
correlation between attitudes towards inclusion and school credit and training. Praisner’s
study also revealed one in five administrators favored inclusion.
A combination of experimental research and survey was used by Abernathy
(2012) in a mixed methods survey to assess the attitudes of administrators in the
southeastern region of the United States towards the inclusion of students with disabilities
in a general education setting. The study consisted of 32 participants who were given a
pretest, intervention, and a post test. The intervention contained a model consisting of
learning modules with activities pertaining to collaborative problem solving,
communication in problem solving, and best practices in behavior intervention and
classroom management. Abernathy used the Administrators and Inclusion (PIS) survey
developed by Praisner (2000a) to measure whether program factors, experience, and
training affected administrators’ attitudes toward the inclusion of students with

42
disabilities in a general education setting. After the intervention and post-test, Abernathy
was able to conclude that an overwhelming number of administrators, 95.2%, believed
that the experience of students with severe to profound disabilities was enhanced when a
school educated all types of students. The data showed that 81.0% of administrators felt
that genereal education teachers could do a great deal to help students with severe to
profound disabilities within a general education setting. The study also reported 100% of
administrators responded positively to the idea that all students would benefit from
interaction with students with disabilities.
A study was conducted of Texas high school administrators’ attitudes towards
students with disabilities inclusion into the general education setting by Farris (2011). A
quantitative study was conducted by using a survey to collect data. Farris chose to utilize
the Administrators and Inclusion (PIS) survey developed by Praisner (2000b). The survey
was administered electronically and distributed to administrators through their email.
Three hundred ninety-five administrators completed the survey. After analyzing the data,
Farris was able to conclude that the amount of training, and college credits relating to
special education had a direct correlation to the administrators’ attitudes towards
inclusion. Farris also noted that the administrator felt that students with disabilities
should be included in a general education setting. However, when administrators were
asked about their support for inclusion based on specific disabilities, the more severe
disabilities received less support for inclusion in a general education setting. Farris
reported that administrators opted for the Least Restrictive Environment with the proper
support from school staff for students with mild to moderate disabilities.

43
Inzano (1999) surveyed 300 administrators in New Jersey on their attitudes
towards inclusion. The survey population included 100 administrators across 3 settings:
urban, rural, and suburban. An analysis of the data revealed that there was no correlation
between geographic location and experience on attitudes towards inclusion. The study
also revealed that 88% administrators agreed that students who are delayed 1-2 academic
years or having learning disabilities should be educated in a general education setting.
The discrepancy came in regard to students with mild/ severe disabilities. Only 17% of
administrators said that those students should be educated in a general education setting.
Ramirez (2006) surveyed Texas administrators’ attitudes toward inclusion of
students with disabilities in a general education setting. The survey used was created by
Praisner (2000a) which was later adapted to meeting the needs of the research conducted
by Ramirez. The research was conducted to determine whether there was a correlation
between percentage of students in special education, gender, age, and campus size. The
data revealed no correlation between percentage of students in special education, gender,
age, and campus size and administrators’ attitudes. The data did reveal that there was a
significant correlation between the attitudes of administrators towards inclusion and
special education training and experience they possessed. In conclusion, administrators in
Texas had an overall positive attitude towards inclusion. This is supported by the 73 of
the 108 administrators surveyed reporting a more positive attitude than negative attitude.
Ramirez stated this information could be important to the implementation of inclusion
models.
Along with principal attitudes toward inclusion, a strong vision and mission is
another imperative component to a successful inclusive education program (Harris,

44
2009). Inclusion places rising expectations on administrators, which require constant
action in order for their program to be effective. Administrators are required to design,
manage, and lead programs for students with and without disabilities. The ability to lead
these programs is determined by an ability to evaluate these inclusive settings. These
responsibilities create a climate by which administrators must encourage all stakeholders
to have a positive attitude toward inclusion.
According to Greyerbiehl (1993) there were several critical components that
administrators were missing in order to successfully implement inclusion. These
components included poor communication, poor leadership strategies, lack of teacher
support, and negative attitudes and beliefs towards inclusion. Other limitations included
insufficient staffing, lack of materials, inadequate time for collaborative planning, rigid
expectations in a general education setting, and a fear that inclusion would be a
disadvantage to general education students.
Administrators play a vital role in the effective implementation of the inclusion
programs within their school. Though they do not deliver direct instruction and are not
often integrated in the daily classroom setting, they are responsible for creating a positive
school culture. Research indicates that a principal’s vision and mission for the school
directly impacts the implementation of inclusive programs. Teachers look to the
administrators for guidance and support, thus a principal’s attitude toward the inclusion
of students with disabilities in a general education program is important (Williams,
2015).

45
Summary
The inclusive classroom has been developing for over 65 years (Bruce, 2010).
The inception of IDEA and NCLB have required teacher and administrators to determine
the most appropriate placement for each student with disabilities. Though inclusion in a
general education setting is goal, the law mandates that students be educated in the Least
Restrictive Environment. For some this is not a general education setting, but a self -
contained classroom instead. However, for the majority of students with disabilities, the
goal is to meet their educational needs in a general education setting. Inclusion is based
on the principle that all students are valued for their unique abilities and are accepted as
important members of the student body (Obiakor, 2011). Both the benefits and the
weaknesses of inclusion have been outlined in this chapter. Several models of inclusion
are available for administrators and teachers to implement in their school setting. In spite
of the several models of coteaching, the most popular model utilized in schools is the one
teach, one assist model (Cook & Friend, 1995; Scruggs, 2007; Zigmond & Magiera,
2001). Numerous studies, both qualitative and quantitative, have been conducted on
teacher and principal attitudes towards the inclusion of students with disabilities in a
general education setting. The results of these studies were summarized in this chapter.

46
CHAPTER 3
RESEARCH METHODS
This study was designed to examine the attitudes of teachers and administrators
toward inclusion in the general education classroom. Specifically this study analyzed
grade level, years of teaching experience, and levels of education to examine the manner
in which these factors relate to attitudes of teachers and administrators toward inclusion.
This chapter outlines the research methodology used in this study including the research
design, population, development of survey instrument, data collection procedures,
research questions and null hypotheses, and data analysis.
Research Design
This descriptive, quantitative research design used a survey to assess teachers’
and administrators’ perceptions of inclusion across three dimensions. These dimensions
include resources, training, and attitudes. A survey was developed and tested prior to
use. This survey was used to collect the data used to determine the answers of the
research questions and the null hypotheses that accompany them.
Population
The population of this study was administrators and teachers from school districts
in the Middle to East Tennessee region. These districts included Greeneville City,
Putnam County, and Johnson City Schools. Greeneville City schools is comprised of 4
elementary schools. Each elementary school has one administrator and between 20-30
teachers. Greeneville City Schools has 1 middle school with two administrators and 48
teachers. Lastly, there is 1 high school with three administrators and 68 teachers. Putnam

47
County Schools is comprised of 18 schools broken down into 11 elementary schools, four
middle schools, and three high schools. The 11 elementary schools have either one or two
administrators in each building and a range of 17-33 teachers. The four middle schools
have three administrators in each building and between 37 and 53 teachers. Two of the
three high schools in Putnam County have six administrators and between 90-100
teachers each. The third high school has three administrators and 42 teachers. Johnson
City Schools is comprised of 8 elementary schools, 2 middle schools, and 1 high school.
Each elementary has one or two administrators and a range of 19-36 teachers. The two
middle schools each have three administrators and between 50 and 60 teachers. There is
only one high school with seven administrators and 105 teachers.
Instrumentation
The researcher developed the survey instrument (see Appendix A) for this study
to answer the 9 research questions. The questionnaire was designed to measure teachers’
and administrators’ perceptions of inclusion across the three dimensions of resources,
training, and attitudes. The survey instrument included a qualifier that outlined for
participants that the survey was designed to obtain input from teachers’ and
administrators’ regarding their perceptions of inclusion.
The survey instrument was developed using statements that directly related to one
of the three dimensions of the research questions. Data on teachers’ or administrators’
attitudes toward inclusion were collected from items 1-4, 10-11, 13-19, and 21. Items 5,
8, 9, 12, and 22 collected data related to the teachers’ and administrators’ resources in
regard to inclusion. Data with respect to teachers’ and administrators’ training on

48
inclusion were obtained from items 6, 7, and 20. Demographic information was obtained
from items 23-27.
Individuals who participated in the survey were asked to indicate their strength of
agreement with each item. They completed the survey by inserting the answer that best
represented their level of agreement based on a 5-point Likert-type scale using Strongly
Agree, Somewhat Agree, Neither agree nor Disagree, Somewhat Disagree, and Strongly
Disagree.
A survey development activity was conducted with educators to ensure that all
survey items were clear, easy to understand, and asked for the appropriate information.
The teachers’ responses and feedback were used to revise the survey.
Data Collection
A letter (see Appendix B) was sent to the superintendents of Greeneville City,
Putnam County, and Johnson City Schools to obtain permission to complete the research
for this study. Paper surveys were handed out to administrators during district wide
administrator meetings. After receiving the required permission, 75 school administrators
were contacted and asked to distribute the survey by email to the teachers in their
schools. Due to the large number of teachers represented, the most efficient way to
distribute the surveys was by email.
A cover letter (see Appendix C) was attached to each survey to inform
participants of the purpose of the survey and assure them that their answers and identity
would remain anonymous. Administrators were asked to complete the survey during the
administrators’ meeting. Completed surveys were placed in a supplied envelope by

49
participants. If administrators chose not to participate, they were still instructed to place
their survey back in the envelope as to not identify who did and did not participate. The
surveys were then collected and returned to the researcher by mail. Surveys that were
conducted locally were picked up in person by the researcher.
An online survey was distributed to teachers through email via an online survey
system. Teachers were provided with the same cover letter (see Appendix C) and asked
to complete the online survey. Responses from the online survey were sent to researcher
through the online survey company. Participants were asked to complete the 27-item
survey. A reminder was sent to participants to encourage response from those who had
not responded.
Research Questions and Null Hypotheses
Nine null hypotheses were used to answer the 9 research questions regarding
teachers’ and administrators’ perceptions of inclusion:
1. Is there a significant difference in the mean score for Dimension 1, Attitudes toward
Inclusion, on the inclusion survey between administrators and teachers?
Ho1: There is no significant difference in the mean score for Dimension 1, Attitudes
toward Inclusion, on the inclusion survey between administrators and teachers?
2. Is there a significant difference in the mean score for Dimension 1, Attitudes toward
Inclusion, on the inclusion survey between the two groups indicating years of
experience?

50
Ho2: There is no significant difference in the mean score for Dimension 1, Attitudes
toward Inclusion, on the inclusion survey between the two groups indicating years of
experience?
3. Is there a significant difference in the mean score for Dimension 1 (Attitudes toward
Inclusion) on the inclusion survey among participants’ levels of education?
Ho3: There is no significant difference in the mean score for Dimension 1 (Attitudes
toward Inclusion) on the inclusion survey among participants’ levels of education?
4. Is there a significant difference in the mean score for Dimension 2, Resources Provided
for Inclusion, on the inclusion survey between administrators and teachers?
Ho4: There is no significant difference in the mean score for Dimension 2, Resources
Provided for Inclusion, on the inclusion survey between administrators and teachers?
5. Is there a significant difference in the mean score for Dimension 2, Resources Provided
for Inclusion, on the inclusion survey between the two groups indicating year of
experience?
Ho5: There is no significant difference in the mean score for Dimension 2, Resources
Provided for Inclusion, on the inclusion survey between the two groups indicating year of
experience?
6. Is there a significant difference in the mean score for Dimension 2, Resources Provided
for Inclusion, on the inclusion survey among participants’ levels of education?

51
Ho6: There is no significant difference in the mean score for Dimension 2, Resources
Provided for Inclusion, on the inclusion survey among participants’ levels of education?
7. Is there a significant difference in the mean score for Dimension 3, Training Provided
for Inclusion, on the inclusion survey between administrators and teachers?
Ho7: There is no significant difference in the mean score for Dimension 3, Training
Provided for Inclusion, on the inclusion survey between administrators and teachers?
8. Is there a significant difference in the mean score for Dimension 3, Training Provided
for Inclusion, on the inclusion survey between the two groups indicating years of
experience?
Ho8: There is no significant difference in the mean score for Dimension 3, Training
Provided for Inclusion, on the inclusion survey between the two groups indicating years
of experience?
9. Is there a significant difference in the mean score for Dimension 3, Training Provided
for Inclusion, on the inclusion survey among participants’ levels of education?
Ho9: There is no significant difference in the mean score for Dimension 3, Training
Provided for Inclusion, on the inclusion survey among participants’ levels of education?
Data Analysis
Data from the survey instrument were analyzed through a descriptive, quantitative
research design. Statistical Package for Social Sciences (SPSS) data analysis software

52
was used to conduct all data analysis procedures for this study. Research questions 1, 2,
4, 5, 7, and 8 were analyzed using independent sample t-tests. Research questions 3, 5,
and 9 were analyzed using Analysis of Variences (ANOVAs). Findings of the data are
analyses are represented in Chapter 4. A summary of findings, conclusions, and
recommendations for future practice and research are presented in Chapter 5.
Reliability and Validity
For research to be sound, researchers must take time to address the validity and
reliability issues within their study. Validity refers to the extent to which the concept was
accurately measured (Heale & Twycross, 2015). The other measure of quality in
quantitative research is reliability. This refers to the accuracy of the instrument that the
researcher is using. It also refers to the extent the researcher gets the same results
repeatedly when using the same instrument. The survey was field tested to ensure that
items were easy to understand, and asked participants for the correct information. This
field test was implemented to increase reliability and increase the likelihood of consistent
answers from participants.
Summary
This study examined teachers’ and administrators’ perceptions of inclusion across
three dimensions: resources, training, and personal attitudes. Teachers and administrators
from 3 school districts across East Tennessee were used as the population. The
instrument used to collect and analyze data was a survey that was administered either

53
through paper pencil or an electronic copy. Independent sample t-tests and ANOVAs
were used to analyze the survey items.

54
CHAPTER 4
FINDINGS
This study was designed to examine the attitudes of teachers and administrators
toward inclusion in the classroom. Specifically this study analyzed grade level, years of
teaching experience, and levels of education to examine the manner in which these
factors relate to attitudes of teachers and administrators toward inclusion. Participants
included 183 teachers and administrators in three districts in Tennessee.
The data were presented and analyzed through nine research questions and nine
corresponding null hypotheses from a 27-item survey using a 5-point Likert-type scale.
The remaining three items were demographic questions that were answered through
multiple-choice responses. The survey was distributed initially with a reminder email sent
one week later. Across the three districts, 612 teachers were asked to participate as well
as 69 administrators. Participants were advised that all responses were confidential and
the demographic information collected did not identify participants in the study.
Research Question 1
Research Question 1: Is there a significant difference in the mean score for Dimension 1,
Attitudes toward Inclusion, on the inclusion survey between administrators and teachers?
Ho1: There is no significant difference in the mean score for Dimension 1, Attitudes
toward Inclusion, on the inclusion survey between administrators and teachers?

55
An independent samples t-test was conducted to evaluate whether the mean scores
for Dimension 1, Attitudes toward Inclusion, differed between administrators and
teachers. A survey instrument was used to measure the attitudes of both administrator and
teacher participants. The mean score on Dimension 1 was the test variable and the
grouping variable was the role of the participants. The test was significant, [t(183) = 2.96,
p = .003]. Therefore, the null hypothesis was rejected. See Figure 1 below. There was a
statistically significant difference in the attitude scores of teachers (M = 3.24, SD = .62)
and administrators (M = 3.59, SD = .47). Administrators held more positive attitudes
toward inclusion than teachers. The effect size was small (η2 = .06). Therefore,
participants’ role did play a significant role in scores on the attitudes dimension of the
survey.

56
Figure 1. Comparison of Attitudes Toward Inclusion of Administrators and Teachers.
Note: o = 1.5 to 3 times interquartile range.
Research Question 2
Research Question 2: Is there a significant difference in the mean score for Dimension 1,
Attitudes toward Inclusion, on the inclusion survey between the two groups indicating
years of experience?
Ho2: There is no significant difference in the mean score for Dimension 1, Attitudes
toward Inclusion, on the inclusion survey between the two groups indicating years of
experience?
Atti
tude
s
Administrator Teachers

57
An independent samples t-test was conducted to evaluate whether the mean scores
for Dimension 1, Attitudes toward Inclusion, differed between participants with differing
years of experience. A survey instrument was used to measure the attitudes of both
teachers and administrators with 0-15 years of experience and 16-31 plus years of
experience. The mean score on Dimension 1 was the test variable and the grouping
variable was the role of the participants. The test was significant, [t(183) = 2.07, p =.
040]. Therefore, the null hypothesis was rejected. See Figure 2 below. There was a
significant difference in the years of experience scores of 0-15 years (M = 3.40, SD =
.54) and 16-31 plus years (M = 3.21, SD = .65). Those with 0-15 years of experience held
more positive attitudes toward inclusion than those with 16-31 plus years of experience.
The effect size was small (η2 = .04). Therefore, participants’ years of experience did play
a significant role in scores on the attitudes dimension of the survey.

58
Figure 2. Comparison of Attitudes Toward Inclusion and
Years of Experience
Note: o = 1.5 to 3 times interquartile range
Research Question 3
Research Question 3: Is there a significant difference in the mean score for Dimension 1
(Attitudes toward Inclusion) on the inclusion survey among participants’ levels of
education?
Ho3: There is no significant difference in the mean score for Dimension 1, Attitudes
toward Inclusion, on the inclusion survey among participants’ levels of education?
Atti
tude
s
0-15 16-30

59
A one-way analysis of variance (ANOVA) was conducted to evaluate the
relationship between the attitudes toward inclusion of the participants based on their level
of education (Bachelor’s, Master’s, and a combined category of Educational Specialist
and Doctorate degrees). The independent variable was the level of education and the
dependent variable was the participants’ attitudes toward inclusion. The one way
ANOVA, F(2, 183) =1.79, p = .170 was not statistically significant. Therefore, Ho3 was
retained. The strength of the relationship between attitudes toward inclusion and level of
education was assessed by n2 was small (.01). The results indicated that attitudes toward
inclusion were not significantly affected by education level. The means and standard
deviations for the three education level groups are reported in Table 1.
Table 1.
Means and Standard Deviations of Attitude Levels of Education Groups
EducationLevel N M SDBachelors
Masters
EDSandDoctorate
50
95
40
3.25
3.27
3.46
.59
.62
.61

60
Research Question 4
Research Question 4: Is there a significant difference in the mean score for Dimension 2,
Resources Provided for Inclusion, on the inclusion survey between administrators and
teachers?
Ho4: There is no significant difference in the mean score for Dimension 2, Resources
Provided for Inclusion, on the inclusion survey between administrators and teachers?
An independent samples t-test was conducted to evaluate whether the mean scores
for Dimension 2, Resources toward Inclusion, differed between administrators and
teachers. A survey instrument was used to measure the resources of both administrator
and teacher participants. The mean score on the resources test was the test variable and
the grouping variable was the role of the participants. The test was significant, [t(183) =
2.02, p = .045]. Therefore, the null hypothesis was rejected. See Figure 3 below. There
was a statistically significant difference in the resources scores of teachers (M = 3.02, SD
= .614) and administrators (M = 3.27, SD=.59). Administrators reported having more
resources provided for inclusion than teachers. The effect size was small (η2 = .04).
Therefore, participants’ role did play a significant role in scores on the dimensions of the
survey.

61
Figure 3. Comparison of Training on Inclusion of Administrators and Teachers
Note: o = 1.5 to 3 times interquartile range
Research Question 5
Research Question 5: Is there a significant difference in the mean score for Dimension 2,
Resources Provided for Inclusion, on the inclusion survey between the two groups
indicating years of experience?
Ho5: There is no significant difference in the mean score for Dimension 2, Resources
Provided for Inclusion, on the inclusion survey between the two groups indicating years
of experience.
Training
TeachersAdministrators

62
An independent samples t-test was conducted to evaluate whether the mean scores
for Dimension 2, Resources for Inclusion, differed between participants with differing
years of experience. A survey instrument was used to measure the attitudes of both
teachers and administrators with 0-15 years of experience and 16-31 plus years of
experience. The mean score on the resources test was the test variable and the grouping
variable was the years of experience of the participants. The test was not significant,
[t(183) = .72 , p = .474]. Therefore, the null hypothesis was retained. See Figure 4. There
was not a significant difference in the years of experience scores of 0-15 years (M = 3.04,
SD = .613) and 16-31 plus years (M = 3.10, SD=.62). The effect size as measured η2was
small (.01). Participants’ years of experience did not play a significant role in scores on
the resources for inclusion dimension of the survey.

63
Figure 4. Comparison of Training on Inclusion and Years of Experience
Note: o = 1.5 to 3 times interquartile range
Research Question 6
Research Question 6: Is there a significant difference in the mean score for Dimension 2,
Resources Provided for Inclusion, on the inclusion survey among participants’ levels of
education?
Ho6: There is no significant difference in the mean score for Dimension 2, Resources
Provided for Inclusion, on the inclusion survey among participants’ levels of education?
YearsofExperienceInclusion
Training

64
A one-way analysis of variance (ANOVA) was conducted to evaluate the
relationship between the resources on inclusion of the participants based on their level of
education (Bachelor’s, Master’s, and a combined category of Education Specialist and
Doctorate degrees). The independent variable was the level of education, and the
dependent variable was the participants’ resources on inclusion. The one way ANOVA, F
(2, 183) = 179, p = .170 was not statistically significant. Therefore the null hypothesis
was retained. The strength of the relationship between resources on inclusion and level
of education as assessed by n2 was small (.01). The results indicated that the mean score
for Dimension 2, Resources on Inclusion, was not significantly affected by education
level. The means and standard deviations for the three education level groups are reported
in Table 2.
Table 2. Means and Standard Deviations of Training Levels of Education Groups
EducationLevel N M SDBachelors
Masters
EDSandDoctorate
50
95
40
2.91
3.09
3.20
.61
.61
.63

65
Research Question 7
Research Question 7: Is there a significant difference in the mean score for Dimension 3,
Training Provided for Inclusion, on the inclusion survey between administrators and
teachers?
Ho7: There is no significant difference in the mean score for Dimension 3, Training
Provided for Inclusion, on the inclusion survey between administrators and teachers?
An independent samples t-test was conducted to evaluate whether the mean scores
for Dimension 3, Training on Inclusion, differed between administrators and teachers. A
survey instrument was used to measure the training of both administrator and teacher
participants. The mean score on the training test was the test variable and the grouping
variable was the role of the participants. The test was not significant, [t(183) = .87, p =
.381]. Therefore, the null hypothesis was retained. See Figure 5 below. There was not a
significant difference in the attitude scores of teachers (M = 2.23, SD = .76) and
administrators (M = 2.67, SD = .78). The effect size as measured by η2was small (.01).
Therefore, participants’ role did not play a significant role in scores on the training on
inclusion dimension of the survey.

66
Figure 5. Comparison of Resources for Inclusion of Administrators and Teachers
Research Question 8
Research Question 8: Is there a significant difference in the mean score for Dimension 3,
Training Provided for Inclusion, on the inclusion survey between the two groups
indicating years of experience?
Ho8: There is no significant difference in the mean score for Dimension 3, Training
Provided for Inclusion, on the inclusion survey between the two years of experience
groups?
Administrators
Resources
Teachers

67
An independent samples t-test was conducted to evaluate whether the mean score
for Dimension 3, Training on Inclusion, differed between participants with differing
years of experience. A survey instrument was used to measure the training of both
teachers and administrators with 0-15 years of experience and 16-31 plus years of
experience. The mean score on the resources test was the test variable and the grouping
variable was the years of experience of the participants. The test was not significant,
[t(183) = .30, p = .764. Therefore, the null hypothesis was retained. See Figure 6. There
was not a significant difference in the years of experience scores of 0-15 years (M = 2.59,
SD = .75) and 16-31 plus years (M = 2.55, SD = .78). The effect size as measured η2 was
small (.01). Therefore, participants’ years of experience did not play a significant role in
scores on the training on inclusion dimension of the survey.

68
Figure 6. Comparison of Resources for Inclusion and Years of Experience
Research Question 9
Research Question 9: Is there a significant difference in the mean score for Dimension 3,
Training Provided for Inclusion, on the inclusion survey among participants’ levels of
education?
Ho9: There is no significant difference in the mean score for Dimension 3, Training
Provided for Inclusion, on the inclusion survey among participants’ levels of education?
0-15
Resources
16-30

69
A one-way analysis of variance (ANOVA) was conducted to evaluate the
relationship between the resources for inclusion of the participants based on their level of
education (Bachelor’s, Master’s, and a combined category of Education Specialist and
Doctorate degree). The independent variable was the level of education, and the
dependent variable was the participants’ scores on the resources for inclusion dimension.
The one way ANOVA, F (183) = 1.45 p = .235 was not statistically significant. Therefore
the null hypothesis was retained. The strength of the relationship between attitudes
toward inclusion and level of education was assessed by η2 was small (.01). The results
indicated that training on inclusion was not significantly affected by education level. The
means and standard deviations for the three education level groups are reported in Table
3.
Table 3. Means and Standard Deviations of Resource Levels of Education Groups
EducationLevel N M SDBachelor’s
Master’s
EDSandDoctorate
50
95
40
2.91
3.09
3.20
.61
.61
.63

70
CHAPTER 5
SUMMARY, CONCLUSIONS, AND RECOMMENDATIONS FOR PRACTICE AND FUTURE RESEARCH
This chapter contains a summary of the findings, conclusions, implications for
practice, and recommendations for future research. This study was designed to examine
the attitudes of teachers and administrators toward inclusion in the classroom.
Specifically this study analyzed grade level, years of teaching experience, and levels of
education to examine the manner in which these factors relate to attitudes of teachers and
administrators toward inclusion. This could be helpful for readers who will use this study
as a basis for inclusion implementation within their district. The study was conducted
using data from an online survey collected from three different districts in Tennessee;
Johnson City Schools, Greeneville City Schools, and Putnam County Schools.
Conclusion
The following conclusions were made based on the analysis of the data in this
study. Results showed that across the three dimensions of attitudes, resources, and
training, regardless of demographics, only three of the nine research questions were
found to be significant. Dimension 1, Attitudes toward Inclusion, examined participant’s
attitudes about the inclusion of students with disabilities in a general education setting.
Dimension 2, Training on Inclusion, examined the amount of training each participant
had regarding inclusion. Dimension 3, Resources for Inclusion, examined the amount of
resources teachers and administrators received for inclusion. No significant differences
were found based on demographics in resources for inclusion. The only statistically

71
significant findings were in research questions 1, 2 and 4. A significant difference was
found in research question 1, which referenced the different attitudes toward inclusion
held by teachers and administrators. The data showed that administrators hold more
positive attitudes toward inclusion than teachers do. A significant difference was found
in research question 2, which referenced the different attitudes toward inclusion held by
teachers and administrators with 0-15 years of experience and 16-31+ years of
experience. The data showed that participants who had fewer than 16 years of experience
hold more positive attitudes toward inclusion than teachers with 16 or more years of
experience. The last significant difference was found in research question 4, which
referenced training on inclusion held by teachers and administrators. The data showed
that administrators indicated they had more training on inclusion than teachers indicated.
Discussion
All demographic groups reported not having an adequate understanding of the
proper implementation of inclusion or enough training on inclusion and students in an
inclusive classroom. A lack of experience or knowledge on the inclusive classroom has
been a leading reason general education teachers are reluctant to embrace the concept of
inclusion (Bosch, 2015). Federal law requires the implementation of the inclusion of
students with disabilities in the general education setting. According to Subban and
Sharma (2005) general education teachers expressed a need for more in depth
information on the correct way to include students with disabilities. When teachers do not
feel trained or prepared to participate in a program that they are required to implement,
this can lead directly to a negative attitude toward inclusion and students in an inclusive

72
classroom. This was confirmed by Farris (2011) who reported that the amount of training
and college credits relating to special education were directly correlated with
administrators’ attitudes towards inclusion. Administrators play a vital role in the proper
implementation of inclusion. Though they do not deliver direct instruction and are not
often integrated in the daily classroom setting, they are responsible for creating a positive
school culture. Research indicates that a principal’s vision and mission for the school
directly impact the implementation of inclusive programs (Harris, 2009). Teachers expect
to get guidance and support from principals, thus a principal’s attitude toward the
inclusion of students with disabilities in a general education program is important.
An additional finding was that participants reported not having enough resources
to support the education of students with disabilities in a general education setting.
Whether it was enough time to plan and prepare with a special education teacher,
assistants for the students with disabilities, or support on research-based teaching
techniques, participants overall felt that they were not provided with enough assistance to
meet the educational needs of students with disabilities in a general education setting.
Recommendations for Practice
The following are recommendations for implementing the inclusion of students
with disabilities in a general education setting.
1. College course requirements should include more than one introduction to
special education courses. General education teachers, despite obtaining a
general education degree, should be required to take a minimum of 9-12 credit
hours of special education courses. In school systems today, a large number of

73
students with disabilities are being educated in a general education setting by
a teacher with a general education degree. These teachers are often unprepared
to meet the educational needs of these students due to a lack of knowledge on
disabilities and effective teaching techniques for students with disabilities.
Teachers who feel unprepared to meet the educational needs of students with
disabilities due to a lack of training can lead to negative attitudes towards
inclusion. This supports the findings of Scruggs and Mastropieri (1996).
Participants in the study reported a lack of training on inclusion, as well as
reported a lack of basic understanding of disabilities and strategies to support
students with disabilities.
2. School districts should provide professional development opportunities on
inclusion that are specifically designed for teachers with more than 15 years of
experience. This supports the findings of this study which indicated teachers
with 0-15 years of experience held more positive attitudes toward inclusion
than those teachers with 16 or more years of experience.
3. School districts should provide professional development for general
education and special education teachers on the implementation of inclusion,
teaching practices, coteaching, and other topics related to inclusion within a
general education setting. According to Subban and Sharma (2005) general
education teachers expressed a need for more in-depth information on the
correct way to include students with disabilities. A lack of experience or
knowledge on the inclusive classroom has been a leading reason general
education teachers are reluctant to embrace the concept of inclusion (Bosch,

74
2015). Providing administrators and teachers with support and training on the
implementation framework for that specific district, as well as continual
training throughout the year, can ease the discomfort of the unknown and
provide teachers with tools and strategies to use within their daily practice.
4. School districts should allocate more funds for students with disabilities
served in a general education setting. Findings from this study indicated that
neither teachers nor administrators felt as if there were enough resources to
properly implement inclusion. An increase in funding would allow more
instructional assistants to be with students with disabilities in the general
education setting as well as provide additional learning resources and
technology to meet the needs of multiple learning styles. This allocation for
additional funding should be advocated for by administrators in order to
support all learners within their building.
Recommendations for Future Research
The findings and conclusions of this research have enabled the researcher to
identify the following recommendations for future research regarding the implementation
of inclusion in a general education setting.
1. Future researchers could select one school district and provide teachers and
administrators more training on inclusion. This district could be given a survey
prior to the training and then a follow up survey after the training to determine if
attitudes toward inclusion in the classroom shifted due to the increase in training
opportunities.

75
2. Future researchers could select one district to receive additional resources but
no extra training on inclusion. This district could also be given a survey prior to
receiving the additional resources and then a follow up survey after to determine
if attitudes toward inclusion in the classroom shifted due to the increase in
additional resources. This would be helpful in determining which participants
value more, training or support and resources.
3. Future researchers could conduct a study to determine whether students with
certain disabilities are having more success by looking at student success
indicators.
4. Future researchers could conduct a qualitative study to delve deeper into
administrator and teacher attitudes toward inclusion as well as the types of
training that would be most beneficial. Interviews could be conducted that allow
for explanation and expansion of answers.
5. Future researchers could conduct a follow up study to determine which
resource teachers express the most need for. Findings from this study indicated
that teachers expressed the need for additional resources, but did not specify
which resource teachers valued the most. The follow up study would create a
more in depth look into the resources teachers indicate would benefit their
students most.
6. Future researchers could conduct a follow up study to attempt to determine the
difference between administrators’ and teachers’ attitudes towards inclusion
across the dimensions that resulted in a significant difference.

76
Summary
The statistical analysis reported in this study was based on nine research
questions and nine null hypotheses presented in Chapters 1 and 3. Each dimension
contained three demographics. The first two dimensions were analyzed using an
independent sample t-test and the third was analyzed using a one-way ANOVA. A total
of 183 teachers and administrators participated in the study. The level of significance
used for the statistical tests was .05. Findings indicated that the role of teacher or
administrator, years of experience, or level of education did not play a significant role in
the participants’ perceptions of training and resources dimensions of inclusion. However,
the findings did indicate that there was a significant difference in the attitudes toward
inclusion based upon role and years of experience. All participants acknowledged that
they did not feel that they had adequate training or understanding about properly
implementing inclusion.

77
REFERENCES
Anderson, M.J. (2010) Students with Disabilities in General Education Settings: General Education Teacher Preparation. (Doctoral Dissertation). Retrieved on March 16, 2017 from K-State Electronic Theses, Dissertations, and Reports http://hdl.handle.net/2097/4619
Avramidis, E., & Norwich, B. (2002) Teachers’ attitudes towards integration / inclusion: A review of the literature, European Journal of Special Needs Education, 17(2), 129–147.
Bernstein, B. (1962). Case law in Plessy V. Ferguson. The Journal of Negro History, 47(3), 192-198. Bishop, D. (1977). Plessy V. Ferguson: A reinterpretation. The Journal of Negro History, 62(2), 125-133. Bochenek, H. (2008) Approving or disapproving: Parent perceptions of inclusion at the elementary level. (Doctoral Dissertation). Retrieved from Proquest. (3320683).
Chandler, T. (2015) School Principal Attitudes toward the Inclusion of Students with Disabilities. (Doctoral Dissertation). Retrieved on March 16, 2017 from Walden Dissertations and Doctoral Studies http://scholarworks.waldenu.edu/cgi/viewcontent.cgi?article=1176&context=dissertations
Coats, K. (1985). The Education of All Handicapped Children Act since 1975. Marquette Law Review, 69. Cook, L. & Friend, M. (1995). Coteaching: Guidelines for creating effective practices. Focus on Exceptional Children, 28, 1-16. Cook, B.G., Semmel, M.I., & Gerber, M.M. (1999). Attitudes of principals and special education teachers toward the inclusion of students with mild disabilities: Critical differences of opinion, Remedial and Special Education, 20(4), 199–207.
Darrow, A. (2008) Barriers to effective inclusion and strategies to overcome them, General Music Today, 22(3), pp. 29–31.
DeMatthews, D.E. (2015) Clearing a path for inclusion: Distributing leadership in a high performing elementary school, Journal of School Leadership, 25, 1000–1038.
DeMatthews, D.E. & Mawhinney, H. (2013). Addressing the inclusion imperative: An urban school district’s responses’, Education Policy Analysis Archives, 21(61), 1– 27.

78
Dugnan Bruster, D. (2014) Comparing the Perceptions of Inclusion between General Education and Special Education Teachers. (Doctoral Dissertation) Retrieved on March 17, 2017 fromDigital Commons @ Liberty University http://digitalcommons.liberty.edu/doctoral/814/ Elhoweris, H., & Alsheikh, N. (2004). Teachers’ attitudes toward inclusion. International Journal of Special Education, 21(1), 115-118. Elliott, M. (2001). Race, color blindness, and the Democratic public: Albion W. Tourgée's radical principles in Plessy v. Ferguson. The Journal of Southern History, 67(2), 287-330. Fatig, M., & Taylor, M. (2008). CoTeaching in the differentiated classroom: Successful collaboration, lesson design, and classroom management. San Francisco: Jossey- Bass. Fedrico, M.A., Herrold, B., & Venn, J. (2000). Inclusion reaches beyond the classroom. Kappa Delta Pi Record, 36(4), 178-180. Ferri, B.A., & Connor, D.J. (2005). In the shadow of brown: Special education and Overrepresentation of students of color, Remedial and Special Education, 26(2), 93–100.
Foy, J. (2008). Plessy v. Ferguson. In Wilson, C. (Author) & Ely, J. & Bond, B. (Eds.), The New Encyclopedia of Southern Culture: Volume 10: Law and Politics (pp. 115-116). University of North Carolina Press. Gasman, M., & Hilton, A. (2012) Mixed motivations, mixed results: A history of law, legislation, historically black colleges, and universities, and interest convergence, Teachers College Record, 114, 1–34.
Gloeckler, L., & Daggett, W. (2004). NCLB: A crossroads for special education.
Groves, H. (1951). Separate but equal--The doctrine of Plessy v. Ferguson, Phylon (1940-1956), 12(1), 66-72. Harris, J.D. (2009) Elementary School Assistant Principals’ Attitudes Towards Inclusion of Special Needs Students in the General Education Setting. (Doctoral Dissertation). Retrieved from Proquest (33399046).
Hallahan, D.P, Kauffman, J.M., & Pullen, P.C. (2009). Exceptional Learners. An Introduction to Special Education. Boston, MA: Pearson. Howard, P. (2004). The least restrictive environment: How to tell? Journal of Law and Education, 32(2), 167–180.

79
Jenkins, J. (2012) Secondary School Administrators’ Perceptions of Leading and Implementing No Child Left Behind Mandates for Alabama Students with Disabilities. (Doctoral Dissertation). Retrieved on March 16th, 2017 from UAB Digital Commons on http://contentdm.mhsl.uab.edu/cdm/singleitem/collection/etd/id/1458/rec/45
Jimenez, T., Graf, V., & Rose, E. (2007) Gaining access to general education: The promise of universal design for learning’, Issues in Teacher Education, 16(2), 41– 54.
Kaufman, A.K., & Blewett, E. (2012). When good is no longer good enough: How the high stakes nature of No Child Left Behind Act supplanted the Rowley definition of a free appropriate public education. Journal of Law & Education, 41, 5-23. Kavale, K.A., & Forness, S.R. (2000) History, rhetoric, and reality: Analysis of the inclusion debate, Remedial and Special Education, 21(5), 279–296.
Keogh, B. (2007) Celebrating PL 94-142, Issues in Teacher Education, 16(2), 65–69.
Kloos, A., & Zigmond, N. (2008). Coteaching revisited: Redrawing the blueprint. Preventing School Failure, 52(2), 12-20. Kuyini, A.B., & Desai, I. (2007) Principals? And teachers? Attitudes and knowledge of inclusive education as predictors of effective teaching practices in Ghana, Journal of Research in Special Educational Needs, 7(2), 104–113.
Lorio, K. (2011) Louisiana High School Principals’ Attitudes towards Inclusion. (Doctoral Dissertation). Retrieved from Proquest (536024).
M.L., Y. (1995). The least-restrictive-environment mandate and the courts: Judicial activism or judicial restraint? Exceptional Children: Journal of the International Council for Exceptional Children, 61, 578–581.
Martin, E.W., Martin, R., & Terman, D.L. (1996). The legislative and litigation history of special education, The Future of Children, 6(1), 25.
McNeal, L.R. (2009). The re-segregation of public education now and after the end of Brown v. Board of Education, Education and Urban Society, 41(5), 562–574.
Murray, M. (2012). Leadership to Promote Inclusion: Perceptions of Elementary Principals on Inclusion, Co-teaching, and Differentiated Instruction. (Doctoral Dissertation). Retrieved on March 17th, 2017 from D-Scholarship @ Pitt http://d-scholarship.pitt.edu/17037/
Obiakor, F. (2011). Maximizing access, equity, and inclusion in general, and special education’, The Journal of International Association of Special Education, 12(1), 10–16.

80
Olinger, B. (2013). Elementary Teachers’ Perspectives of Inclusion in the Regular Education Classroom. (Doctoral Dissertation). Retrieved on March 16th, 2017 from Digital Commons @ East Tennessee State University http://dc.etsu.edu/cgi/viewcontent.cgi?article=2359&context=etd
Perry A., Z. (2005). Does Brown v. Board of Education play a prominent role in special education law, Journal of Law and Education, 34(2), 255–271.
Pickren, W.E. (2004). Fifty years on: Brown v. Board of education and American psychology, 1954-2004 an introduction, American Psychologist, 59(6), 493–494.
Rivera- Tubbs, T. (2012) Perspectives of Administrators, Teachers, and Parents Regarding Inclusion of Special Needs Students in a Faith Based School: A Qualitative Study. (Doctoral Dissertation) Retrieved from Proquest (3544962).
Ross-Hill, R. (2009). Teacher attitude towards inclusion practices and special needs students, Journal of Research in Special Educational Needs, 9(3), 188–198.
Rubin, S.G. (2016). Brown v. Board of Education: A fight for simple justice, The Horn Magazine (November), 132–133.
Russo, C.J., Osborne, A.G., & Rus.., C.J. (2008) Essential concepts and school-based cases in special education law. Thousand Oaks, CA: Corwin Press.
Rusthoven, P.J. (2014) High Court opted for common sense, Indianapolis Business Journal, 9.
Ryan, J. (2010). Establishing inclusion in a new school: The role of principal leadership’, Exceptionality Education International, 20(2), 6–24.
Sailor, W., & Roger, B. (2005). Rethinking inclusion: School wide applications. Phi Delta Kappan, 503-509. Savich, C. (2008). Unfunded Mandates? : An Analysis of Pontiac School Board v. Spellings, The Legal Challenge to the No Child Left Behind Act. (Doctoral Dissertation). Retrieved from ERIC (501713).
Scruggs, T. E., & Mastropieri, M. A. (1996). Teacher perceptions of mainstreaming inclusion, 1958-1995: A research synthesis. Exceptional Children, 63, 59-74.
Scruggs, T., Mastropieri, M. & McDuffie, K. (2007, Summer 2007). Coteaching in the inclusive classroom: A metasynthesis of qualitative research. Exceptional Children, 73(4), 392-416.
Shealey, M.W., Lue, M.S., Brooks, M., & Mccray, E. (2005a) Examining the legacy of Brown: The impact on special education and teacher practice, Remedial and Special Education, 26(2), 113–121. doi: 10.1177/07419325050260020601.

81
Skiba, R.J., Simmons, A.B., Ritter, S., Gibbs, A.C., Kargen Rausch, M., Cuadrado, J., & Chung, .G. (2008) Achieving Equity in Special Education: History, Status, and Current Challenges.
Smith, T.E.C., Polloway, E.A., Patton, J.R., & Dowdy, C.A. (2003a) Teaching students with special needs in inclusive settings. 4th edn. Boston, MA: Pearson, Allyn and Bacon.
Spalding, L.S., & Pratt, S.M. (2005). A review and analysis of the history of special education and disability advocacy in the United States, American Educational History Journal, 42(1), 99–109.
Strayhorn, T.L., & Johnson, R.M. (2014).Why are all the white students sitting together in college? Impact of Brown v. Board of education on cross-racial interactions among blacks and whites’, The Journal of Negro Education, 83(3), 385–399. doi: 10.7709/jnegroeducation.83.3.0385
Subban, P., & Sharma, U. (2005) Understanding educator attitudes toward the implementation of inclusive education, Disability Studies Quarterly, 25(2).
Supreme Court of the United States. Plessy v. Ferguson. May 18, 1896. (1896). The Virginia Law Register, 2(5), 327-347. Swann-Wright, Dianne. “Plessy v. Ferguson.” Footsteps, Mar.-Apr. 2003, p. 10 Taylor, K.R. (2011). ‘Inclusion and the Law, The Education Digest (May), pp. 48–51.
Thomason, M. (2009.) Discipline of Special Education Students: Legal Implications for Policy and Procedure. (Doctoral Dissertation). Retrieved from Proquest (3360773).
Tilson, L.K. (2011). A Quantitative Analysis of General Education Teachers’ Perceptions of Their Knowledge of Special Education Law, Processes, and Procedures. (Doctoral Dissertation). Retrieved on March 16, 2017 from Digital Commons @ East Tennessee State University http://dc.etsu.edu/etd/1344/
Vasillopulos, C. (1994). Prevailing upon the American dream: Thurgood Marshall and brown v. Board of education, The Journal of Negro Education, 63(3), 289. doi: 10.2307/2967181.
Volonino, V., & Zigmond, N. (2007). Promoting research-based practices through inclusion? Theory Into Practice, 46(4), 291-300. Wang, M.C., & Reynolds, M.C. (1996). Progressive inclusion: Meeting new challenges in special education, Theory Into Practice, 35(1), 20–25.
Warren, C. J. E. (1954). Brown v. board of education. United States Reports, 347(1954), 483

82
Washington, N. (2010). School Administrators’ Attitudes towards the Inclusion of Disabled Students in the General Education Setting. (Doctoral Dissertation). Retrieved from Proquest (3412492).
Webb, L. D. (2006). The history of American education: A great American experiment. Upper Saddle River, NJ: Pearson Education. Weber, M.C. (2009). Special education law: Challenges old and new, Phi Delta Kappan, 90(10), 728–732. doi: 10.1177/003172170909001009.
Weintraub, F. (2005). The evolution of LD policy and future challenges, Learning Disability Quarterly, 28(2), 97–99.
Williams, J. (2015). Attitudes and Perceptions of Public School Principals in Illinois Toward Inclusion Of Students with Disabilities in the General Education Classroom. (Doctoral Dissertation). Retrieved from Proquest (3700733).
Yell, M.L., Rogers, D., & Rogers, E.L. (1998). The legal history of special education: What a long, strange trip it’s been! Remedial and Special Education, 19(4), 219– 228.
Zigmond, N., & Magiera, K. (2001). A focus on coteaching: Use caution. Current practice alerts from the Division for Learning Disabilities and Division for Research of the Council for Exceptional Children, 6. Zirkel, P.A. (2015) Special education law: Illustrative basics and nuances of key IDEA components, Teacher Education and Special Education: The Journal of the Teacher Education Division of the Council for Exceptional Children, 38(4), 263– 275.

83
APPENDICES
APPENDIX A: COPY OF TEACHER TECHNOLOGY SURVEY

84

85

86

87

88

89

90

91
APPENDIX B: JOHNSON CITY SCHOOLS APPROVAL LETTER

92
APPENDIX C: PUTNAM COUNTY SCHOOLS APPROVAL LETTER

93
APPENDIX D: GREENEVILLE CITY SCHOOLS APPROVAL EMAIL
94
VITA
HEATHER N. LEMAY
Education: Bachelors of Arts in Education Tusculum College Greeneville TN 37743
Master’s Degree in Curriculum Development and Instruction
Tusculum College Greeneville TN 37743
Ed.D. Educational Leadership East Tennessee State University Johnson City, Tennessee, 2017
Professional Experience: Special Education Extended Resource Teacher:
Morristown Tennessee 2012-2015
Special Education Pre- K teacher: Johnson City Tennessee 2015-2017