Embed Size (px)
Citation preview

Adjuvants to Mechanical Ventilation for Acute Respiratory
Failure
by
Laveena Munshi
A thesis submitted in conformity with the requirements
for the degree of Masters of Science
Institute of Health Policy, Management and Evaluation
University of Toronto
© Copyright by Laveena Munshi 2016
ii
Adjuvants to Mechanical Ventilation for Acute Respiratory Failure
Laveena Munshi
Masters of Science
Institute of Health Policy, Management and Evaluation
University of Toronto
2016
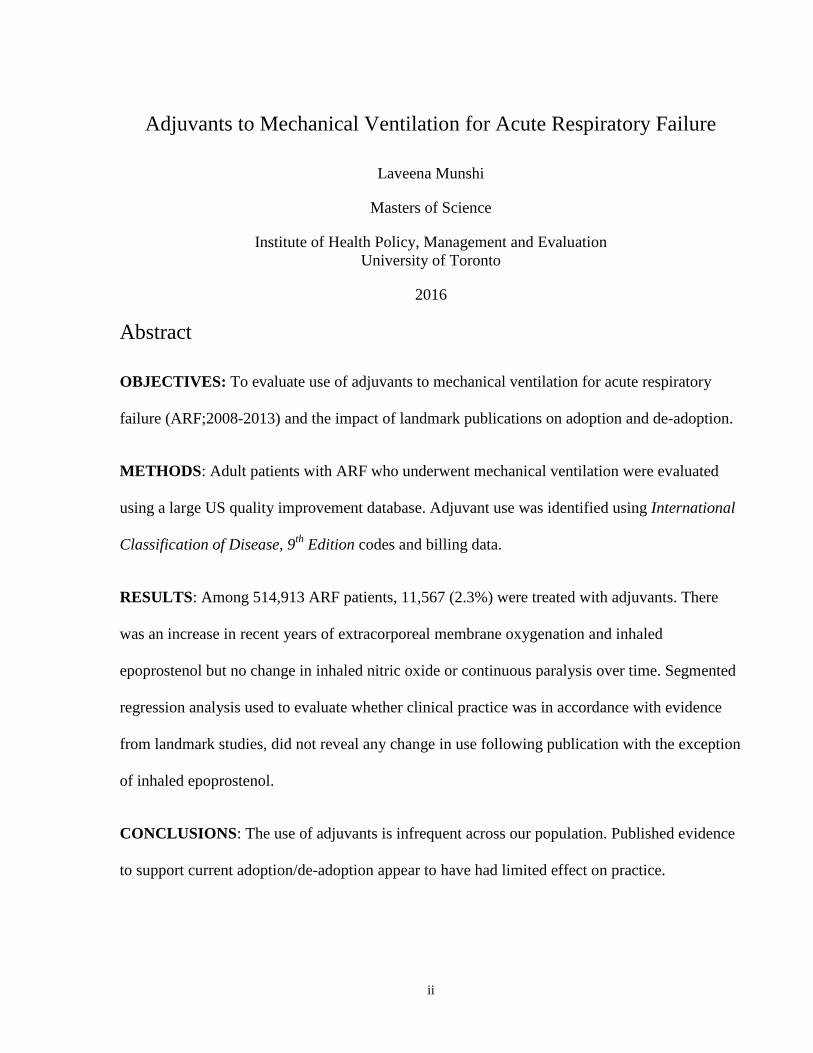
Abstract
OBJECTIVES: To evaluate use of adjuvants to mechanical ventilation for acute respiratory
failure (ARF;2008-2013) and the impact of landmark publications on adoption and de-adoption.
METHODS: Adult patients with ARF who underwent mechanical ventilation were evaluated
using a large US quality improvement database. Adjuvant use was identified using International
Classification of Disease, 9th
Edition codes and billing data.
RESULTS: Among 514,913 ARF patients, 11,567 (2.3%) were treated with adjuvants. There
was an increase in recent years of extracorporeal membrane oxygenation and inhaled
epoprostenol but no change in inhaled nitric oxide or continuous paralysis over time. Segmented
regression analysis used to evaluate whether clinical practice was in accordance with evidence
from landmark studies, did not reveal any change in use following publication with the exception
of inhaled epoprostenol.
CONCLUSIONS: The use of adjuvants is infrequent across our population. Published evidence
to support current adoption/de-adoption appear to have had limited effect on practice.

iii
Acknowledgments
I would like to acknowledge the support and guidance I received from my thesis committee Drs.
Gordon Rubenfeld (supervisor) Eddy Fan, Hannah Wunsch, Niall Ferguson and Therese Stukel.
Their patience, wisdom and mentorship have had a great impact on the career path I hope to
pursue.
I would also like to acknowledge Dr. Hayley Gershengorn for her contribution in assisting with
the database and for facilitating access to the data in order for me to perform the data analysis at
Montefiore Medical Center.

iv
Table of Contents
Contents
Acknowledgments.......................................................................................................................... iii
Table of Contents .......................................................................................................................... iiv
List of Tables ................................................................................................................................. vi
List of Figures .............................................................................................................................. vii
List of Appendices ...................................................................................................................... viii
Chapter 1 Adjuvants to Mechanical Ventilation for Acute Respiratory Failure ...............................
Background .................................................................................................................................1 1.
1.1 Rationale, Evidence and Current Use of Adjuvant Therapy
1.1.1 Acute Respiratory Failure Management……………………………………………1
1.1.2 Pharmacologic Adjuvants………………………………………………………..…2
1.1.3 Non-Pharmacologic Adjuvants…………………………………………………..…5
1.1.4. Factors Affecting Adoption and De-adoption……………………………………...7
1.1.5. Conclusions………………………………………………………………………....9
2. Adjuvant Therapy to Mechanical Ventilation Changes in Use and Factors Associated with
Use………………………………………………………………………………………………10
2.1 Introduction………………………………………………………………………………10
2.2 Methods…………………………………………………………………………………..11
2.2.1 Study Population…………………………………………………………………..11
2.2.2 Outcomes…………………………………………………………………………12
2.2.3 Statistical Analysis……………………………………………………………….12.
v
2.2.4 Sensitivity Analysis……………………………………………………………….14
2.3 Results……………………………………………………………………………………15
2.3.1 Cohort Assembly…………………………………………………………………..15
2.3.2 Changes Over Time………………………………………………………………..16
2.3.3 Factors Associated with Use……………………………………………………….18
2.4 Discussion………………………………………………………………………………..19
3. Conclusions and Future Direction…………………………………………………………....20
References……………………………………………………………………………………44
Appendix……………………………………………………………………………….…….48

vi
List of Tables
Table 1: Reported Use for Common Adjuvants in Acute Respiratory Failure
Table 2: ICD9-CM Inclusion and Exclusion Criteria Codes
Table 3: Landmark Studies Evaluated
Table 4: Baseline Demographic Characteristics
Table 5: Adjuvant Frequencies
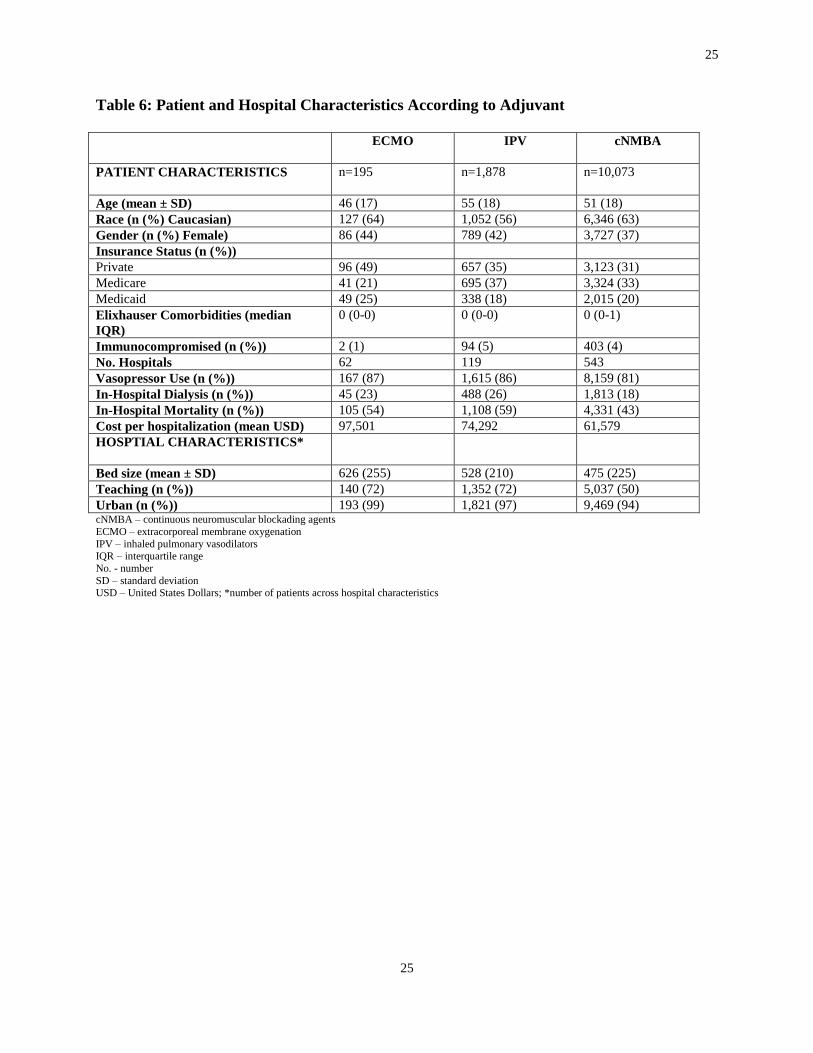
Table 6: Patient and Hospital Characteristics According to Adjuvant
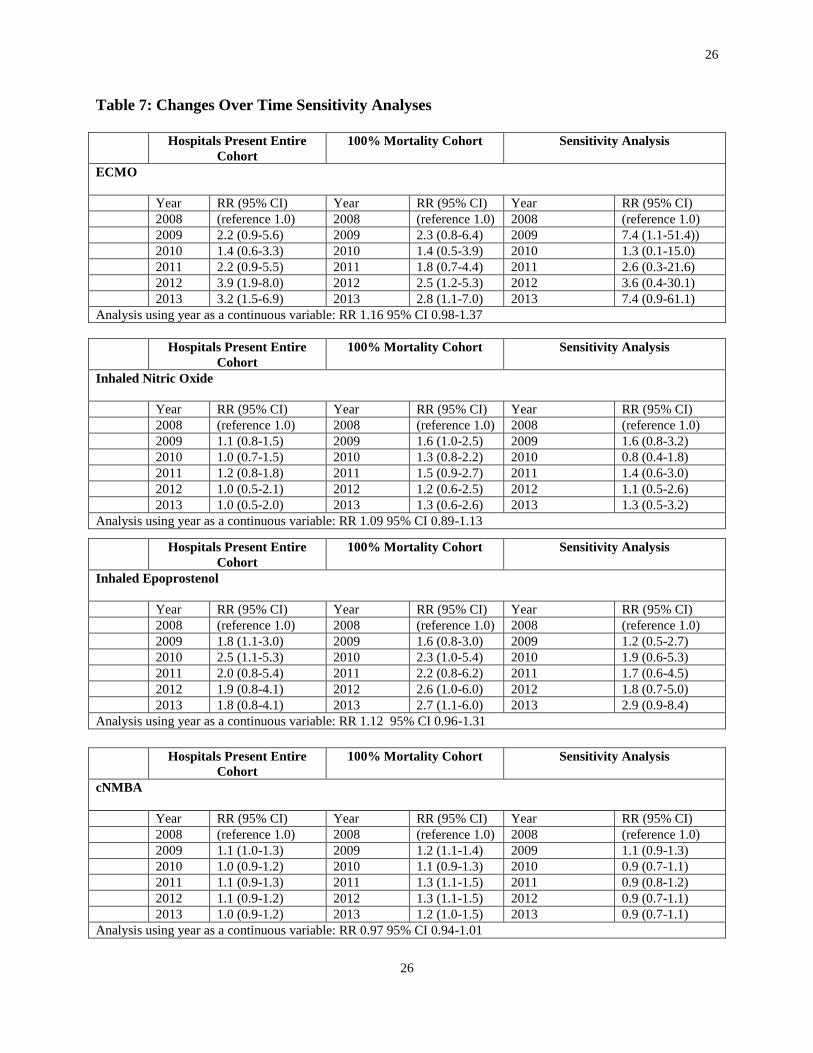
Table 7: Sensitivity Analyses
vii
List of Figures
Figure 1. Adjuvants for Acute Respiratory Failure
Figure 2: Factors that Drive Decision Making
Figure 3: Cohort Creation
Figure 4: Changes in Use of Adjuvant Therapy
Figure 5: Impact of Landmark Publications on Changes in Use Over Time
Figure 6: Changes in Use of Pulmonary Artery Catheter
Figure 7: Factors Associated with Adjuvant Use

viii
List of Appendices
Table 1: Neuromuscular Blockading Agent Dose Determination

1
Adjuvants to Mechanical Ventilation for Acute Respiratory
Failure
Background 1
1.1 Rationale, Evidence and Current Use of Adjuvant Therapy
1.1.1 Acute Respiratory Failure Management
Acute respiratory failure (ARF) is a common reason for admission to an intensive care unit
(ICU) and the need for mechanical ventilation. Acute respiratory distress syndrome (ARDS) is a
severe form of hypoxemic ARF, with bilateral infiltrates consistent with pulmonary edema on
chest radiography that is not primarily due to a cardiogenic etiology (1). Mortality from ARF
and ARDS is high and similar across both categories (30-40%) with most deaths resulting from
multi-organ failure and sepsis (2). Limited pharmacologic therapy has proven effective in ARF
and management is focused primarily on supportive care with mechanical ventilation (1, 3-5).
Currently, lung protective pressure- and volume-limited ventilatory strategies aimed at
mitigating ventilator-associated lung injury (VALI) have become the standard of care (5).
Despite the use of lung protective ventilation, a number of patients may develop refractory
hypoxemia and/or hypercapnia, and may not be able to achieve adequate gas exchange without
using injurious levels of ventilatory support.
An adjuvant for ARF is any intervention, in addition to or instead of mechanical ventilation, that
is used to facilitate gas exchange or enhance compliance with lung protective ventilation (Figure
1). Pharmacologic adjuvants have been the focus of many studies for years and include diuretics,
corticosteroids, neuromuscular blocking agents and inhaled pulmonary vasodilators. Non-
pharmacologic agents include prone positioning, high frequency oscillatory ventilation and
extracorporeal life support. These non-pharmacologic options have been the focus of many large
trials in recent years (Table 1). A series of proposal algorithms for adjuvant application have
been proposed over recent years (Figure 1). While most of the evidence surrounding adjuvant
use has focused on patients with ARDS, recent international observational data has demonstrated

2
the application of adjuvants in patients with ARF even if formal criteria for ARDS is not met or
in patients in whom ARDS is unrecognized (3).
1.1.2 Pharmacologic Adjuvants
Neuromuscular blocking agents may minimize ventilator associated lung injury by preventing
large spontaneous tidal volumes, reducing ventilator dys-synchrony, and possibly decreasing the
inflammatory response associated with ARF and ARDS (6). In addition, paralysis may stop any
subclinical evidence of muscle activity, potentially improving oxygenation through minimization
of oxygen consumption. A large retrospective observational study of data from 2004-2006,
evaluated the frequency of use and impact of early administration of paralysis in patients with
severe sepsis who were mechanically ventilated and found that 23% of patients received early
paralysis (7). Early paralysis was associated with a lower mortality (32% vs. 38%) In a
randomized controlled trial (RCT) in 2010, the continuous, early administration of cisatracurium
in moderate-severe ARDS (PaO2/FiO2 <150) was associated with an improvement in 90-day
mortality (8). The trial found that the beneficial effect of cisatracurium was confined to patients
presenting with a PaO2/FiO2 < 120 suggesting that patients with severe ARDS might receive the
greatest benefit from this intervention. Following this publication, only 15% of UK physicians
report using neuromuscular blocking agents ―routinely‖ (9). Most recently, in the Large
Observational Study to Understand the Global Impact of Severe ARF (LUNG-SAFE) study, a
prospective observational study of ARF and ARDS across 50 countries, paralysis was used in
22% of all ARDS patients and in 38% of the severe ARDS subgroup (3).
Non-hydrostatic pulmonary edema is one of the hallmarks of ARDS and can complicate all
causes of ARF. Additionally, excess fluid administered during the resuscitation phase of septic
shock could contribute to the development of abdominal compartment syndrome, further
restricting lung expansion. The role of a conservative fluid management strategy combined with
diuretic administration during ARF management has been evaluated as a mechanism by which
one could improve lung compliance and oxygenation and has been demonstrated to reduce
duration of mechanical ventilation. The Fluid and Catheter Treatment Trial (FACTT) assessed a
conservative fluid management strategy combined with diuretic administration as a mechanism
to improve lung compliance and oxygenation, finding an increased number of ventilator free
days (10). However, the complex algorithm, lack of mortality benefit and possible risk of
3
neurocognitive complications might impact widespread adoption (11). Evidence of adoption of
diuretic administration has not been extensively evaluated following this publication. Variability
in use of diuretics for ARDS has been reported across different centers. In a recent survey
administered to intensivists in Australia and New Zealand evaluating diuretic use, 74% of
intensivists indicated that they would administer loop diuretics for ARDS; however,
approximately 20% reported that they would not (12). An observational study evaluating
prescribing patterns across 150 ARDS patients demonstrated that loop diuretics were only
actually prescribed in 39% of patients (13). Despite an increasing focus on the harms associated
with a positive fluid balance in patients, there is a lack of evidence on how physicians implement
this in practice. Non-invasive hemodynamic monitoring devices leading potentially to more
precise evaluations of volume status or a focus on ―de-resuscitation‖ in sepsis has perhaps led to
changes in diuretic administration. More insight into current practice, particularly in light of the
recent publication of ―FACTT lite‖ which provides a simpler approach to a conservative fluid
management strategy, is needed to highlight whether areas for improved compliance with
diuresis exist (14).
The early administration of corticosteroids as a mechanism to combat septic shock in order to
down regulate the systemic inflammation as well as the late administration of steroids in the
fibroproliferative phase of ARDS, has been evaluated in a number of clinical trials (15, 16).
However, beyond steroid-responsive precipitants for ARDS (e.g. systemic vasculitis), a role for
corticosteroids in routine care of ARDS patients has not been established. Promising preliminary
evidence currently exists for its potential role with ARF in order to prevent ARDS in the setting
of severe community acquired pneumonia (17). Despite these findings, current use of
corticosteroid for ARDS patients remains variable but high. One study reports use in 41% of
ARDS cases – higher than the use of diuretics or neuromuscular blocking agents (13). In a 2010
questionnaire in German ICUs regarding ARDS management practices, corticosteroids were
used in 52% of hospitals (18). In a separate study, 70% of UK physicians surveyed in 2012
endorsed the use of corticosteroids; however, only 6% used them routinely (9). The LUNG-
SAFE study found that high dose corticosteroids (equivalent to >1mg/kg methylprednisone) was
used in 17.9% of patients with ARDS and 23.3% in the subset with severe ARDS (3).
Inhaled nitric oxide (NO) is a selective pulmonary vasodilator, which acts by preferentially
diffusing to capillary beds of less inflamed alveoli leading to a reduction in ventilation/perfusion
4
mismatch and pulmonary vascular pressures in addition to having anti-inflammatory properties
(19). The use of inhaled nitric oxide as a rescue therapy was characterized across 6 ARDS
Network trials between 1996-2006 (20). Of the patients who received rescue therapy, inhaled
nitric oxide was the second most commonly employed agent during that time period (28% of
patients receiving rescue therapies). The most recent meta-analyses of ARDS patients has since
demonstrated no mortality benefit associated with NO use regardless of severity (21). Moreover,
the use of NO was associated with an increase in the incidence of renal failure(22). In surveys,
29-44% of intensivists’ from the UK and Germany report administering NO in ARDS (9, 18). In
the LUNG-SAFE study, the frequency of use of any type of inhaled vasodilator was found to be
much lower: 7.7% in all ARDS and 13.0% in the severe ARDS subgroup (3). However, the
impact of this more recent evidence from the 2014 meta-analysis on frequency of use of NO has
not been described.
1.1.3 Non-Pharmacologic Agents
Theoretically, prone positioning may prevent lung injury by recruiting non-dependent lung,
improving respiratory mechanics and clearing pulmonary secretions. The creation of more
homogeneous chest wall compliance, offloading the weight of the heart and minimizing the
weight of the abdominal contents on the diaphragm are mechanisms by which prone positioning
may enhance respiratory mechanics and lead to an increase in recruitable lung units (4, 23). Prior
to 2013, studies applied prone positioning to patients with a range of severity of ARDS. While
these trials consistently demonstrated an improvement in oxygenation with prone positioning, a
reduction in mortality was only seen in post hoc subgroup analyses of the most severe ARDS
cohorts (24). In 2010, 60% of German centers reported that they proned ARDS patients and 84%
of surveyed UK intensivists in 2012 reported that they would employ prone positioning as a
rescue strategy (9, 18). An RCT in 2013, which focused on patients with moderate/severe ARDS
(PaO2/FiO2 <150), demonstrated an absolute mortality risk reduction of 17% with prolonged
intermittent prone positioning (25). Since this trial; however, the LUNG-SAFE study revealed
relatively low rates of proning: 7.9% of all ARDS (and 16.3% of severe ARDS patients) (3).
High frequency oscillatory ventilation (HFOV) is an open lung ventilatory strategy that attempts
to recruit the lung using a high mean airway pressure and minimizes cyclic tidal reopening and
closing. Although early randomized-controlled trials of HFOV in adults suggested the possibility

5
of benefit (26), two recent, high quality, large-scale trials failed to show any mortality benefit
and one trial suggested possible harm when employed in moderate to severe ARDS (27, 28). One
possible explanation of the lack of benefit was more hemodynamic instability in the HFOV arm,
possibly attributable to a decrease in venous return, or impairment of right ventricular afterload
with higher mean airway pressure. Occult barotrauma and an increase in sedative requirements
are additional plausible mechanisms (27). Frequency of use as a rescue strategy ranged from 7%-
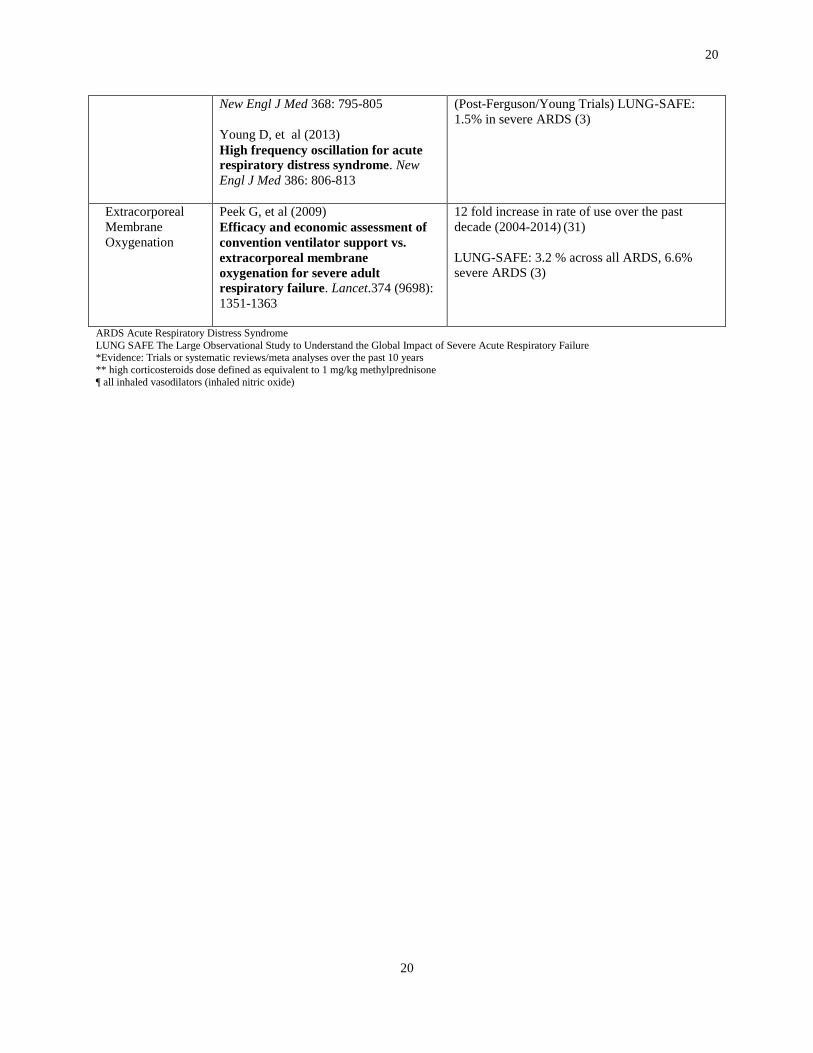
50% in earlier literature (9, 20). Most recently, much lower use has been reported from LUNG-
SAFE (1.2% across all ARDS and 1.5% in the severe ARDS subgroup) (3).
Venovenous extracorporeal membrane oxygenation (ECMO) is a form of partial
cardiopulmonary bypass that acts as an oxygenating and ventilatory shunt and can allow a
reduction in the intensity of invasive mechanical ventilation or complete lung rest. An RCT in
2009, the Conventional Ventilator Support vs. Extracorporeal Membrane Oxygenation for
Severe Adult Respiratory Failure (CESAR) trial, evaluated the impact of transport to an ECMO
capable center in patients with severe ARDS and demonstrated an improvement in disability-free
survival (29). However, some unanswered questions included whether the improved outcome
was due to ECMO itself or being managed at an expert center, as not all patients received
ECMO. In addition, the lack of compliance with lung protective ventilation in the non-
protocolized control arm might have contributed to the difference in outcomes (29). Given some
conflicting recent evidence regarding its benefit in severe ARDS (30), an international multi-
center trial is currently underway to evaluate its use for severe ARDS patients (NCT01470703).
The creation of modern extracorporeal circuitry technology in combination with the publication
of the CESAR trial and the subsequent H1N1 influenza outbreak has led to an exponential
increase in use of ECMO; according to the Extracorporeal Life Support Organization: 117 cases
of adult respiratory ECMO reported in 2004 to 1,497 cases reported in 2014 (31). In the LUNG-
SAFE study, 6.6% of patients with severe ARDS across the 50 countries received ECMO (3).
The adjuvants reviewed here are only a few of many potential pharmacologic (e.g. aspirin,
statins) and non-pharmacologic (e.g. non-invasive ventilation) adjuvants that continue to be
assessed.

6
1.1.4 Factors affecting adoption and de-adoption
Despite many intervention studies with no difference in outcomes and given the heterogeneity of
patients with ARF, decision making about the use of adjuvant therapy in specific subgroups of
patients, is complex. For example, in advance of the positive proning trial described above,
many clinicians advocated for the use of prone ventilation based on the compelling physiologic
rationale, subgroup evidence of benefit for severe ARDS and limitations of the existing trials
(24). Since statistically negative trials may not be able to prove lack of efficacy in specific
subgroups, arguments can be offered about the use of treatments from these trials in different
patient subsets or with different protocols than those studied. Information gained from subgroup
analyses or further insight on adjuvant administration has led to new trials re-evaluating their
use.
However, despite this, trial results will continue to remain only one component of medical
decision-making. Factors that impact adoption or de-adoption often extend beyond evidence.
More importantly, when the evidence base is weak or inconsistent, as it is in much of medicine,
factors other than evidence drive adoption and de-adoption (32-34). Furthermore, in the literature
available, variability exists in the real world with respect to adoption/de-adoption and it does not
always follow the evidence. For example, many of the severe ARDS adjuvants improve
oxygenation. Despite the lack of association between oxygenation improvement and mortality (5,
22), physicians are likely to reach for these adjuvants for the reassurance provided by improving
oxygenation. Other factors that may also drive adoption and de-adoption include experience
with the treatment, cost, availability, perceived risk, and patient comfort (32) (Figure 2). Lung
protective ventilation, which has consistently demonstrated a mortality benefit across a series of
trials, has not yet achieved widespread adoption in critical care (5, 34, 35). De-adoption of tight
glycemic control, has also been slow despite evidence of harm (33). However, this is not always
the pattern. There are other examples in critical care of rapid de-adoption as was the story of the
pulmonary arterial catheter following the observational study by Connors et al (36). Provocative
editorials, associated press and possibly the increase in non-invasive hemodynamic monitoring
potentially contributed to the rapid drop in use noted. Non evidence-based factors that impact
adoption/de-adoption include benefits/risk, feasibility, applicability and physician preferences
(32). When confidence in the evidence is lacking or if inconsistencies arise, these non-evidence
7
factors drive patterns of use to a greater degree. Furthermore, the role of evidence in rescue
therapy becomes less clear and factors that drive adoption/de-adoption likely focus more on
physician preferences.
1.1.5 Conclusions
This section highlights adjuvants to standard mechanical ventilation for ARF and specifically
ARDS patients, the limited evidence base for the use of many of these adjuvants, and the
available data regarding how they are deployed in current practice. The current state of data
surrounding use has predominantly been cross sectional data (LUNG-SAFE) or self-reported
data on stated practice. Given the high costs in terms of equipment and personnel associated with
the use of many of these adjuvants, more research surrounding trends in use, how practice
changes in response to evidence, and factors that may influence adoption and de-adoption of
these adjuvants are needed. Arguably, the adjuvants that have been subject to the greatest debate
and scientific evaluation over the past decade include the use of ECMO, inhaled pulmonary
vasodilators, continuous neuromuscular blockading agents, high frequency oscillatory ventilation
and prone positioning, and therefore will be the focus of this analysis.
8
8
Adjuvants to Mechanical Ventilation: Changes in Use and 2
Factors Associated with Use
2.1 Introduction
Acute respiratory failure (ARF) is associated with high morbidity and mortality and optimal
treatment strategies are incompletely defined. Interventions evaluated have predominantly
focused on patients with acute respiratory distress syndrome (ARDS); however, observational
data suggests they are used in patients with ARF even if the formal ARDS criteria are not met
(3). While lung protective ventilation and prone positioning have robust evidence supporting
their use, extracorporeal membrane oxygenation (ECMO), inhaled pulmonary vasodilators,
continuous neuromuscular blockading agents (cNMBA), and high frequency oscillatory
ventilation (HFOV) are used despite inconclusive evidence of benefit or possible harm (7, 21,
22, 25, 27-29, 37-39). As debates on adjuvant use continue and ongoing trials attempt to
establish effectiveness (NCT01470703, NCT02509078),(40) clinicians face daily decisions on
when to initiate these treatments.
The LUNG-SAFE study provides insight into ARF incidence, ARDS under-recognition, and
current management (3). However, LUNG-SAFE focused on academic medical centers and was
not designed to evaluate the use of treatments over time. A better understanding of factors
associated with adjuvant use across a broad range of hospitals, how their use is affected by
landmark publications, and what drives adoption/de-adoption is important to inform daily
clinical decisions and policies until further evidence becomes available.
2.2 Materials and Methods
We performed a retrospective cohort study of adults (≥18 years) discharged from a United States
(US) hospital between July 2008-June 2013 using the Premier Perspective® Hospital Database
(Charlotte, NC and Washington, DC) (41). Premier is a voluntary fee-supported database that
was developed as a healthcare performance improvement alliance and includes over 500
hospitals. It represents a sample of structurally and geographically diverse hospitals and
9
9
approximately 15-20% of hospital discharges nationwide. In addition to containing discharge
data, it contains complete billing information with date-stamped logs of all charges (40).
2.2.1 Study Population and Cohort Creation
After removing hospitals with missing billing data, we included any adult patient who received
invasive mechanical ventilation and had a primary diagnosis of ARF–defined by the presence of
an International Classification of Disease, 9th
Edition, Clinical Modification (ICD9-CM) code
for ARF or ARDS (518.81, 518.82, 518.84, 518.5, 799.1, 786.09) (7, 42-44). Given the potential
for low sensitivity using the ARDS codes alone as well as high reports of use of adjuvants across
the ARF population (3, 44), we also included those identified as having a direct infectious or
direct non-infectious cause of ARF using ICD-9-CM codes (Table 2) (1). To avoid capturing
indications for adjuvant use outside of ARF, patients with a code for pulmonary hypertension,
cardiac surgery or transplantation were excluded (Table 2). Patient’s extubated alive within 24
hours of mechanical ventilation were also excluded. Research ethics approval was obtained from
the institutional review boards at Sunnybrook Health Sciences Center and Albert Einstein School
of Medicine.
2.2.2 Outcomes
We identified each adjuvant of interest using the hospital charges and/or ICD9-CM codes.
ECMO was identified using ICD9-CM codes 39.65 (ECMO) and 39.66 (percutaneous ECMO)
(45). Pulmonary vasodilators—including inhaled NO and inhaled epoprostenol (off label use)—
were identified using hospital charge terms. Continuous NMBA (atracurium, cisatracurium,
doxacurium, mivacurium, pancuronium, rocuronium, or vecuronium) was defined by charges for
at least two days at a dose over 24 hours that could achieve continuous paralysis (intermittent
bolus or continuous infusion) (46). We selected this dose to replicate the use of NMBA for ARF
as opposed to short-term use for procedures (Appendix Table 1). In sensitivity analyses, we
evaluated 1 day of cNMBA, continuous cisatracurium and any use of NMBA. We set out to
capture HFOV using the hospital billing term for the circuit specific to the SensorMedics
3100A/3100B (Viasys Healthcare, Yorba Linda, California USA); but concerns of undercoding
led us to exclude HFOV. Prone positioning was also not identifiable through this dataset.

10
10
Patient and Hospital Data
We collected data on patient demographic, insurance status, Elixhauser comorbidities (47), and
clinical variables (e.g. dialysis, vasopressors). Hospital data included geographic location, bed
size, urban/rural location, and academic status.
2.2.3 Statistical Analysis
Patient and hospital level characteristics were summarized across the entire cohort and for
patients who received each adjuvant. Proportions were used for categorical and means (standard
deviation) or medians (interquartile ranges) for continuous variables as appropriate.
First, we evaluated rates of use of each adjuvant per 1000 persons per year by dividing the
number of patients with adjuvants by the total number of patients with ARF that year (x1000).
For each adjuvant, we used Poisson regression (48) to estimate the annual incidence rate ratio
and 95% confidence interval over the study period (reference year 2008), adjusted for age and
gender and clustered by hospital (49, 50). We hypothesized that ECMO and cNMBA use would
increase and that inhaled NO would be replaced with inhaled epoprostenol over time.
Second, we evaluated the impact of landmark studies on rates of use over time using segmented
regression analysis of an interrupted time series. A segmented regression analysis allows the
evaluation, in statistical terms, of how much a publication affects monthly rates of use. Segments
were defined by major landmark publications for each adjuvant (51) and the time series was the
monthly rates of use. A sufficient number of time points before and after the publication is
needed to conduct segmented regression analysis and generally 12 data points before and after is
recommended and was present for each of these analyses (51). Segmented regression answers
two different questions. First, if publication of the landmark study causes an immediate change
in use, it will be detected as a change in the intercept of the fitted regression line. Second, if
publication causes a change in use over time, the slope of the regression line will be different
from that time point compared to prior to that time point. Landmark studies published over this
time period were determined, a priori, by journal impact factor and evidence quality (Table 3):
for (1) ECMO—the Conventional Ventilator Support vs. Extracorporeal Membrane Oxygenation
for Severe Adult Respiratory Failure (CESAR) trial published on October 2009 (29)
11
11
demonstrating transportation to a specialized center for ECMO consideration was associated
with improved disability free-survival at 6 months; (2) inhaled pulmonary vasodilators—the
Cochrane Collaboration meta-analysis published on July, 2010 (52) showing NO had no
statistically significant effect on mortality and appeared to increase renal injury risk; and (3)
cNMBA—the randomized trial published September 2010 demonstrating a survival benefit from
the early continuous cisatracurium administration in moderate-severe ARDS (8).
We evaluated patient and hospital level factors, determined a priori, associated with each
adjuvant using logistic regression. One of the fundamental assumptions of logistic regression,
that each observation is independent, may not hold true in this cohort due to potential clustering
at the hospital level. Given this, the analysis was fitted with generalized estimating equations to
properly account for the violation of the independence assumption due to the correlation between
outcomes within the cluster. Generalized estimating equations as opposed to multi-level
modeling was chosen to account for clustering given our interest in adjusting for the average
impact of hospitals on rates of use; while the specific relationship between detailed hospital
variation and the outcomes seen was not the primary focus. Physician level data was not
available in this dataset.
Adjuvant specific analyses were conducted only in hospitals capable of using that adjuvant—
defined as those hospitals that used the adjuvant at least once over the study period. It was
assumed that all hospitals could administer NMBAs. Statistical analyses were performed using
Stata 13.0 (StataCorp LP, College Station, TX). Results were considered statistically significant
at p<0.05.
2.2.4 Sensitivity Analyses
We conducted 5 sensitivity analyses were conducted to assess the robustness of the results. First,
to address the potential for hospitals leaving/entering the database, we repeated the primary
analysis restricted to hospitals contributing data in all study years. Second, we repeated the
segmented regression analysis excluding data from the H1N1 influenza epidemic year of 2009 to
ensure that temporal trends were not confounded by this unusual event. Third, since severity of
illness data are limited in the Premier Database, we restricted the analysis to patients who died
assuming that this stratifies the population to those with a high severity of illness and confirmed

12
12
that the changes noted were similarly robust in this analysis (36, 53). Fourth, to further focus on
a population more representative of ARDS, we limited the analysis to those patients who were
intubated within the first two days of hospitalization and had the combined diagnostic codes for
severe sepsis, pneumonia and respiratory failure (7). We did not restrict this analysis to ARDS
codes alone given the high proportion of ARF patients who undergo adjuvant use in
unrecognized ARDS (3). For our primary analysis, we modeled year as a categorical variable to
evaluate changes over time; however, we also evaluated it as a continuous variable in order to
evaluate a trend over this time period. In an additional analysis, we evaluated a ―tracer
condition‖, the use of pulmonary artery catheters, whose temporal trends we anticipated would
be decreasing to validate the observed trends (36, 54).
2.3 Results
2.3.1 Cohort Assembly and Overview
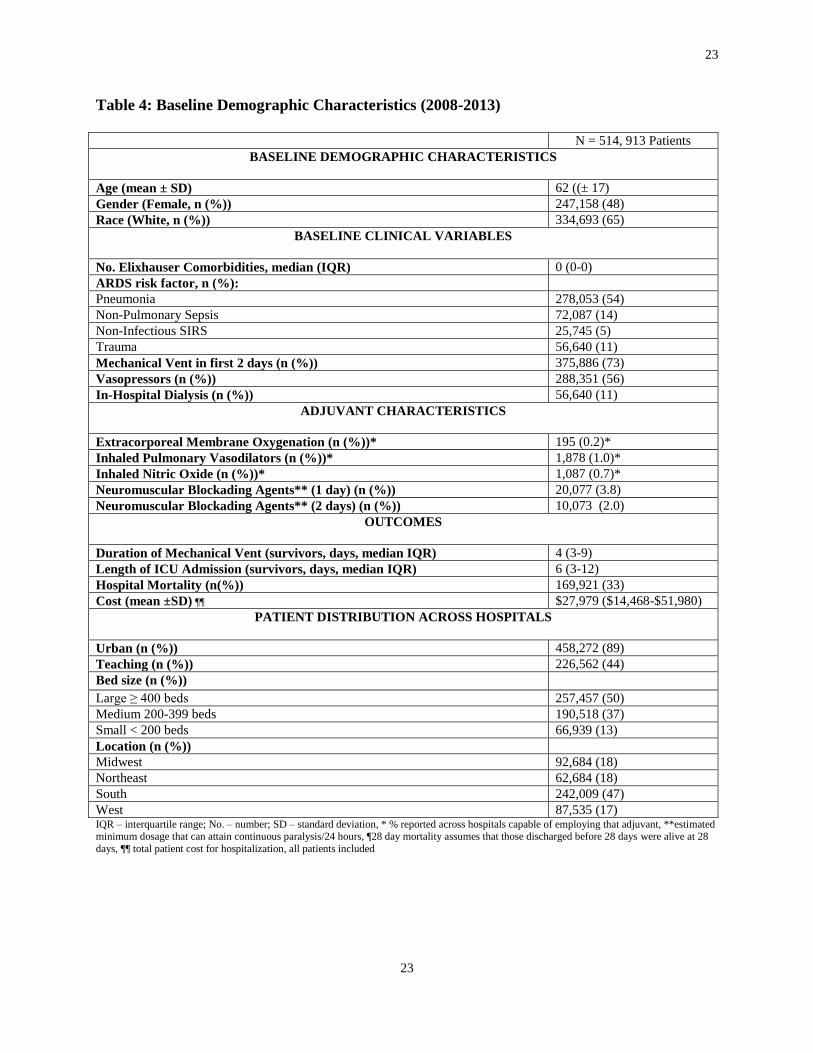
Over the study period, 514,913 patients across 543 hospitals met the definition of ARF (Table 4
and Figure 3). The majority of patients were from urban centers (89%, n = 458,272) with 44%
(n=226,561) admitted to academic centers and 50% (n=257,457) to large hospitals (≥ 400 beds).
Pneumonia was the most frequent cause of ARF; 73% (n=375,886) received invasive mechanical
ventilation within the first 2 days of admission and 56% (n=288,351) received vasopressors.
Hospital mortality was 33% (n=169,921).
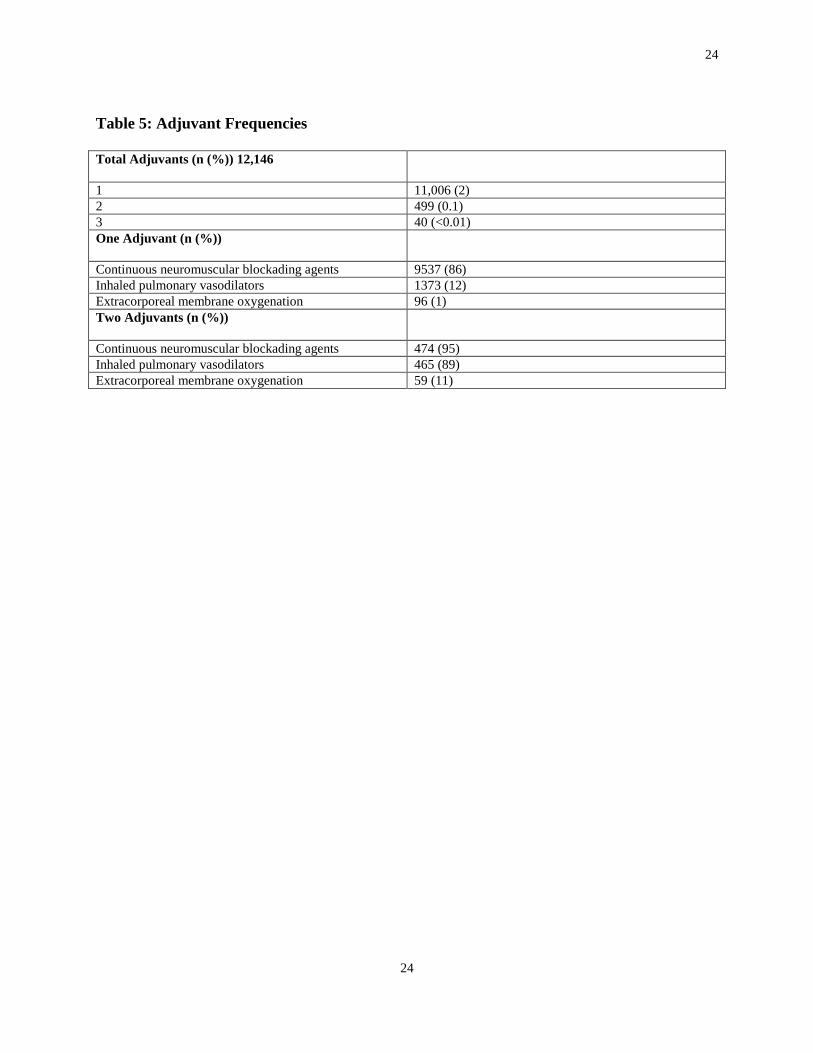
There were 12,146 adjuvants used among 11,567 patients (2.3% of patients), with most receiving
only one adjuvant (95%, n=11,006) (Table 5). cNMBAs were the most frequently used adjuvant
(n=10,073 cases, 2%), followed by inhaled pulmonary vasodilators (n=1,878, 1% in capable
hospitals, 0.4% entire cohort), and ECMO (n=195, 0.2% in capable hospitals, 0.04% entire
cohort). When two adjuvants were used, cNMBAs were used in 95% (n=474) and inhaled
pulmonary vasodilators were used in 93%. (n=465). When all three adjuvants were used in
combination, cNMBAs were most frequently used first (median (IQR) first day 1 (1-2)) followed
by inhaled pulmonary vasodilators (median (IQR) first day 3 (1-8)) and ECMO (median (IQR)
first day 4 (1-10)).
13
13
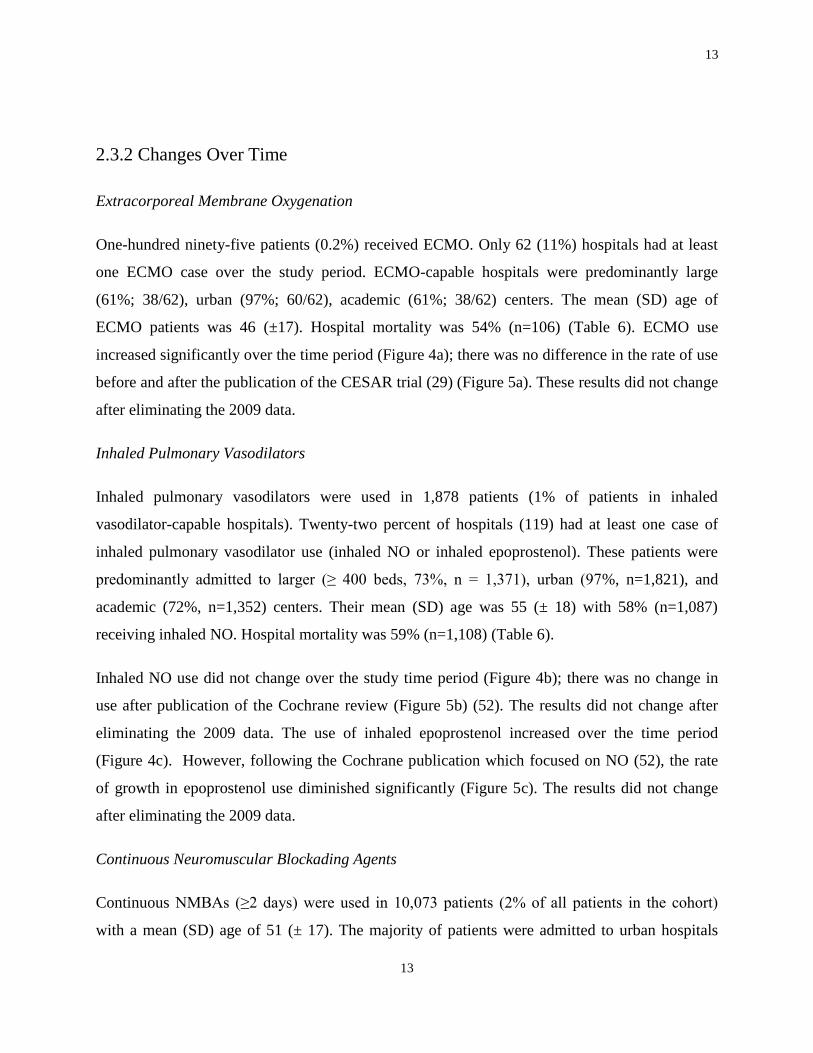
2.3.2 Changes Over Time
Extracorporeal Membrane Oxygenation
One-hundred ninety-five patients (0.2%) received ECMO. Only 62 (11%) hospitals had at least
one ECMO case over the study period. ECMO-capable hospitals were predominantly large
(61%; 38/62), urban (97%; 60/62), academic (61%; 38/62) centers. The mean (SD) age of
ECMO patients was 46 (±17). Hospital mortality was 54% (n=106) (Table 6). ECMO use
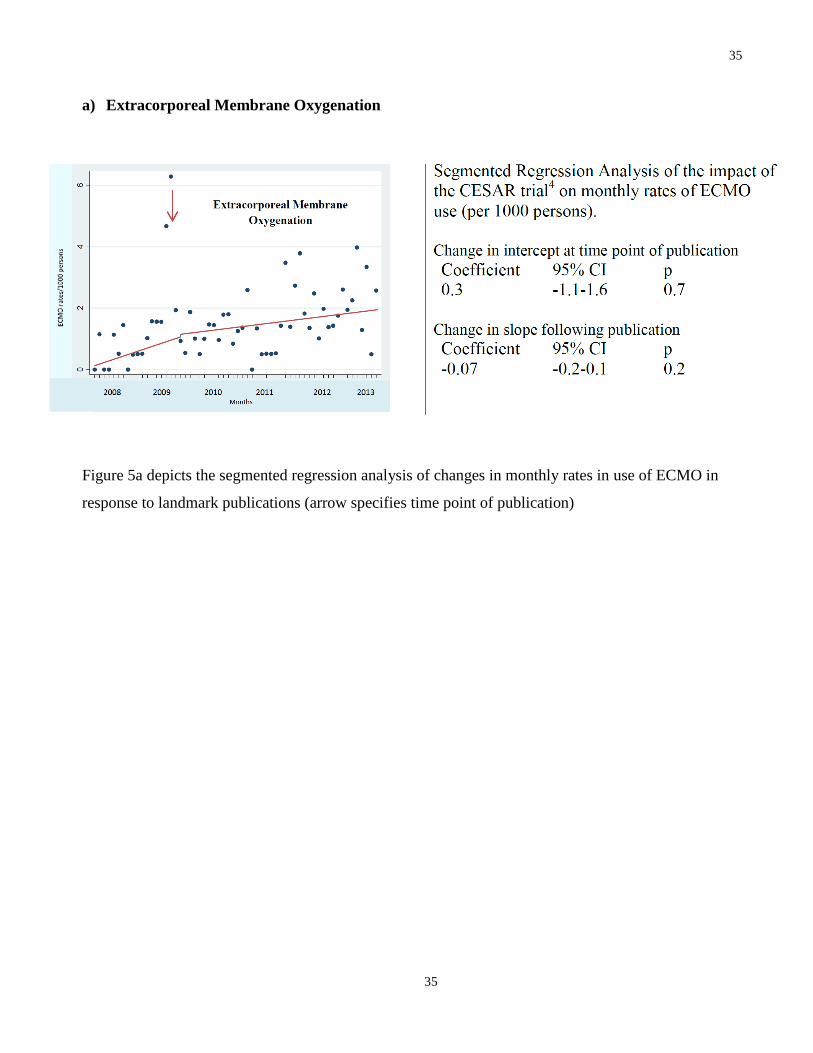
increased significantly over the time period (Figure 4a); there was no difference in the rate of use
before and after the publication of the CESAR trial (29) (Figure 5a). These results did not change
after eliminating the 2009 data.
Inhaled Pulmonary Vasodilators
Inhaled pulmonary vasodilators were used in 1,878 patients (1% of patients in inhaled
vasodilator-capable hospitals). Twenty-two percent of hospitals (119) had at least one case of
inhaled pulmonary vasodilator use (inhaled NO or inhaled epoprostenol). These patients were
predominantly admitted to larger (≥ 400 beds, 73%, n = 1,371), urban (97%, n=1,821), and
academic (72%, n=1,352) centers. Their mean (SD) age was 55 (± 18) with 58% (n=1,087)
receiving inhaled NO. Hospital mortality was 59% (n=1,108) (Table 6).
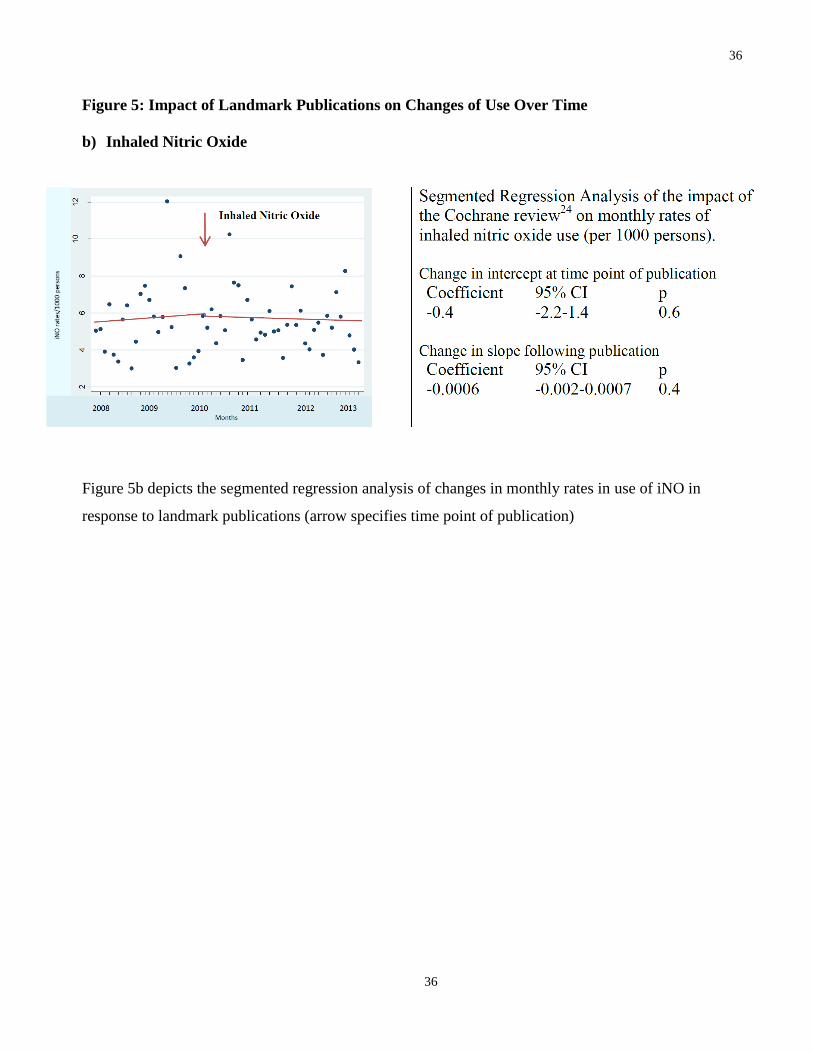
Inhaled NO use did not change over the study time period (Figure 4b); there was no change in
use after publication of the Cochrane review (Figure 5b) (52). The results did not change after
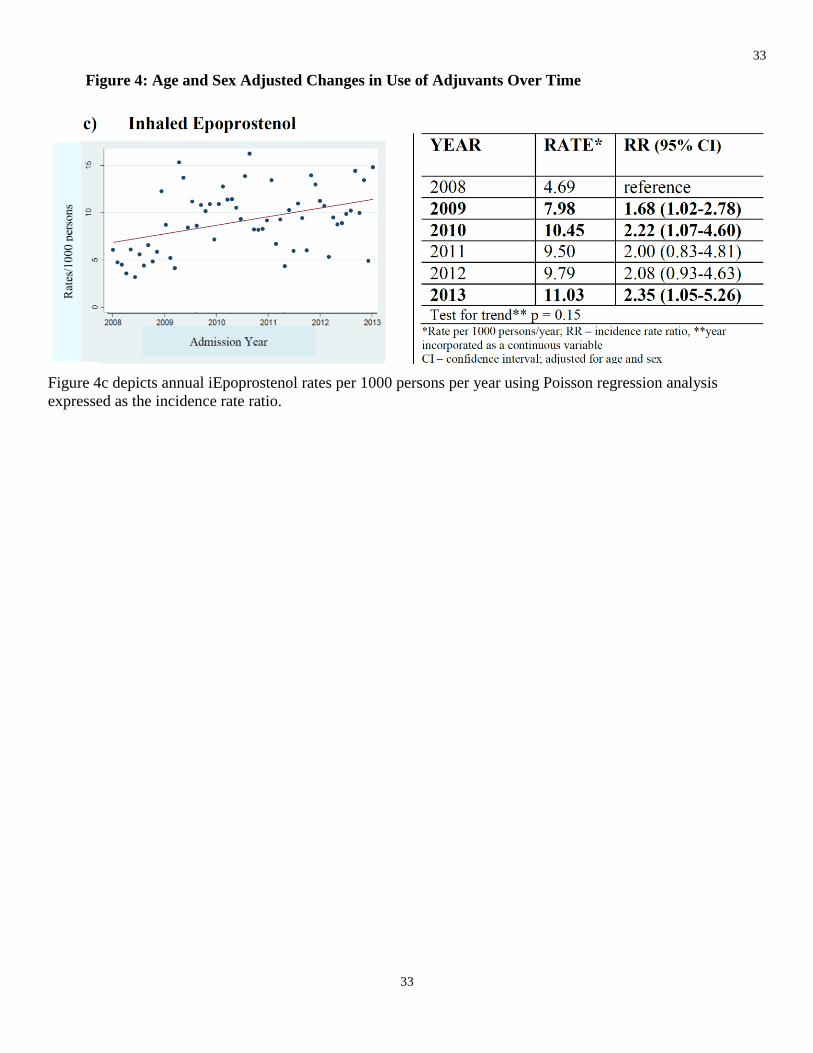
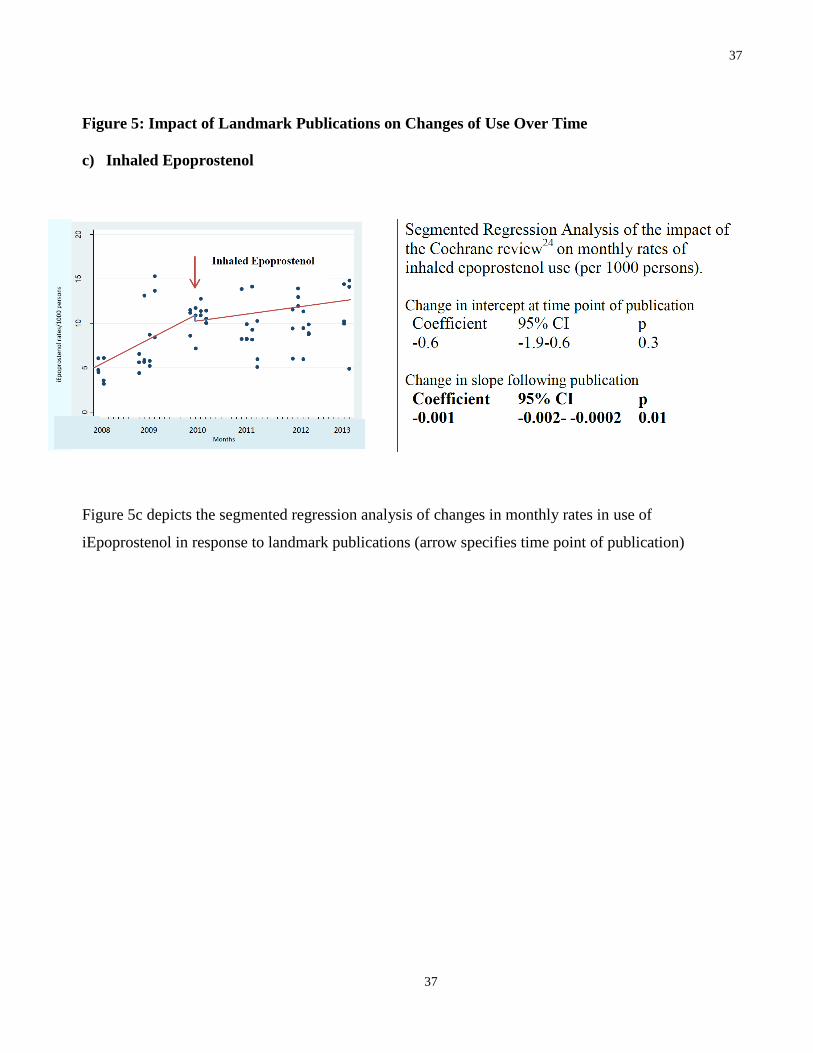
eliminating the 2009 data. The use of inhaled epoprostenol increased over the time period
(Figure 4c). However, following the Cochrane publication which focused on NO (52), the rate
of growth in epoprostenol use diminished significantly (Figure 5c). The results did not change
after eliminating the 2009 data.
Continuous Neuromuscular Blockading Agents
Continuous NMBAs (≥2 days) were used in 10,073 patients (2% of all patients in the cohort)
with a mean (SD) age of 51 (± 17). The majority of patients were admitted to urban hospitals

14
14
(94%, n = 9,469) and only 50% (n=5,037) were admitted to academic hospitals. Cisatracurium
was the most commonly used agent (52%, n = 5,238). The median (IQR) duration of continuous
paralysis was 3 days (2-5) with a median first day of initiation being day 2 (1-4) of mechanical
ventilation for all agents. Hospital mortality was 43% (n=4,331) (Table 6).
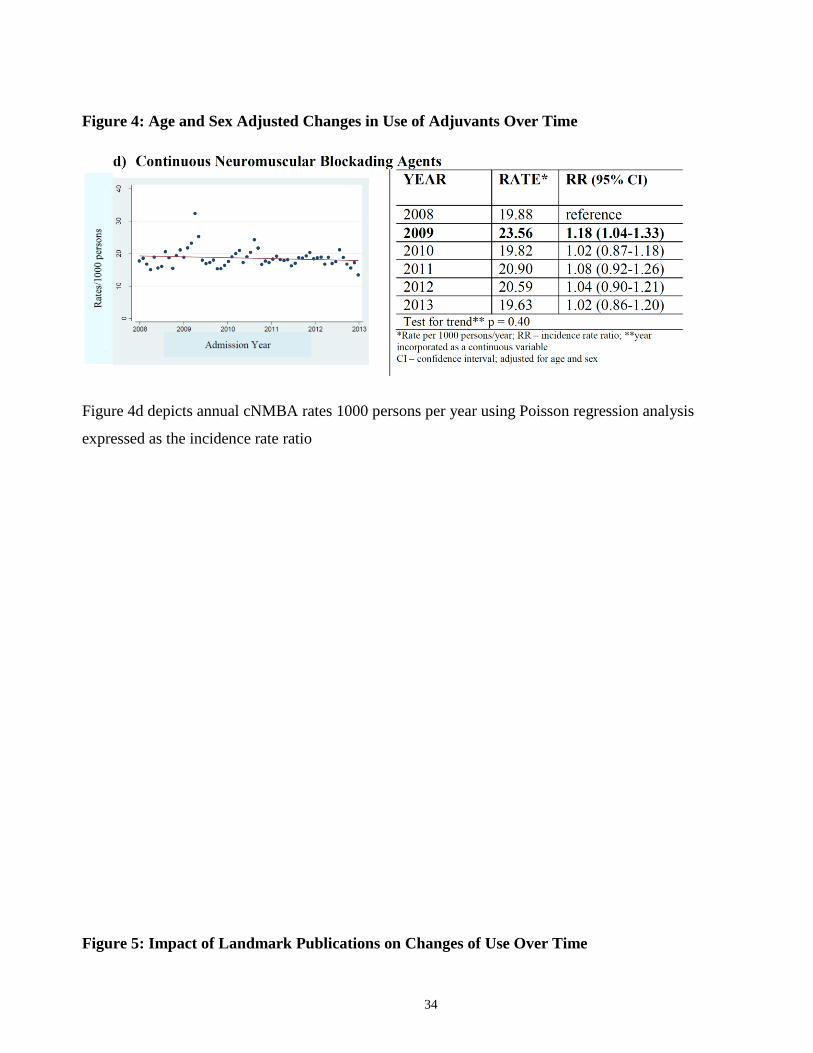
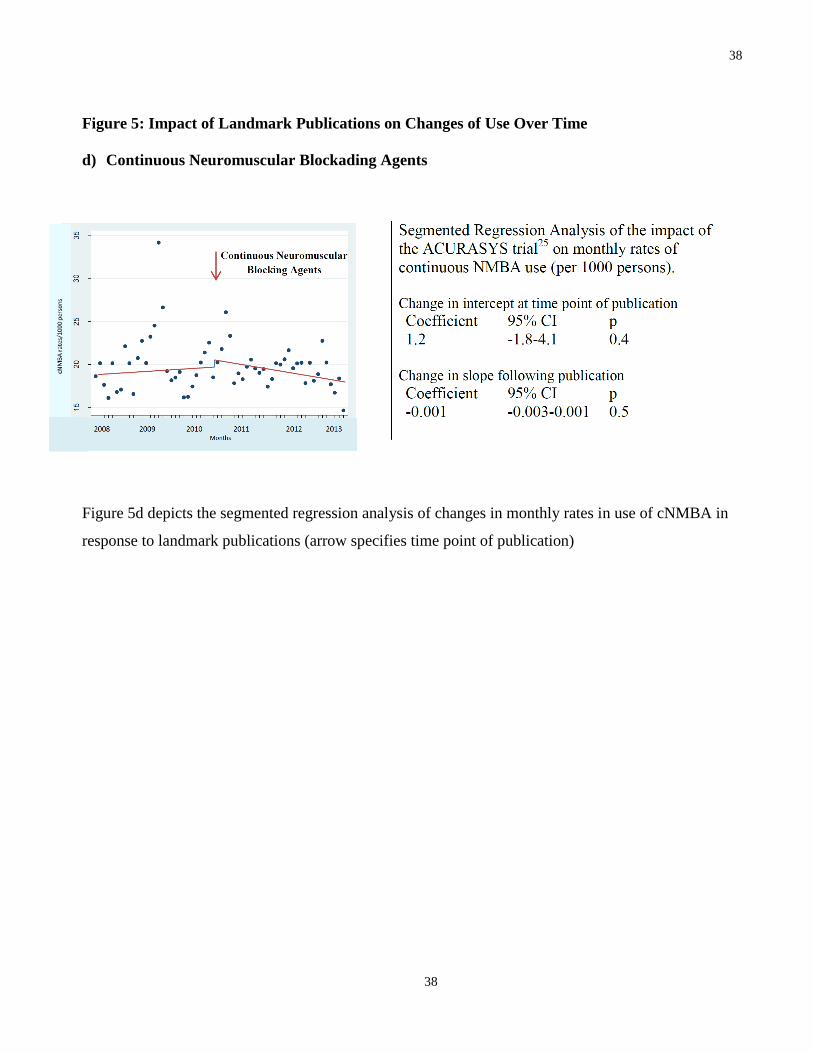
There was an isolated increase in use of cNBMA in 2009; however, following that year, there
was no consistent increase in use over time (Figure 4d). Upon evaluating the impact of the
cNMBA trial, no change was noted in the yearly cohort and after the 2009 data was removed
(Figure 5d) (8). These results were robust when restricted to 1 day of cNMBA, any use of
NMBA, and cisatracurium specifically (Table 7).
Sensitivity Analyses
The results were similar when limited to hospitals who contributed data for the entire study
duration and amongst patients who died (Table 7). In our ARF cohort designed to replicate an
ARDS population, the overall number of patients and adjuvants used was significantly reduced.
Because of this, there was some variability compared to the above results, however, none of the
rates of use of the adjuvants decreased overtime (Table 7). When year was modeled as a
continuous variable, there was no time trend overall in ECMO use seen (Table 7); however, it is
possible that this absence of a statistically significant linear time trend may be attributable to the
absence of an ordered increase given the H1N1 outlier. As expected, we observed a decrease in
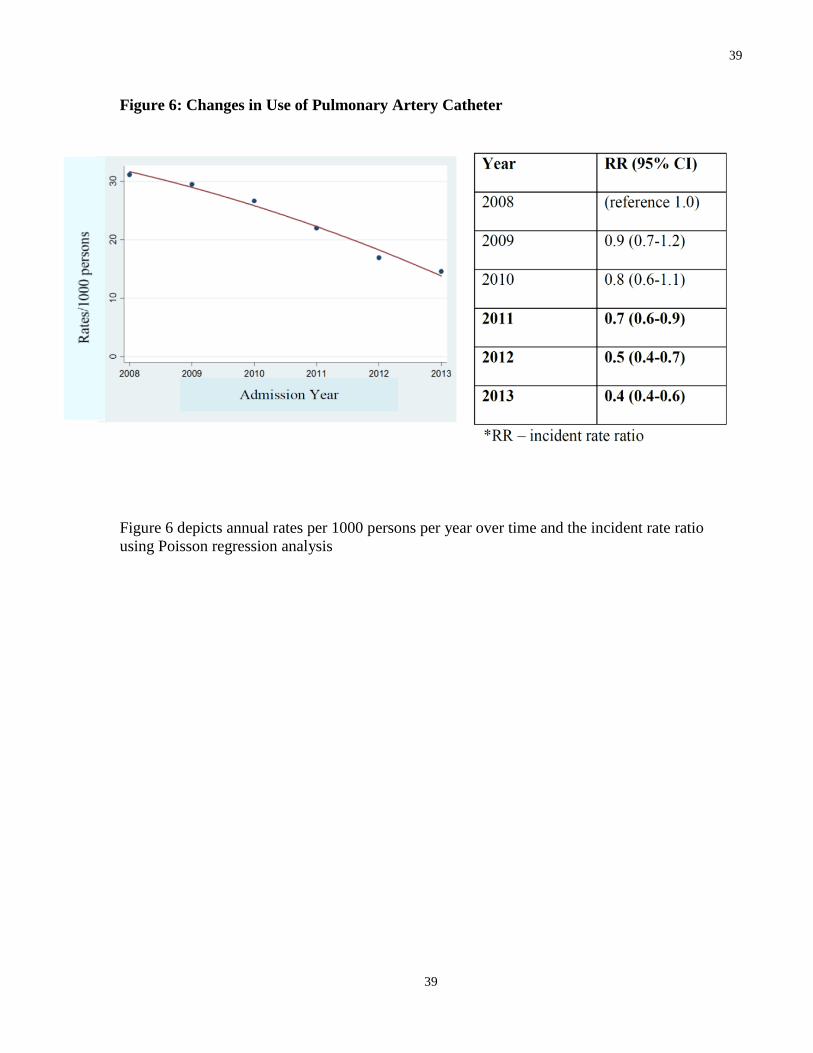
the rate of pulmonary artery catheter use (Figure 6 ).
2.3.3 Factors Associated with Adjuvant Use
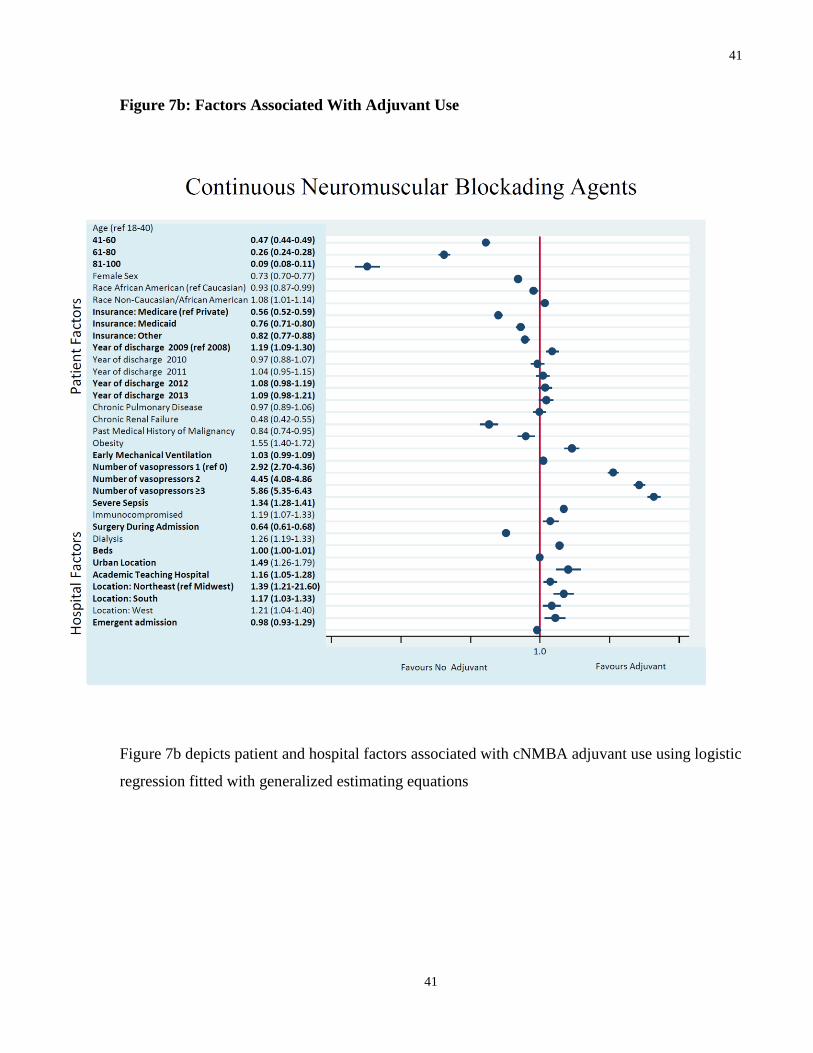
A diagnosis of severe sepsis and vasopressor use were associated with higher likelihood of
receiving each adjuvant (Figure 7). Patient factors consistently associated with a lower likelihood
of receipt of each adjuvant included older age, non-private insurance status and undergoing
surgery during admission (Figure 7).
Mechanical ventilation within the first two days of hospitalization was associated with a higher
likelihood of receiving ECMO, whereas obesity and dialysis were more likely to be associated
15
15
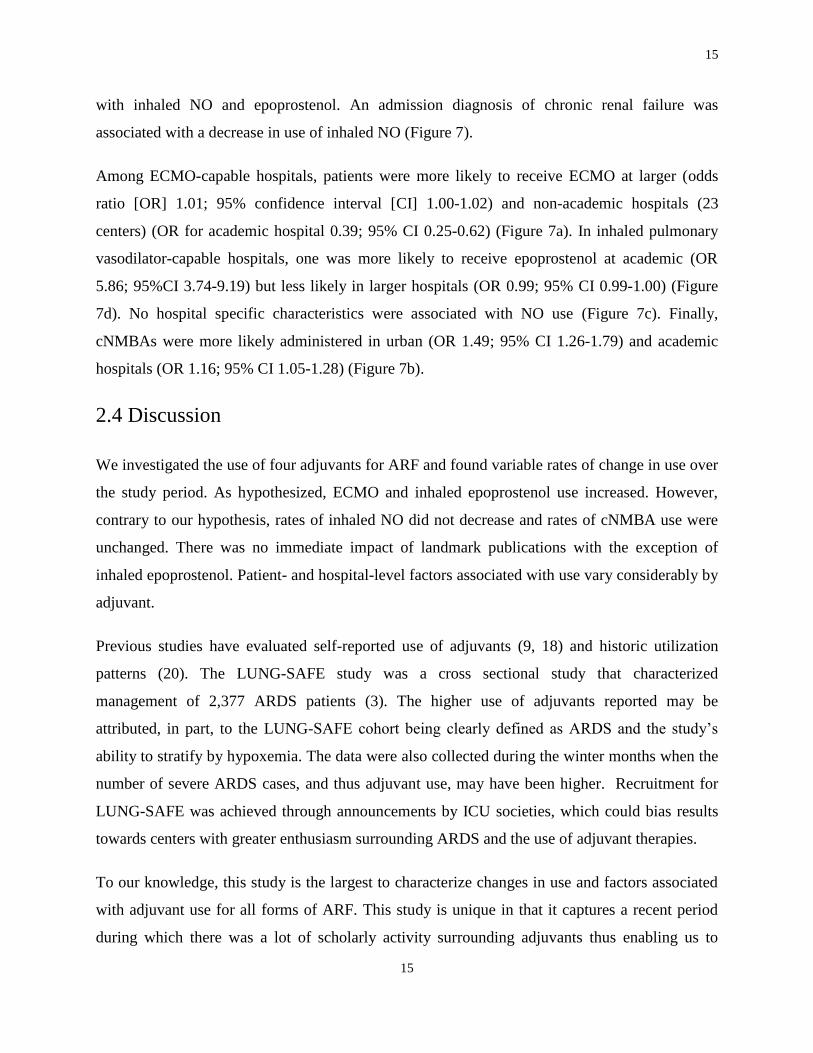
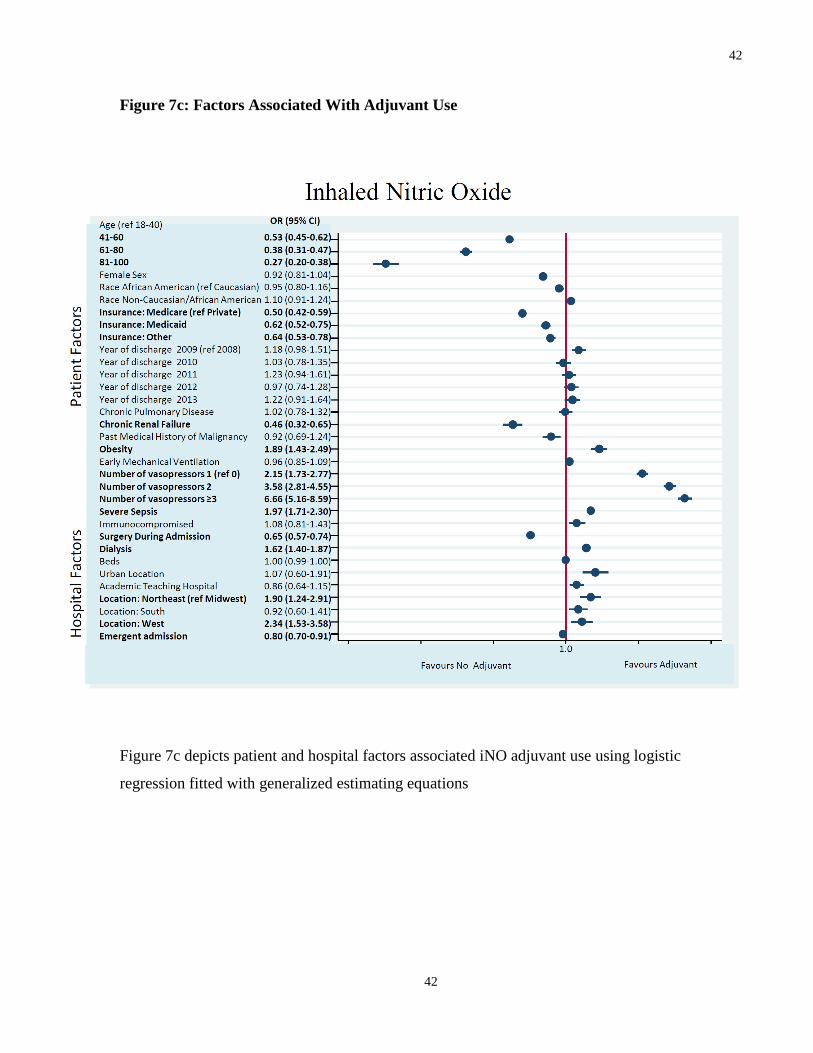
with inhaled NO and epoprostenol. An admission diagnosis of chronic renal failure was
associated with a decrease in use of inhaled NO (Figure 7).
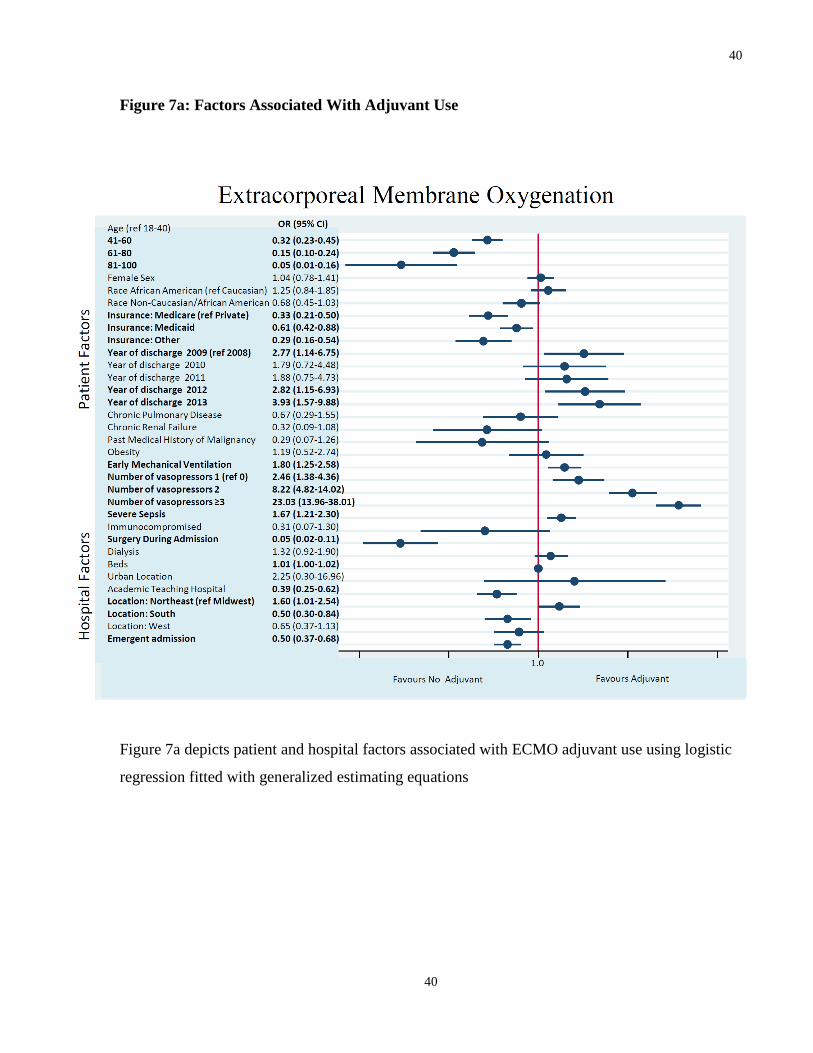
Among ECMO-capable hospitals, patients were more likely to receive ECMO at larger (odds
ratio [OR] 1.01; 95% confidence interval [CI] 1.00-1.02) and non-academic hospitals (23
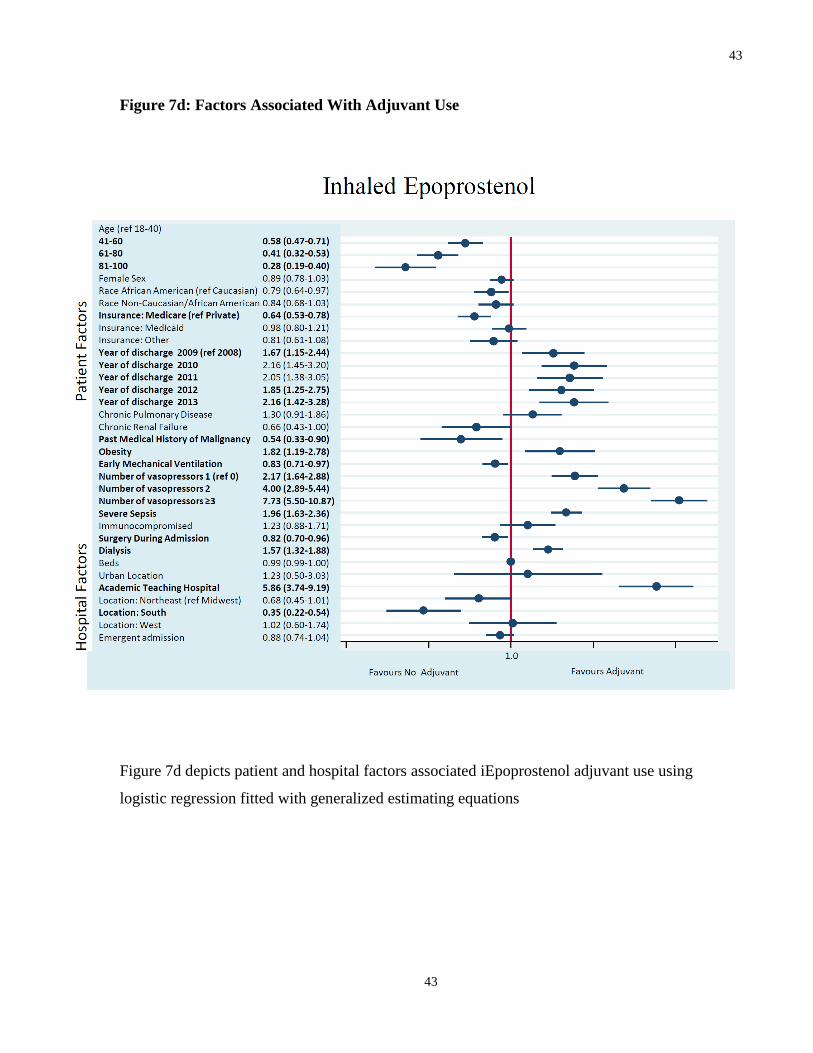
centers) (OR for academic hospital 0.39; 95% CI 0.25-0.62) (Figure 7a). In inhaled pulmonary
vasodilator-capable hospitals, one was more likely to receive epoprostenol at academic (OR
5.86; 95%CI 3.74-9.19) but less likely in larger hospitals (OR 0.99; 95% CI 0.99-1.00) (Figure
7d). No hospital specific characteristics were associated with NO use (Figure 7c). Finally,
cNMBAs were more likely administered in urban (OR 1.49; 95% CI 1.26-1.79) and academic
hospitals (OR 1.16; 95% CI 1.05-1.28) (Figure 7b).
2.4 Discussion
We investigated the use of four adjuvants for ARF and found variable rates of change in use over
the study period. As hypothesized, ECMO and inhaled epoprostenol use increased. However,
contrary to our hypothesis, rates of inhaled NO did not decrease and rates of cNMBA use were
unchanged. There was no immediate impact of landmark publications with the exception of
inhaled epoprostenol. Patient- and hospital-level factors associated with use vary considerably by
adjuvant.
Previous studies have evaluated self-reported use of adjuvants (9, 18) and historic utilization
patterns (20). The LUNG-SAFE study was a cross sectional study that characterized
management of 2,377 ARDS patients (3). The higher use of adjuvants reported may be
attributed, in part, to the LUNG-SAFE cohort being clearly defined as ARDS and the study’s
ability to stratify by hypoxemia. The data were also collected during the winter months when the
number of severe ARDS cases, and thus adjuvant use, may have been higher. Recruitment for
LUNG-SAFE was achieved through announcements by ICU societies, which could bias results
towards centers with greater enthusiasm surrounding ARDS and the use of adjuvant therapies.
To our knowledge, this study is the largest to characterize changes in use and factors associated
with adjuvant use for all forms of ARF. This study is unique in that it captures a recent period
during which there was a lot of scholarly activity surrounding adjuvants thus enabling us to
16
16
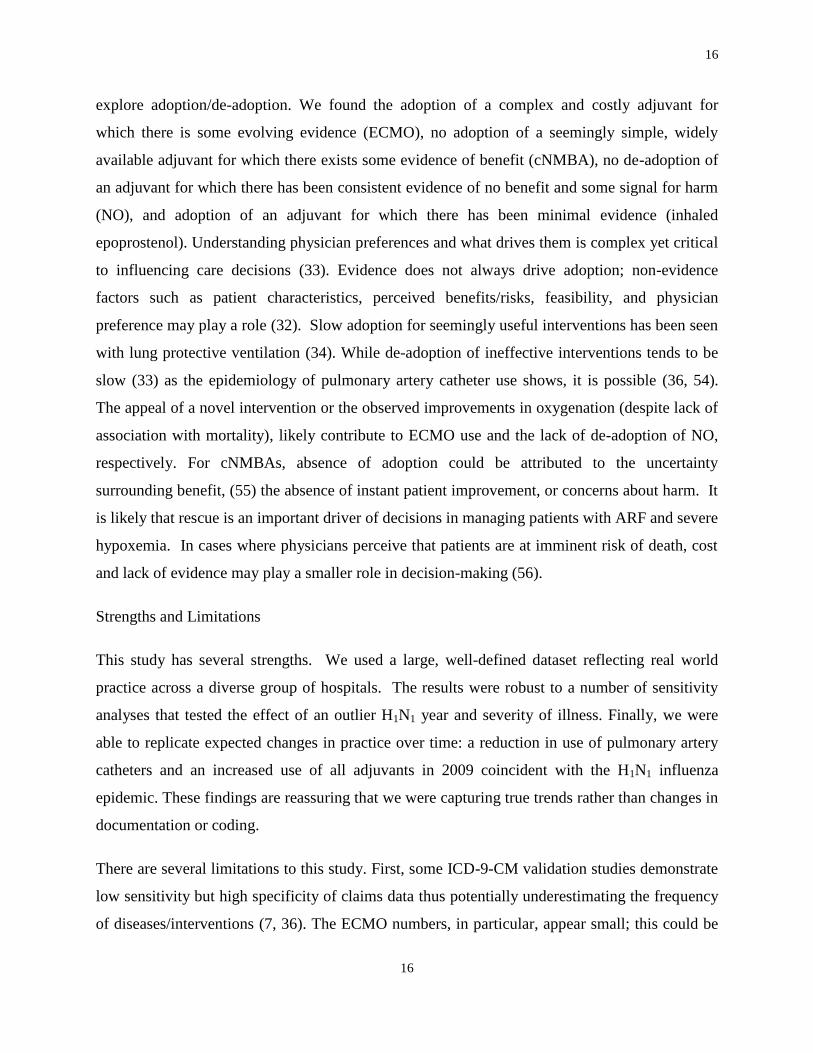
explore adoption/de-adoption. We found the adoption of a complex and costly adjuvant for
which there is some evolving evidence (ECMO), no adoption of a seemingly simple, widely
available adjuvant for which there exists some evidence of benefit (cNMBA), no de-adoption of
an adjuvant for which there has been consistent evidence of no benefit and some signal for harm
(NO), and adoption of an adjuvant for which there has been minimal evidence (inhaled
epoprostenol). Understanding physician preferences and what drives them is complex yet critical
to influencing care decisions (33). Evidence does not always drive adoption; non-evidence
factors such as patient characteristics, perceived benefits/risks, feasibility, and physician
preference may play a role (32). Slow adoption for seemingly useful interventions has been seen
with lung protective ventilation (34). While de-adoption of ineffective interventions tends to be
slow (33) as the epidemiology of pulmonary artery catheter use shows, it is possible (36, 54).
The appeal of a novel intervention or the observed improvements in oxygenation (despite lack of
association with mortality), likely contribute to ECMO use and the lack of de-adoption of NO,
respectively. For cNMBAs, absence of adoption could be attributed to the uncertainty
surrounding benefit, (55) the absence of instant patient improvement, or concerns about harm. It
is likely that rescue is an important driver of decisions in managing patients with ARF and severe
hypoxemia. In cases where physicians perceive that patients are at imminent risk of death, cost
and lack of evidence may play a smaller role in decision-making (56).
Strengths and Limitations
This study has several strengths. We used a large, well-defined dataset reflecting real world
practice across a diverse group of hospitals. The results were robust to a number of sensitivity
analyses that tested the effect of an outlier H1N1 year and severity of illness. Finally, we were
able to replicate expected changes in practice over time: a reduction in use of pulmonary artery
catheters and an increased use of all adjuvants in 2009 coincident with the H1N1 influenza
epidemic. These findings are reassuring that we were capturing true trends rather than changes in
documentation or coding.
There are several limitations to this study. First, some ICD-9-CM validation studies demonstrate
low sensitivity but high specificity of claims data thus potentially underestimating the frequency
of diseases/interventions (7, 36). The ECMO numbers, in particular, appear small; this could be

17
17
due to under-coding or capturing a subset of low-volume ECMO centers. We think this is
unlikely as ECMO has important billing implications in the US. However, if either were true,
this would potentially underestimate the rate of rise and likely not negate the positive trend
noted. The discrepancy noted between year evaluated as a categorical and continuous variable
may be attributable to the H1N1 outlier year, which eliminates an ordered increase in use when
year is evaluated continuously. Alternatively, there may be no incremental linear increase over
the years; however, there may exist changes over time that were more pronounced in the most
recent years as was found in the categorical analysis.
Second, our ability to identify the severity of ARF was limited given the lack of ICU level
physiology variables. This precluded us from performing stratification across strata of varying
severities of illnesses. This would bias the rates of use of adjuvants to a lower estimate, but we
feel it would not affect our exploration of trends over time and factors associated with use. The
decedent analysis, which restricts the analysis to those sick enough to die, demonstrated similar
results.
Thirdly, it is plausible that misclassification could have arisen with regard to indications for the
adjuvants of interest. We attempted to minimize this by excluding any alternative indications for
the adjuvants of interest. While this minimizes its generalizability (i.e., excluded transplant and
cardiac surgery), it increases our confidence that we were capturing its use primarily for
respiratory failure.
Fourthly, selection bias may exist in the subset of hospitals that contribute to the Premier
database (i.e., more prone to use evidence based therapies or new innovations). However, we felt
that this would be minimized given the large number of hospitals. After reviewing the
distribution of hospitals that contribute data to Premier, it is possible that the database may not
be generalizable. It favored urban centers and centers from the Southern US; however, even
within this region, there was variability with respect to hospital size and academic status. In
addition, patterns of adoption and de-adoption, may be different in hospitals outside of the US
given that physician preferences appears to be a large driver of use.
Finally, for evaluating changes in use, even if there existed a true of change in response to the
evidence, it is possible that the landmark publication date may not result in an immediate change.

18
18
It is possible that the time period being evaluated was not sufficiently long to see a change where
a change may exist particularly if the change was a more gradual one in response to the evidence.
Often times, landmark publications are affiliated with presentations that international meetings
which occur at a different time point. This could have also led to a different time point that was
not captured in this analysis. We also do not know how adoption and de-adoption changes in
extreme clinical circumstances where death may be imminent such as the application of adjuvant
strategies.
3.0 Conclusions and Future Directions
This study highlights real world variability in adjuvant use; variability which likely reflects, in
part, the limits of available evidence. However, even when the evidence base is strong, adoption
and de-adoption practices are not solely driven by evidence with many factors affecting bedside
decision-making. Extreme clinical circumstances may also have an impact on decision making
regarding use and has not been evaluated.
In conjunction with trying to develop a stronger body of evidence for the adjuvants evaluated,
developing a better understanding of factors associated with adjuvant use is necessary.
Understanding what drives adoption and de-adoption at the patient, physician and hospital level
will be important to drive knowledge translation activities that could have an impact on bedside
application. Only then can we safely encourage adoption of effective interventions and promote
de-adoption of ineffective interventions.
19
19
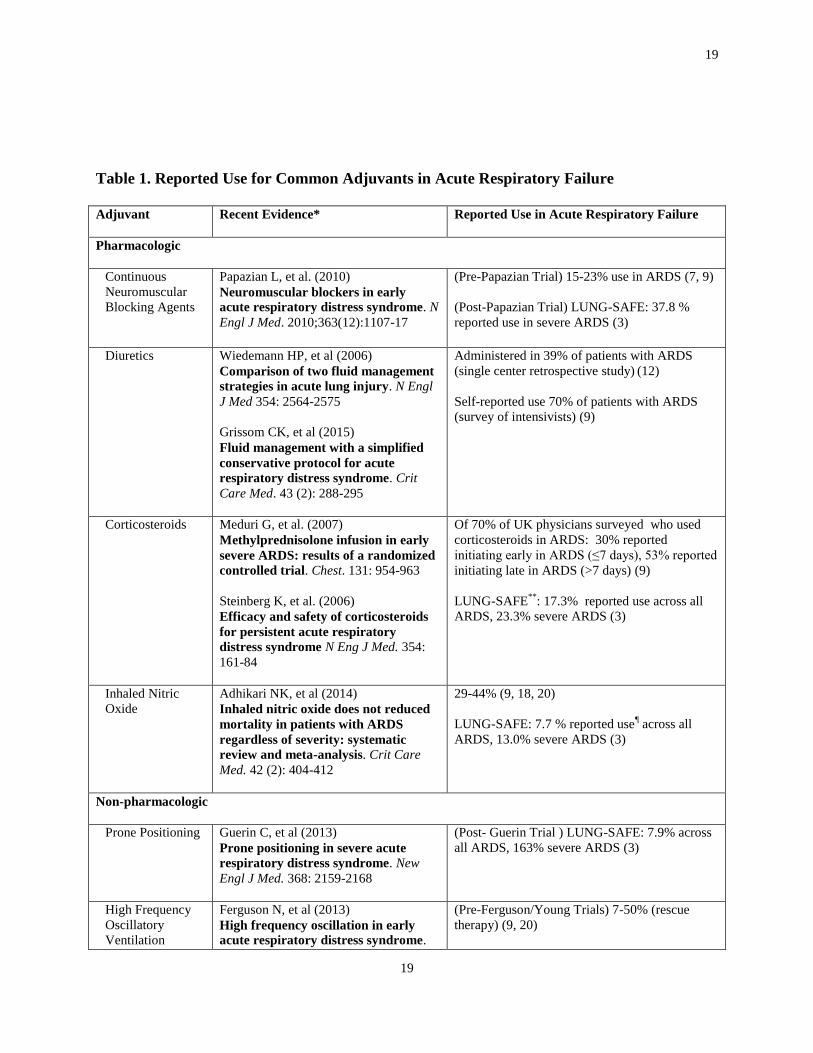
Table 1. Reported Use for Common Adjuvants in Acute Respiratory Failure
Adjuvant
Recent Evidence* Reported Use in Acute Respiratory Failure
Pharmacologic
Continuous
Neuromuscular
Blocking Agents
Papazian L, et al. (2010)
Neuromuscular blockers in early
acute respiratory distress syndrome. N
Engl J Med. 2010;363(12):1107-17
(Pre-Papazian Trial) 15-23% use in ARDS (7, 9)
(Post-Papazian Trial) LUNG-SAFE: 37.8 %
reported use in severe ARDS (3)
Diuretics Wiedemann HP, et al (2006)
Comparison of two fluid management
strategies in acute lung injury. N Engl
J Med 354: 2564-2575
Grissom CK, et al (2015)
Fluid management with a simplified
conservative protocol for acute
respiratory distress syndrome. Crit
Care Med. 43 (2): 288-295
Administered in 39% of patients with ARDS
(single center retrospective study) (12)
Self-reported use 70% of patients with ARDS
(survey of intensivists) (9)
Corticosteroids Meduri G, et al. (2007)
Methylprednisolone infusion in early
severe ARDS: results of a randomized
controlled trial. Chest. 131: 954-963
Steinberg K, et al. (2006)
Efficacy and safety of corticosteroids
for persistent acute respiratory
distress syndrome N Eng J Med. 354:
161-84
Of 70% of UK physicians surveyed who used
corticosteroids in ARDS: 30% reported
initiating early in ARDS (≤7 days), 53% reported
initiating late in ARDS (>7 days) (9)
LUNG-SAFE**
: 17.3% reported use across all
ARDS, 23.3% severe ARDS (3)
Inhaled Nitric
Oxide
Adhikari NK, et al (2014)
Inhaled nitric oxide does not reduced
mortality in patients with ARDS
regardless of severity: systematic
review and meta-analysis. Crit Care
Med. 42 (2): 404-412
29-44% (9, 18, 20)
LUNG-SAFE: 7.7 % reported use¶ across all
ARDS, 13.0% severe ARDS (3)
Non-pharmacologic
Prone Positioning Guerin C, et al (2013)
Prone positioning in severe acute
respiratory distress syndrome. New
Engl J Med. 368: 2159-2168
(Post- Guerin Trial ) LUNG-SAFE: 7.9% across
all ARDS, 163% severe ARDS (3)
High Frequency
Oscillatory
Ventilation
Ferguson N, et al (2013)
High frequency oscillation in early
acute respiratory distress syndrome.
(Pre-Ferguson/Young Trials) 7-50% (rescue
therapy) (9, 20)
20
20
New Engl J Med 368: 795-805
Young D, et al (2013)
High frequency oscillation for acute
respiratory distress syndrome. New
Engl J Med 386: 806-813
(Post-Ferguson/Young Trials) LUNG-SAFE:
1.5% in severe ARDS (3)
Extracorporeal
Membrane
Oxygenation
Peek G, et al (2009)
Efficacy and economic assessment of
convention ventilator support vs.
extracorporeal membrane
oxygenation for severe adult
respiratory failure. Lancet.374 (9698):
1351-1363
12 fold increase in rate of use over the past
decade (2004-2014) (31)
LUNG-SAFE: 3.2 % across all ARDS, 6.6%
severe ARDS (3)
ARDS Acute Respiratory Distress Syndrome
LUNG SAFE The Large Observational Study to Understand the Global Impact of Severe Acute Respiratory Failure *Evidence: Trials or systematic reviews/meta analyses over the past 10 years
** high corticosteroids dose defined as equivalent to 1 mg/kg methylprednisone
¶ all inhaled vasodilators (inhaled nitric oxide)

21
21
Table 2: Inclusion and Exclusion ICD-9 CM codes
Inclusion ICD9 CM Codes
Mechanical Ventilation 96.70, 96.71, 96.72
Respiratory Failure 518.82 , 518.81 , 518.84 , 799.1
DIRECT INFECTIOUS CAUSES OF ARDS
480.0-480.9 , 481 , 482.0-482.9 , 483.0, 483.1, 483.8, 484, 485 , 486 , 487.0
, 011, 012, 018, 114 , 115 , 116, 510, 513
DIRECT NON-INFECTIOUS CAUSES OF ARDS
987.0-987.9, 986, 507.0, 997.32, 022.1 , E910.0,1,3,4,8,9, 861.00-861.32,
958.0 , 958.1 , 417.8 , 518.7
Exclusion ICD9 CM Codes
Pulmonary Hypertension 416.0, 416.8
Cardiac Surgery 39.61 , 35.00-35.09, 36.00-36.09, 37.31-37.37, 37.41, 441.00-441.9
Transplant V42.0-42.7, V42.83, 37.51 , 33.50-33.6 , 50.5 , 55.61, 55.69 , 52.8, 41.00-
41.09
ARDS Acute Respiratory Distress Syndrome
ICD-9-CM International Classification of Disease, 9th Edition, Clinical Modification
22
22
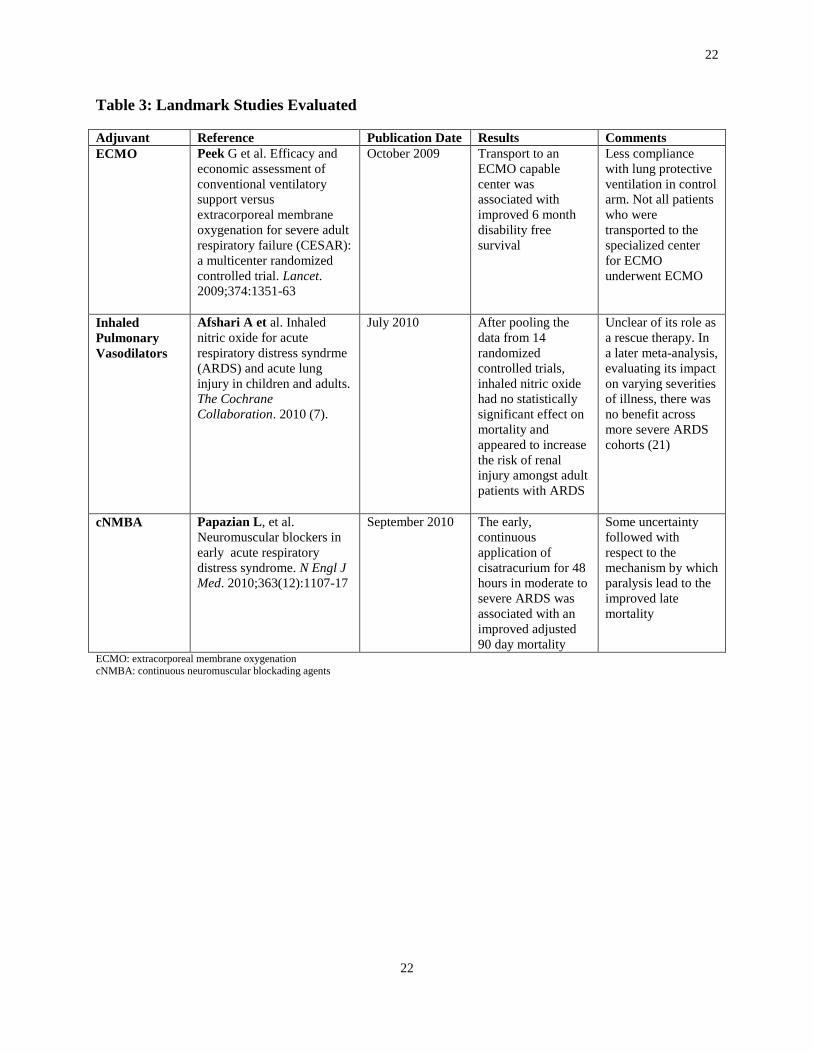
Table 3: Landmark Studies Evaluated
Adjuvant Reference Publication Date Results Comments
ECMO Peek G et al. Efficacy and
economic assessment of
conventional ventilatory
support versus
extracorporeal membrane
oxygenation for severe adult
respiratory failure (CESAR):
a multicenter randomized
controlled trial. Lancet.
2009;374:1351-63
October 2009 Transport to an
ECMO capable
center was
associated with
improved 6 month
disability free
survival
Less compliance
with lung protective
ventilation in control
arm. Not all patients
who were
transported to the
specialized center
for ECMO
underwent ECMO
Inhaled
Pulmonary
Vasodilators
Afshari A et al. Inhaled
nitric oxide for acute
respiratory distress syndrme
(ARDS) and acute lung
injury in children and adults.
The Cochrane
Collaboration. 2010 (7).
July 2010 After pooling the
data from 14
randomized
controlled trials,
inhaled nitric oxide
had no statistically
significant effect on
mortality and
appeared to increase
the risk of renal
injury amongst adult
patients with ARDS
Unclear of its role as
a rescue therapy. In
a later meta-analysis,
evaluating its impact
on varying severities
of illness, there was
no benefit across
more severe ARDS
cohorts (21)
cNMBA
Papazian L, et al.
Neuromuscular blockers in
early acute respiratory
distress syndrome. N Engl J
Med. 2010;363(12):1107-17
September 2010 The early,
continuous
application of
cisatracurium for 48
hours in moderate to
severe ARDS was
associated with an
improved adjusted
90 day mortality
Some uncertainty
followed with
respect to the
mechanism by which
paralysis lead to the
improved late
mortality
ECMO: extracorporeal membrane oxygenation cNMBA: continuous neuromuscular blockading agents
23
23
Table 4: Baseline Demographic Characteristics (2008-2013)
N = 514, 913 Patients
BASELINE DEMOGRAPHIC CHARACTERISTICS
Age (mean ± SD) 62 ((± 17)
Gender (Female, n (%)) 247,158 (48)
Race (White, n (%)) 334,693 (65)
BASELINE CLINICAL VARIABLES
No. Elixhauser Comorbidities, median (IQR) 0 (0-0)
ARDS risk factor, n (%):
Pneumonia 278,053 (54)
Non-Pulmonary Sepsis 72,087 (14)
Non-Infectious SIRS 25,745 (5)
Trauma 56,640 (11)
Mechanical Vent in first 2 days (n (%)) 375,886 (73)
Vasopressors (n (%)) 288,351 (56)
In-Hospital Dialysis (n (%)) 56,640 (11)
ADJUVANT CHARACTERISTICS
Extracorporeal Membrane Oxygenation (n (%))* 195 (0.2)*
Inhaled Pulmonary Vasodilators (n (%))* 1,878 (1.0)*
Inhaled Nitric Oxide (n (%))* 1,087 (0.7)*
Neuromuscular Blockading Agents** (1 day) (n (%)) 20,077 (3.8)
Neuromuscular Blockading Agents** (2 days) (n (%)) 10,073 (2.0)
OUTCOMES
Duration of Mechanical Vent (survivors, days, median IQR) 4 (3-9)
Length of ICU Admission (survivors, days, median IQR) 6 (3-12)
Hospital Mortality (n(%)) 169,921 (33)
Cost (mean ±SD) ¶¶ $27,979 ($14,468-$51,980)
PATIENT DISTRIBUTION ACROSS HOSPITALS
Urban (n (%)) 458,272 (89)
Teaching (n (%)) 226,562 (44)
Bed size (n (%))
Large ≥ 400 beds 257,457 (50)
Medium 200-399 beds 190,518 (37)
Small < 200 beds 66,939 (13)
Location (n (%))
Midwest 92,684 (18)
Northeast 62,684 (18)
South 242,009 (47)
West 87,535 (17) IQR – interquartile range; No. – number; SD – standard deviation, * % reported across hospitals capable of employing that adjuvant, **estimated minimum dosage that can attain continuous paralysis/24 hours, ¶28 day mortality assumes that those discharged before 28 days were alive at 28
days, ¶¶ total patient cost for hospitalization, all patients included
24
24
Table 5: Adjuvant Frequencies
Total Adjuvants (n (%)) 12,146
1 11,006 (2)
2 499 (0.1)
3 40 (<0.01)
One Adjuvant (n (%))
Continuous neuromuscular blockading agents 9537 (86)
Inhaled pulmonary vasodilators 1373 (12)
Extracorporeal membrane oxygenation 96 (1)
Two Adjuvants (n (%))
Continuous neuromuscular blockading agents 474 (95)
Inhaled pulmonary vasodilators 465 (89)
Extracorporeal membrane oxygenation 59 (11)
25
25
Table 6: Patient and Hospital Characteristics According to Adjuvant
ECMO IPV cNMBA
PATIENT CHARACTERISTICS
n=195 n=1,878 n=10,073
Age (mean ± SD) 46 (17) 55 (18) 51 (18)
Race (n (%) Caucasian) 127 (64) 1,052 (56) 6,346 (63)
Gender (n (%) Female) 86 (44) 789 (42) 3,727 (37)
Insurance Status (n (%))
Private 96 (49) 657 (35) 3,123 (31)
Medicare 41 (21) 695 (37) 3,324 (33)
Medicaid 49 (25) 338 (18) 2,015 (20)
Elixhauser Comorbidities (median
IQR)
0 (0-0) 0 (0-0) 0 (0-1)
Immunocompromised (n (%)) 2 (1) 94 (5) 403 (4)
No. Hospitals 62 119 543
Vasopressor Use (n (%)) 167 (87) 1,615 (86) 8,159 (81)
In-Hospital Dialysis (n (%)) 45 (23) 488 (26) 1,813 (18)
In-Hospital Mortality (n (%)) 105 (54) 1,108 (59) 4,331 (43)
Cost per hospitalization (mean USD) 97,501 74,292 61,579
HOSPTIAL CHARACTERISTICS*
Bed size (mean ± SD) 626 (255) 528 (210) 475 (225)
Teaching (n (%)) 140 (72) 1,352 (72) 5,037 (50)
Urban (n (%)) 193 (99) 1,821 (97) 9,469 (94) cNMBA – continuous neuromuscular blockading agents
ECMO – extracorporeal membrane oxygenation
IPV – inhaled pulmonary vasodilators IQR – interquartile range
No. - number
SD – standard deviation USD – United States Dollars; *number of patients across hospital characteristics
26
26
Table 7: Changes Over Time Sensitivity Analyses
Hospitals Present Entire
Cohort
100% Mortality Cohort Sensitivity Analysis
ECMO
Year RR (95% CI) Year RR (95% CI) Year RR (95% CI)
2008 (reference 1.0) 2008 (reference 1.0) 2008 (reference 1.0)
2009 2.2 (0.9-5.6) 2009 2.3 (0.8-6.4) 2009 7.4 (1.1-51.4))
2010 1.4 (0.6-3.3) 2010 1.4 (0.5-3.9) 2010 1.3 (0.1-15.0)
2011 2.2 (0.9-5.5) 2011 1.8 (0.7-4.4) 2011 2.6 (0.3-21.6)
2012 3.9 (1.9-8.0) 2012 2.5 (1.2-5.3) 2012 3.6 (0.4-30.1)
2013 3.2 (1.5-6.9) 2013 2.8 (1.1-7.0) 2013 7.4 (0.9-61.1)
Analysis using year as a continuous variable: RR 1.16 95% CI 0.98-1.37
Hospitals Present Entire
Cohort
100% Mortality Cohort Sensitivity Analysis
Inhaled Nitric Oxide
Year RR (95% CI) Year RR (95% CI) Year RR (95% CI)
2008 (reference 1.0) 2008 (reference 1.0) 2008 (reference 1.0)
2009 1.1 (0.8-1.5) 2009 1.6 (1.0-2.5) 2009 1.6 (0.8-3.2)
2010 1.0 (0.7-1.5) 2010 1.3 (0.8-2.2) 2010 0.8 (0.4-1.8)
2011 1.2 (0.8-1.8) 2011 1.5 (0.9-2.7) 2011 1.4 (0.6-3.0)
2012 1.0 (0.5-2.1) 2012 1.2 (0.6-2.5) 2012 1.1 (0.5-2.6)
2013 1.0 (0.5-2.0) 2013 1.3 (0.6-2.6) 2013 1.3 (0.5-3.2)
Analysis using year as a continuous variable: RR 1.09 95% CI 0.89-1.13
Hospitals Present Entire
Cohort
100% Mortality Cohort Sensitivity Analysis
Inhaled Epoprostenol
Year RR (95% CI) Year RR (95% CI) Year RR (95% CI)
2008 (reference 1.0) 2008 (reference 1.0) 2008 (reference 1.0)
2009 1.8 (1.1-3.0) 2009 1.6 (0.8-3.0) 2009 1.2 (0.5-2.7)
2010 2.5 (1.1-5.3) 2010 2.3 (1.0-5.4) 2010 1.9 (0.6-5.3)
2011 2.0 (0.8-5.4) 2011 2.2 (0.8-6.2) 2011 1.7 (0.6-4.5)
2012 1.9 (0.8-4.1) 2012 2.6 (1.0-6.0) 2012 1.8 (0.7-5.0)
2013 1.8 (0.8-4.1) 2013 2.7 (1.1-6.0) 2013 2.9 (0.9-8.4)
Analysis using year as a continuous variable: RR 1.12 95% CI 0.96-1.31
Hospitals Present Entire
Cohort
100% Mortality Cohort Sensitivity Analysis
cNMBA
Year RR (95% CI) Year RR (95% CI) Year RR (95% CI)
2008 (reference 1.0) 2008 (reference 1.0) 2008 (reference 1.0)
2009 1.1 (1.0-1.3) 2009 1.2 (1.1-1.4) 2009 1.1 (0.9-1.3)
2010 1.0 (0.9-1.2) 2010 1.1 (0.9-1.3) 2010 0.9 (0.7-1.1)
2011 1.1 (0.9-1.3) 2011 1.3 (1.1-1.5) 2011 0.9 (0.8-1.2)
2012 1.1 (0.9-1.2) 2012 1.3 (1.1-1.5) 2012 0.9 (0.7-1.1)
2013 1.0 (0.9-1.2) 2013 1.2 (1.0-1.5) 2013 0.9 (0.7-1.1)
Analysis using year as a continuous variable: RR 0.97 95% CI 0.94-1.01

27
27
cNMBA 1 day* Cisatracurium 2 days** Any dose/use NMBA
cNMBA SENSITIVITY
Year RR (95% CI) Year RR (95% CI) Year RR (95% CI)
2008 (reference 1.0) 2008 (reference 1.0) 2008 (reference 1.0)
2009 1.1 (1.0-1.3) 2009 1.1 (0.9-1.2) 2009 1.0 (0.9-1.0)
2010 0.9 (0.9-1.1) 2010 1.1 (0.9-1.3) 2010 1.0 (0.9-1.0)
2011 1.0 (0.9-1.2) 2011 1.1 (0.9-1.3) 2011 1.0 (0.9-1.0)
2012 0.9 (0.8-1.1) 2012 1.1 (0.9-1.3) 2012 1.0 (0.9-1.0)
2013 0.9 (0.8-1.2) 2013 1.1 (0.9-1.2) 2013 1.0 (0.9-1.0) *dose to achieve continuous paralysis for 24 hours for 1 day only
** dose to achieve continuous paralysis for 24 hours for 2 days for cisatracurium only

28
28
Figure 1: Adjuvants for Acute Respiratory Failure
Figure 1 depicts the spectrum of adjuvants to mechanical ventilation for acute respiratory failure across different severities of illness

29
29
Figure 2: Factors that Drive Decision Making
Figure 2 depicts factors that may influence clinician decision-making (32)

30
30
Figure 3: Cohort Creation
Adult in-patients
undergoing mechanical
ventilation
n = 736,488
Adult in-patients undergoing
mechanical ventilation with
respiratory failure
n = 663,303
Final Cohort for Analysis
n = 514,913
EXCLUDE
Pulmonary hypertension, transplant, cardiac surgery
(102,494)
Extubated alive after 24 hours of mechanical ventilation and discharged alive
(45,896)
EXCLUDE
No Mechanical Ventilation Billing Code (16,453)
Non-Respiratory Failure (56,732)
Figure 3 depicts the cohort assembly based upon inclusion and exclusion criteria
31
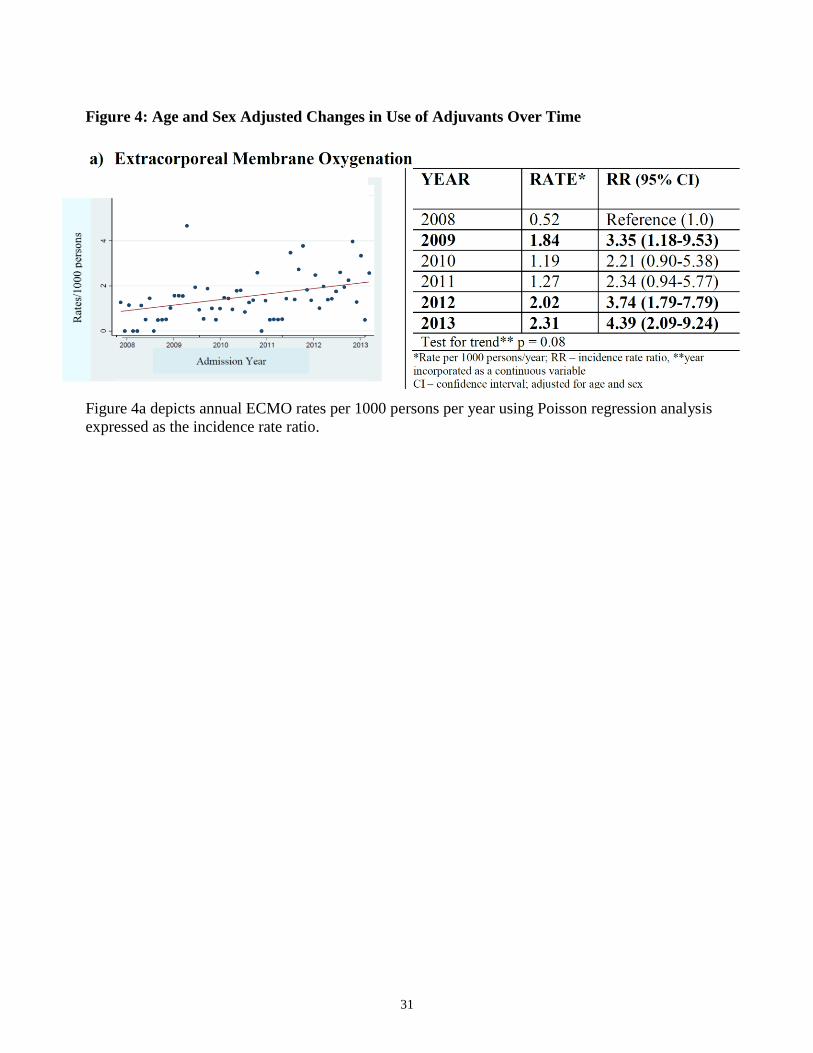
Figure 4: Age and Sex Adjusted Changes in Use of Adjuvants Over Time
Figure 4a depicts annual ECMO rates per 1000 persons per year using Poisson regression analysis
expressed as the incidence rate ratio.
32
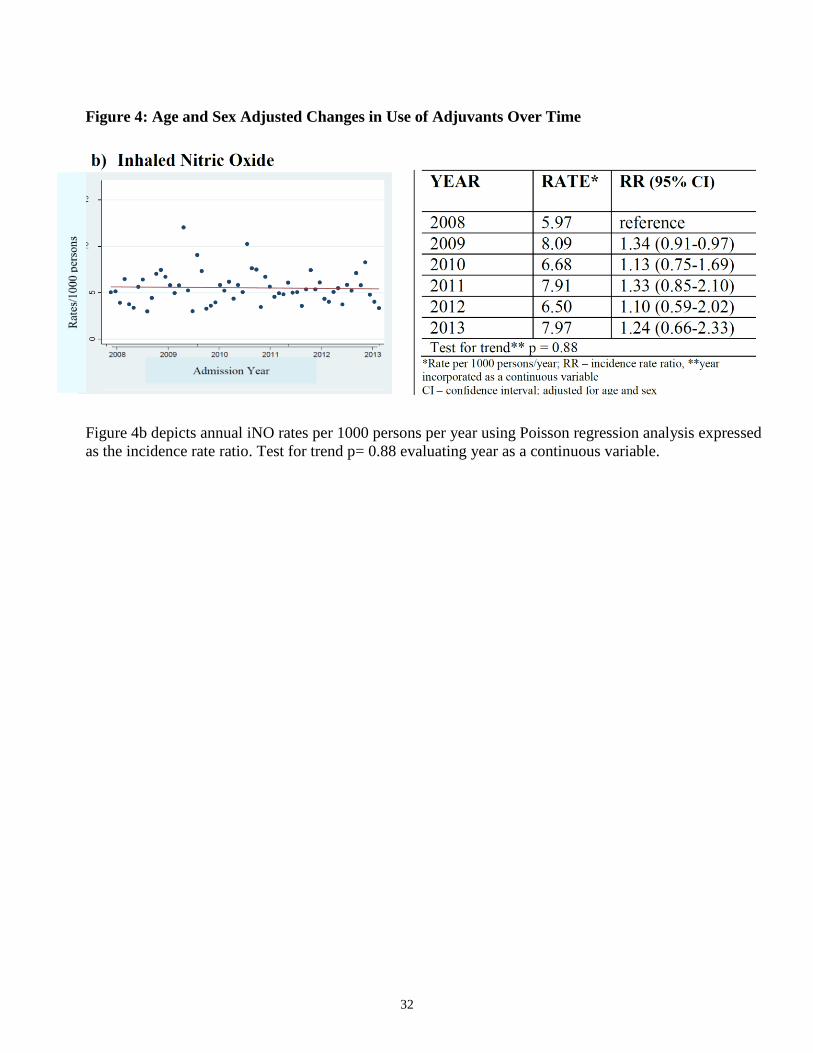
Figure 4: Age and Sex Adjusted Changes in Use of Adjuvants Over Time
Figure 4b depicts annual iNO rates per 1000 persons per year using Poisson regression analysis expressed
as the incidence rate ratio. Test for trend p= 0.88 evaluating year as a continuous variable.
33
33
Figure 4: Age and Sex Adjusted Changes in Use of Adjuvants Over Time
Figure 4c depicts annual iEpoprostenol rates per 1000 persons per year using Poisson regression analysis
expressed as the incidence rate ratio.
34
Figure 4: Age and Sex Adjusted Changes in Use of Adjuvants Over Time
Figure 4d depicts annual cNMBA rates 1000 persons per year using Poisson regression analysis
expressed as the incidence rate ratio
Figure 5: Impact of Landmark Publications on Changes of Use Over Time
35
35
a) Extracorporeal Membrane Oxygenation
Figure 5a depicts the segmented regression analysis of changes in monthly rates in use of ECMO in
response to landmark publications (arrow specifies time point of publication)
36
36
Figure 5: Impact of Landmark Publications on Changes of Use Over Time
b) Inhaled Nitric Oxide
Figure 5b depicts the segmented regression analysis of changes in monthly rates in use of iNO in
response to landmark publications (arrow specifies time point of publication)
37
37
Figure 5: Impact of Landmark Publications on Changes of Use Over Time
c) Inhaled Epoprostenol
Figure 5c depicts the segmented regression analysis of changes in monthly rates in use of
iEpoprostenol in response to landmark publications (arrow specifies time point of publication)
38
38
Figure 5: Impact of Landmark Publications on Changes of Use Over Time
d) Continuous Neuromuscular Blockading Agents
Figure 5d depicts the segmented regression analysis of changes in monthly rates in use of cNMBA in
response to landmark publications (arrow specifies time point of publication)
39
39
Figure 6: Changes in Use of Pulmonary Artery Catheter
Figure 6 depicts annual rates per 1000 persons per year over time and the incident rate ratio
using Poisson regression analysis
40
40
Figure 7a: Factors Associated With Adjuvant Use
Figure 7a depicts patient and hospital factors associated with ECMO adjuvant use using logistic
regression fitted with generalized estimating equations
41
41
Figure 7b: Factors Associated With Adjuvant Use
Figure 7b depicts patient and hospital factors associated with cNMBA adjuvant use using logistic
regression fitted with generalized estimating equations
42
42
Figure 7c: Factors Associated With Adjuvant Use
Figure 7c depicts patient and hospital factors associated iNO adjuvant use using logistic
regression fitted with generalized estimating equations
43
43
Figure 7d: Factors Associated With Adjuvant Use
Figure 7d depicts patient and hospital factors associated iEpoprostenol adjuvant use using
logistic regression fitted with generalized estimating equations
44
44
References
1. Ranieri VM, Rubenfeld GD, Thompson BT, Ferguson ND, Caldwell E, Fan E, Camporota L,
Slutsky AS. Acute respiratory distress syndrome: the Berlin Definition. JAMA 2012; 307:
2526-2533.
2. Luhr OR, Antonsen K, Karlsson M, Aardal S, Thorsteinsson A, Frostell CG, Bonde J.
Incidence and mortality after acute respiratory failure and acute respiratory distress
syndrome in Sweden, Denmark, and Iceland. The ARF Study Group. Am J Respir Crit
Care Med 1999; 159: 1849-1861.
3. Bellani G, Laffey JG, Pham T, Fan E, Brochard L, Esteban A, Gattinoni L, van Haren F,
Larsson A, McAuley DF, Ranieri M, Rubenfeld G, Thompson BT, Wrigge H, Slutsky
AS, Pesenti A, Investigators LS, Group ET. Epidemiology, Patterns of Care, and
Mortality for Patients With Acute Respiratory Distress Syndrome in Intensive Care Units
in 50 Countries. JAMA 2016; 315: 788-800.
4. Gattinoni L, Quintel M. How ARDS should be treated. Crit Care 2016; 20: 86.
5. Ventilation with lower tidal volumes as compared with traditional tidal volumes for acute lung
injury and the acute respiratory distress syndrome. The Acute Respiratory Distress
Syndrome Network. N Engl J Med 2000; 342: 1301-1308.
6. Forel JM, Roch A, Marin V, Michelet P, Demory D, Blache JL, Perrin G, Gainnier M,
Bongrand P, Papazian L. Neuromuscular blocking agents decrease inflammatory
response in patients presenting with acute respiratory distress syndrome. Crit Care Med
2006; 34: 2749-2757.
7. Steingrub JS, Lagu T, Rothberg MB, Nathanson BH, Raghunathan K, Lindenauer PK.
Treatment with neuromuscular blocking agents and the risk of in-hospital mortality
among mechanically ventilated patients with severe sepsis. Crit Care Med 2014; 42: 90-
96.
8. Papazian L, Forel J, A G, Penot-Ragon C, Perrin G, Loundon A, Jaber S, Arnal J, Perez D.
Neuromuscular blockers in early acute respiratory distress syndrome. N Engl J Med
2010; 363: 1107-1117.
9. Dushianthan A, Cusak R, Chee J, Dunn J, Grocott M. Perceptions of diagnosis and
management of patients wiwth acute respiratory distress syndrome: a survey of United
Kingdom intensive care physicians. BMC Anesthesiology 2014; 14: 87-95.
10. National Heart L, Blood Institute Acute Respiratory Distress Syndrome Clinical Trials N,
Wiedemann HP, Wheeler AP, Bernard GR, Thompson BT, Hayden D, deBoisblanc B,
Connors AF, Jr., Hite RD, Harabin AL. Comparison of two fluid-management strategies
in acute lung injury. N Engl J Med 2006; 354: 2564-2575.
11. Mikkelsen ME, Christie JD, Lanken PN, Biester RC, Thompson BT, Bellamy SL, Localio
AR, Demissie E, Hopkins RO, Angus DC. The adult respiratory distress syndrome
cognitive outcomes study: long-term neuropsychological function in survivors of acute
lung injury. Am J Respir Crit Care Med 2012; 185: 1307-1315.
12. Jones S, Martensson J, Glassford. Loop diuretic therapy in the critically ill: a survey. Crit
Care and Resus 2015; 17: 223-226.
13. Magazine R, Rao S, Chogtu B. Prescribing Patterns of Drugs in Acute Respiratory Distress
Syndrome (ARDS): An Observational Study. J Clin Diagn Res 2015; 9: FC01-04.
14. Grissom CK, Hirshberg EL, Dickerson JB, Brown SM, Lanspa MJ, Liu KD, Schoenfeld D,
Tidswell M, Hite RD, Rock P, Miller RR, 3rd, Morris AH, National Heart L, Blood
Institute Acute Respiratory Distress Syndrome Clinical Trials N. Fluid management with
45
45
a simplified conservative protocol for the acute respiratory distress syndrome*. Crit Care
Med 2015; 43: 288-295.
15. Meduri GU, Golden E, Freire AX, Taylor E, Zaman M, Carson SJ, Gibson M, Umberger R.
Methylprednisolone infusion in early severe ARDS: results of a randomized controlled
trial. Chest 2007; 131: 954-963.
16. Steinberg KP, Hudson LD, Goodman RB, Hough CL, Lanken PN, Hyzy R, Thompson BT,
Ancukiewicz M, National Heart L, Blood Institute Acute Respiratory Distress Syndrome
Clinical Trials N. Efficacy and safety of corticosteroids for persistent acute respiratory
distress syndrome. N Engl J Med 2006; 354: 1671-1684.
17. Siemieniuk RA, Meade MO, Alonso-Coello P, Briel M, Evaniew N, Prasad M, Alexander
PE, Fei Y, Vandvik PO, Loeb M, Guyatt GH. Corticosteroid Therapy for Patients
Hospitalized With Community-Acquired Pneumonia: A Systematic Review and Meta-
analysis. Ann Intern Med 2015; 163: 519-528.
18. Kredel M, Bierbaum D, Lotz C. Therapy of acute respiratory distress syndrome: Survey of
German ARDS centers and scientific evidence. Anesthetist 2015; 64: 277-285.
19. Gries A, Bode C, Peter K, Herr A, Bohrer H, Motsch J, Martin E. Inhaled nitric oxide
inhibits human platelet aggregation, P-selectin expression, and fibrinogen binding in vitro
and in vivo. Circulation 1998; 97: 1481-1487.
20. Walkey AJ, Wiener RS. Utilization patterns and patient outcomes associated with use of
rescue therapies in acute lung injury. Crit Care Med 2011; 39: 1322-1328.
21. Adhikari NK, Dellinger RP, Lundin S, Payen D, Vallet B, Gerlach H, Park KJ, Mehta S,
Slutsky AS, Friedrich JO. Inhaled nitric oxide does not reduce mortality in patients with
acute respiratory distress syndrome regardless of severity: systematic review and meta-
analysis. Crit Care Med 2014; 42: 404-412.
22. Adhikari NK, Burns KE, Friedrich JO, Granton JT, Cook DJ, Meade MO. Effect of nitric
oxide on oxygenation and mortality in acute lung injury: systematic review and meta-
analysis. BMJ 2007; 334: 779.
23. Santini A, Protti A, Langer T, Comini B, Monti M, Sparacino CC, Dondossola D, Gattinoni
L. Prone position ameliorates lung elastance and increases functional residual capacity
independently from lung recruitment. Intensive Care Med Exp 2015; 3: 55.
24. Sud S, Friedrich JO, Taccone P, Polli F, Adhikari NK, Latini R, Pesenti A, Guerin C,
Mancebo J, Curley MA, Fernandez R, Chan MC, Beuret P, Voggenreiter G, Sud M,
Tognoni G, Gattinoni L. Prone ventilation reduces mortality in patients with acute
respiratory failure and severe hypoxemia: systematic review and meta-analysis. Intensive
Care Med 2010; 36: 585-599.
25. Guerin C, Reignier J, Richard JC, Beuret P, Gacouin A, Boulain T, Mercier E, Badet M,
Mercat A, Baudin O, Clavel M, Chatellier D, Jaber S, Rosselli S, Mancebo J, Sirodot M,
Hilbert G, Bengler C, Richecoeur J, Gainnier M, Bayle F, Bourdin G, Leray V, Girard R,
Baboi L, Ayzac L, Group PS. Prone positioning in severe acute respiratory distress
syndrome. N Engl J Med 2013; 368: 2159-2168.
26. Sud S, Sud M, Friedrich JO, Meade MO, Ferguson ND, Wunsch H, Adhikari NK. High
frequency oscillation in patients with acute lung injury and acute respiratory distress
syndrome (ARDS): systematic review and meta-analysis. BMJ 2010; 340: c2327.
27. Ferguson ND, Cook DJ, Guyatt GH, Mehta S, Hand L, Austin P, Zhou Q, Matte A, Walter
SD, Lamontagne F, Granton JT, Arabi YM, Arroliga AC, Stewart TE, Slutsky AS,
Meade MO, Investigators OT, Canadian Critical Care Trials G. High-frequency
46
46
oscillation in early acute respiratory distress syndrome. N Engl J Med 2013; 368: 795-
805.
28. Young D, Lamb SE, Shah S, MacKenzie I, Tunnicliffe W, Lall R, Rowan K, Cuthbertson
BH, Group OS. High-frequency oscillation for acute respiratory distress syndrome. N
Engl J Med 2013; 368: 806-813.
29. Peek G, Mugford M, Tiruvoipati R, Wilson A, Allen E, Thalanany M, Hibbert C, Truesdale
A, Clemens F. Efficacy and economic assessment of conventional ventilatory suppport
versus extracorporeal membrane oxygenaton for severe adult respiratory failure
(CESAR): a multicenter randomizde controlled trial. Lancet 2009; 374: 1351-1363.
30. Munshi L, Telesnicki T, Walkey A, Fan E. Extracorporeal life support for acute respiratory
failure. A systematic review and metaanalysis. Ann Am Thorac Soc 2014; 11: 802-810.
31. Extracorporeal Life Support Organization. January 2015. International Summary. Retrieved
from http://www.elso.org.
32. Rubenfeld GD. Understanding why we agree on the evidence but disagree on the medicine.
Respiratory Care 2001; 46: 1442-1449.
33. Niven DJ, Rubenfeld GD, Kramer AA, Stelfox HT. Effect of published scientific evidence
on glycemic control in adult intensive care units. JAMA Intern Med 2015; 175: 801-809.
34. Weinert CR, Gross CR, Marinelli WA. Impact of randomized trial results on acute lung
injury ventilator therapy in teaching hospitals. Am J Respir Crit Care Med 2003; 167:
1304-1309.
35. Burns KE, Adhikari NK, Slutsky AS, Guyatt GH, Villar J, Zhang H, Zhou Q, Cook DJ,
Stewart TE, Meade MO. Pressure and volume limited ventilation for the ventilatory
management of patients with acute lung injury: a systematic review and meta-analysis.
PLoS One 2011; 6: e14623.
36. Wiener R, Welch H. Trends in the use of the pulmonary artery catheter in the United States,
1993-2004. JAMA 2007; 298: 423-429.
37. Ventilation with lower tidal volumes as compared with traditional tidal volumes for acute
lung injury and the acute respiratory distress syndrome. The Acute Respiratory Distress
Syndrome Network. . N Engl J Med; 342: 1301-1308.
38. Pham T, Combes A, Roze H, Chevret S, Mercat A, Roch A, Mourvillier B, Ara-Somohano
C, Bastien O, Zogheib E, Clavel M, Constan A, Marie Richard JC, Brun-Buisson C,
Brochard L, Network RR. Extracorporeal membrane oxygenation for pandemic influenza
A(H1N1)-induced acute respiratory distress syndrome: a cohort study and propensity-
matched analysis. Am J Respir Crit Care Med 2013; 187: 276-285.
39. Noah MA, Peek GJ, Finney SJ, Griffiths MJ, Harrison DA, Grieve R, Sadique MZ, Sekhon
JS, McAuley DF, Firmin RK, Harvey C, Cordingley JJ, Price S, Vuylsteke A, Jenkins
DP, Noble DW, Bloomfield R, Walsh TS, Perkins GD, Menon D, Taylor BL, Rowan
KM. Referral to an extracorporeal membrane oxygenation center and mortality among
patients with severe 2009 influenza A(H1N1). JAMA 2011; 306: 1659-1668.
40. Beitler JR, Goligher EC, Schmidt M, Spieth PM, Zanella A, Martin-Loeches I, Calfee CS,
Cavalcanti AB, Investigators AR. Personalized medicine for ARDS: the 2035 research
agenda. Intensive Care Med 2016; 42: 756-767.
41. Premier Perspective Hospital Database, Charlotte, NC and Washington, DC, April 2014.
42. Thomsen GE, Morris AH. Incidence of the adult respiratory distress syndrome in the state of
Utah. Am J Respir Crit Care Med 1995; 152: 965-971.
43. Angus D, Linde-Zwirlbl W, Clermont G, Newbold R, Pinsky M. What's the incidence and
mortality of ARDS in the US? Am J Respir Crit Care Med 1996; 153.
47
47
44. Reynolds H, McCunn M, Borg U, Habashi N, Cottingham C, Bar-Lavi Y. Acute respiratory
distress syndrome: estimated incidence and mortality rate in a 5 million-person
population base. Critical Care 1998; 2.
45. Maxell BG, Powers AJ, Sheikh AY, Lee PH, Lobato RL, Wong JK. Resource use trends in
extracorporeal membrane oxygenation in adults: an analysis of the Nationwide Inpatient
Sample 1998-2009. J Thorac Cardiovasc Surg 2014; 148: 416-421 e411.
46. Lexicomp Online, Lexi-Drugs, Hudson, Ohio: Lexi-Comp, Inc; April 2014.
47. Elixhauser A. Comorbidity measures for use with administrative data. Med Care 1998.
48. McCullagh P. Generalized Linear Models. New York, NY: Chapmean & Hall; 1989.
49. You JJ, Alter DA, Stukel TA, McDonald SD, Laupacis A, Liu Y, Ray JG. Proliferation of
prenatal ultrasonography. CMAJ 2010; 182: 143-151.
50. Alter DA, Stukel TA, Newman A. Proliferation of cardiac technology in Canada: a challenge
to the sustainability of Medicare. Circulation 2006; 113: 380-387.
51. Wagner A, Soumerai S, Zhang F, Ross-Degnan D. Segmented regression analysis of
interrupted time series studies in medication use research. Journal of Clinical Pharmacy
and Therapeutics 2002; 27: 299-309.
52. Afshari A, Brok J, Moller A, Wetterslev J. Inhaled nitric oxide for acute respiratory distress
syndrme (ARDS) and acute lung injury in children and adults. The Cochrane
Collaboration 2010.
53. Fisher ES, Wennberg DE, Stukel TA, Gottlieb DJ, Lucas FL, Pinder EL. The implications of
regional variations in Medicare spending. Part 2: health outcomes and satisfaction with
care. Ann Intern Med 2003; 138: 288-298.
54. Gershengorn HB, Wunsch H. Understanding changes in established practice: pulmonary
artery catheter use in critically ill patients. Crit Care Med 2013; 41: 2667-2676.
55. Slutsky AS. Neuromuscular blockading agents in ARDS. N Engl J Med 2010; 363: 1176-
1180.
56. Jonsen AR. Bentham in a box: technology assessment and health care allocation. Law Med
Health Care 1986; 14: 172-174.
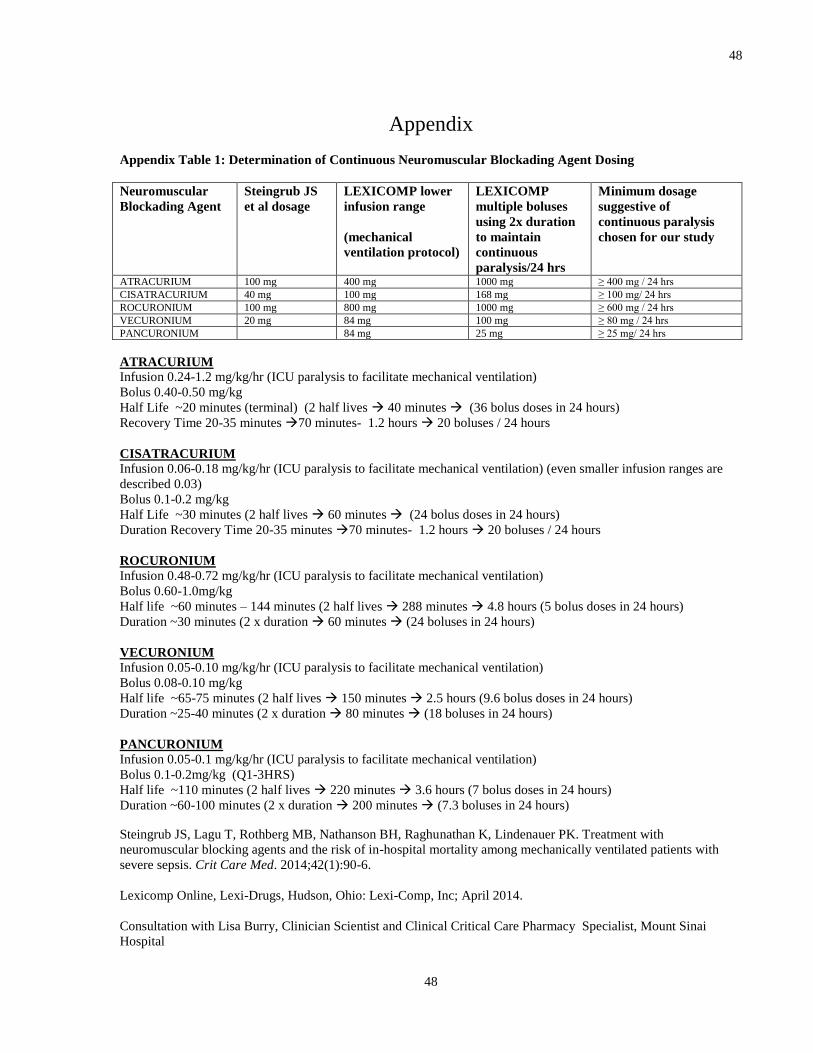
48
48
Appendix
Appendix Table 1: Determination of Continuous Neuromuscular Blockading Agent Dosing
Neuromuscular
Blockading Agent
Steingrub JS
et al dosage
LEXICOMP lower
infusion range
(mechanical
ventilation protocol)
LEXICOMP
multiple boluses
using 2x duration
to maintain
continuous
paralysis/24 hrs
Minimum dosage
suggestive of
continuous paralysis
chosen for our study
ATRACURIUM 100 mg 400 mg 1000 mg ≥ 400 mg / 24 hrs
CISATRACURIUM 40 mg 100 mg 168 mg ≥ 100 mg/ 24 hrs
ROCURONIUM 100 mg 800 mg 1000 mg ≥ 600 mg / 24 hrs
VECURONIUM 20 mg 84 mg 100 mg ≥ 80 mg / 24 hrs
PANCURONIUM 84 mg 25 mg ≥ 25 mg/ 24 hrs
ATRACURIUM
Infusion 0.24-1.2 mg/kg/hr (ICU paralysis to facilitate mechanical ventilation)
Bolus 0.40-0.50 mg/kg
Half Life ~20 minutes (terminal) (2 half lives 40 minutes (36 bolus doses in 24 hours)
Recovery Time 20-35 minutes 70 minutes- 1.2 hours 20 boluses / 24 hours
CISATRACURIUM
Infusion 0.06-0.18 mg/kg/hr (ICU paralysis to facilitate mechanical ventilation) (even smaller infusion ranges are
described 0.03)
Bolus 0.1-0.2 mg/kg
Half Life ~30 minutes (2 half lives 60 minutes (24 bolus doses in 24 hours)
Duration Recovery Time 20-35 minutes 70 minutes- 1.2 hours 20 boluses / 24 hours
ROCURONIUM
Infusion 0.48-0.72 mg/kg/hr (ICU paralysis to facilitate mechanical ventilation)
Bolus 0.60-1.0mg/kg
Half life ~60 minutes – 144 minutes (2 half lives 288 minutes 4.8 hours (5 bolus doses in 24 hours)
Duration ~30 minutes (2 x duration 60 minutes (24 boluses in 24 hours)
VECURONIUM
Infusion 0.05-0.10 mg/kg/hr (ICU paralysis to facilitate mechanical ventilation)
Bolus 0.08-0.10 mg/kg
Half life ~65-75 minutes (2 half lives 150 minutes 2.5 hours (9.6 bolus doses in 24 hours)
Duration ~25-40 minutes (2 x duration 80 minutes (18 boluses in 24 hours)
PANCURONIUM
Infusion 0.05-0.1 mg/kg/hr (ICU paralysis to facilitate mechanical ventilation)
Bolus 0.1-0.2mg/kg (Q1-3HRS)
Half life ~110 minutes (2 half lives 220 minutes 3.6 hours (7 bolus doses in 24 hours)
Duration ~60-100 minutes (2 x duration 200 minutes (7.3 boluses in 24 hours)
Steingrub JS, Lagu T, Rothberg MB, Nathanson BH, Raghunathan K, Lindenauer PK. Treatment with
neuromuscular blocking agents and the risk of in-hospital mortality among mechanically ventilated patients with
severe sepsis. Crit Care Med. 2014;42(1):90-6.
Lexicomp Online, Lexi-Drugs, Hudson, Ohio: Lexi-Comp, Inc; April 2014.
Consultation with Lisa Burry, Clinician Scientist and Clinical Critical Care Pharmacy Specialist, Mount Sinai
Hospital