Embed Size (px)
Citation preview

NBER WORKING PAPER SERIES
ADJUSTING NATIONAL ACCOUNTING FOR HEALTH:IS THE BUSINESS CYCLE COUNTERCYCLICAL?
Mark L. EganCasey B. MulliganTomas J. Philipson
Working Paper 19058http://www.nber.org/papers/w19058
NATIONAL BUREAU OF ECONOMIC RESEARCH1050 Massachusetts Avenue
Cambridge, MA 02138May 2013
Previously circulated as "Adjusting Measures of Economic Output for Health: Is the Business CycleCountercyclical?." We thank Ralph S.J. Koijen and William H.J. Hubbard for their valuable input.Tomas Philipson acknowledges financial support from the George Stigler Center for the Study of TheEconomy and The State, The University of Chicago. The views expressed herein are those of the authorsand do not necessarily reflect the views of the National Bureau of Economic Research.
NBER working papers are circulated for discussion and comment purposes. They have not been peer-reviewed or been subject to the review by the NBER Board of Directors that accompanies officialNBER publications.
© 2013 by Mark L. Egan, Casey B. Mulligan, and Tomas J. Philipson. All rights reserved. Short sectionsof text, not to exceed two paragraphs, may be quoted without explicit permission provided that fullcredit, including © notice, is given to the source.
Adjusting National Accounting for Health: Is the Business Cycle Countercyclical?Mark L. Egan, Casey B. Mulligan, and Tomas J. PhilipsonNBER Working Paper No. 19058May 2013, Revised January 2014JEL No. E01,I1
ABSTRACT
Many national accounts of economic output and prosperity, such as gross domestic product (GDP) ornet domestic product (NDP), offer an incomplete picture by ignoring, for example, the value of leisure,home production, and the value of health. Previous discussed shortcomings of such accounts havefocused on how unobserved dimensions affect GDP levels but not their cyclicality, which affects themeasurement of the business cycle. This paper proposes a new methodology to measure economicfluctuations that incorporates monetized changes in health of the population in the United States andglobally during the past 50 years. In particular, we incorporate in GDP the dollar value of mortality,treating it as depreciation in human capital analogous to how net domestic product (NDP) treatsdepreciation of physical capital. Because mortality tends to be pro�cyclical, we find that adjustingfor mortality reduces the measured deviations of GDP from trend during the past 50 years by about30% both in the United States and internationally.
Mark L. EganUniversity of ChicagoDepartment of Economics1126 East 59th StreetChicago, IL [email protected]
Casey B. MulliganUniversity of ChicagoDepartment of Economics1126 East 59th StreetChicago, IL 60637and [email protected]
Tomas J. PhilipsonIrving B. Harris Graduate Schoolof Public Policy StudiesUniversity of Chicago1155 E. 60th StreetChicago, IL 60637and [email protected]
2
1. Introduction
Ithaslongbeenrecognizedthatgrossdomesticproduct(GDP)isanincomplete
measureofeconomicoutput.Amongotherthings,GDPexcludesthevalueofleisure,home
production,andhealth.YetGDPandnetdomesticproduct(NDP)prevailasmeasuresof
economicoutput.Thisisinpartforapragmaticreason;alternativeapproachescannotbe
adoptedinasimpleandtransparentmanneracrosstimeandcountries.Themeasureofan
economy’swell‐beinghasenormousimplicationsnotonlyforattemptstounderstand
fluctuations,butalsoforitsimpactonnationalpoliciesthataregroundedinthebeliefthat
currentlymeasuredrecessionsarewelfarereducingandboomsarewelfareenhancing.
Animportantdimensionofaneconomy’swelfareconcernsthehealthofits
population.Indeed,recentresearchindicatesthat,intermsofoveralltrends,healthhas
beenoneofthemostimportantcomponentsoftheadvancesinU.S.welfareduringthelast
century(MurphyandTopel2006).Inthispaper,weanalyzewhetherincorporatinghealth
intomeasuresofshort‐termmacroeconomicfluctuationsinGDPorNDP—i.e.,deviations
fromtrends—altersassessmentsofthemagnitudeofmacroeconomicfluctuations.
WeincorporatehealthintomacroeconomicfluctuationmeasuresbyvaluinginU.S.
dollarsanycyclicalchangesinhealthsurroundingboomsandrecessions.Inparticular,we
incorporatemortalityintooutputmeasuresasdepreciationinhumancapitalinaway
analogoustohowNDPtreatsphysicaldepreciation.Wethenconstructmortality‐adjusted
GDPandNDPmeasurestoreexaminetheU.S.andinternationalfluctuationsduringthepast
50years.WefindthatmortalitycovariespositivelywithtraditionalGDPandNDP
measuresovertimeacrossagesandcountries,extendinganexistingliteratureonthe
positivecovariancebetweenmortalityandemployment(Ruhm2000).Whenwemonetize
thesecounter‐cyclicallevelsofhealth,wefindthattheyarequantitativelyimportantand
theU.S.fluctuationslookmilderthantraditionallypresumedwithGDPorNDP.Wefind
thatincorporatingthevalueofmortalitypotentially reversesonethirdof“recessions”
duringthepast50years,andthatadjustingformortalityreducesmeasuredoutput
volatilityinboththeUnitedStatesandinthegroupofdevelopedcountriesconsideredby
about30%.
3
Toillustratethequantitativemagnitudeofthevalueofmortalityinayear,consider
2010,whentherewereapproximately2.5milliondeathsintheUnitedStates.The
EnvironmentalProtectionAgencyandU.S.DepartmentofTransportationestimatesthe
valueofalifeatroughly$9million(in2010dollars)inrecentregulatoryimpactanalyses
(Viscusi2014,U.S.DepartmentofTransportation2013).Thisimpliesamortalitycostof
approximately$22.5trillionin2010.TheGDPoftheUnitedStatesthatyearwas
approximately$15.8trillion.Althoughthereisongoingdebateregardingwhetherthe
monetaryvalueoflifeforolderindividualsshouldbelargerorsmallerthanthatofyounger
individuals,themagnitudesoftheseback‐of‐the‐envelopecalculationssuggesttheyareof
firstorderimportance.
TheimportanceofhealthlostinayearrelativetoGDPcarriesoverwhenwelookat
changesindeviationsfromtrendwhichwehenceforthrefertoas“fluctuations.”1To
illustrateourmainresults,figure1comparestheseverityofthenineU.S.recessions
between1950and2010asmeasuredbybothGDPandourmortality‐adjustedGDP,which
asnotedtakesintoaccountdepreciationinhumancapital.2Wemeasurethemagnitudeof
eachrecessionasthepeaktotroughrelativetoGDP,asdatedbytheNationalBureauof
EconomicResearch(NBER2013).Eachbarrepresentsthedifferenceinactualoutputatthe
endofrecessionminustheimpliedtrendoutputlevelbetweentheyears1950to2010.In
everyrecessionotherthanin1962and2002,adjustingforthevalueofmortalitysuggests
thatthetotaloutputfluctuationsweremilderthanwhatisimpliedbyunadjustedGDP
becauseofthepositivecorrelationbetweenmortalityandtraditionalGDP.Aremarkable
resultisthatoffsetsinhealthwerelargeenoughtoessentiallyreverseonethirdofthese
recessions.Fromtheperspectiveoftotaleconomicoutput,includingfulldepreciation,
these“recessions”werenotassociatedwithadeclineintotaloutputafteradjustingfor
health. 1Ourpaperlooksatalldeviationsfromtrend,regardlessoftheirfrequency.Itisbeyondthescopeofthispaper(andourdata)tofurthersubdividethedeviationsinto,say,lowfrequencies,mediumfrequencies,seasonalfrequencies,etc.
2InadditiontocalculatingmortalityadjustedGDPwealsocalculatedmortalityadjustedNDP.WereplicatedtheproceedinganalysisusingbothGDPandNDPandfoundquantitativelysimilarresults.WereporttheresultsforGDPratherthanNDPtofacilitatecomparisonsacrosscountries.

NotesonF
Ealeis
WgrcoSe
Rgi
R
WesT
Asill
fluctuati
cyclicalit
Ourp
Nordhau
Figures1and3
achbarmeasuevel.ThediffersmeasuredinWecomputetrrowatsomecomputedusineefootnote11ecessionsareivenrecessionealGDPdatai
WecalculatethstimatesfromheVSLinothe
lustratedin
onslesssig
tyofunmea
paperrelate
us(2002),a
FIGURE1:
3:
uresthedifferrenceinoutpuconstantU.S.endGDPandmconstant,butpgtheaverage1forfurtherddatedaspertn,asmeasuredisfromtheU.S
hevalueofmomAldyandVisceryearsissca
Figure1,ou
gnificant.W
asuredcomp
estosevera
ndMurphy
RECESSION–
renceinactuautisnormalizedollars(2000mortalityadjupotentiallydiffGDPandvaludetails.theNBER.CondusingGDP,isS.BureauofE
ortalityintheycusi(2008)(Saledbytrendp
urmainfind
Webelieve,th
ponentsofn
alotherstra
andTopel(
–PEAKTOTR
loutputattheedbythetren0base).ustedGDPbyaferentrates.Tueofmortality
nsequently,itspositive(e.gconomicAnal
year2000usinSeesectionIVpercapitaGDP
dingisthat
herefore,th
nationalout
ndsofwork
(2006)have
ROUGH(%OF
eendofrecessndGDPlevelin
assumingbotTrendmortalitygrowthrates
ispossiblethag.,1955and19lysisandtheW
ngtheagespeofAldyandVPasdiscussed
incorporati
hatmoreres
tput.
k.Cutlerand
edocument
GDP)
sionminusthnthecorrespo
hGDPandthetyadjustedGDsovertheperi
atthepeakto962recessionWorldBank.
ecificvalueofViscusi2008fodinSection3.
inghealthm
searchiswa
dRichardso
tedthecent
etrendoutpuondingyear.O
evalueofmorDPandGDPariod1950to20
troughforans).
statisticallifeorfurtherdeta
makes
arrantedon
on(1997),
tralroleof
4
utOutput
rtalityre010.
ny
eails).
nthe

5
healthinoveralleconomicwell‐beinggainsintheUnitedStates.Beckeretal.(2005)have
examinedtheimpactofvaluinghealthforworldinequalityandeconomicconvergence.
JonesandKlenow(2010)haveexaminedtheimpactofincludingothernonmarket
measuresintointernationalcomparisonsofwelfare.Thisliteraturemaybeinterpretedas
addressingthevalueoftheoveralltrendsinhealthandothermeasures.Incontrast,our
researchrelatestothebehaviorofdeviationsfromtrendsovertimebyassessingthecyclical
natureofhealthandhowitrelatestostandardmeasurementsoffluctuations.
Thepaperisorganizedasfollows.Section2illustrateshowphysicaldepreciationis
handledinNDPmeasuresandoutlineshowhumancapitaldepreciationcanbehandledin
ananalogousmanner.Section3describeshowweconstructthemortalityadjustedGDP
series.Section4adjustsrecessionsintheUnitedStatesandabroadforhumancapital
depreciation,lookingathowpeak‐to‐troughchangesareaffected.Section5provides
estimatesforhowthecyclicalityoftheU.S.andinternationaloutputmeasuresarealtered
byincludingthedepreciationofhealth.Finally,Section6concludesbyoutliningresearch
issueswebelieveneedtobeaddressed.Theseincludemorecompletemeasuresofthe
cyclicalnatureofhumancapitalfluctuations,suchaschangesinfertility(entryversusexits
fromthehealthcapitalstock)andeducationalinvestments(appreciationversus
depreciationofthestock).Wearguethattheseunobservedcomponentsofhumancapital
arelikelytobecounter‐cyclical,therebyreinforcingthedocumentedcounter‐cyclicalvalue
ofhealthexaminedhere.
2. HumanandPhysicalCapitalDepreciationintheNationalAccounts
Partofmeasuringeconomicactivityoveraspecifictimeframe(hereafter,acalendar
year)involvesrecognizingthevalueofcapitalisdifferentattheendofthetimeframethan
itwasatthebeginning.Structureshavebeenbuiltordestroyed,waterhasbeenpollutedor
cleaned,etc.Formanypurposesitisdesirabletohavemeasuresofeconomicactivitythat
includethenetchangeinthecapitalstock.
For this reason, national accounts include estimates of physical investment: the
valueofadditionstothenation’sprivatephysicalcapitalstock.Intheexpenditureaccount,
physicalinvestmentissometimesmeasurednetofdepreciation,thatis,the“depreciation”

6
valueofthedestruction,aging,oreconomicobsolescenceofpre‐existingphysicalassetsis
subtractedfromthevalueofnewassetscreatedduringtheyear.3 Intheincomeaccount,
thesamedepreciation(asusedintheexpenditureaccount)isexcludedfromtheincomesof
the owners of domestic physical capital. Either way, the result is NDP, or Net (of
depreciation)DomesticProduct.
It isalsounderstoodthat therearevaluablehumanandenvironmentalassetsand
that, in principle, their accumulation and depreciation would be counted too (Hartwick
1990, Nordhaus and Kokkelenberg 1999, Jorgenson 2009). Human and environmental
capital data has traditionally been lacking, but economists are making progress, for
example, including environmental depreciation in their measures of economic activity
(Carson 1994). Ideally, national accounts would include the creation and destruction of
humanassetsinthesamewayasitincludesthecreationanddestructionofphysicalassets.
For the purpose ofmeasuringmacroeconomic fluctuations, thesemeasureswill only be
importantiftheyarecorrelatedwiththecyclebecauseiftheyarenot,traditionalmeasures
aresufficient inmeasuringdeviations.Thepurposeofourpaper is tomeasureeconomic
activity over time in a way that begins to include the depreciation of human capital by
estimatingtheamountofdeprecationandsubtractingitfromestimatesofnationalproduct
thataregrossofhumandepreciation.
The BEA’s idealmethod formeasuring depreciation – the loss in an asset’s value
solelyfromthepassageoftime–istoinferanage‐valueprofilefrompurchasepricedatain
awell‐functionresalemarketforusedassets(Fraumeni1997).Depreciationovertheyear
would then be inferred by moving each asset one year further down the profile. For
example, if two‐year old automobiles sell for 90 percent of the price of one‐year old
automobiles, then automobileswould be assumed to depreciate 10 percent during their
secondyear.
In practice, physical asset resale market data is imperfect for this purpose. The
assetssoldintheresalemarketarenotarandomsampleoftheassetsinexistencetheyear
3TheBEAdefinesdepreciationas“thedeclineinvalueduetowearandtear,obsolescence,accidentaldamage,andaging.”(Fraumeni,1997).

7
before. For example, some automobiles are totaled as the result of accidents, etc., and
therebyexcluded fromresalemarketsbut theirdestruction isnonethelessdepreciation.4
Whentheresaledataispoorenough,asitisforagreatmanyofthephysicalassetstracked
inthenationalaccounts,adepreciationscheduleisparameterizedandcalibratedforeach
typeofassetandthenassumedtoapplytoall investmentsofthattype(Fraumeni1997).
Geometric depreciation is commonly used for physical assets. Earlier versions of the
nationalaccountssometimesusedaone‐hoss‐shayschedulebasedondataonnormalasset
lifetimes:nodepreciationduringthenormalasset lifeandthen100percentdepreciation
whentheassetlifeisreached.
Wedon’thavearesalemarketinhumans,sowefollowtheparametricapproaches
that have been used to estimate physical depreciation. We take an approach which
calibrates a parametric age profile to recognize that the value lost at a person’s death
depends on the age of the personwho died (Murphy and Topel 2006; Aldy and Viscusi
2008). Specifically we use existing age specific value of statistical life (VSL) tables to
calculatethevalueofdepreciationinthehumancapitalstockresultingfromdeath.
3. ConstructingMortalityAdjustedGDPSeries
WedefinemortalityadjustedGDPasthevalueofGDPminusthevalueoflostlife
(mortality)overthecorrespondingperiod.Thevalueofmortalityreflectsthetotalvalueof
lifelostinthecorrespondingperiodduetodeath.Wecomputethevalueofmortalityasthe
sumofthenumberofdeathsintheperiodweightedbythecorrespondingVSL.
WeusetwoVSLmethodologiestocomputethevalueofmortality.Thefirstmethod
usestheVSLestimatesfromAldyandViscusi(2008)whouseaminimumdistance
estimatorinconjunctionwithhedonicwageregressionstoestimatetheVSLconditionalon
ages18‐62.5Weextrapolatetheirestimatesforthenon‐workingagepopulations.
4TheBEAusuallymeasuresexpectedor“normal”depreciationratherthanactualdepreciation.Forexample,automobiledepreciationinthenationalaccountsdoesnotreflecttheactualnumberofcarcrashesduringtheyearbutratheranormalrate.However,specialdisasterlosschargesareincludedinthenationalaccountswhenanaturalorman‐madedisaster’sdestructionexceeds0.1percentofGDP.
5SeesectionIVofAldyandViscusi2008forfurtherdetails.

8
FollowingViscusiandHersch(2008)wecalculatetheVSLforindividualsovertheageof63
bytreatingtheVSLasthepresentdiscountedvalueoffuturevalueofstatisticallifeyears
(VSLY).6Forindividualsundertheageof18,weassumeaconstantVSLof$3.43mm(which
correspondstotheestimatedVSLfor18yearolds).7ThesecondVSLmethodologyusesthe
ageandgenderspecificVSLprofilesfromMurphyandTopel(2006).MurphyandTopel
calibratesanage‐profilefortheVSLforalife‐cyclemodelwhichincorporatesmultiple
dimensionsofhealth.TheVSLprofileisthencalibratedusingconsumptionandincome
dataandscaledaccordingtoexistingEPAVSLestimates.
Figure2plotsourextrapolatedVSLprofilefromAldyandViscusi(2008)alongwith
theVSLprofilefromMurphyandTopel(2006).Bothage‐VSLprofilesfollowaninverseU
shape.TheMurphyandTopelage‐VSLprofileplacesahighervalueonyoungerindividuals
andlowervalueonelderlyindividualsthanthecorrespondingAldyandViscusiprofile.In
choosingbetweentheAldyandViscusiandMurphyandTopelestimateswefacethetrade‐
offofusinganextrapolatedage‐VSLprofileestimatedfromobserveddataversusa
completeage‐VSLprofileconstructedfromeconomictheory.Regardlessofwhichage‐VSL
profileweusetocomputemortalityadjustedGDP,theprimaryresultsremainthesame:
mortalityadjustmentdampenstheobservedfluctuationsandoverallvolatilityofmeasured
output.
BoththeAldyandViscusiandMurphyandTopelage‐VSLprofilesarecalibratedto
theyear2000.TocalculatethevalueoflifeinotheryearswesimplyscaletheVSLbythe
6ViscusiandHersch(2008)treatVSLasthediscountedconstantstreamoffutureVSLY.UsingtheVSLestimatesfromAldyandViscusi(2008)wecalculatetheVSLYatage as
where istheremaininglifeexpectancyinyearsatage (aspertheCDCNationalVitalStatisticsReportandtheSocialSecurityAdministration)and isthediscountrate(assumedtobe3%).WeconstructtheVSLforages63+usingtheimpliedVSLYfor62yearolds.
7Asarobustnesscheck,wereplicatetheproceedinganalysisbyassumingaVSLofzeroforindividuals0‐17andfindquantitativelysimilarresults.

9
trendGDPpercapitainthegivenyearrelativetothetrendGDPpercapitain20008.This
methodologyimplicitlyassumestheelasticityofVSLwithrespecttoincomeisone.While
thereissomedebateintheliteratureabouttheelasticityofVSLwithrespecttoincome,our
unitelasticassumptionisinlinewithpriorresearchandcurrentguidelines.Viscusiand
Aldy(2003)andDoucouliagoset.al(2014)estimateanelasticityofroughly0.5while
researchfromKneiseret.al(2010)andCostaandKahn(2004)estimatetheelasticityis
closerto1.5.WespecifyaVSLincomeelasticityofonewhichisinaccordancewithcurrent
guidelinessetbytheU.S.DepartmentofTransportation(2013)andtheestimatesfrom
Miller(2000).9
8TrendGDPiscalculatedusingtheHodrickPrescottFilterwithasmoothingparameterof6.5
9SeetheU.S.DepartmentofTransportationMemorandum(2013)forfurtherdiscussionregardingtheelasticityoftheVSLwithrespecttoincome.

NotesonF
Daginst$3
T
T
extensiv
andsex.
problem
lessthan
calculati
humand
humand
Figure2:
uetodataavages0‐17andgndividualsovetatisticallifey3.43mm(whichefigurerepo
Theproceed
vedataonec
Valuingad
matictothee
ntheaverag
nghumand
depreciation
deprecation
FIGURE
ailabilityissuegreaterthan6ertheageof6years(VSLY).Fchcorrespondortstheage‐VS
inganalysis
couldallow
deathatthe
extentthev
gevalueofa
depreciation
ninamann
conditiona
E2:VALUEOF
es,weextrapo63.FollowingV3bytreatingtForindividualdstotheestimSLprofilefor
siseasilyre
forheterog
correspond
valueoflifef
astatisticall
n.Duetoda
eranalogou
alonage.
FASTATISTIC
olatetheVSLeViscusiandHetheVSLasthelsundertheagmatedVSLformalesfromM
eplicatedwi
geneousval
dingaverage
foranindiv
life.Howeve
ataavailabil
ustophysica
CALLIFEBYA
estimatesfromersch(2008)wepresentdiscogeof18,weas18yearolds).
MurphyandTo
ithanyVSL
uesoflifeb
eVSLcondi
vidualatma
er,suchissu
ityandforp
alcapitalde
AGE
mAldyandViswecalculatetountedvalueossumeaconst.opel(2006).
profile.Wit
beyondcont
itionalonag
arginoflivin
uesarenot
purposesof
epreciation,
scusi(2008)fotheVSLforoffuturevaluetantVSLof
thmore
trollingfora
gecouldbe
nganddying
uniqueto
fcalculating
,wecalcula
10
or
eof
age
gis
g
ate

11
4. AdjustingIndividualRecessionsforChangesintheValueofHealth
Thissectionperformsananalysisofthedegreetowhichthecyclicalnatureofhealth
affectsthemeasurementofindividualrecessionsintheU.S.andinternationally.We
considerthepeak‐to‐troughofthemeasuredGDPlevelsandadjustthemforthevalueof
healthdestroyedintheserecessions.
Figures1and3indicatethepeaktotroughofthenineU.S.recessionsoccurring
overtheperiod1950‐2010.Wecalculatepeaktotroughasthedifferenceinactualoutput
attheendofrecessionminustheoutputlevelimpliedbythetrend.Thedifferencein
outputisnormalizedbytheimpliedtrendGDPlevelinthecorrespondingyear.We
computetrendGDPandmortalityadjustedGDPbyassumingbothGDPandthevalueof
mortalitygrowatsomeconstant,butpotentiallydifferentrates.10Figure1iscalculated
usingtheAldyandViscusi(2008)age‐VSLprofilewhilefigure3iscalculatedusingtheage
andgenderspecificVSLestimatesfromMurphyandTopel(2006).Underbothmeasures
mortalityadjustmentessentiallynegatesthe1955and1976U.S.“recessions”.Although
comparable,mortalityadjustmentappearstohaveaslightlybiggerimpactwhencalculated
usingtheAldyandViscusiage‐VSLprofilethanwhencalculatedusingtheMurphyand
TopelageandgenderspecificVSLprofile.ThisislikelyduetothefactthattheAldyand
Viscusiage‐VSLprofileputsahighervalueonindividualsovertheage35thantheMurphy
andTopelprofile.Duetothecomparabilityoftheresultsandforconvenience,the
remaininganalysisisconductedusingtheAldyandViscusiage‐VSLprofile.
10WecalculatepeaktotroughformortalityadjustedGDPas
where istheactuallevelofmortalityadjustedGDPattheendoftherecession(timet)and isthetrendlevelofmortalityadjustedGDP.TrendmortalityadjustedGDPiscomputedas
where and arethepre‐recessionlevelsofGDPandvalueofmortality, and aretheaverageGDPandvalueofmortalitygrowthratesovertheperiod1950‐2010,and isthelengthoftherecession.ThepeaktotroughcalculationsforunadjustedGDParecalculatedinananalogousmanner.

NotesonF
Eale
Tgr
Rre
Figures1and3
achbarmeasuevel.Thedifferrendmortalityrowthratesovecessionsareecession,asm
FIGURE1:
FIGURE3:
3:
uresthedifferrenceinoutpuyadjustedGDvertheperioddatedaspert
measuredusing
RECESSION–
RECESSION–
renceinactuautisnormalizeDPandGDPard1950to2010theNBER.CongGDP,tobep
–PEAKTOTR
–PEAKTOTR
loutputattheedbythetrenecomputedu0.Seefootnotnsequently,itositive(i.e.19
ROUGH(%OF
ROUGH(%OF
eendofrecessndGDPlevelinusingtheaverate11forfurthispossiblefor955and1962
GDP)
GDP)
sionminusthnthecorrespoageGDPandvherdetails.rthepeaktotrecessions).
etrendoutpuondingyear.valueofmorta
troughofany
12
ut
ality
given

13
Theimplicationsofmortalityadjustmentwhenmeasuringeconomicoutputarenot
uniquetotheUnitedStates.Wereplicatetheprecedingpeaktotroughanalysisforour
unbalancedsampleoftwenty‐oneotherdevelopedcountriescoveringtheperiod1960‐
2010.Recessionsacrosscountriesaredatedusinganalgorithmin‐linewithJorda,
Schularick,andTaylor(2011),Claessens,Kose,andTerrones(2011)andBryandBoschan
(1971)11.ThevalueofmortalityiscalculatedacrosscountriesbyscalingAldyandViscusi’s
(2008)VSLestimatesbytrendGDPpercapita12
Where isthevalueofastatisticallifeforanindividualatage ,time incountry
and isthevalueofastatisticallifeasperAldyandViscusi(2008).Asdiscussedin
Section3thismethodologyimpliesanincomeVSLelasticityofonewhichislinewiththe
across‐countryelasticityestimatesfromMiller(2000).
Althoughnotuniformly,figure4andtable1indicatethatthegeneralfinding,that
recessionsappearlessseverewhenadjustingformortality,seemstopersistacross
countries.Thefirstrowoftable1indicatesthatinAustraliaoutputfell,onaverage,by
2.90%belowtrendduringrecessionswhenmeasuredusingGDP.Whenmeasuredusing
mortality‐adjustedGDP,Australianoutput,onaverage,onlyfellby1.24%belowtrend
duringrecessions.Foruniformityandeaseofexpositionwecalculatethepeaktotroughof
eachrecessionineachcountryusingthesamemethodologyasdescribedabove.This
approachcomputestrendGDPandmortalityadjustedGDPundertheassumptionthatboth
mortalityandGDPgrowatconstantrateswithinagivencountry.Overall,wefindthat
adjustingformortalityreducesthedepthoftherecession,onaverage,byoverthree
absolutepercentagepointsofGDPandessentiallynegatedoneinfourrecessionsinour
sample.
11PeaksaredefinedastheyearprecedingayearoveryeardeclineinrealpercapitaGDPwiththeyear(s)proceedingthepeakdefinedasarecession.TheendoftherecessionismarkedbytheyearinwhichrealGDPpercapitaexceedstherealGDPpercapitalevelinthepeakyearpriortothestartoftherecession.
12TrendGDPiscalculatedusingtheHodrickPrescottFilterwithasmoothingparameterof6.5

NotesonF
Eaou
Tgr
Figure4:
achbarmeasuutputlevel.Threndmortalityrowthratesov
FIGURE4:
uresthedifferhedifferenceiyadjustedGDvertheperiod
RECESSION–
renceinactuainoutputisnoDPandGDPard1950to2010
–PEAKTOTR
loutputattheormalizedbytecomputedu0(seetable1
ROUGH(%OF
eendofrecessthetrendGDPusingtheaveranotesandfoo
GDP)
sionminusthPlevelinthecageGDPandvotnote11forf
eimpliedtrenorrespondingvalueofmortafurtherdetails
14
ndgyear.alitys).

15
TABLE1:AVERAGERECESSIONDEPTH(AVERAGEPEAKTOTROUGH,%OFGDP)
Country GDP Mortality‐adjustedGDP(AgeSpecificVSL)
Australia ‐2.90% ‐1.24%Austria ‐2.34% ‐1.37%Belgium ‐3.42% ‐2.21%Canada ‐4.93% ‐2.21%Denmark ‐1.40% ‐3.50%Finland ‐8.35% 2.63%France ‐3.40% ‐3.01%Hungary ‐5.65% 2.92%Iceland ‐6.21% ‐3.52%Ireland ‐2.90% ‐0.23%Israel ‐9.06% ‐6.04%Italy ‐3.47% ‐1.92%Japan ‐9.13% ‐4.83%
Luxembourg ‐9.99% ‐3.58%Netherlands ‐3.82% ‐2.89%NewZealand ‐1.09% 1.26%Norway ‐4.72% ‐2.37%Portugal ‐8.52% ‐0.41%Spain ‐7.38% ‐1.45%Sweden ‐5.67% 1.14%U.K. ‐6.74% ‐3.78%U.S. ‐3.41% ‐1.00%
NotesonTable1
Thepeaktotroughofeachrecessioniscalculatedasthedifferenceinactualoutputattheendofrecessionminusthetrendoutputlevel.ThedifferenceinoutputisnormalizedbythetrendGDPlevelinthecorrespondingyear.
TrendmortalityadjustedGDPandGDParecomputedusingtheaverageGDPandvalueofmortalitygrowthratesovertheperiod1950to2010.Seefootnote11forfurtherdetails.Duetoconcernsaboutcompoundingtrendestimationerror,recessionslastinggreaterthan10yearsaredroppedfromthedatasetwhencomputingtheaveragepeaktotrough.
Foreachcountrytable1displaystheaveragepeaktotroughacrossalldefinedrecessionsintherespectivecountry.
U.S.recessionsaredefinedaspertheNBER.Non‐U.S.recessionsaredefinedusingthealgorithmdescribedpreviously
DatafortheU.S.,Ireland,IsraelandNewZealandcoverstheperiods(1950‐2010),(1970‐2009),(1983‐2009),and(1977‐2008)respectively.DataforAustria,Denmark,France,IcelandandSwedencoverstheperiod(1960‐2010).Dataforallothercountriesisfrom1960‐2009.
Countrieswereselectedbasedontheavailability(atleast25continuousyears)ofmortalitydatafromMortality.organdpopulationandGDPdatafromtheWorldBank.

16
5. AdjustingtheCyclicalityofGDPMeasurementstoChangesinHealth
InthissectionweadjusttheU.S.andinternationalfluctuationstoincludethevalue
ofmortality.Wefirstextendtheexistingevidencerelatedtomortalityandemploymentin
theU.S.tothebusinesscycle,aswellasextendthatanalysisacrossagesandcountries.We
thenincorporatetheseestimatesintoadjustingthecyclicalityofstandardGDPfluctuations.
Ourmainfindingisthatadjustingformortalityreducesthemeasuredoutputvolatilityby
about30%intheU.S.andinternationally.
5.1. Mortalityandfluctuations
Ifunmeasuredcomponentssuchashealthremainedconstantovertime,calculating
mortality‐adjustedGDPwouldofferlittlevaluefromamacroeconomicpolicyperspective
intermsofanalyzingfluctuations.However,weextendpreviousworkbyshowingthatthe
valueofmortalityispro‐cyclical,exhibitingastrongpositivecorrelationwithGDP.
Previousliteratureidentifiesthenegativerelationshipbetweenmortalityandemployment.
Withouttakinganexplicitstanceonthecausalityoftherelationship,weextendtheir
results,showingthatthereisapositiverelationshipbetweenmortalityandGDPwhichmay
haveequallyorevenmoreimportantimplicationswhenmonetizedusingourmethods.
WeexaminetherelationshipbetweenmortalityandGDPfurtherbyregressinglog
mortalityonlogGDPasdisplayedintable2.Theestimatedrelationshipbetweenlog
mortalityandlogGDPispositiveandsignificantineachspecification.Whenweexamine
mortalitybyagegroup,theresultsindicatethatmortalityamongtheelderlymaypropel
thepositiverelationshipbetweentotalmortalityandoutput.Thisfindingisinaccordance
withtheearlierfindingsfromStevensetal.(2011),whichfindthatoverallpositive
relationshipbetweenunemploymentandmortalityisgeneratedbytheelderlypopulation.

17
TABLE2:REGRESSIONOFLOGMORTALITYONLOGGDP
AgeGroup (1) (2) (3) (4) All 0.4071*** 0.2670*** 0.2337*** 0.2135** (0.0772) (0.0825) (0.0859) (0.0894) 65+ 0.7567*** 0.3228*** 0.2911*** 0.2293** (0.1155) (0.1045) (0.1040) (0.1045) 25‐64 0.1006 0.1429 0.1495 0.1874* (0.1507) (0.0943) (0.0941) (0.0967) 0‐24 0.1942 0.2066 0.2004 0.1627 (0.1893) (0.1316) (0.1315) (0.1363) TimeTrend X X X AR(1)Correction X FirstDifferences X X
NotesonTable2:
Each age group coefficient is estimated in a separate regression with log age‐group mortality as thedependent variable.Reported coefficients are the coefficientson logGDP. “AR(1) correction” indicatesPrais‐WinstenAR(1)regressions.
One,twoandthreestarsindicatesignificanceat10,5and1percentlevels.
Thedatasetspans1950‐2010withannualobservations.

18
5.2 AdjustingU.S.macroeconomicfluctuationsforhealth
Atfirstglance,mortality‐adjustedGDPandGDPexhibitsimilarpatternsoverthe
pastfiftyyearsintheU.S.However,uponfurtherexamination,thereareseveraldistinct
differencesbetweentheGDPandmortality‐adjustedGDP.Wecompareandcontrast
mortalityunadjustedandadjustedGDPbyformallydecomposingthembothintotheir
trendanddeviationsfromtrend.
WedecomposelogGDPandthelogvalueofmortalityintoadditivetrendand
deviationfromtrendcomponentsusingbothalineartrendandtheHodrickPrescottFilter
tocalculatethecorrespondingtrends.GDP, ,andthevaluemortality(thenumberof
deathsmultipliedbythecorrespondingVSL), ,canbewrittenintermsoftheirtrendand
cyclicalcomponentssuchthat
where
Asdiscussedpreviously,mortalityadjustedGDP, ,isdefinedasGDPinagivenyear
minusthecorrespondingvalueofmortality
Wedefinethecyclicalcomponentofmortality‐adjustedGDPandGDP, and
respectively,asdeviationsfromtrend
Notethatwerefertothesetypeofdeviationsfromtrendas“fluctuations”inmortality‐
adjustedGDPandGDP.Assumingthatboth and followaloglineartrend,weregress
the and onatimetrendtorecoverthecyclicalandtrendcomponentsofboth

19
GDPaswellasvalueofmortality.13Wealsoestimatethecyclicalandtrendcomponentsof
GDPandmortalityusingtheHodrickPrescottfilter.
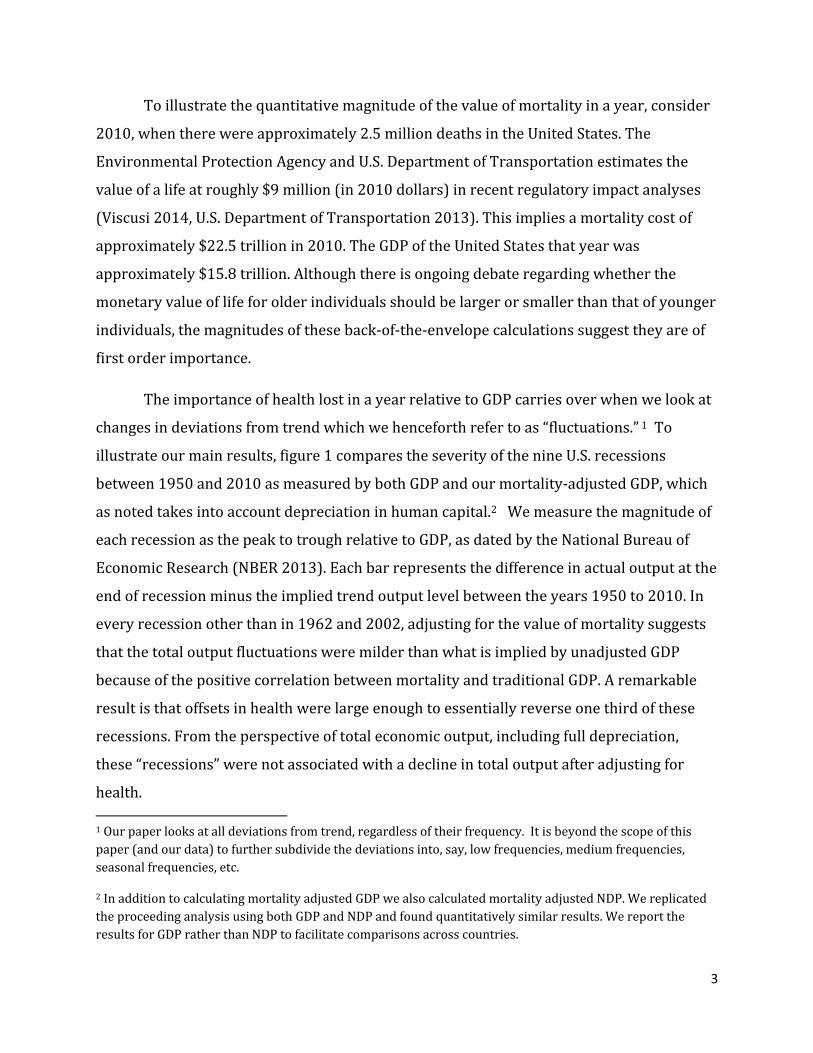
Figure5plotstheestimatedcyclicalcomponentsofGDPandNDPasafractionof
GDP,denoted and respectively.
Thoughthetwoseriesexhibitastrongpositivecorrelationoverthepastfiftyyears,the
cyclicalcomponentofGDPappearsmorevolatilethanthatofmortality‐adjustedGDP,
especiallypriorto1990.Statisticallyspeaking,themeasuredvolatilityofGDPisalmost1.5
timesthatofmortality‐adjustedGDP,4.42%relativeto3.12%.Table3summarizesthe
volatilityofGDPascalculatedusingthetwodecompositionmethods(loglineartrendand
theHodrickPrescottFilter).Notethatsincethetrendcomponent,ascalculatedasperthe
HodrickPrescottFilter,fluctuatesovertime,wecalculatethevolatilityofthetrend
componentaboutaloglineartrend.Underallthreemeasures,thevolatilityofoutput
decreaseswhenweadjustformortality.
13Formally,weassumethat and arenormallydistributedsuchthat
Thetrendandcyclicalcomponentsareestimatedfromtheregressionresultsas

20
TABLE3:VOLATILITYOFMEASUREDOUTPUT
Measure Std.Dev.of
theCycleStd.Dev.oftheCycle
Std.Dev.oftheTrend
GDP 4.42% 1.45% 4.07% Mortality‐adjustedGDP 3.12% 1.30% 2.63% LogLinearTrend X HodrickPrescottFilter X X
NotesonTable3:
The cyclical and trend components of GDP andmortality are estimated using a loglineartrendandtheHodrickPrescottFilter.
The standard deviation of the trend component expresses the standard deviation of the trend (ascalculatedusingtheHodrickPrescottFilter)aboutalineartimetrend.
Mortality‐adjustedGDPiscalculatedusingtheagespecificVSLestimatesfromAldyandViscusi(2008)describedinSection3.
Thedatasetspans1950‐2010withannualobservations
N
NotesonFigure5:
Thecyclicalan
Mortality‐adju
ndtrendcompone
ustedGDPiscalcu
FIGURE5:CYCL
entsofGDPandm
ulatedusingtheag
LICALCOMPONENT
mortalityareestim
gespecificVSLest
TSOFGDPANDM
matedusingalogli
timatesfromAldy
MORTALITY‐ADJU
ineartrend.
yandViscusi(2008
USTEDGDP
8)asdescribedinnSection3.
21

22
5.3 Adjustinginternationalfluctuationsforhealth
ThissectionextendsthepreviousanalysisfortheU.S.tothetwenty‐oneother
industrializedcountries.Ouranalysisconfirmspreviousfindingssuggestingthatthe
positiverelationshipmortalityandGDPextendsbeyondtheUnitedStatestoother
industrialcountriesthoughtherelationshipisfairlyheterogeneous.Ourresultssuggest
thattheimplicationsofadjustingfluctuationsformortalitymayactuallybemoreimportant
forotherpartsoftheindustrializedworldrelativetotheUnitedStates.
Previousresearchfocusedonthepro‐cyclicalityofmortalitybyexaminingthe
relationshipbetweenthemortalityandunemploymentratesacrosscountries.Usingpanel
datafrom21OECDcountries,GerdthamandRuhm(2006)findthatmortalityratesare
negativelycorrelatedwithunemploymentrates.Wefindqualitativelysimilarresultswhen
examiningtherelationshipbetweenmortalityandGDPoverallthoughwefindthereis
substantialheterogeneityacrosscountrieswhichreinforcestheneedformortality
adjustmentinnationalaccounts.
Usingourpaneloftwenty‐twocountriesovertheperiod1960‐2010,weregressthe
logofacountry’stotalmortalityonlogGDPwhilecontrollingforcountrytimeandfixed
effects.TheresultsoftheregressionsoflogmortalityonlogGDParedisplayedintable4.
AlthoughtheestimatedrelationshipbetweenlogmortalityandlogGDPispositiveinthree
specifications,andpositiveandsignificantintwoofthespecifications,thepooledcountry
elasticityestimatesaresubstantiallylowerthanthecorrespondingU.S.estimatesintable2.
WerunadditionalspecificationswhereweallowtheeffectoflogGDPonlogmortalityto
varyatthecountrylevelwhilestillusingcountryfixedandtrendeffects.Theestimated
mortality/GDPelasticityestimatesarepositiveandsignificantforoverhalfofthecountries
inthesample.However,therelationshipbetweenGDPandmortalityisheterogeneous
acrosscountrieswithestimatedelasticitiesrangingfrom‐0.30to0.80.

23
TABLE4:REGRESSIONOFLOGMORTALITYONLOGGDP
(1) (2) (3) (4) LogGDP 0.0910*** 0.0525** 0.0051 ‐0.0236 (0.0143) (0.0239) (0.0316) (0.0352) TimeTrend X X X AR(1)Correction X FirstDifferences X X
NotesonTable4:
Reportedcoefficientsarethecoefficientson logGDP.“AR(1)correction” indicatesPrais‐WinstenAR(1)regressions.
One,twoandthreestarsindicatesignificanceat10,5and1percentlevels.
All specifications include country specific dummy variables. When included, time trends are countryspecific
DatafortheIreland,IsraelandNewZealandcoverstheperiods(1950‐2010),(1970‐2009),(1983‐2009),and(1977‐2008)respectively.DataforAustria,Denmark,France,Iceland,SwedenandtheU.S.coverstheperiod(1960‐2010).Dataforallothercountriesisfrom1960‐2009.Observationsareannual.
Countrieswereselectedbasedontheavailability(at least25continuousyears)ofmortalitydata fromMortality.organdpopulationandGDPdatafromtheWorldBank.
FollowingSection5.2,weformallydecomposemortality‐adjustedGDPandGDPinto
theirtrendanddeviationfromtrendcomponentsforeachcountryinoursample.14Figures
6‐8summarizethevolatilityofGDPascalculatedusingthetwodecompositionmethods
(loglineartrendandtheHodrickPrescottFilter).Thegrayandblackbarsplotthestandard
deviationofthecyclicalcomponentofmortality‐adjustedGDPandGDPrespectivelyover
thepastfiftyyears.Sincethetrendcomponent,ascalculatedaspertheHodrickPrescott
Filter,fluctuatesovertime,wecalculatethevolatilityofthetrendcomponentaboutalog
14 Mortality‐adjusted GDP is calculated using the gender and age specific VSL estimates from Aldy and Viscusi
(2008) described in Section 3.

24
lineartrendinfigure8.Mortalityadjustmentreducesthemagnitudeofdeviationsfroma
loglineartrendfor17ofthe22countriesinthesample.However,whencalculatinga
businesscycleaspertheHodrickPrescottFilter,mortalityadjustmentreducesthe
varianceofthecyclicalcomponentofGDPforonlyfourofthecountriesinthesample.
Figures7and8indicatethatmortalityadjustmentappearstohaveabiggerimpactonthe
volatilityofthetrendcomponentofGDPrelativetothecyclicalcomponentofGDP.This
suggeststhatthelowfrequencyprocyclicalmovementsinmortalityarewhathelpsbuffer
thebusinesscycle.Theinternationalresultsindicatetheimportanceofunderstandingthe
effectmortalityandotherunmeasuredcomponentsofoutputhaveonfluctuationsextends
beyondtheU.S.

FIGURE
FIGUR
FIGURE6:V
E7:VOLATILI
RE8:VOLATIL
VOLATILITYOF
TYOFGDPV
LITYOFGDPV
FGDPVSMO
SMORTALITY
VSMORTALIT
RTALITY‐ADJU
Y‐ADJUSTEDG
TY‐ADJUSTED
USTEDGDP(
GDP(CYCLICA
GDP(TREND
(LOGLINEAR
ALCOMPONEN
DCOMPONENT
TREND)
NT–HPFILTE
T–HPFILTER
25
ER)
R)

26
6. ConcludingRemarks
WeexaminedthemacroeconomicfluctuationsintheUnitedStatesandglobally
duringthepast50yearstakingintoaccountthedepreciationofhealth(humancapital)in
GDPmeasures.Becausemortalitytendstobepro‐cyclical,fluctuationsinstandardGDPare
inpartoffsetbyhumandepreciation;boomsarenotasvaluablebecauseofgreater
mortality,andrecessionsarenotasbadbecauseoflowermortality.Consequently,the
fluctuationsintheUnitedStatesandelsewhereappearmilderthancommonlymeasured.
Wefoundthatmany“recessions”duringthepast50yearswerenotactuallyrecessions,
andthatadjustingformortality,onaverage,reducestheseverityofbothU.S.and
internationalrecessionsbymorethan2%ofGDPandreducesmeasuredfluctuations
aroundtrendby30%.
Ouranalysisraisesimportantissuesformorefullyincorporatinghumancapital
componentsintooutputmeasures.OurmeasureofmortalityadjustedGDPonlyaccounted
fordeaths,therebyimplicitlyonlyconsideringadiminishingratherthanapotentially
appreciatingstockofhumancapital.Furtheranalysisshouldconsiderreplenishmentsof
thestockintermsoffertilityandimmigration/emigration.Itshouldalsoconsider
appreciationthroughhumancapitalinvestmentssuchaseducation.Previousempirical
workremainsinconclusiveregardingthecyclicalityoffertilityratesgiventhattheydepend
oncounteractingincomeandsubstitutioneffectsinducedbythebusinesscycle(Butzand
Ward1979;Mocan1990;AhnandMira2002).Incorporatingbirthspresentsfurther
challengesasitisnotobvioushowtoincorporatethevalueofanewlife.Doesoneinclude
theparents’value,thechild’s,orboth?Similarchallengesexistinvaluingnetimmigration
inassessingthevalueofresidentaliensversuscitizens.DellasandSakellaris(2003)have
documentedthecounter‐cyclicalnatureofformalhumancapitalinvestments.Theseshould
beincorporatedintofluctuationsmeasuresasappreciationduringrecessionsandthusmay
offsettraditionalmeasures,justasourmortality‐basedanalysisdid.Nevertheless,weview
thiseffortastoospeculativeatthispointbothinmethodsanddataavailability,particularly
sovaluingnewbornsthroughpotentiallycyclicalfertility.Furthermore,onemaynotehere
thatourapproachisconsistentwithcurrentgovernmentpracticeinvaluinghumanlife,e.g.

27
inassessingEPAorFDApolicies,whichalsoonlyfocusesonthevalueoftheliveslostas
opposedtovaluingthosestillalive.
Futureanalysisshouldalsoconsiderthefulllifecycleofdepreciationinhuman
capital.Ouranalysisdepreciatedthehumancapitalstockonlyatdeath,asopposedto
depreciatingorappreciatingalifestillnotlost.Futureresearchshouldalsoinvestigate
whethergradualdepreciationinhumancapitalaffectsourresultsonhowfluctuationsin
mortalityandmarketGDParecorrelated.Foragivenage‐profileofthevalueofahuman
life,theanalogtodepreciationprofilesofphysicalassets,onemayenvisionvaluingthe
currenthumancapitalstockbasedontheagedistributioninthepopulation.Thiswillbe
contingentonmorbiditypatternsbyage.Cyclicalpatternsinmorbidity,forexamplecaused
bymentalhealthorheartdisease,mayamplifyfluctuationsandshouldalsobe
incorporated.
Ourmainargumentisthatthereareclearwaysofextendingtraditionalmeasuresof
fluctuationsandtheeffectsofpoliciesaimedatcurbingthem,beyondsimplycounting
markettransactions.Moreworkisneededtomakesuchextensionsoperational.
Ingeneral,theexistingevidenceonthecyclicalityofhumancapitalmaysuggestthat
unobservedcomponentsofvaluearealsoindeedcounter‐cyclical,inwhichcasethey
reinforceratherthancounteractthedocumentedcounter‐cyclicalvalueofhealthexamined
here.Examiningthecyclicalityofpreviouslyunmeasuredcomponentsdiffersfrom
previousresearchthathasfocusedonmissingcomponentsinthelevelofeconomicoutput.
However,whatmattersforassessingthevalueofpoliciestryingtomitigatefluctuationsis
nottheleveloftheunmeasuredcomponentsofoutput(suchasleisure,health,and
education,forexample),buttheircyclicality.Ifunmeasuredcomponentsdonotvarywith
themeasuredcomponents,themuchofthecostsoffluctuationsiscapturedbymeasured
GDP.Webelieve,therefore,thatmoreresearchiswarrantedonthequantitative
importanceoffluctuationsinunmeasuredcomponentsofnationaloutput.

28
References
Ahn,Namkee,andPedroMira.2002."ANoteontheChangingRelationshipbetween
FertilityandFemaleEmploymentRatesinDevelopedCountries."Journalof
PopulationEconomics15(4):667‐682.
Aldy,JosephE.,andW.KipViscusi.2008.“AdjustingtheValueofaStatisticalLifeforAge
andCohortEffects.”TheReviewofEconomicsandStatistics90(3):573‐581.
Becker,GaryS.,TomasJ.Philipson,andRodrigoR.Soares.2005.“TheQuantityandQuality
ofLifeandtheEvolutionofWorldInequality.”TheAmericanEconomicReview95(1):
277‐291.
Bry,Gerhard,andCharlotteBoschan.1971.“ProgrammedSelectionOfCyclicalTurning
Points.”CyclicalAnalysisofTimeSeries:SelectedProceduresandComputer
Programs:7‐63.
Butz,WilliamP.,andMichaelP.Ward.1979.“TheEmergenceofCountercyclicalUS
Fertility.”TheAmericanEconomicReview69(3):318‐328.
Carson,CarolS.,andJ.StevenLandefeld.1994.“IntegratedEconomicandEnvironmental
SatelliteAccounts.”SurveyofCurrentBusiness74(4):33‐49.
Claessens,Stijn,M.AyhanKose,andMarcoE.Terrones.2011.“FinancialCycles:What?
How?When?.“InternationalSeminaronMacroeconomics7(1):303‐344.
Costa,DoraL.,andMatthewE.Kahn.2004."ChangesintheValueofLife,1940–
1980."JournalofRiskandUncertainty29(2):159‐180.
Cutler,DavidM.,ElizabethRichardson,TheodoreE.Keeler,andDouglasStaiger.1997.
“MeasuringtheHealthoftheUSPopulation.”BrookingsPapersonEconomicActivity.
Microeconomics:217‐282.
Dellas,Harris,andPlutarchosSakellaris.2003.OntheCyclicalityofSchooling:Theoryand
Evidence.OxfordEconomicPapers55(1):148‐172.

29
Doucouliagos,Hristos,T.D.StanleyandW.KipViscus.2014.“PublicationSelectionandthe
IncomeElasticityoftheValueofaStatisticalLife.”JournalofHealthEconomics33:
67‐75.
Fraumeni,Barbara.1997.“TheMeasurementofDepreciationintheUSNationalIncome
andProductAccounts.”SurveyofCurrentBusiness–UnitedStatesDepartmentof
Commerce77:7‐23.
Gerdtham,Ulf‐G.,andChristopherJ.Ruhm.2006.“DeathsRiseinGoodEconomicTimes:
EvidencefromtheOECD.”Economics&HumanBiology4(3):298‐316.
Hartwick,JohnM.1990.“NaturalResources,NationalAccountingandEconomic
Depreciation.”JournalofPublicEconomics43(3):291‐304.
HumanMortalityDatabase.UniversityofCalifornia,Berkeley(USA),andMaxPlanck
InstituteforDemographicResearch(Germany).[www.mortality.org](accessedon
4/24/2013)
Jones,CharlesI.,andPeterJ.Klenow.2010.”BeyondGDP?WelfareAcrossCountriesand
Time.”NationalBureauofEconomicResearchWorkingPaperw16352.
Jordà,Òscar,MoritzSchularick,andAlanM.Taylor.2011.“FinancialCrises,CreditBooms,
andExternalImbalances:140YearsofLessons.”IMFEconomicReview59(2):340‐
378.
Jorgenson,DaleW.2009.“HumanCapitalandtheNationalAccounts.”Paperpresentedto
theChinaCenterforHumanCapitalandLaborMarketResearch,CentralUniversity
ofFinanceandEconomics.
Kniesner,ThomasJ.,W.KipViscusi,andJamesP.Ziliak.2010."PolicyRelevant
HeterogeneityintheValueofStatisticalLife:NewEvidencefromPanelData
QuantileRegressions."JournalofRiskandUncertainty40(1):15‐31.
Miller,TedR.2000"VariationsBetweenCountriesinValuesofStatisticalLife."Journalof
TransportEconomicsandPolicy34(2):169‐188.
30
Mocan,NaciH.1990.“BusinessCyclesandFertilityDynamicsintheUnitedStates.”Journal
ofPopulationEconomics3(2):125‐146.
Murphy,KevinM.,andRobertH.Topel.2006.“TheValueofHealthandLongevity.”Journal
ofPoliticalEconomy114(5):871‐904.
NationalBureauofEconomicResearch,"USBusinessCycleExpansionsandContractions,"
[www.nber.org/cycles.html](accessedMay5,2013)
Nordhaus,WilliamD.,andEdwardC.Kokkelenberg.1999.Nature'sNumbers:Expanding
theNationalEconomicAccountstoIncludetheEnvironment.NationalAcademies
Press.
Nordhaus,WilliamD.2002.“TheHealthofNations:theContributionofImprovedHealthto
LivingStandards.”NationalBureauofEconomicResearchWorkingPaperw8818.
Ravn,MortenO.,andHaraldUhlig.2002.“OnAdjustingtheHodrick‐PrescottFilterforthe
FrequencyofObservations.”ReviewofEconomicsandStatistics84(2):371‐376.
Ruhm,ChristopherJ.2000.“AreRecessionsGoodforYourHealth?”TheQuarterlyJournalof
Economics115(2):617‐650.
Stevens,AnnHuff,DouglasL.Miller,MarianneE.Page,andMateuszFilipski.2011.“The
BestofTimes,theWorstofTimes:UnderstandingPro‐cyclicalMortality.”National
BureauofEconomicResearchWorkingPaperw17657.
U.S.DepartmentofTransportation.2013.“GuidanceonTreatmentoftheEconomicValue
ofaStatisticalLifeinU.S.DepartmentofTransportationAnalyses.”Memorandumto
SecretarialOfficersModalAdministratorsfromPollyTrottenberg,underSecretary
forPolicy,andRobertS.Rivkin,GeneralCounsel,[http://www.dot.gov/office‐
policy/transportation‐policy/guidance‐treatment‐economic‐value‐statistical‐life]
(accessedJanuary16,2014).
U.S.BureauofEconomicAnalysis,“NationalEconomicAccounts,”
[www.bea.gov/national/index.htm#gdp](accessedMay6,2013)

31
Viscusi,W.Kip.2014“TheValueofIndividualandSocietalRiskstoLifeandHealth.”In:
MarkJ.MachinaandW.KipViscusi(eds),HandbookoftheEconomicsofRiskand
Uncertainty,vol.1.North‐Holland,Amsterdam.
Viscusi,W.Kip,andJosephE.Aldy.2003."TheValueofaStatisticalLife:ACriticalReview
ofMarketEstimatesThroughouttheWorld."Journalofriskanduncertainty27(1):5‐
76.
Viscusi,W.Kip,andJoniHersch.2008.“TheMortalityCosttoSmokers.”JournalofHealth
Economics27(4):943‐958.
TheWorldBank,“WorldDataBank.”[http://databank.worldbank.org/data/](accessed
May6,2013)


![Adjusting the Accounts - BrainMass1].pdf · Adjusting the Accounts Timing Issues • Time period assumption • Fiscal and calendar years •Accrual- vs. cash-basis accounting •Recognizing](https://img.dokumen.tips/doc/110x75/5e78957ef90772049d646d10/adjusting-the-accounts-brainmass-1pdf-adjusting-the-accounts-timing-issues.jpg)