Embed Size (px)
Citation preview

University of ZurichZurich Open Repository and Archive
Winterthurerstr. 190
CH-8057 Zurich
http://www.zora.uzh.ch
Year: 2008
Adjacency effect considerations and air/water constituentretrieval for Lake Constance
Odermatt, D; Kiselev, V; Heege, T; Kneubühler, M ; Itten, K I
Odermatt, D; Kiselev, V; Heege, T; Kneubühler, M; Itten, K I. Adjacency effect considerations and air/waterconstituent retrieval for Lake Constance. In: 2nd MERIS/AATSR workshop, Frascati, Italy, 22 September 2008 - 26September 2008.Postprint available at:http://www.zora.uzh.ch
Posted at the Zurich Open Repository and Archive, University of Zurich.http://www.zora.uzh.ch
Originally published at:2nd MERIS/AATSR workshop, Frascati, Italy, 22 September 2008 - 26 September 2008.

Adjacency effect considerations and air/water constituentretrieval for Lake Constance
Abstract
A physically based, simultaneous air/water constituent algorithm is used for automatic processing of 5MERIS level 1B FR datasets of Lake Constance. Its sensitivity to the adjacency correction tool ICOL istested, and compared to variations in the wavelength dependence of aerosols. Further comparisons aremade with MERIS NN algorithms for eutrophic lakes and case II waters. Reference data measuredduring the MERIS lakes field campaign in April 2007 is used, consisting of both direct concentrationand optical in situ measurements. AERONET data of the two closest stations are evaluated. A goodrepresentation of a pattern of extending suspended matter is found for adjacency corrected MIP outputsand MERIS NN products, while chlorophyll and gelbstoff are insufficient.
ADJACENCY EFFECT CONSIDERATIONS AND AIR/WATER CONSTITUENT RETRIEVAL FOR LAKE CONSTANCE
D. Odermatt(1), S. Kiselev(2), T. Heege(2), M. Kneubühler(1), K.I. Itten(1)
(1)Remote Sensing Laboratories (RSL), Dept. of Geography, University of Zurich, Winterthurerstr. 190, CH-8057 Zurich (Switzerland), Email: dodermat (nieke, kneub, itten)@geo.unizh.ch
(2) EOMAP GmbH & Co. KG, Sonderflughafen Oberpfaffenhofen, Geb. 319 D-82205 Gilching (Germany), Email: (kiselev, heege)@eomap.de
ABSTRACT
A physically based, simultaneous air/water constituent algorithm is used for automatic processing of 5 MERIS level 1B FR datasets of Lake Constance. Its sensitivity to the adjacency correction tool ICOL is tested, and compared to variations in the wavelength dependence of aerosols. Further comparisons are made with MERIS NN algorithms for eutrophic lakes and case II waters. Reference data measured during the MERIS lakes field campaign in April 2007 is used, consisting of both direct concentration and optical in situ measurements. AERONET data of the two closest stations are evaluated. A good representation of a pattern of extending suspended matter is found for adjacency corrected MIP outputs and MERIS NN products, while chlorophyll and gelbstoff are insufficient. 1. INTRODUCTION
Lake Constance is the second largest lake in Western Europe, situated north of the Alps, on the border of Austria, Germany and Switzerland, at 395 MASL. It was object of investigation in a MERIS L2 product validation campaign [1], but also in the development of physically based water constituent algorithms for Daedalus and MERIS L1 full resolution data [2, 3]. The common goal of these studies is the development of model-based processors, which can easily be adapted to other aquatic environments or sensors. The successive use of atmospheric correction and water constituent retrieval applied in the two projects mentioned requires an a priori assumption for backscattered NIR radiance, which is a source of errors in waters of high constituent variability. Coupling correction and retrieval in a repetitive process can correct this shortcoming [4], but increases processing time for data of high spectral or spatial resolution. We have therefore developed an algorithm for simultaneous retrieval of atmospheric and aquatic properties, which can be applied to any water colour data from air- or spaceborne imaging sensors. Atmospheric correction is crucial in remote sensing of inland waters. Even if the NIR backscattering from the water body is known, adjacency effects can cause inaccuracies in the estimation of aerosol optical thickness (AOT) in these wavelengths. 5S simulation outputs indicate a bias of about 0.15% reflectance at 865
nm for average atmospheric conditions in the center of a 20 km radius dark disk, which is surrounded by an infinite surface of 30% reflectance. This bias increases to 1.67 and 2.31% reflectance on the edge of the disk, at solar zenith angles of 30 and 60°, respectively [5]. We assume that such effects cause an increase in AOT at 550 nm between pelagic and shore in MERIS data of Lake Constance [6], whose main basin is approximately 10 by 30 km in size (Figure 1). However, the conversion of the AOT retrieved at NIR wavelengths to the AOT that masks water reflectance at visible wavelengths strongly depends on the spectral variation of AOT (i.e. the Angstrom coefficient). 2. DATA
2.1. Image data
5 MERIS level 1B full resolution datasets acquired within 7 days in April 2007 are investigated (Table 1). Smile correction, nearest neighbour geometric correction and extraction of Lake Constance subsets (Figure 1) is done by command line programs contained in ESA’s BEAM toolbox. All datasets were processed both as original L1B radiances and as adjacency corrected radiances by the ICOL BEAM plug in.
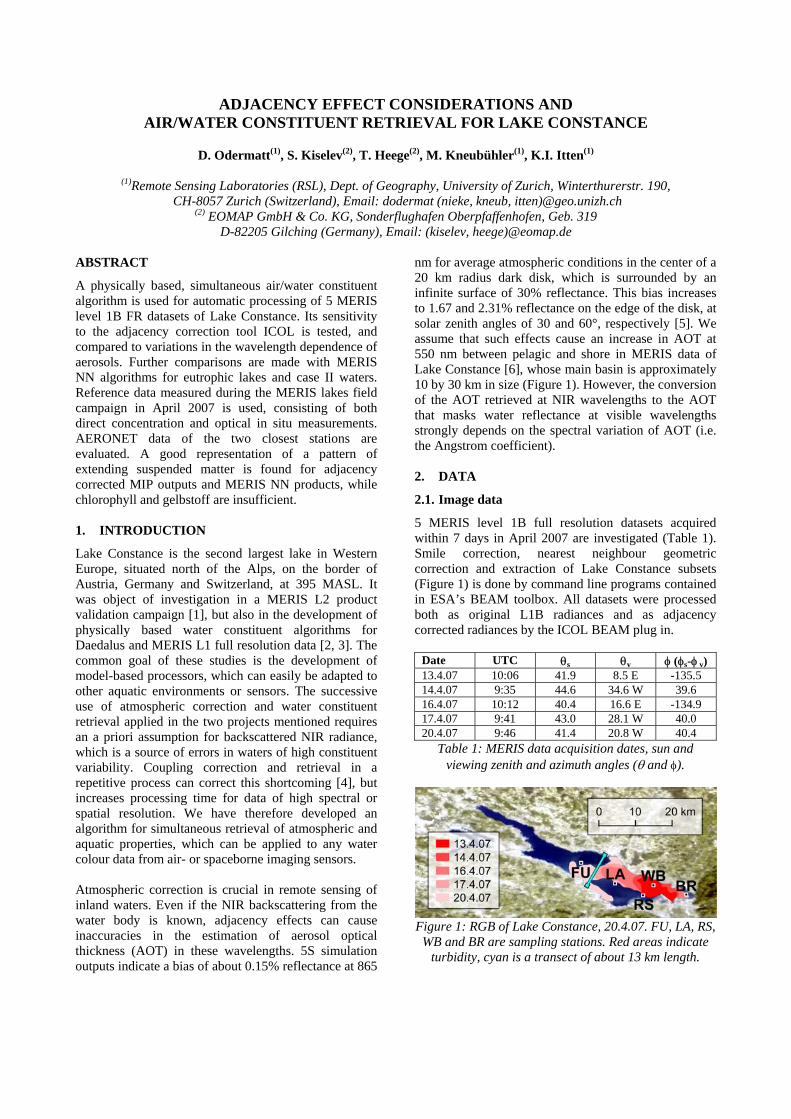
Date UTC θs θv φ (φs-φ v) 13.4.07 10:06 41.9 8.5 E -135.5 14.4.07 9:35 44.6 34.6 W 39.6 16.4.07 10:12 40.4 16.6 E -134.9 17.4.07 9:41 43.0 28.1 W 40.0 20.4.07 9:46 41.4 20.8 W 40.4
Table 1: MERIS data acquisition dates, sun and viewing zenith and azimuth angles (θ and φ).
Figure 1: RGB of Lake Constance, 20.4.07. FU, LA, RS,
WB and BR are sampling stations. Red areas indicate turbidity, cyan is a transect of about 13 km length.

Visual assessment of the images reveals a distinctively bright area of increased turbidity, surrounded by relatively clear water. It emanates from the estuary of River Rhine, the lake’s main feeder, on 13.4.07, and expands westwards along the northern shore during 3 days, before crossing the main basin and finally dispersing on the southern shore on 20.4.07 (Figure 1). 2.2. Water constituent reference data
Chlorophyll (chl) reference measurements were taken with a fluorometer probe. Total suspended matter (tsm) was measured as >1µm filtrate on 13. and 20.4.07, and with a multisonde on 16.4.07. Only inversion results from optical measurements are available as approximate gelbstoff (y) estimates.
Date Site UTC tsm [g/m3]
chl [mg/m3]
FU - - - LA 10:40 0.8 3.0 RS 9:45 1.7 2.4 WB 9:05 3.5 2.5
13.4.07
BR 8:10 0.8 2.8 FU 7:09 0.6 2.7 LA - - - RS 9:26 1.2 2.5 WB 9:50 2.8 2.5
16.4.07
BR 11:40 3.3 4.9 FU 8:20 0.6 0.8 LA 10:40 0.8 1.1 RS 9:45 0.9 1.1 WB 11:05 4.0 3.6
20.4.07
BR - - Table 2: Water constituent reference data collected in
the sites indicated in Figure 1, on 3 of the 5 MERIS image acquisition dates.
2.3. AERONET aerosol reference data
Lake Constance is surrounded by several stations of the Aerosol Robotic Network (AERONET) [7], a network of about 400 automatic sun/sky radiometers worldwide, coordinated by the NASA Goddard Space Flight Center. The station Laegeren (867 MASL) is closest at 80 km southwest of Lake Constance, but at a considerable elevation of 372 m above the lake surface. The station Munich University (533 MASL) is therefore also considered, although it’s located 175 km to the northeast. Angstrom coefficients and aerosol optical thickness (AOT) at 440 nm are measured within less than 10 minutes of MERIS acquisition time, AOT at 550 nm is then calculated by Equation 1 for comparison with the AOT output by the processing algorithm. (1) Where τ550 is AOT at 550 nm and α440-675 is the Angstrom coefficient between 440 and 675 nm.
Laegeren Munich University Date τ550 α440-675 τ550 α440-67513.4.07 0.18 0.83 0.15 1.14 14.4.07 0.10 1.35 0.10 1.37 16.4.07 0.06 1.34 0.06 1.08 17.4.07 0.07 1.40 0.12 1.37 20.4.07 0.14 1.32 0.41 1.06
Table 3: Aerosol reference data from AERONET measurements on the 5 MERIS image acquisition dates.
3. METHODS
3.1. Air/water constituent retrieval
EOMAP’s Modular Inversion and Processing System (MIP, [2]) is expanded by a new module for simultaneous retrieval of AOT and water constituent concentrations, performed by (2) where Ls
(0) is the measured radiance in the i-th channel, Nch is the number of channels, τ is the atmospheric optical width, wi is the user defined weight of the i-th channel, Ls[τ,
v c (τ)] is the modelled radiance at sensor level,
v (τ) is the vector of water constituent concentrations (chl, tsm, y) retrieved from remote sensing data at fixed value of τ. This vector is calculated by minimizing Equation 3.
c
(3) where ˜ R i(Ls
(0),τ) is the underwater irradiance reflectance, provided for the given τ at the sensor level radiant intensity Ls
(0) at sensor level, Ri( v c ) is the
subsurface irradiance reflectance, calculated for the species concentrations cv [8] according to (4) where aj
* and bj* are specific absorption and
backscattering coefficients of water constituents, aw and bw are absorption and backscattering coefficients of water, and f is an angularly dependent sun position parameter. The second additive in Equation 3 accounts for the regularisation of the problem, i.e. for the increase of its stability in case the minimum of the first additive is not clearly expressed. cj
(0) are initial concentrations of water constituents, which are characteristic for the considered region, γj regulates the weighting of the regularisation, which has to be low enough not to significantly
min min { }τ
G τ( )=τ
wi Ls(0) − Ls τ, r c τ( )[ ]
2
i=1
Nch
∑
τ550 = exp[ln(τ440 ln( 440)− 550− )α]
= =
−+−=chN
i jjjjisii cccRLRwc
1
3
1
2)0(2)0( ,~~min, γττ rrrr
r c ( )=
c jb j*
=1
3
∑ + bw
c ja j* + c jb j
*
j=1
3
∑ + aw + bwj=1
3
∑
( ) ( ) ( ){ } ( )∑ ∑ccHmin
R f j

influence the position of the minimum of the functional as a whole when the first additive has a sharp minimum. For comparison with the outputs of this new algorithm, we use BEAM’s Neural Network based plug-ins for atmospheric correction and eutrophic lakes [9, 10], hence addressed as MERIS EUT. The eutrophic lakes plug-in is used instead of the case II regional plug-in, because it’s y absorption outputs are quite constant around 0.1 m- at 443 nm. This supports the comparability with MIP results, where y is set to a constant 0.15 m- at 443 nm, as an approximation due to the critical separability of y and chl [6]. The case II regional NN outputs significantly lower y absorption, which are more variable and partly correlated with chl and tsm [11], and thus contrary to the inversion results for the optical in situ data [3]. Subsequent processing of ICOL and MERIS EUT plug-ins caused BEAM program errors; therefore MERIS EUT results are only available for original L1B data. 3.2. Adjacency effect considerations
Adjacent land surfaces are generally brighter than inland waters, especially in the NIR region. When land reflected radiance is atmospherically scattered into the IFOV of a sensor that is pointing at a water surface, this so-called adjacency effect will lead to an increase in at-sensor radiance. A detailed study [5] of adjacency effects was carried out for 5S [12] code, in which the total surface contribution in nadir view of a uniform disc of radius R, reflectance ρt, and a uniform, infinite environment of reflectance ρe, is calculated as (5) ρt
* = where T is the total transmittance, µs and µv are the cosines of the sun angle θs and the viewing angle θv, respectively, s is the spherical albedo of the atmosphere, δ is the total optical thickness, td the diffuse transmittance and ⟨ρ⟩ an averaged reflectance calculated as (6) with F(R) being an environment function decoupled for Rayleigh and aerosol scattering, and analytically formulated as (7) With a = 0.93; b = 0.07; α = 0.08; β = 1.1 for molecules and a = 0.375; b = 0.625; α = 0.02 β = 1.83 for continental aerosols. Modifications were applied to calculate the total surface contribution for non-nadir views and spatially heterogeneous surfaces. The study reveals that the decisive criterion for the individual
occurrence of adjacency effects is the aerosol’s vertical distribution, which is hardly available. For practial purposes, their derived correction method is based on single scattering approximation, with a concentrated, isotropic layer for molecular scattering. It includes the optional correction of aerosol scattering in a standard atmosphere, and neglects Fresnel reflection. This ICOL adjacency effect correction algorithm is implemented in BEAM 4.2 [13], where both Rayleigh and aerosol correction are applied, and the difference between contaminated and not contaminated signal is calculated as (8)
T(θ
where ρG is ground reflectance, and together with T, td and s output by the MERIS atmospheric correction over land [14], and ⟨ρ⟩ is calculated by the 5S implementation for Equation 6 [13]. The proportion of AOT retrieved from NIR channels and AOT estimates at visible wavelengths used for atmospheric correction is strongly affected by the correction of adjacency effects. However, this proportion is also depending on the wavelength dependence of AOT in the applied aerosol model. In order to compare the effects of these two parameters, a method to modify the wavelength dependence of τ in the simultaneous AOT and water constituent retrieval is introduced in Equation 2, as (9) where n is a modification parameter that determines the spectral variation of τ similar to an Angstrom coefficient. 4. RESULTS
The relative difference between original and ICOL-corrected radiances in channels 5, 7 and 13 of the 5 georeferenced datasets is shown in to Figure 4, with respect to the transect position in Figure 1. Large variations between the acquisition dates are due to atmospheric and geometric differences. The transects of 070413 and 070414 represent relatively clear, homogeneous water of low reflectivity. 070417 and 070420, and to a smaller extent 070416, show the advance of turbid waters in the pelagic, as indicated by the red shading in Figure 1. This increase appears only in channels 5 and 7, which validates the assumption of channel 13 (865 nm) water reflectance ρw = 0 [5]. In channel 5, radiance values increase for the turbid areas (pixel 10 to 20) after ICOL processing. Increasing radiances are also found in channels 1-4, more frequent for shorter wavelengths, while radiances are generally
T(µs)1− ρ s
ρ δ / µ + ρte− v t (µ )( d v )
ρ = ρ tF R +( ) ρe − F(1 (R))
−F ( = a eR) αR + b e−βR
τ * = τ λi
550⎛ ⎜
⎞ ⎟
⎝ ⎠
n
∆ρ = s)td (θv )1− ρ s
ρ − ρ( G)*
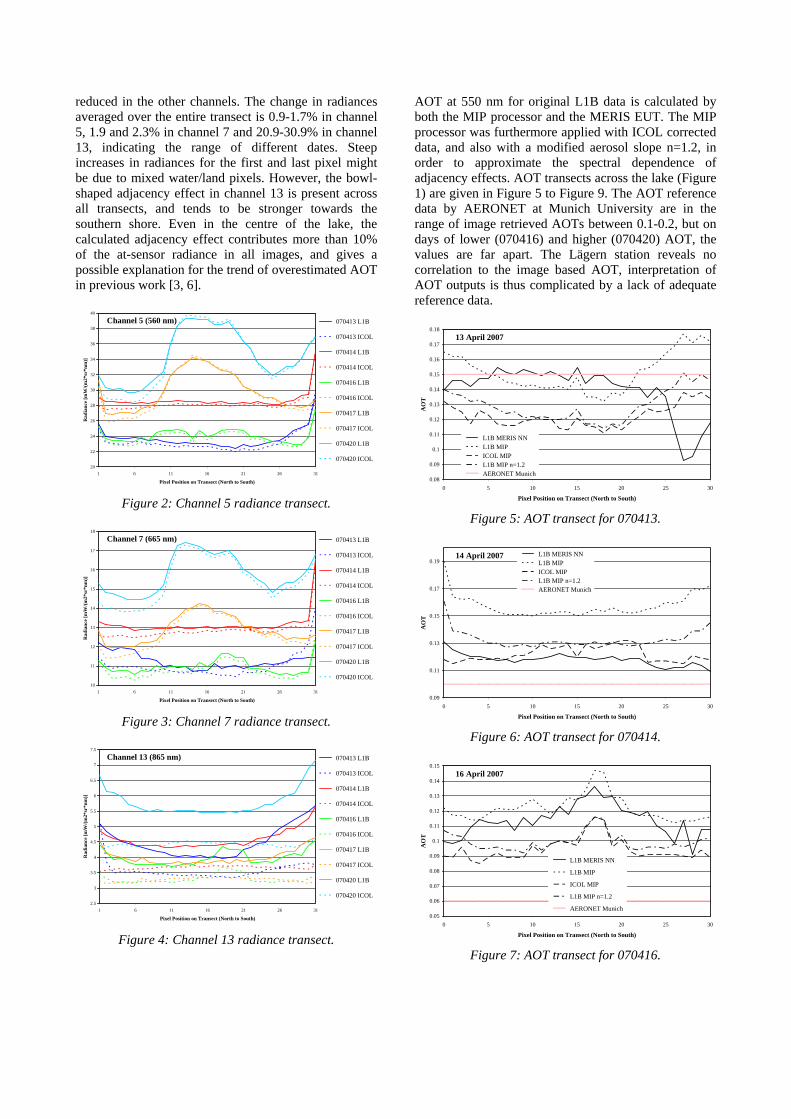
reduced in the other channels. The change in radiances averaged over the entire transect is 0.9-1.7% in channel 5, 1.9 and 2.3% in channel 7 and 20.9-30.9% in channel 13, indicating the range of different dates. Steep increases in radiances for the first and last pixel might be due to mixed water/land pixels. However, the bowl-shaped adjacency effect in channel 13 is present across all transects, and tends to be stronger towards the southern shore. Even in the centre of the lake, the calculated adjacency effect contributes more than 10% of the at-sensor radiance in all images, and gives a possible explanation for the trend of overestimated AOT in previous work [3, 6].
Channel 5 (560 nm)
20
22
24
26
28
30
32
34
36
38
40
1 6 11 16 21 26 31
Pixel Position on Transect (North to South)
Rad
ianc
e [m
W/(m
2*sr
*nm
)]
070413 L1B
070413 ICOL
070414 L1B
070414 ICOL
070416 L1B
070416 ICOL
070417 L1B
070417 ICOL
070420 L1B
070420 ICOL
Figure 2: Channel 5 radiance transect.
Channel 7 (665 nm)
10
11
12
13
14
15
16
17
18
1 6 11 16 21 26 31
Pixel Position on Transect (North to South)
Rad
ianc
e [m
W/(m
2*sr
*nm
)]
070413 L1B
070413 ICOL
070414 L1B
070414 ICOL
070416 L1B
070416 ICOL
070417 L1B
070417 ICOL
070420 L1B
070420 ICOL
Figure 3: Channel 7 radiance transect.
Channel 13 (865 nm)
2.5
3
3.5
4
4.5
5
5.5
6
6.5
7
7.5
1 6 11 16 21 26 31
Pixel Position on Transect (North to South)
Rad
ianc
e [m
W/(m
2*sr
*nm
)]
070413 L1B
070413 ICOL
070414 L1B
070414 ICOL
070416 L1B
070416 ICOL
070417 L1B
070417 ICOL
070420 L1B
070420 ICOL
Figure 4: Channel 13 radiance transect.
AOT at 550 nm for original L1B data is calculated by both the MIP processor and the MERIS EUT. The MIP processor was furthermore applied with ICOL corrected data, and also with a modified aerosol slope n=1.2, in order to approximate the spectral dependence of adjacency effects. AOT transects across the lake (Figure 1) are given in Figure 5 to Figure 9. The AOT reference data by AERONET at Munich University are in the range of image retrieved AOTs between 0.1-0.2, but on days of lower (070416) and higher (070420) AOT, the values are far apart. The Lägern station reveals no correlation to the image based AOT, interpretation of AOT outputs is thus complicated by a lack of adequate reference data.
13 April 2007
0.08
0.09
0.1
0.11
0.12
0.13
0.14
0.15
0.16
0.17
0.18
0 5 10 15 20 25 30
Pixel Position on Transect (North to South)
AO
T
L1B MERIS NN L1B MIP ICOL MIP L1B MIP n=1.2 AERONET Munich
Figure 5: AOT transect for 070413.
14 April 2007
0.09
0.11
0.13
0.15
0.17
0.19
0 5 10 15 20 25 30
Pixel Position on Transect (North to South)
AO
T
L1B MERIS NN L1B MIP ICOL MIP L1B MIP n=1.2 AERONET Munich
Figure 6: AOT transect for 070414.
16 April 2007
0.05
0.06
0.07
0.08
0.09
0.1
0.11
0.12
0.13
0.14
0.15
0 5 10 15 20 25 30
Pixel Position on Transect (North to South)
AO
T
L1B MERIS NN
L1B MIP
ICOL MIP
L1B MIP n=1.2
AERONET Munich
Figure 7: AOT transect for 070416.

17 April 2007
0.09
0.1
0.11
0.12
0.13
0.14
0.15
0.16
0.17
0.18
0.19
0 5 10 15 20 25 30
Pixel Position on Transect (North to South)
AO
T
L1B MERIS NN L1B MIP ICOL MIP L1B MIP n=1.2 AERONET Munich
Figure 8: AOT transect for 070417.
20 April 2007
0.18
0.2
0.22
0.24
0.26
0.28
0.3
0.32
0.34
0.36
0 5 10 15 20 25 30
Pixel Position on Transect (North to South)
AO
T
L1B MERIS NN L1B MIP ICOL MIP L1B MIP n=1.2 AERONET Munich 0.41
Figure 9: AOT transect for 070420.
The bowl shape visible in channel 13 (Figure 4) is clearly visible in most of the MIP outputs of AOT calculated from uncorrected L1B data, while it is less apparent in the ICOL corrected output. The MIP output for aerosol slope modification n=1.2 approaches the ICOL output in the lake’s centre, but has the same littoral increase of AOT as without aerosol slope modification. The AOT calculations by the MERIS EUT and L1B data are not affected by this phenomenon, as it generally reveals the least variable AOT across the lake. However, a closer investigation of the spatial significance of the strong decrease of AOT over the southern shore on 13 April 2007 reveals a larger trend resembling adjacency effects (Figure 10), which does however not occur in the other MERIS EUT results.
Figure 10: AOT of 070413, with NN-based atmospheric
correction [10], corresponding to Figure 5. The 070416 AOTs in Figure 7 are exceptional, as all processing setups output highest AOT in the lakes
centre, thus creating a bell rather than a bowl shape. This could be due to the arrival of relatively turbid waters from the eastern basin, as indicated by the total suspended matter maps of all processing setups (Figure 11 to Figure 14), and at the same time the very clear atmosphere on that day. In this transect, AOT variations for MERIS EUT output is significantly higher than for MIP outputs, which could be an indication that the simultaneous atmosphere/water retrieval algorithm in MIP is less sensitive to changes in water reflected radiance in the AOT estimation.
Figure 11: tsm map for 16 April 2007, calculated with
the BEAM eutrophic lakes plug-in.
Figure 12: tsm map for 16 April 2007, calculated with
MIP and ICOL corrected data.
Figure 13: tsm map for 16 April 2007, calculated with
aerosol slope modified MIP (n=1.2).
Figure 14: tsm map for 16 April 2007, calculated with
unmodified MIP and uncorrected data.

Tsm maps in Figure 11 to Figure 14 show very similar patterns, but large absolute differences between MERIS EUT and the MIP outputs. The MERIS EUT output tends to overestimate the ground truth in Table 2, while MIP outputs underestimate it. As far as chl is concerned, patterns as well as absolute concentrations in MERIS EUT and ICOL corrected MIP outputs are similar, shown exemplary for 16 April 2007 (Figure 15 and Figure 16). The aerosol modified MIP product (Figure 17) still displays similar patterns, while the uncorrected MIP L1B product contains large artefacts, especially in the narrow western basins of the lake (Figure 18).
Figure 15: chl map for 16 April 2007, calculated with
the BEAM eutrophic lakes plug-in.
Figure 16: chl map for 16 April 2007, calculated with
MIP and ICOL corrected data
Figure 17: chl map for 16 April 2007, calculated with
aerosol slope modified MIP (n=1.2).
Figure 18: chl map for 16 April 2007, calculated with
unmodified MIP and uncorrected data.
The ground truth of 12 chl and tsm concentration values from in situ measurements listed in Table 2 is compared with the concentration values calculated by outputs in accordant pixels by 5 processing setups. The correlation coefficients by MERIS C2R were not achieved for chl and tsm (Table 4). However, the y absorption is strongly underestimated by C2R [11]. The more appropriate y retrieval in the MERIS EUT might thus be related to a reduction in its chl correlation. The correlation coefficients are slightly higher for ICOL corrected MIP, however only tsm results of ICOL MIP and the two MERIS NN algorithms correlate significantly.
chl tsm MERIS C2R [11] 0.70 0.85 MERIS EUT 0.27 0.80 ICOL MIP 0.57 0.84 L1B MIP n=1.2 0.18 0.78 L1B MIP 0.32 0.78 Table 4: Correlation coefficients for the 4 processing
setups tested in this study and the C2R NN, with the chl and tsm reference data in Table 2.
A comparison of in situ measured subsurface irradiance reflectance spectra and MIP calculated reflectances displays large, constant offsets in channels 2-8. Again, this occurs on 070413 as well as on 070420, and in all sites shown in Figure 1, and is exemplary shown for the pelagic site LA (Figure 19) and the littoral site RS (Figure 20) with clear water, and the littoral site WB (Figure 21) with turbid water. The RS and WB reflectances calculated from uncorrected L1B data are lower than those from ICOL, due to overestimated AOT near the shore, whereas the n=1.2 result in the pelagic LA is comparable to the MIP ICOL output. Additional application of an aerosol slope modification n=2.0 to the ICOL data does still not sufficiently increase the reflectances, instead, the spectral shape, which is very similar between L1B and RAMSES, tiles towards higher blue and lower red wavelength reflectances. This points at atmospheric correction related shortcomings of MIP, which are not related to adjacency effects.
13 April 2007, LA
-0.03
-0.02
-0.01
0
0.01
0.02
0.03
0.04
412 443 490 510 560 620 665 681
Wavelength of MERIS channels 1-8 [nm]
Subs
urfa
ce Ir
radi
ance
Ref
lect
ance
RAMSES ICOL MIP n=2.0 ICOL MIP L1B MIP n=1.2 L1B MIP
Figure 19: Image calculated and in situ reference
reflectances on 070413, in the site LA.

13 April 2007, RS
-0.04
-0.02
0
0.02
0.04
0.06
0.08
412 443 490 510 560 620 665 681
Wavelength of MERIS channels 1-8 [nm]
Subs
urfa
ce Ir
radi
ance
Ref
lect
ance
RAMSES ICOL MIP n=2.0 ICOL MIP L1B MIP n=1.2 L1B MIP
Figure 20: Image calculated and in situ reference
reflectances on 070413, in the site RS.
13 April 2007, WB
-0.05
0
0.05
0.1
0.15
0.2
412 443 490 510 560 620 665 681
Wavelength of MERIS channels 1-8 [nm]
Subs
urfa
ce Ir
radi
ance
Ref
lect
ance
RAMSES ICOL MIP n=2.0 ICOL MIP L1B MIP n=1.2 L1B MIP
Figure 21: Image calculated and in situ reference
reflectances on 070413, in the site WB. 5. CONCLUSIONS
The strong modifications of the ICOL adjacency correction especially to NIR radiances lead to improved outputs from the simultaneous air/water constituent retrieval module from MIP. This is concerning the variations of AOT with distance from the shore, as well as the general level of AOT. However, the large offsets of retrieved to measured subsurface irradiance reflectance indicate that the tested version of the MIP module does not produce reliable outputs yet and needs improvements. The presented variations to the aerosol optical properties’ spectral slope show that it can’t account for these improvements, since it warps the spectral shape towards short wavelengths, and hardly reaches the required irradiance reflectance level. The MERIS NN retrieved AOT is on a similar level as the ICOL corrected MIP AOT, and doesn’t display any systematic variations towards the shore, apart from 070413 (Figure 10). This confirms earlier findings, that MERIS NN, in this case C2R, perform better without ICOL correction [11]. AERONET data from München and Lägern stations don’t represent the same temporal variety represented in the image retrieved AOT and are thus hardly applicable as reference for Lake Constance.
Regarding water constituent retrieval, relatively good results were output by all processes, clearly confirming the expanding pattern of increased turbidity seen in image RGBs (Figure 1). The output by ICOL MERIS slightly underestimates reference concentrations, while MERIS NN overestimates areas of high reference concentrations (>2 g/m3). The difference between the two is thus high in absolute but low in relative values. The chl estimation by MERIS C2R is unachieved, but its inconsistent y absorption estimation and the spatial correlation of different constituents [11] may make the chl retrieval vulnerable to y variations. We therefore evaluated MERIS EUT, which yields rather constant ay(442 nm)=0.1 m-1 and is well comparable to the assumption ay(442 nm)=0.15 m-1 used for MIP parameterization. Both MERIS EUT and ICOL MIP correlate only weakly with the reference chl. However, the chl variation is relatively low on the dates considered, and more extensive reference data as by the operational water quality monitoring program may be more appropriate for further investigation [3]. 6. REFERENCES 1. Gege, P. & Plattner, S. (2004). MERIS validation
activities at Lake Constance in 2003. Proc. MERIS User Workshop, Frascati (Italy), 10-13 November 2003.
2. Heege, T. & Fischer, J. (2004). Mapping of water constituents in Lake Constance using multispectral airborne scanner data and a physically based processing scheme. Can. J. Remote Sensing, Vol. 30, No. 1, pp. 77-86.
3. Odermatt, D., Heege, T., Nieke, J., Kneubühler, M., & Itten, K. (2008). Water quality monitoring for Lake Constance with a physically based algorithm for MERIS data. Sensors, Special Issue on Ocean Remote Sensing, Vol. 8, No. 8, pp. 4582-4599.
4. Miksa, S., Haese, C. & Heege, T. (2006). Time series of water constituents and primary production in Lake Constance using satellite data and a physically based modular inversion and processing system. Proc. Ocean Optics Conf. XVIII, Oct.9-13, 10 p.
5. Santer, R. & Schmechtig, C. (2000). Adjacency effects on water surfaces: Primary scattering approximation and sensitivity study. Appl. Opt., Vol. 39, No. 3, pp. 361-375.
6. Odermatt, D., Heege, T., Nieke, J., Kneubühler, M. & Itten, K. I. (2007). Parameterisation of an automized processing chain for MERIS data of Swiss lakes, at the example of Lake Constance. Proc. Envisat Symposium, Apr. 23-27, 6 p.
7. Holben, B. N., Eck, T. F., Slutsker, I., Tanre, D., Buis, J. P., Setzer, A., Vermote, E., Reagan, J. A., Kaufman, Y., Nakajima, T., Lavenu, F., Jankowiak, I. & Smirnov, A. (1998). AERONET – A federated instrument network and data archive for aerosol characterization. Remote Sens. Environ., Vol. 66, No. 1, pp. 1-16.

8. Gordon, H. R., Brown, O. B., & Jacobs, M. M. (1975). Computed relationships between the inherent and apparent optical properties of a flat homogenous ocean. Appl. Opt., Vol. 14, No. 2, pp. 417-427.
9. Doerffer, R. & Schiller, H. (2008): MERIS lake water algorithm for BEAM ATBD. GKSS Research Center, Version 1.0 June 2008, 17 p.
10. Doerffer, R. & Schiller, H. (2008): MERIS regional coastal and lake case 2 water project – atmospheric correction ATBD. GKSS Research Center, Version 1.0 May 2008, 42 p.
11. Koponen, S., Ruiz-Verdu, A., Heege, T., Heblinski, J., Sorensen, K., Kallio, K., Pyhälahti, T., Doerffer, R., Brockmann, C. & Peters, M. (2008): Development of MERIS lake water algorithms. Validation Report, Version 1.0, 65 p.
12. Tanré, D., Deroo, C., Duhaut, P., Herman, M., Morcrette, J. J., Perbos, J. & Deschamps, P. Y. (1990). Description of a computer code to simulate the satellite signal in the solar spectrum: 5S code, Int. J. Rem. Sen., Vol. 11, No. 4, pp. 659-668.
13. Santer, R. & Schmechtig, C. (2000). Algorithm theoretical basis document: Adjacency effects on water surfaces: Primary scattering approximation and sensitivity study. MERIS ATDB 2.21, Technical Report, 38 p.
14. Santer, R. (2000). Algorithm theoretical basis document: Atmospheric correction over land, MERIS ATBD 2.15, Technical Report, 26 p.
7. ACKNOWLEDGEMENTS
The authors thank the Swiss National Science Foundation, Contract Nr. [200020-112626/1] for funding this project, Institute for Lake Research (IfS) Langenargen of LuBW and German Aerospace Center (DLR) Oberpfaffenhofen for active support with data, vessels, staff and instruments. The field campaigns were supported by ESA, contract Nr. 20436/07/I-LG. Special thanks are due to Kirstin König and Andreas Schiessel (LuBW), Jörg Heblinski (EOMAP), Hanna Huhn, Esra Mandici, Thomas Agyemang, Klaus Schmieder (Univ. Hohenheim), Juliane Huth and Thomas Krauss (DLR) for their commitment in field work; and Silvia Ballert (Univ. Konstanz), Brigitte Engesser (LuBW) and Anke Bogner (EOMAP) for their laboratory work.