Embed Size (px)
Citation preview

A R T I C L E
Adipocyte/macrophage fatty acid binding proteins controlintegrated metabolic responses in obesity and diabetes
Kazuhisa Maeda,1,4,5 Haiming Cao,1,4 Keita Kono,1 Cem Z. Gorgun,1 Masato Furuhashi,1 Kadir T. Uysal,1
Qiong Cao,1 Genichi Atsumi,1,6 Harry Malone,3 Bala Krishnan,3 Yasuhiko Minokoshi,2 Barbara B. Kahn,2
Rex A. Parker,3 and Gökhan S. Hotamisligil1,*
1Department of Genetics and Complex Diseases, Harvard School of Public Health, Boston, Massachusetts, 021152 Division of Endocrinology, Diabetes, and Metabolism, Beth Israel Deaconess Medical Center and Department of Medicine, Harvard Medical
School, Boston, Massachusetts, 022153 Bristol-Myers Squibb Pharmaceutical Research Institute, Princeton, New Jersey, 085434 These authors contributed equally to this work.5 Present address: Medical Center for Translational Research, Osaka University Hospital, Osaka, Japan.6 Present address: Clinical Molecular Biology, Teikyo University, Kanagawa, Japan.*Correspondence: [email protected]
Summary
Fatty acid binding proteins (FABPs) are cytosolic fatty acid chaperones whose biological role and mechanisms of actionare not well understood. Here, we developed mice with targeted mutations in two related adipocyte FABPs, aP2 and mal1,to resolve their role in systemic lipid, glucose, and energy metabolism. Mice lacking aP2 and mal1 exhibited a strikingphenotype with strong protection from diet-induced obesity, insulin resistance, type 2 diabetes, and fatty liver disease.These mice have altered cellular and systemic lipid transport and composition, leading to enhanced insulin receptorsignaling, enhanced muscle AMP-activated kinase (AMP-K) activity, and dramatically reduced liver stearoyl-CoA desatur-ase-1 (SCD-1) activity underlying their phenotype. Taken together with the previously reported strong protection againstatherosclerosis, these results demonstrate that adipocyte/macrophage FABPs have a robust impact on multiple compo-nents of metabolic syndrome, integrating metabolic and inflammatory responses in mice and constituting a powerfultarget for the treatment of these diseases.
Introduction
Adipose tissue plays a critical role in energy homeostasis andan array of endocrine functions. Obesity, characterized by ex-cess accumulation of adipose tissue, is detrimental to manysystems and involved in the pathogenesis of multiple humandiseases (Saltiel, 2001; Spiegelman and Flier, 2001). These as-sociated pathologies include insulin resistance, type 2 diabe-tes, dyslipidemia, cardiovascular disease, and fatty infiltrationof the liver (Shulman, 2000; Tilg and Diehl, 2000). Currently,more than 64.5% of the adult population in the United Statesare overweight (Skyler and Oddo, 2002), and obesity and type2 diabetes are the leading metabolic diseases worldwide(Flegal et al., 1998; Zimmet et al., 2001). The incidence and theimpact of this disease cluster, also referred to as metabolicsyndrome, have risen to alarming proportions, and there isgreat need for therapeutic and preventive measures againstthese major health threats.
The systemic regulation of adiposity is controlled at manylevels by mechanisms endogenous both to adipocytes and toparacrine and endocrine links with the central nervous systemand other metabolically critical sites such as muscle and livertissues. Lipids and their derivatives, as well as numerous cyto-kines and hormones, are important to the function of these net-works in health and disease (Friedman and Halaas, 1998; Mat-
CELL METABOLISM : FEBRUARY 2005 · VOL. 1 · COPYRIGHT © 2005 E
suzawa et al., 1999; Sethi and Hotamisligil, 1999; Shulman,2000). Obesity is associated with abnormalities of these func-tional networks at many levels, including aberrant productionand/or abnormal function of most of these mediators, leadingto an array of associated pathologies (Friedman and Halaas,1998; Sethi and Hotamisligil, 1999; Shulman, 2000). It is stillnot fully clear why these pathologies and complications clusteraround obesity to establish the phenotype known as meta-bolic syndrome.
Adipocytes are active sites of lipid metabolism involvingstorage, mobilization, and transport of lipids as well as utiliza-tion of lipid-mediated signaling pathways. These cells containhigh levels of a cytosolic fatty acid binding protein (FABP)called aP2 (Bernlohr et al., 1999). It is generally accepted thatcytosolic FABPs in general, and aP2 in particular, facilitate theutilization of lipids in metabolic pathways in adipocytes andother cells. It is therefore likely that FABPs serve as a criticallink between lipid metabolism, hormone action, and cellularfunctions in adipocytes and other cell types and thus contrib-ute to systemic energy homeostasis. However, the definitivebiology and mechanisms of action of FABPs remain poorlyunderstood. Earlier studies have indicated a role for aP2 in glu-cose metabolism (Hotamisligil et al., 1996; Scheja et al., 1999;Uysal et al., 2000). Mice deficient in aP2, despite gaining moreweight, exhibit a modest increase in insulin sensitivity in the
LSEVIER INC. DOI 10.1016/j.cmet.2004.12.008 107
A R T I C L E
context of obesity with no protection from fatty liver disease.More recently, a significant impact of this protein on the devel-opment of atherosclerosis through modification of macrophageinflammatory responses and cholesterol metabolism was ob-served (Boord et al., 2002; Makowski et al., 2001). A secondFABP isoform, mal1, is also expressed in adipocytes. Mice de-ficient in mal1 also exhibit a small increase in insulin sensitivity,without changes in total body adiposity (Maeda et al., 2003).Although mal1 is also expressed in macrophages in a similarpattern with aP2, its role, if any, on atherosclerosis has notyet been determined. Although normally found at low levels inadipose tissue, mal1 is strongly upregulated in animals lackingaP2, thus preventing full understanding of FABP function andmechanism of action at this site and systemically (Hotamisligilet al., 1996; Makowski et al., 2001; Scheja et al., 1999). Toovercome this limitation and examine the impact of FABPs onadipocyte function and systemic metabolic homeostasis, wedeveloped mice lacking both aP2 and mal1 genes and exam-ined the mechanisms underlying FABP function.
Results
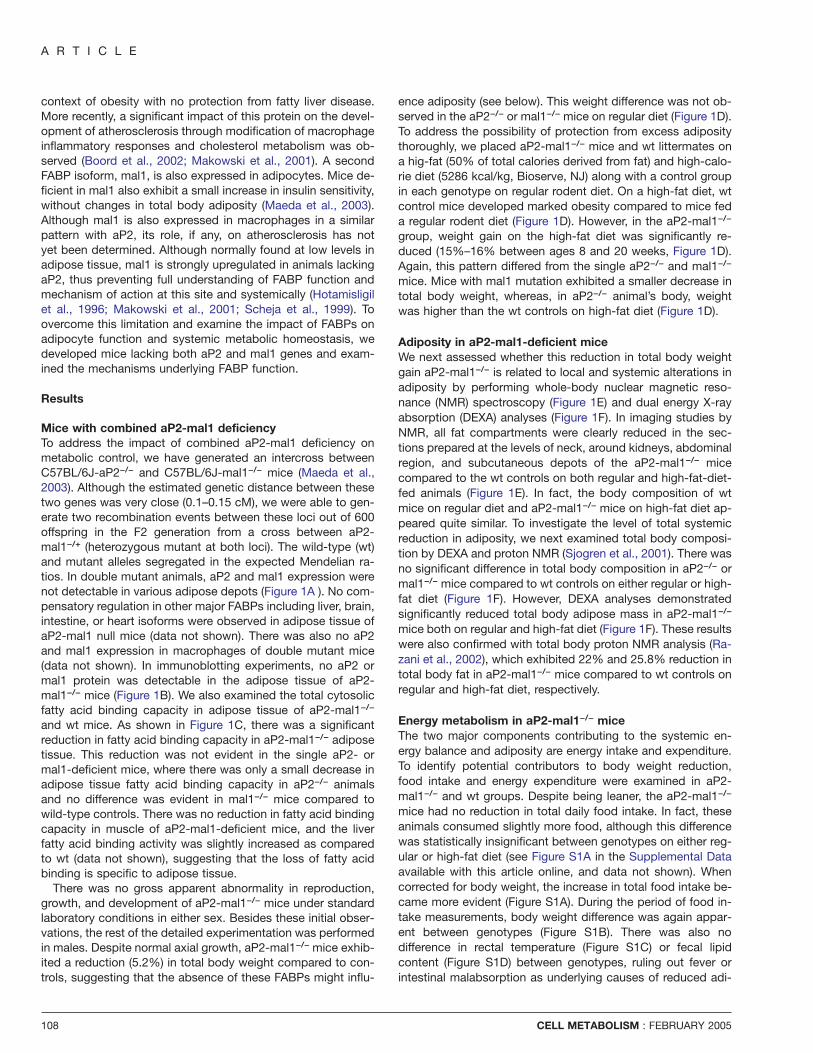
Mice with combined aP2-mal1 deficiencyTo address the impact of combined aP2-mal1 deficiency onmetabolic control, we have generated an intercross betweenC57BL/6J-aP2−/− and C57BL/6J-mal1−/− mice (Maeda et al.,2003). Although the estimated genetic distance between thesetwo genes was very close (0.1–0.15 cM), we were able to gen-erate two recombination events between these loci out of 600offspring in the F2 generation from a cross between aP2-mal1−/+ (heterozygous mutant at both loci). The wild-type (wt)and mutant alleles segregated in the expected Mendelian ra-tios. In double mutant animals, aP2 and mal1 expression werenot detectable in various adipose depots (Figure 1A ). No com-pensatory regulation in other major FABPs including liver, brain,intestine, or heart isoforms were observed in adipose tissue ofaP2-mal1 null mice (data not shown). There was also no aP2and mal1 expression in macrophages of double mutant mice(data not shown). In immunoblotting experiments, no aP2 ormal1 protein was detectable in the adipose tissue of aP2-mal1−/− mice (Figure 1B). We also examined the total cytosolicfatty acid binding capacity in adipose tissue of aP2-mal1−/−
and wt mice. As shown in Figure 1C, there was a significantreduction in fatty acid binding capacity in aP2-mal1−/− adiposetissue. This reduction was not evident in the single aP2- ormal1-deficient mice, where there was only a small decrease inadipose tissue fatty acid binding capacity in aP2−/− animalsand no difference was evident in mal1−/− mice compared towild-type controls. There was no reduction in fatty acid bindingcapacity in muscle of aP2-mal1-deficient mice, and the liverfatty acid binding activity was slightly increased as comparedto wt (data not shown), suggesting that the loss of fatty acidbinding is specific to adipose tissue.
There was no gross apparent abnormality in reproduction,growth, and development of aP2-mal1−/− mice under standardlaboratory conditions in either sex. Besides these initial obser-vations, the rest of the detailed experimentation was performedin males. Despite normal axial growth, aP2-mal1−/− mice exhib-ited a reduction (5.2%) in total body weight compared to con-trols, suggesting that the absence of these FABPs might influ-
108
ence adiposity (see below). This weight difference was not ob-served in the aP2−/− or mal1−/− mice on regular diet (Figure 1D).To address the possibility of protection from excess adipositythoroughly, we placed aP2-mal1−/− mice and wt littermates ona hig-fat (50% of total calories derived from fat) and high-calo-rie diet (5286 kcal/kg, Bioserve, NJ) along with a control groupin each genotype on regular rodent diet. On a high-fat diet, wtcontrol mice developed marked obesity compared to mice feda regular rodent diet (Figure 1D). However, in the aP2-mal1−/−
group, weight gain on the high-fat diet was significantly re-duced (15%–16% between ages 8 and 20 weeks, Figure 1D).Again, this pattern differed from the single aP2−/− and mal1−/−
mice. Mice with mal1 mutation exhibited a smaller decrease intotal body weight, whereas, in aP2−/− animal’s body, weightwas higher than the wt controls on high-fat diet (Figure 1D).
Adiposity in aP2-mal1-deficient miceWe next assessed whether this reduction in total body weightgain aP2-mal1−/− is related to local and systemic alterations inadiposity by performing whole-body nuclear magnetic reso-nance (NMR) spectroscopy (Figure 1E) and dual energy X-rayabsorption (DEXA) analyses (Figure 1F). In imaging studies byNMR, all fat compartments were clearly reduced in the sec-tions prepared at the levels of neck, around kidneys, abdominalregion, and subcutaneous depots of the aP2-mal1−/− micecompared to the wt controls on both regular and high-fat-diet-fed animals (Figure 1E). In fact, the body composition of wtmice on regular diet and aP2-mal1−/− mice on high-fat diet ap-peared quite similar. To investigate the level of total systemicreduction in adiposity, we next examined total body composi-tion by DEXA and proton NMR (Sjogren et al., 2001). There wasno significant difference in total body composition in aP2−/− ormal1−/− mice compared to wt controls on either regular or high-fat diet (Figure 1F). However, DEXA analyses demonstratedsignificantly reduced total body adipose mass in aP2-mal1−/−
mice both on regular and high-fat diet (Figure 1F). These resultswere also confirmed with total body proton NMR analysis (Ra-zani et al., 2002), which exhibited 22% and 25.8% reduction intotal body fat in aP2-mal1−/− mice compared to wt controls onregular and high-fat diet, respectively.
Energy metabolism in aP2-mal1−/− miceThe two major components contributing to the systemic en-ergy balance and adiposity are energy intake and expenditure.To identify potential contributors to body weight reduction,food intake and energy expenditure were examined in aP2-mal1−/− and wt groups. Despite being leaner, the aP2-mal1−/−
mice had no reduction in total daily food intake. In fact, theseanimals consumed slightly more food, although this differencewas statistically insignificant between genotypes on either reg-ular or high-fat diet (see Figure S1A in the Supplemental Dataavailable with this article online, and data not shown). Whencorrected for body weight, the increase in total food intake be-came more evident (Figure S1A). During the period of food in-take measurements, body weight difference was again appar-ent between genotypes (Figure S1B). There was also nodifference in rectal temperature (Figure S1C) or fecal lipidcontent (Figure S1D) between genotypes, ruling out fever orintestinal malabsorption as underlying causes of reduced adi-
CELL METABOLISM : FEBRUARY 2005
Fatty Acid Binding Proteins and Metabolic Syndrome
Figure 1. Total adiposity, adipose depot distribution,and expression of FABPs in aP2-mal1-deficient mice
A) Lack of aP2 and mal1 mRNA expression in aP2-mal1-deficient mice. Probes for aP2 and mal1 FABPisoforms were hybridized with total RNA from epi-didymal (EF) and subcutaneous fat (SF) of 16-week-old, wild-type (wt), and aP2-mal1-deficient (AM−/−)mice. Loading and integrity of RNA is shown withEtBr staining. B) Lack of adipose tissue aP2 andmal1 proteins in aP2-mal1-deficient mice. Immu-noblots with isotype-specific antibodies showingthe absence of aP2 and/or mal1 proteins in wt,aP2−/− (A−/−), mal1−/− (M−/−), and aP2-mal1-deficientmice. C) Adipose fatty acid binding activity of wt(green), A−/− (pink), M−/− (orange), and AM−/− (blue)mice. Values for each mutant strain are expressedas percentage of wt. Textured part of each columnrepresents predicted nonspecific binding (see Sup-plemental Experimental Procedures). D) Growthcurves of wt (green), A−/− (pink), M−/− (orange), andAM−/− (blue) mice on regular (RD) or high-fat diet(HFD). Obesity is induced by high-fat diet startingfrom 3 weeks of age. a = AM−/− is statistically signifi-cantly different from A−/−; b = AM−/− is statisticallysignificantly different from wt; c = AM−/− is statistic-ally significantly different from M−/−; d = AM−/− isstatistically significantly different from wt, A−/−, andM−/− mice. E) Nuclear magnetic resonance (NMR)sections obtained from the same groups of miceshown in (D) at 16 weeks of age. F) Total body com-position analysis by dual energy X-ray absorption-metry (DEXA). Black bars indicate lean body mass,and the yellow bars indicate fat mass. Data on allmice used in DEXA experiments are also shown onthe upper portion of the graph by filled circles. G)CO2 production and (H) O2 consumption of AM−/−
and wt mice determined by indirect calorimetry. Er-ror bars represent the SEM. Asterisk, p < 0.05.
posity in FABP-deficient animals.We next determined whether differences in energy expendi-
ture in aP2-mal1-deficient animals could account for the differ-ences in adiposity by performing indirect calorimetry studiesand determination of physical activity. In these studies, aP2-
CELL METABOLISM : FEBRUARY 2005
mal1-deficient mice exhibited similar rates of physical activityin continuous 48 hr period measurements (Figure S1E). How-ever, there was a significant increase in the rates of carbondioxide production (Figure 1G) and oxygen consumption (Fig-ure 1H) in aP2-mal1−/− mice compared to wt controls. Taken
109

A R T I C L E
together, these data demonstrate that the primary metabolicmechanism underlying the reduction in adiposity in aP2-mal1−/−
mice is increased energy expenditure.
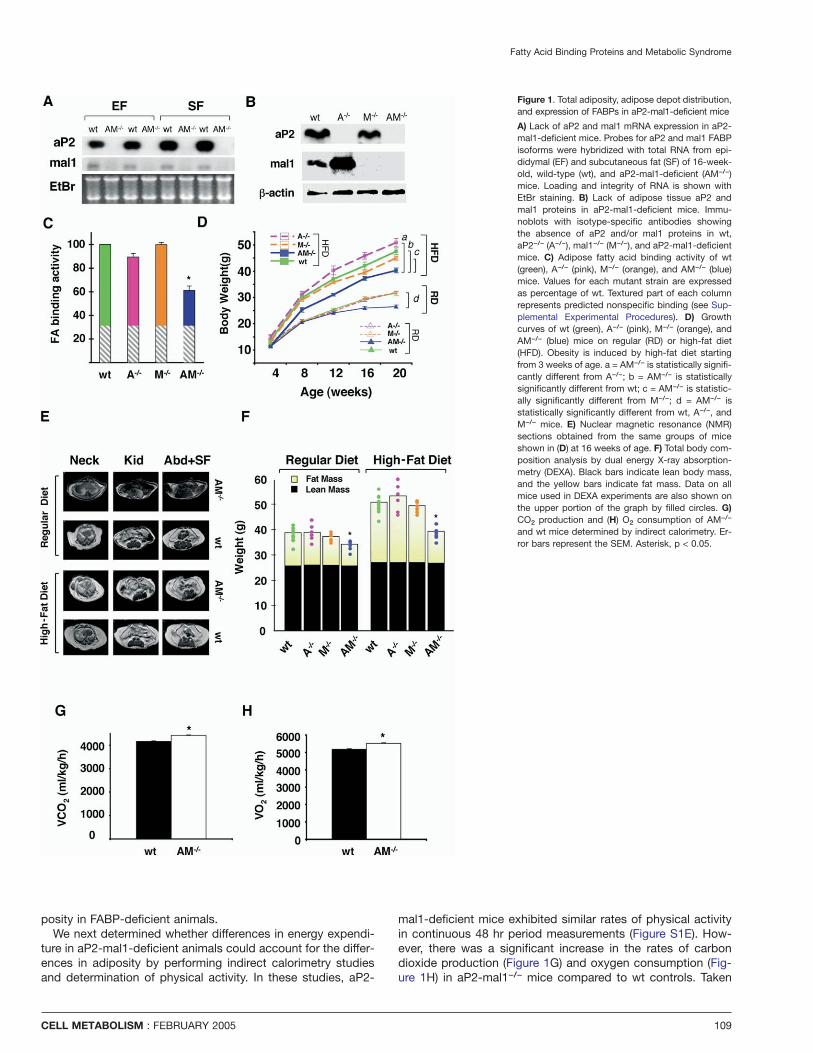
Adipose tissue, lipid transport and distribution,and adipocytokines in aP2-mal1-deficient miceThere was no significant difference in the extent of adipocytedifferentiation in aP2-mal1−/− mouse embryonic fibroblastscompared to wt or heterozygous cells (data not shown). In lightof these observations, we next considered the possibility thatthe combined lack of aP2 and mal1 alters the lipid profiles intissues due to their differential affinity and transport properties.To address this question, we isolated the fatty acid fractionfrom two different adipose tissue depots and quantified indivi-dual fatty acids. We also performed parallel fatty acid profilingexperiments in muscle and liver tissues and serum. These ex-periments revealed significant differences in fatty acid distribu-tion between wt and aP2-mal1−/− mice (Figures 2A and 2B).Among saturated fatty acids, accumulation of shorter chainfatty acids such as myristic acid (14:0) was favored in aP2-mal1−/− adipose and muscle tissues compared to stearic (18:0)or palmitic acid (16:0). Strikingly, liver exhibited the completeopposite pattern of fatty acid distribution between aP2-mal1−/−
mice and wt controls. Among monounsaturated fatty acids, theratios strongly favored myristoleic (14:1n-5c) and palmitoleic(16:1n-7c) acid in adipose and muscle tissues (Figure 2B). Thelipid profiles were similar between the two adipose tissue de-pots studied. This distribution was not present in liver or se-rum, where monounsaturated fatty acid ratio was extremelylow compared to longer chain length fatty acids in aP2-mal1−/−
mice. In a separate experiment, we also measured the adiposetissue lipid composition of all of the same fractions quantita-tively and obtained similar results in lipid distribution (data notshown).
Next, we examined whether the adipocyte FABPs regulatefatty acid transport properties, which might underlie the alter-ations observed in lipid composition in aP2-mal1−/− adiposetissue. Typically, fatty acid uptake experiments are performedby palmitic acid (16:0). When we also used this fatty acid ininitial experiments, we have not observed any differences be-tween genotypes (Figure 2C). As adipose tissue palmitic acidlevels are also similar between genotypes, we next askedwhether fatty acid uptake differs between aP2-mal1-deficientand wt adipocytes for fatty acids with different chain lengths.Interestingly, these experiments demonstrated that the uptakeof stearic acid (18:0) was significantly reduced in aP2-mal1-deficient adipocytes. In contrast, fatty acid uptake was in-creased for lauric acid (12:0). These data provide a potentialmechanism for the alterations in lipid composition in adiposetissue via chain length-selective regulation of fatty acid traffick-ing in adipocytes. In biochemical measurements of steady-state serum lipids, we observed a modest decrease in circu-lating triglycerides and a modest increase in free fatty acidconcentrations (Table S1). These changes were observed inanimals on both regular and high-fat diets. There was no signif-icant alteration in serum glycerol or total cholesterol levels be-tween genotypes.
We also investigated the expression patterns of several adi-pose-derived hormones in adipose tissues from mice on high-fat diet to determine the impact of these compositional changeson adipocytokines. There were reductions in the expression of
110
adiponectin (62%), leptin (52%), and TNFα (70%) mRNAs inaP2-mal1−/− mice (Figure 2D) in the epididymal adipose depotcompared to wt controls. Serum leptin level was also signifi-cantly (63.0%) reduced in aP2-mal1−/− mice (13.04 ± 1.1 ver-sus 4.8 ± 0.5 ng/ml in wt and aP2-mal1−/− mice, respectively,p < 0.005, Figure 2E). Interestingly, the serum level of adipo-nectin was also decreased (15.1%) in the aP2-mal1−/− animals(25.18 ± 1.0 versus 21.4 ± 1.1 µg/ml in wt and aP2-mal1−/−
mice, respectively, p < 0.05, Figure 2F). This is surprising, sinceadiponectin levels typically correlate negatively with bodyweight (Arita et al., 1999). Finally, there was no detectable cir-culating TNFα in the aP2-mal1−/− mice, whereas, in wt mice onhigh-fat diet, TNFα protein was detectable in serum (27.3 ± 7pg/ml). These results demonstrate that FABP deficiency resultsin alterations in lipids and adipocytokines, the two majorclasses of metabolic regulators derived from adipose tissue.These changes also create a milieu that might have a strongimpact on systemic insulin action, which is addressed below.
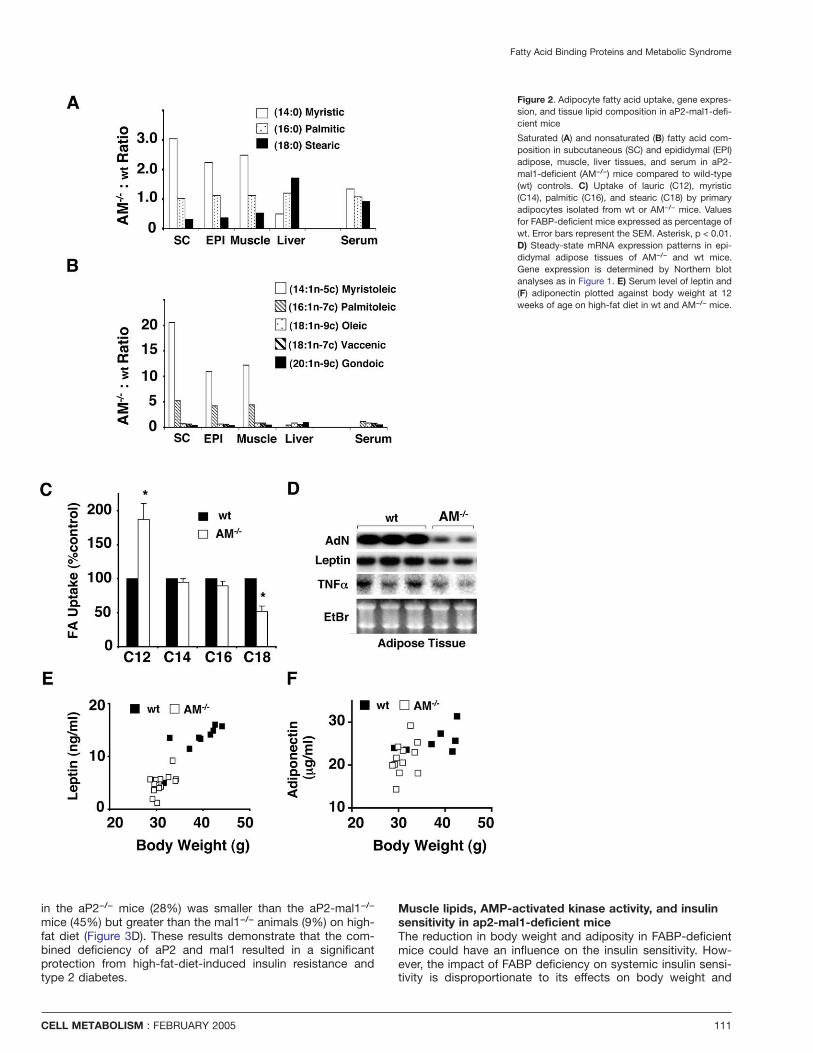
Protection against insulin resistance in aP2-mal1−/− miceRising blood glucose and insulin levels in animals on high-fatdiet are an indicator of obesity-induced insulin resistance anddevelopment of type 2 diabetes. Measurement of blood glu-cose levels demonstrated that obese wt mice developedhyperglycemia compared to lean controls (330 ± 7.2 versus197 ± 6.1 mg/dl, p < 0.001). However, on the high-fat diet, aP2-mal1−/− mice had significantly lower blood glucose concentra-tions compared to wt controls (Figure 3A). In fact, throughoutthe experiment, the blood glucose levels in aP2-mal1−/− miceon high-fat diet were indistinguishable from those of lean wtanimals on regular diet (196 ± 5.7 verus 197 ± 6.1 mg/dl). Bloodglucose levels on regular diet were also lower (163 ± 5.4mg/dl), although to a lesser extent, in the aP2-mal1−/− micecompared to wt controls. Wt mice on high-fat diet developedhyperinsulinemia compared to those on regular diet (3.2 ± 0.7versus 0.65 ± 0.2 ng/ml p < 0.001). Blood insulin levels in aP2-mal1−/− mice were significantly lower throughout the experi-mental period compared to wt controls (Figure 3B) and wereindistinguishable from those of wt lean mice (0.66 ± 0.1 versus0.65 ± 0.2). Hence, these results indicate that the aP2-mal1-deficient animals might be protected from the development ofhigh-fat-diet-induced insulin resistance and diabetes.
To further investigate systemic insulin sensitivity, we per-formed insulin (ITT) and glucose (GTT) tolerance tests in aP2-mal1−/− mice and wt controls. Insulin resistance was evident inwt mice upon high-fat diet. As shown in Figure 3C, the hypo-glycemic response to insulin in aP2-mal1−/− mice on high-fatdiet was indistinguishable from control animals on regular diet.GTT also revealed a higher degree of hyperglycemia in wt ani-mals throughout the experiment, compared to aP2-mal−/− miceon high-fat diet (Figure 3D). In this test, the responses recordedin aP2-mal1−/− mice did not reach those of lean controls. Whilethese responses were also improved in aP2−/− and mal1−/−
mice on high-fat diet, these changes were significantly smallerin magnitude (Figures 3E and 3F). The increase in insulin sensi-tivity in ITT was most dramatic in aP2-mal1−/− mice on high-fat diet. The magnitude of increase in insulin responsiveness inthe aP2−/− mice (38%) was smaller than that in aP2-mal1−/−
mice (55%) but greater than the mal1−/− animals (15%) on thehigh-fat diet (Figure 3E). Similar to the results of ITT, the magni-tude of increase in glucose disposal relative to the wt controls
CELL METABOLISM : FEBRUARY 2005
Fatty Acid Binding Proteins and Metabolic Syndrome
Figure 2. Adipocyte fatty acid uptake, gene expres-sion, and tissue lipid composition in aP2-mal1-defi-cient mice
Saturated (A) and nonsaturated (B) fatty acid com-position in subcutaneous (SC) and epididymal (EPI)adipose, muscle, liver tissues, and serum in aP2-mal1-deficient (AM−/−) mice compared to wild-type(wt) controls. C) Uptake of lauric (C12), myristic(C14), palmitic (C16), and stearic (C18) by primaryadipocytes isolated from wt or AM−/− mice. Valuesfor FABP-deficient mice expressed as percentage ofwt. Error bars represent the SEM. Asterisk, p < 0.01.D) Steady-state mRNA expression patterns in epi-didymal adipose tissues of AM−/− and wt mice.Gene expression is determined by Northern blotanalyses as in Figure 1. E) Serum level of leptin and(F) adiponectin plotted against body weight at 12weeks of age on high-fat diet in wt and AM−/− mice.
in the aP2−/− mice (28%) was smaller than the aP2-mal1−/−
mice (45%) but greater than the mal1−/− animals (9%) on high-fat diet (Figure 3D). These results demonstrate that the com-bined deficiency of aP2 and mal1 resulted in a significantprotection from high-fat-diet-induced insulin resistance andtype 2 diabetes.
CELL METABOLISM : FEBRUARY 2005
Muscle lipids, AMP-activated kinase activity, and insulinsensitivity in ap2-mal1-deficient miceThe reduction in body weight and adiposity in FABP-deficientmice could have an influence on the insulin sensitivity. How-ever, the impact of FABP deficiency on systemic insulin sensi-tivity is disproportionate to its effects on body weight and
111
A R T I C L E
Figure 3. Glucose metabolism in aP2-mal1-deficient mice
Blood glucose (A) and insulin (B) levels in wt (blue triangle solid line, n = 17) and aP2-mal1-deficient (AM−/−, blue triangle dashed line, n = 14) mice on regular diet andwt (green square solid line, n = 12) and AM−/− (green square dashed line, n = 13) mice on high-fat diet. Glucose and insulin were measured after 6 hr daytime foodwithdrawal. Insulin (C) and glucose (D) tolerance tests performed on wt and AM−/− mice on regular and high-fat diet. Asterisk, p < 0.05. Insulin (E) and glucose (F)tolerance test in all mutants expressed as integrated area under the glucose disposal curves (AUC) for each genotype relative to wt controls on high-fat diet.Experiments are performed on 14–16 weeks of age at fasting state, n = 6–8 in each group. Error bars represent the SEM. *a = M−/− is statistically significantly differentfrom wt; *b = A−/− is statistically significantly different from wt and M−/−; *c = AM−/− is statistically significantly different from wt, A−/−, and M−/− mice.
hence should involve an independent direct impact on insulinaction. The dramatic increase in insulin sensitivity as well aschanges in energy homeostasis, lipid profiles, and adipocyto-kines all point to the involvement of muscle tissue in the phe-notype of FABP-deficient animals. A feasible mechanism in thiscontext is the alterations of lipid content and/or compositionof the muscle (as shown earlier), which in turn activate insulinreceptor signaling cascades and/or other pathways related toenergy expenditure. To address this model, we first examined
112
muscle lipid content. In fact, total muscle triglyceride contentwas significantly lower (Figure 4A) in the aP2-mal1−/− micecompared to wt controls (0.044 ± 0.006 versus 0.066 ± 0.01mg/g, respectively, p < 0.005). As stated before, there was alsoa shift in the distribution of saturated fatty acids favoring in theaP2-mal1−/− animals the shorter chain myristic (14:0) versuslonger chain stearic (18:0) acid (Figure 2A). We reasoned thatthis lipid environment would be favorable to insulin action andhence examined insulin sensitivity in isolated muscle strips and
CELL METABOLISM : FEBRUARY 2005
Fatty Acid Binding Proteins and Metabolic Syndrome
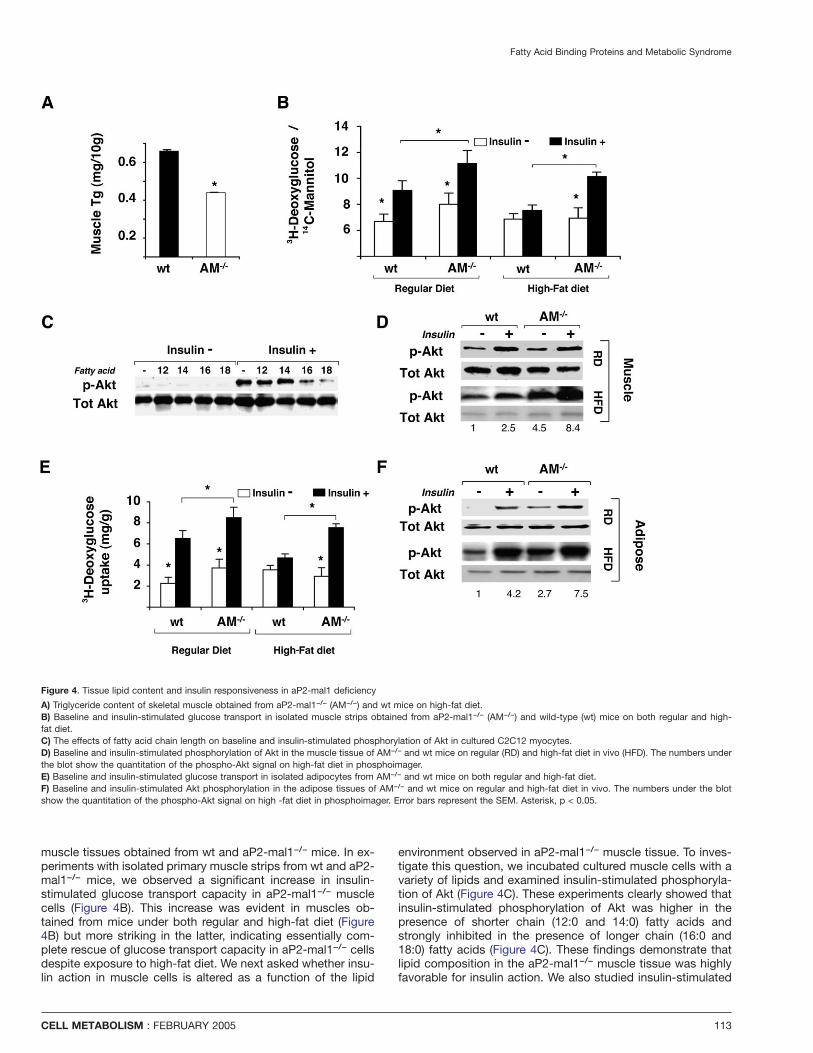
Figure 4. Tissue lipid content and insulin responsiveness in aP2-mal1 deficiency
A) Triglyceride content of skeletal muscle obtained from aP2-mal1−/− (AM−/−) and wt mice on high-fat diet.B) Baseline and insulin-stimulated glucose transport in isolated muscle strips obtained from aP2-mal1−/− (AM−/−) and wild-type (wt) mice on both regular and high-fat diet.C) The effects of fatty acid chain length on baseline and insulin-stimulated phosphorylation of Akt in cultured C2C12 myocytes.D) Baseline and insulin-stimulated phosphorylation of Akt in the muscle tissue of AM−/− and wt mice on regular (RD) and high-fat diet in vivo (HFD). The numbers underthe blot show the quantitation of the phospho-Akt signal on high-fat diet in phosphoimager.E) Baseline and insulin-stimulated glucose transport in isolated adipocytes from AM−/− and wt mice on both regular and high-fat diet.F) Baseline and insulin-stimulated Akt phosphorylation in the adipose tissues of AM−/− and wt mice on regular and high-fat diet in vivo. The numbers under the blotshow the quantitation of the phospho-Akt signal on high -fat diet in phosphoimager. Error bars represent the SEM. Asterisk, p < 0.05.
muscle tissues obtained from wt and aP2-mal1−/− mice. In ex-periments with isolated primary muscle strips from wt and aP2-mal1−/− mice, we observed a significant increase in insulin-stimulated glucose transport capacity in aP2-mal1−/− musclecells (Figure 4B). This increase was evident in muscles ob-tained from mice under both regular and high-fat diet (Figure4B) but more striking in the latter, indicating essentially com-plete rescue of glucose transport capacity in aP2-mal1−/− cellsdespite exposure to high-fat diet. We next asked whether insu-lin action in muscle cells is altered as a function of the lipid
CELL METABOLISM : FEBRUARY 2005
environment observed in aP2-mal1−/− muscle tissue. To inves-tigate this question, we incubated cultured muscle cells with avariety of lipids and examined insulin-stimulated phosphoryla-tion of Akt (Figure 4C). These experiments clearly showed thatinsulin-stimulated phosphorylation of Akt was higher in thepresence of shorter chain (12:0 and 14:0) fatty acids andstrongly inhibited in the presence of longer chain (16:0 and18:0) fatty acids (Figure 4C). These findings demonstrate thatlipid composition in the aP2-mal1−/− muscle tissue was highlyfavorable for insulin action. We also studied insulin-stimulated
113
A R T I C L E
phosphorylation of Akt in the muscle tissue of aP2-mal1−/− andcontrol mice on both regular and high-fat diet (Figure 4D). Thephospho-Akt levels were similar between genotypes in mice onregular diet except for a small increase in baseline Akt phos-phorylation in aP2-mal1−/− mice. There was, however, a signifi-cant increase in phosphorylation of muscle Akt in aP2-mal1-deficient animals on high-fat diet both before and followinginsulin stimulation (Figure 4D). Similar results were also ob-tained in adipose tissue, where both insulin-stimulated glucosetransport and Akt activation were strikingly increased in aP2-mal1-deficient animals (Figures 4E and 4F). In adipose tissue,the increase in baseline Akt phosphorylation in the lean aP2-mal1−/− animals appeared more evident. These data clearly de-monstrate that, at the molecular level, aP2-mal1 deficiency re-sulted in striking protection from high-fat-induced inhibition ofinsulin action in muscle and adipose tissues.
An important energy sensor in skeletal muscle is the AMP-activated kinase (AMP-K). Interestingly, this kinase is targetedby leptin, and its activation is a potential protective mechanismagainst lipid accumulation. The fatty acid oxidation induced inmuscle by leptin and adiponectin (Fruebis et al., 2001; Muoioet al., 1997) and potentially the protection against obesity anddiabetes might be related, at least in part, to their ability toinduce AMP-activated protein kinase activity (Minokoshi et al.,2002; Winder and Hardie, 1999; Yamauchi et al., 2001). Wetherefore determined whether AMP-K is differentially phos-phorylated in muscle tissue of aP2-mal1−/− mice and wt con-trols. Levels of total and phosphorylated AMP-K were mea-sured in the soleus muscle by immunoblot analyses (Figure5A). Quantification of immunoblot analyses demonstrated asignificant 2-fold increase in the amount of phosphorylatedAMP-K in soleus muscle from obese aP2-mal1−/− mice com-pared to wt controls.
To examine the level of activation of AMP-K in muscle inresponse to leptin, we administered recombinant leptin (1 mg/
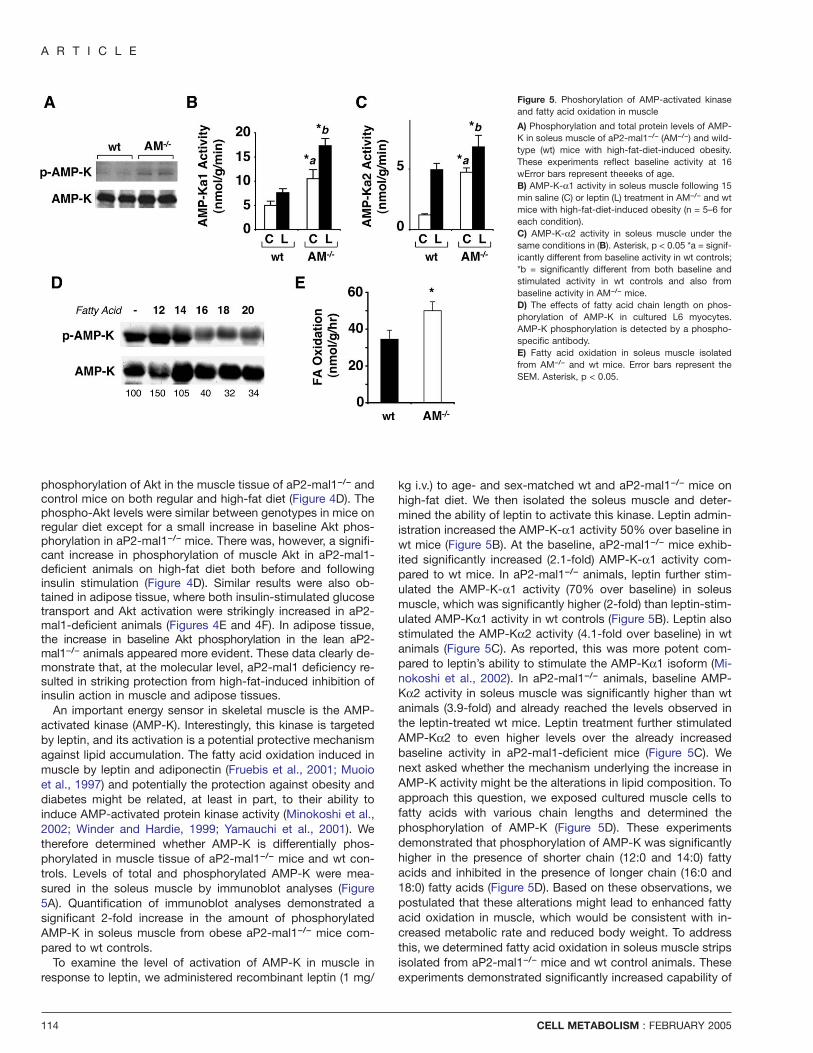
Figure 5. Phoshorylation of AMP-activated kinaseand fatty acid oxidation in muscle
A) Phosphorylation and total protein levels of AMP-K in soleus muscle of aP2-mal1−/− (AM−/−) and wild-type (wt) mice with high-fat-diet-induced obesity.These experiments reflect baseline activity at 16wError bars represent theeeks of age.B) AMP-K-α1 activity in soleus muscle following 15min saline (C) or leptin (L) treatment in AM−/− and wtmice with high-fat-diet-induced obesity (n = 5–6 foreach condition).C) AMP-K-α2 activity in soleus muscle under thesame conditions in (B). Asterisk, p < 0.05 *a = signif-icantly different from baseline activity in wt controls;*b = significantly different from both baseline andstimulated activity in wt controls and also frombaseline activity in AM−/− mice.D) The effects of fatty acid chain length on phos-phorylation of AMP-K in cultured L6 myocytes.AMP-K phosphorylation is detected by a phospho-specific antibody.E) Fatty acid oxidation in soleus muscle isolatedfrom AM−/− and wt mice. Error bars represent theSEM. Asterisk, p < 0.05.
114
kg i.v.) to age- and sex-matched wt and aP2-mal1−/− mice onhigh-fat diet. We then isolated the soleus muscle and deter-mined the ability of leptin to activate this kinase. Leptin admin-istration increased the AMP-K-α1 activity 50% over baseline inwt mice (Figure 5B). At the baseline, aP2-mal1−/− mice exhib-ited significantly increased (2.1-fold) AMP-K-α1 activity com-pared to wt mice. In aP2-mal1−/− animals, leptin further stim-ulated the AMP-K-α1 activity (70% over baseline) in soleusmuscle, which was significantly higher (2-fold) than leptin-stim-ulated AMP-Kα1 activity in wt controls (Figure 5B). Leptin alsostimulated the AMP-Kα2 activity (4.1-fold over baseline) in wtanimals (Figure 5C). As reported, this was more potent com-pared to leptin’s ability to stimulate the AMP-Kα1 isoform (Mi-nokoshi et al., 2002). In aP2-mal1−/− animals, baseline AMP-Kα2 activity in soleus muscle was significantly higher than wtanimals (3.9-fold) and already reached the levels observed inthe leptin-treated wt mice. Leptin treatment further stimulatedAMP-Kα2 to even higher levels over the already increasedbaseline activity in aP2-mal1-deficient mice (Figure 5C). Wenext asked whether the mechanism underlying the increase inAMP-K activity might be the alterations in lipid composition. Toapproach this question, we exposed cultured muscle cells tofatty acids with various chain lengths and determined thephosphorylation of AMP-K (Figure 5D). These experimentsdemonstrated that phosphorylation of AMP-K was significantlyhigher in the presence of shorter chain (12:0 and 14:0) fattyacids and inhibited in the presence of longer chain (16:0 and18:0) fatty acids (Figure 5D). Based on these observations, wepostulated that these alterations might lead to enhanced fattyacid oxidation in muscle, which would be consistent with in-creased metabolic rate and reduced body weight. To addressthis, we determined fatty acid oxidation in soleus muscle stripsisolated from aP2-mal1−/− mice and wt control animals. Theseexperiments demonstrated significantly increased capability of
CELL METABOLISM : FEBRUARY 2005

Fatty Acid Binding Proteins and Metabolic Syndrome
aP2-mal1−/− muscle for fatty acid oxidation (Figure 5E). Takentogether, these data indicate that lipids of various lengths dif-ferentially impact muscle AMP-K activity, consistent with theobserved muscle tissue lipid composition, increased activationof AMP-K, and enhanced fatty acid oxidation in aP2-mal1-defi-cient animals.
Protection against fatty liver diseasein aP2-mal1-deficient miceThe weight of the liver was reduced in the aP2-mal1−/− animalson high-fat diet (Figure 6A). Consistent with the reduction inliver weight, histological examination of liver sections revealeda dramatic reduction in fatty infiltration in aP2-mal1−/− micecompared to the wt animals (Figure 6B). In fact, the histopa-thology of aP2-mal1−/− livers on high-fat diet was indistinguish-able from livers of mice on regular diet.
Accumulation of lipids in the liver may involve several path-ways. To approach the mechanisms underlying the protectionfrom fatty liver disease in the aP2-mal1−/− mice, we first bio-chemically determined the liver triglyceride content. Theseexperiments demonstrated significantly lower liver tissue tri-glyceride accumulation (Figure 6C) in the aP2-mal1−/− micecompared to wt controls (1.28 ± 0.14 versus 1.89 ± 0.07 mg/
Figure 6. FABPs role in liver lipid metabolism, hepatosteatosis, and SCD-1 activity
A) Total wet weight of liver tissue obtained from aP2-mal1−/− (AM−/−) and wt mice on high-fat diet.B) Representative hematoxylin and eosin (H&E) stains of liver tissue (×100) sections from AM−/− and wt mice on high-fat diet prepared at 20 weeks of age.C) Triglyceride content of liver tissue obtained from AM−/− and wt mice on high-fat diet.D) Portal concentration of free fatty acids in AM−/− and wt mice on high-fat diet.E) The effects of fatty acid chain length on lipid accumulation in Fao liver cells. Direct micrographs are shown after 48 hr treatment with the indicated fatty acids. Thequantitation in each experiment is shown as a percent of control in parenthesis.F) Stearoyl-CoA desaturase-1 (SCD-1) expression in Fao cells treated with lipids and in liver tissue of AM−/− and wt mice on high-fat diet.G) Total SCD activity in liver tissue of AM−/− and wt mice on high-fat diet. Error bars represent the SEM. Asterisk, p < 0.05.
CELL METABOLISM : FEBRUARY 2005
g, respectively, p < 0.05). This significant reduction in liver tri-glyceride content and hepatosteatosis was not evident inaP2−/− or mal1−/− mice (data not shown). Interestingly, the por-tal free fatty acid levels were even higher in the aP2-mal1−/−
mice compared to wt controls on high-fat diet (Figure 6D). This,along with the alteration in the liver lipid profile, suggests anintracellular hepatic mechanism accounting for the lack of lipidaccumulation in liver cells.
The lipid profile seen in liver with accumulation of longerchain fatty acids such as stearic acid is striking, since thispattern was the opposite of lipid distribution detected in adi-pose and muscle tissues where there was accumulation in fa-vor of shorter chain fatty acids. To test the potential impact ofthis lipid distribution on the development of hepatosteatosis,we first tested the ability of lipids with various chain lengths toaccumulate in cultured liver cells. These experiments demon-strate that fatty acid chain length is inversely correlated withthe ability to accumulate lipids in cultured liver cells wherelonger chain (16:0 and 18:0) fatty acids essentially lacked theability to induce hepatosteatosis, therefore supporting the hy-pothesis that lipid metabolism as well as composition mightunderlie the lack of fatty liver disease in aP2-mal1-deficientmice (Figure 6E). The lipid distribution pattern observed in the
115
A R T I C L E
livers of aP2-mal1−/− mice led us to postulate that likely locithat are affected might be fatty acid synthase (FAS) and/or ste-aroyl-CoA desaturase-1 (SCD-1). Interestingly, SCD-1 expres-sion in liver cells was strongly suppressed by fatty acids butwithout the same clear and dramatic effect of chain lengthseen in muscle (Figure 6F). Examination of SCD-1 expressionin the liver tissues of aP2-mal1−/− mice and wt controls onhigh-fat diet also demonstrated a striking defect in the expres-sion of SCD-1 in the liver tissue of aP2-mal1−/− animals (Figure6F). This reduction in SCD-1 mRNA expression was associatedwith a significant decrease in liver SCD activity (Figure 6G). Incontrast, there was no reduction in SCD activity in adipose(3.17 ± 0.32 versus 2.89 ± 0.51 in wt and aP2-mal1−/− mice,respectively) or muscle tissues (0.28 ± 0.04 versus 0.25 ± 0.04in wt and aP2-mal1−/− mice, respectively). Interestingly, SCD-1is recently reported to be the predominant peripheral target ofleptin in liver. Upon treatment with leptin, or in ob/ob micewhere leptin expression is transgenically reconstituted, SCD-1expression in liver is strongly suppressed. However, the levelof regulation seen in aP2-mal1−/− mice is greater than whathas been achieved through leptin administration or transgenicleptin production (Cohen et al., 2002; Soukas et al., 2000), sug-gesting that its regulation may not be entirely related to leptinaction at this site.
Finally, we examined the expression patterns of other mole-cules that are critical in liver lipid metabolism, including theSREBP family of transcription factors, acetyl-CoA carboxylase1 (ACC-1), and fatty acid synthase (FAS), to be able to con-struct a better mechanistic model (Table S2). Among all of thegenes examined, the most dramatic regulation was for SCD-1(96% reduction in aP2-mal1−/− mice). Interestingly, these ex-periments also demonstrated reduction (70%) in liver SREBP1cexpression in aP2-mal1-deficient mice. Consistent with this,we also detected moderate decreases in the expression of anumber of additional SREBP1 target genes critical in fatty acidmetabolism, including ACC-1, FAS, ELOVL6, SPOT14, HMG-CoA reductase, and HMG-CoA synthase (Table S2). In con-trast, no change was evident in the expression levels ofSREBP2, DGAT1, or mGPAT.
Discussion
Fatty acids have long been seen as critical components of thepathogenesis of obesity and its associated disorders. However,the mechanisms by which these or other lipids mediate theseabnormalities remain unclear. Our findings in this study demon-strate that FABPs are critical in the interface between cellularlipid trafficking and homeostasis and the peripheral signalingpathways that are central to obesity and its associated pathol-ogies. The deletion of two FABPs, aP2 and mal1, in micecauses significant changes in lipid and hormone profiles andleads to significant protection against obesity, insulin resis-tance, type 2 diabetes, and fatty liver disease.
In FABP-deficient animals, there is an increase in the ratio ofshorter chain (C14) to longer chain (C18) fatty acids in adiposeand muscle tissues. This pattern is reflected in circulating lipidsbut reversed in liver. We have presented several intermediarymechanisms in this lipid environment that underlie the pheno-type of the mice. First, we demonstrated the differential impactof exposure to fatty acids of different chain length on muscleinsulin receptor signaling. These results are in line with previous
116
reports indicating the inhibitory effects of long chain fatty acidson insulin action (Chavez and Summers, 2003). Consistent withthese findings, basal and insulin-stimulated phosphorylation ofAkt in FABP-deficient mice is also significantly increased in adi-pose and muscle tissues, accompanied by increased insulin-stimulated glucose uptake at both sites. Second, we demon-strate that the lipid composition of muscle is altered to favorshorter chain length fatty acids. This composition supportshigher levels of AMP-K activity in cultured cells and, consistentwith these observations, there is increased basal and stim-ulated muscle AMP-K activity, fatty acid oxidation, andincreased energy expenditure in FABP-deficient mice. Conse-quently, the overall triglyceride content of the muscle, a well-established indicator of lipotoxicity, is also reduced in aP2-mal1−/− animals, although the magnitude of this reduction ismoderate. Whether alterations in lipid uptake in muscle alsocontribute to the muscle lipid composition and metabolism re-mains to be determined. Third, we demonstrated a significantreduction in liver SCD-1 expression and activity in FABP-defi-cient animals accompanied by increased longer chain fattyacids and striking resistance to fatty liver disease upon expo-sure to a high-fat diet. These changes occur despite highersystemic and portal fatty acid input. We also demonstrated thedifferential impact of exposure to fatty acids of different chainlength on SCD-1 expression and the capacity to induce lipidaccumulation in liver cells. The reduction in SCD-1 expressionseen in FABP-deficient animals is highly relevant to their liverphenotype, since genetic SCD-1 deficiency also results instrong protection from hepatosteatosis and an overall pheno-type reminiscent of FABP-deficient model presented here (Co-hen et al., 2002). Finally, we demonstrate that aP2-mal1 defi-ciency results in decreased SREBP1c expression in liver and aconsequent reduction in the transcriptional target genes forthis key transcription factor for liver lipid metabolism. This is alikely response triggered by the elevated fatty acid levels deliv-ered through the portal system to liver. Interestingly, however,SREBP2 expression is not altered by FABP deficiency. It hasbeen shown that SREBP2 expression is upregulated in the livertissue of SREBP1c-deficient mice, leading to increased livercholesterol synthesis (Shimano et al., 1997). In the currentmodel, despite decreased SREBP1c expression, there is nocompensatory upregulation of SREBP2 in the liver tissue ofaP2-mal1-deficient mice, which also provides further protec-tion from hepatosteatosis with decreased HMG-CoA reductaseand HMG-CoA synthase expression.
It is of note that both muscle AMP-K and liver SCD-1 haverecently been established as major targets for peripheral leptinaction. In this study, we also show data supporting enhancedactivation of AMP-Kα1 and α2 isoforms in the muscle tissueof aP2-mal1−/− animals. Furthermore, AMP-K is also targetedby adiponectin, and adiponectin-stimulated AMP-Kα1 activityin muscle is also enhanced in aP2-mal1-deficient animals (datanot shown). These observations raise the interesting possibilitythat at least part of the impact of FABPs on systemic metabo-lism is either dependent on leptin and/or adiponectin activityor mimicking peripheral actions of these molecules. Since therewere no recognizable changes in food intake but a significantincrease in energy expenditure in aP2-mal1−/− mice, we sug-gest that the primary site of action in these animals is at theperiphery, whether or not it is dependent on leptin activity. Ad-
CELL METABOLISM : FEBRUARY 2005
Fatty Acid Binding Proteins and Metabolic Syndrome
ditional studies in leptin- or adiponectin-deficient models couldaddress these questions further.
We demonstrate significant alterations in fatty acid transport,availability, and composition upon loss of intracellular FABPs.These activities have not been associated with cytosolicFABPs in previous studies. Interestingly, since systemic freefatty acid levels are not decreased in FABP deficiency, our datasupports the concept that transport and availability of fattyacids to the target tissues and the intracellular responses elic-ited by these lipids are more critical in determining the meta-bolic outcomes than the absolute values present in circulation.Regarding the latter, an interesting possibility remains thatFABPs might also alter stress and inflammatory responses, in-cluding the activation of c-jun N-terminal kinase (Jnk) inducedby lipids and cytokines, as well as ER stress, which are criti-cally coupled to both obesity and insulin resistance (Hirosumiet al., 2002; Ozcan et al., 2004; Yuan et al., 2001). These obser-vations should stimulate further interest in the important roleplayed by these proteins in cellular and systemic lipid homeo-stasis.
In this study, we demonstrate that mice lacking the FABPsaP2 and mal1 are remarkably resistant to diet-induced obesity,fatty liver disease, insulin resistance, and type 2 diabetes.These results also illustrate that the aP2-mal1−/− mice differfrom the individual deficiency of aP2 and mal1 in several re-spects (Table 1). First, whereas aP2-mal1−/− mice are protectedfrom obesity, aP2- or mal1-deficient mice show no differencein systemic adiposity (Maeda et al., 2003), and aP2−/− miceactually gain more weight upon induction of dietary or geneticobesity (Hotamisligil et al., 1996; Scheja et al., 1999; Uysal etal., 2000). In addition, no difference in metabolic rates is ob-served in aP2- or mal1-deficient animals, whereas aP2-mal1-deficient animals exhibit increased O2 consumption and CO2
production. Second, the magnitude of the increase in insulinsensitivity observed in aP2-mal1 deficiency significantly ex-ceeds that of individual aP2 or mal1 deficiency. There are alsosignificant alterations in adipocytokine levels in aP2-mal−/−
mice. Third, neither aP2 nor mal1 deficiency provides signifi-cant protection from hepatosteatosis, whereas this phenotypeis essentially completely corrected in aP2-mal−/− animals. Hence,the molecular compensation observed in individual FABP defi-ciency models has substantial physiological significance.
Finally, in our earlier studies, we have also observed thatFABP-deficient mice are dramatically protected against athero-sclerosis through the action of these FABPs in macrophages
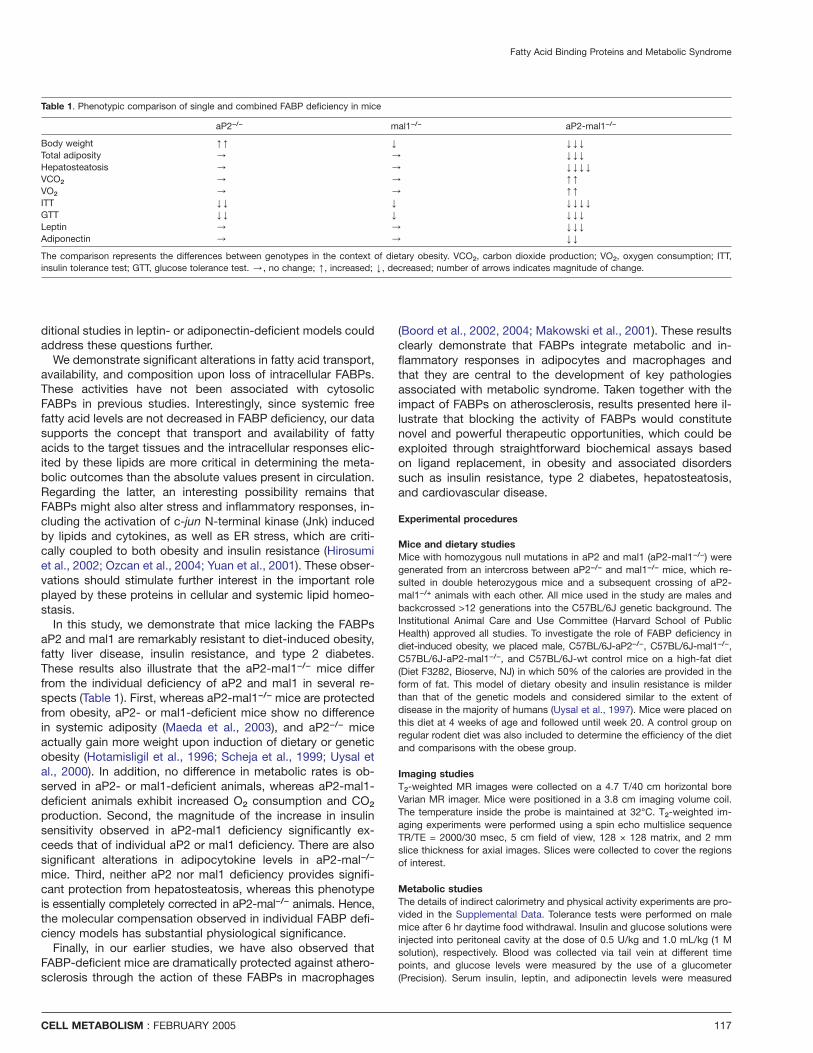
Table 1. Phenotypic comparison of single and combined FABP deficiency in mice
aP2−/− mal1−/− aP2-mal1−/−
Body weight [[ Y YYY
Total adiposity / / YYY
Hepatosteatosis / / YYYY
VCO2 / / [[
VO2 / / [[
ITT YY Y YYYY
GTT YY Y YYY
Leptin / / YYY
Adiponectin / / YY
The comparison represents the differences between genotypes in the context of dietary obesity. VCO2, carbon dioxide production; VO2, oxygen consumption; ITT,insulin tolerance test; GTT, glucose tolerance test. /, no change; [, increased; Y, decreased; number of arrows indicates magnitude of change.
CELL METABOLISM : FEBRUARY 2005
(Boord et al., 2002, 2004; Makowski et al., 2001). These resultsclearly demonstrate that FABPs integrate metabolic and in-flammatory responses in adipocytes and macrophages andthat they are central to the development of key pathologiesassociated with metabolic syndrome. Taken together with theimpact of FABPs on atherosclerosis, results presented here il-lustrate that blocking the activity of FABPs would constitutenovel and powerful therapeutic opportunities, which could beexploited through straightforward biochemical assays basedon ligand replacement, in obesity and associated disorderssuch as insulin resistance, type 2 diabetes, hepatosteatosis,and cardiovascular disease.
Experimental procedures
Mice and dietary studiesMice with homozygous null mutations in aP2 and mal1 (aP2-mal1−/−) weregenerated from an intercross between aP2−/− and mal1−/− mice, which re-sulted in double heterozygous mice and a subsequent crossing of aP2-mal1−/+ animals with each other. All mice used in the study are males andbackcrossed >12 generations into the C57BL/6J genetic background. TheInstitutional Animal Care and Use Committee (Harvard School of PublicHealth) approved all studies. To investigate the role of FABP deficiency indiet-induced obesity, we placed male, C57BL/6J-aP2−/−, C57BL/6J-mal1−/−,C57BL/6J-aP2-mal1−/−, and C57BL/6J-wt control mice on a high-fat diet(Diet F3282, Bioserve, NJ) in which 50% of the calories are provided in theform of fat. This model of dietary obesity and insulin resistance is milderthan that of the genetic models and considered similar to the extent ofdisease in the majority of humans (Uysal et al., 1997). Mice were placed onthis diet at 4 weeks of age and followed until week 20. A control group onregular rodent diet was also included to determine the efficiency of the dietand comparisons with the obese group.
Imaging studiesT2-weighted MR images were collected on a 4.7 T/40 cm horizontal boreVarian MR imager. Mice were positioned in a 3.8 cm imaging volume coil.The temperature inside the probe is maintained at 32°C. T2-weighted im-aging experiments were performed using a spin echo multislice sequenceTR/TE = 2000/30 msec, 5 cm field of view, 128 × 128 matrix, and 2 mmslice thickness for axial images. Slices were collected to cover the regionsof interest.
Metabolic studiesThe details of indirect calorimetry and physical activity experiments are pro-vided in the Supplemental Data. Tolerance tests were performed on malemice after 6 hr daytime food withdrawal. Insulin and glucose solutions wereinjected into peritoneal cavity at the dose of 0.5 U/kg and 1.0 mL/kg (1 Msolution), respectively. Blood was collected via tail vein at different timepoints, and glucose levels were measured by the use of a glucometer(Precision). Serum insulin, leptin, and adiponectin levels were measured
117
A R T I C L E
with RIAs for rat insulin and mouse leptin and adiponectin (Linco Research).Serum lipid concentrations were determined by established assays as pre-viously described (Maeda et al., 2003; Uysal et al., 2000).
Liver and muscle triglycerides, fatty acid analysis, and treatmentsSoleus muscle was carefully dissected from mice to limit fat contamination.Triglyceride in soleus muscle or liver tissue was determined using a com-mercial kit (Determiner TG, Kyoma Medex, Japan). Total lipids were ex-tracted from serum by the method of Dole and Meinertz (1960). Free fattyacids were separated from esterified fatty acids by thin layer chromatogra-phy using silica gel and a mixture of petroleum ether:diethyl ether: aceticacid (80:20:1) as the stationary and mobile phases, respectively. Fatty acidswere methylated by incubation (50°C, 1 hr) with methanol/acetyl chloride(20:1), evaporated, redissolved in isooctane, and separated by gas chroma-tography. Individual fatty acids were identified by comparison to purifiedstandards. C2C12 myoblasts were cultured in DMEM containing 10% fetalbovine serum, and differentiation was induced by DMEM supplementedwith 2% horse serum. Cells were treated with fatty acids, as described(Chavez and Summers, 2003). On day 4 of differentiation, cells were incu-bated with indicated fatty acid (0.75 mM in DMEM with 1% FBS, 2% BSA)for 20 hr. Cells were changed into serum-free medium containing the samefatty acid 4 hr prior to experiment and then treated with or without insulin(100 nM, 10 min). L6 cells were cultured and differentiated as described(Tong et al., 2001) and treated with fatty acids on day 7. Fao cells main-tained in DMEM with 10% FBS were washed with PBS twice and treatedwith free fatty acids in DMEM with 2% BSA for 24 hr.
Fatty acid binding and uptake assayFA binding activity was determined as described (Glatz and Veerkamp,1983) using Lipidex. The detailed protocol is provided in the SupplementalData. For uptake experiments, epididymal fat pads from five to six 12-week-old mice were collected and digested with collagenase. The floating adipo-cytes were washed three times with Krebs-Ringer phosphate isolationbuffer containing 20 mM HEPES (pH 7.4), 2.5% BSA, 200 µM adenosine,and 5 mM glucose. Cell suspension (200 µl) was incubated with 3H-labeledlauric, myristic, palmitic, or stearic acid at a final concentration of 100 µMat 37°C for 30 min. Following the incubation, the uptake was terminated byadding ice-cold stop solution containing 0.1% BSA and 200 µM phloretinin isolation buffer. The cell suspension was then transferred onto a What-man glass filter and washed three times with ice-cold PBS. The radioactivityof the filters was measured by a liquid scintillation counter.
Glucose uptake, AMP-K enzyme activity, and fatty acid oxidationGlucose uptake assays in muscle strips and primary adipocytes were per-formed as described (Abel et al., 2001; Bruning et al., 1998). For AMP-Kenzyme assay, mice were housed in individual cages and, 5 days beforethe experiment, indwelling catheters were implanted into the jugular vein.Injection of leptin or saline was initiated from 9 to 10 a.m. (lights on, 6a.m.). Food and water were available during the experiments. Recombinantmurine leptin (1 mg/kg body weight) (Peprotech) was injected intravenouslythrough the jugular vein catheter in mice anesthetized with ketamine (40mg/kg) and xylazine (5 mg/kg) solution. Control mice received the samevolume of saline. After the mice were sacrificed, skeletal muscles wererapidly dissected and frozen in liquid nitrogen. To measure isoform-specificAMP-K activity, AMP-K was immunoprecipitated from muscle lysates (100�g of protein) with specific antibodies against the α1 or α2 catalytic sub-units (gift of Dr. Carling) bound to protein G-Sepharose beads. Kinase activ-ity was measured using synthetic “SAMS” peptide and [γ-32P]-ATP, as de-scribed (Minokoshi et al., 2002). Fatty acid oxidation activity in muscle wasdetermined by a previously described method (Kaushik et al., 2001) withmodifications, which is detailed in the Supplemental Data.
SCD activity, immunoblotting, and gene expression analysisSCD activity was determined from the production of 3H2O using [9, 10-3H]-stearoyl-CoA as substrate (Gomez et al., 2002). Tissues were homogenized,and the microsomal fractions (105,000 × g) were isolated by sequential cen-trifugations. Reactions were performed at 37°C for 30 min with 100 µg/mLprotein homogenate, 10 µM (2 uCi/mL) of [9, 10-3H]-stearoyl-CoA (AmericanRadiolabeled Chemicals Inc.), and 30 µM NADH in 100 µl of 10 mM potas-sium phosphate buffer (pH 7.4). After the reaction, 100 µl of 10 mg/mL fatty
118
acid-free BSA (Sigma) and 200 µl of 10% trichloroacetic acid were addedand then mixed. After centrifugation (5000 × g, 10 min), radioactive countsin the supernatant were measured by a scintillation counter. The enzymeactivity was expressed as nmol min−1 mg−1 protein. FABP proteins weredetected by immunoblotting with antisera raised against full-length humanmal1 and aP2 in adipose tissue extracts prepared as described (Scheja etal., 1999). Phosphorylation of the α subunit of AMP-K in soleus lysateswas determined with gradient SDS-PAGE gels using an antibody againstphosphopeptides based on the amino acid sequence surrounding Thr172of either α1 and α2 isoforms of the catalytic subunit of AMP-K (Cell Signal-ing). Protein levels of AMP-K were determined using an antibody for bothα1 and α2 subunits of AMP-K (Cell Signaling). AKT and phospho-AKT anti-bodies were purchased from Cell Signaling. RNA extraction and gene ex-pression studies are detailed in the Supplemental Data.
Statistical analysisAll numerical data were expressed as mean, and error bars represent theSEM. Two-tailed, two-sample, unequal variance Student’s t tests were usedto assess statistical significance where p < 0.05 was the accepted level ofstatistical significance.
Supplemental dataSupplemental Data include one figure, two tables, Supplemental Experi-mental Procedures, and Supplemental References and can be found withthis article online at http://www.cellmetabolism.org/cgi/content/full/1/2/107/DC1/.
Acknowledgments
This work was supported in part by grants from NIH (DK64360 to G.S.H.and DK56116 and DK57521 to B.B.K.) and Pew Foundation and AmericanDiabetes Association (G.S.H.). K.M. is recipient of a fellowship from ManpeiSuzuki Diabetes Foundation, H.C. is recipient of a mentor-based fellowshipfrom American Diabetes Association, M.F. is recipient of a fellowship fromthe Japan Society for the Promotion of Science, and Q.C. is supported byNIH training grant T32-DK07703. We thank Laurie Goodyear’s lab for helpin setting up the uptake and oxidation assays in muscle and Franks Sacksand Hannia Campos for help in fatty acid composition analysis. H.M., B.K.,and R.A.P. are employed by a for profit company developing drugs for dia-betes.
Received: July 23, 2004Revised: November 23, 2004Accepted: December 22, 2004Published: February 15, 2005
References
Abel, E.D., Peroni, O., Kim, J.K., Kim, Y.B., Boss, O., Hadro, E., Minnemann,T., Shulman, G.I., and Kahn, B.B. (2001). Adipose-selective targeting of theGLUT4 gene impairs insulin action in muscle and liver. Nature 409, 729–733.
Arita, Y., Kihara, S., Ouchi, N., Takahashi, M., Maeda, K., Miyagawa, J.,Hotta, K., Shimomura, I., Nakamura, T., Miyaoka, K., et al. (1999). Paradoxi-cal decrease of an adipose-specific protein, adiponectin, in obesity. Bio-chem. Biophys. Res. Commun. 257, 79–83.
Bernlohr, D.A., Coe, N.R., and LiCata, V.J. (1999). Fatty acid trafficking inthe adipocyte. Semin. Cell Dev. Biol. 10, 43–49.
Boord, J.B., Maeda, K., Makowski, L., Babaev, V.R., Fazio, S., Linton, M.F.,and Hotamisligil, G.S. (2002). Adipocyte fatty acid-binding protein, aP2, al-ters late atherosclerotic lesion formation in severe hypercholesterolemia.Arterioscler. Thromb. Vasc. Biol. 22, 1686–1691.
Boord, J.B., Maeda, K., Makowski, L., Babaev, V.R., Fazio, S., Linton, M.F.,and Hotamisligil, G.S. (2004). Combined adipocyte-macrophage fatty acid-binding protein deficiency improves metabolism, atherosclerosis, and sur-vival in apolipoprotein E-deficient mice. Circulation 110, 1492–1498.
CELL METABOLISM : FEBRUARY 2005

Fatty Acid Binding Proteins and Metabolic Syndrome
Bruning, J.C., Michael, M.D., Winnay, J.N., Hayashi, T., Horsch, D., Accili,D., Goodyear, L.J., and Kahn, C.R. (1998). A muscle-specific insulin recep-tor knockout exhibits features of the metabolic syndrome of NIDDM withoutaltering glucose tolerance. Mol. Cell 2, 559–569.
Chavez, J.A., and Summers, S.A. (2003). Characterizing the effects of satu-rated fatty acids on insulin signaling and ceramide and diacylglycerol accu-mulation in 3T3-L1 adipocytes and C2C12 myotubes. Arch. Biochem. Bio-phys. 419, 101–109.
Cohen, P., Miyazaki, M., Socci, N.D., Hagge-Greenberg, A., Liedtke, W.,Soukas, A.A., Sharma, R., Hudgins, L.C., Ntambi, J.M., and Friedman, J.M.(2002). Role for stearoyl-CoA desaturase-1 in leptin-mediated weight loss.Science 297, 240–243.
Dole, V.P., and Meinertz, H. (1960). Microdetermination of long-chain fattyacids in plasma and tissues. J. Biol. Chem. 235, 2595–2599.
Flegal, K.M., Carroll, M.D., Kuczmarski, R.J., and Johnson, C.L. (1998).Overweight and obesity in the United States: prevalence and trends, 1960–1994. Int. J. Obes. Relat. Metab. Disord. 22, 39–47.
Friedman, J.M., and Halaas, J.L. (1998). Leptin and the regulation of bodyweight in mammals. Nature 395, 763–770.
Fruebis, J., Tsao, T.S., Javorschi, S., Ebbets-Reed, D., Erickson, M.R., Yen,F.T., Bihain, B.E., and Lodish, H.F. (2001). Proteolytic cleavage product of30-kDa adipocyte complement-related protein increases fatty acid oxida-tion in muscle and causes weight loss in mice. Proc. Natl. Acad. Sci. USA98, 2005–2010.
Glatz, J.F., and Veerkamp, J.H. (1983). A radiochemical procedure for theassay of fatty acid binding by proteins. Anal. Biochem. 132, 89–95.
Gomez, F.E., Miyazaki, M., Kim, Y.C., Marwah, P., Lardy, H.A., Ntambi, J.M.,and Fox, B.G. (2002). Molecular differences caused by differentiation of3T3-L1 preadipocytes in the presence of either dehydroepiandrosterone(DHEA) or 7-oxo-DHEA. Biochemistry 41, 5473–5482.
Hirosumi, J., Tuncman, G., Chang, L., Gorgun, C.Z., Uysal, K.T., Maeda, K.,Karin, M., and Hotamisligil, G.S. (2002). A central role for JNK in obesityand insulin resistance. Nature 420, 333–336.
Hotamisligil, G.S., Johnson, R.S., Distel, R.J., Ellis, R., Papaioannou, V.E.,and Spiegelman, B.M. (1996). Uncoupling of obesity from insulin resistancethrough a targeted mutation in aP2, the adipocyte fatty acid binding protein.Science 274, 1377–1379.
Kaushik, V.K., Young, M.E., Dean, D.J., Kurowski, T.G., Saha, A.K., and Rud-erman, N.B. (2001). Regulation of fatty acid oxidation and glucose metabo-lism in rat soleus muscle: effects of AICAR. Am. J. Physiol. Endocrinol.Metab. 281, E335–E340.
Maeda, K., Uysal, K.T., Makowski, L., Gorgun, C.Z., Atsumi, G., Parker, R.A.,Bruning, J., Hertzel, A.V., Bernlohr, D.A., and Hotamisligil, G.S. (2003). Roleof the fatty acid binding protein mal1 in obesity and insulin resistance. Dia-betes 52, 300–307.
Makowski, L., Boord, J.B., Maeda, K., Babaev, V.R., Uysal, K.T., Morgan,M.A., Parker, R.A., Suttles, J., Fazio, S., Hotamisligil, G.S., and Linton, M.F.(2001). Lack of macrophage fatty-acid-binding protein aP2 protects micedeficient in apolipoprotein E against atherosclerosis. Nat. Med. 7, 699–705.
Matsuzawa, Y., Funahashi, T., and Nakamura, T. (1999). Molecular mecha-nism of metabolic syndrome X: contribution of adipocytokines adipocyte-derived bioactive substances. Ann. N Y Acad. Sci. 892, 146–154.
Minokoshi, Y., Kim, Y.B., Peroni, O.D., Fryer, L.G., Muller, C., Carling, D.,and Kahn, B.B. (2002). Leptin stimulates fatty-acid oxidation by activatingAMP-activated protein kinase. Nature 415, 339–343.
Muoio, D.M., Dohm, G.L., Fiedorek, F.T., Jr., Tapscott, E.B., Coleman, R.A.,and Dohn, G.L. (1997). Leptin directly alters lipid partitioning in skeletalmuscle. Diabetes 46, 1360–1363.
CELL METABOLISM : FEBRUARY 2005
Ozcan, U., Cao, Q., Yilmaz, E., Lee, A.H., Iwakoshi, N.N., Ozdelen, E., Tunc-man, G., Gorgun, C., Glimcher, L.H., and Hotamisligil, G.S. (2004). Endo-plasmic reticulum stress links obesity, insulin action, and type 2 diabetes.Science 306, 457–461.
Razani, B., Combs, T.P., Wang, X.B., Frank, P.G., Park, D.S., Russell, R.G.,Li, M., Tang, B., Jelicks, L.A., Scherer, P.E., and Lisanti, M.P. (2002). Caveo-lin-1-deficient mice are lean, resistant to diet-induced obesity, and showhypertriglyceridemia with adipocyte abnormalities. J. Biol. Chem. 277,8635–8647.
Saltiel, A.R. (2001). New perspectives into the molecular pathogenesis andtreatment of type 2 diabetes. Cell 104, 517–529.
Scheja, L., Makowski, L., Uysal, K.T., Wiesbrock, S.M., Shimshek, D.R.,Meyers, D.S., Morgan, M., Parker, R.A., and Hotamisligil, G.S. (1999). Al-tered insulin secretion associated with reduced lipolytic efficiency in aP2−/−mice. Diabetes 48, 1987–1994.
Sethi, J.K., and Hotamisligil, G.S. (1999). The role of TNF alpha in adipocytemetabolism. Semin. Cell Dev. Biol. 10, 19–29.
Shimano, H., Shimomura, I., Hammer, R.E., Herz, J., Goldstein, J.L., Brown,M.S., and Horton, J.D. (1997). Elevated levels of SREBP-2 and cholesterolsynthesis in livers of mice homozygous for a targeted disruption of theSREBP-1 gene. J. Clin. Invest. 100, 2115–2124.
Shulman, G.I. (2000). Cellular mechanisms of insulin resistance. J. Clin. In-vest. 106, 171–176.
Sjogren, K., Hellberg, N., Bohlooly, Y.M., Savendahl, L., Johansson, M.S.,Berglindh, T., Bosaeus, I., and Ohlsson, C. (2001). Body fat content can bepredicted in vivo in mice using a modified dual-energy X-ray absorptiometrytechnique. J. Nutr. 131, 2963–2966.
Skyler, J.S., and Oddo, C. (2002). Diabetes trends in the USA. DiabetesMetab. Res. Rev. 131, S21–S26.
Soukas, A., Cohen, P., Socci, N.D., and Friedman, J.M. (2000). Leptin-spe-cific patterns of gene expression in white adipose tissue. Genes Dev. 14,963–980.
Spiegelman, B.M., and Flier, J.S. (2001). Obesity and the regulation of en-ergy balance. Cell 104, 531–543.
Tilg, H., and Diehl, A.M. (2000). Cytokines in alcoholic and nonalcoholicsteatohepatitis. N. Engl. J. Med. 343, 1467–1476.
Tong, P., Khayat, Z.A., Huang, C., Patel, N., Ueyama, A., and Klip, A. (2001).Insulin-induced cortical actin remodeling promotes GLUT4 insertion at mus-cle cell membrane ruffles. J. Clin. Invest. 108, 371–381.
Uysal, K.T., Wiesbrock, S.M., Marino, M.W., and Hotamisligil, G.S. (1997).Protection from obesity-induced insulin resistance in mice lacking TNF-alpha function. Nature 389, 610–614.
Uysal, K.T., Scheja, L., Wiesbrock, S.M., Bonner-Weir, S., and Hotamisligil,G.S. (2000). Improved glucose and lipid metabolism in genetically obesemice lacking aP2. Endocrinology 141, 3388–3396.
Winder, W.W., and Hardie, D.G. (1999). AMP-activated protein kinase, ametabolic master switch: possible roles in type 2 diabetes. Am. J. Physiol.277, E1–10.
Yamauchi, T., Kamon, J., Waki, H., Terauchi, Y., Kubota, N., Hara, K., Mori,Y., Ide, T., Murakami, K., Tsuboyama-Kasaoka, N., et al. (2001). The fat-derived hormone adiponectin reverses insulin resistance associated withboth lipoatrophy and obesity. Nat. Med. 7, 941–946.
Yuan, M., Konstantopoulos, N., Lee, J., Hansen, L., Li, Z.W., Karin, M., andShoelson, S.E. (2001). Reversal of obesity- and diet-induced insulin resis-tance with salicylates or targeted disruption of Ikkbeta. Science 293,1673–1677.
Zimmet, P., Alberti, K.G., and Shaw, J. (2001). Global and societal implica-tions of the diabetes epidemic. Nature 414, 782–787.
119