Embed Size (px)
Citation preview

Transportation Issues:Results from a Preliminary Survey
Adele Crudden and Michele McDonnall

Objectives:After participating in this session participants will be able to: Paraphrase current knowledge about
transportation barriers for people who are blind/visually impaired
Compare results from a transportation survey of persons who are blind/visually impaired to their personal experiences
Have a greater understanding of the limits of current research about transportation

Transportation BarriersEven with the ADA, transportation barriers exist Public transportation is limited or
inaccessible in some areas Small percentage benefit from adaptive
technology Orientation and mobility skills are important Awareness of options
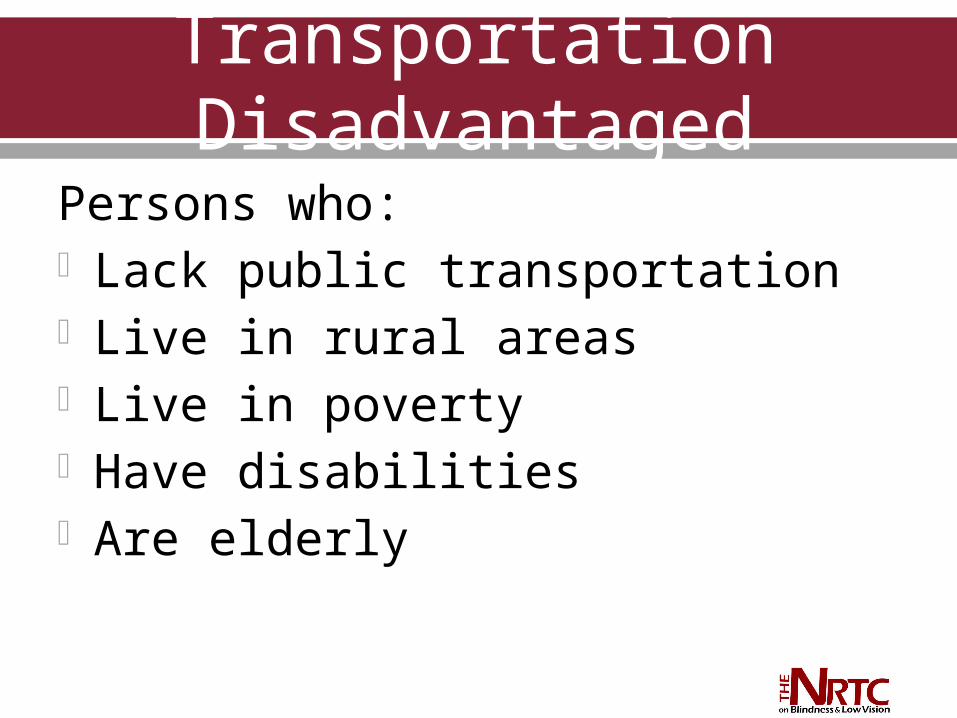
Transportation Disadvantaged
Persons who: Lack public transportation Live in rural areas Live in poverty Have disabilities Are elderly

Rural Issues: 40% in rural areas have no public
transportation• of those who do, 25% have minimal
services
Persons with disabilities comprise greater percentages in rural areas
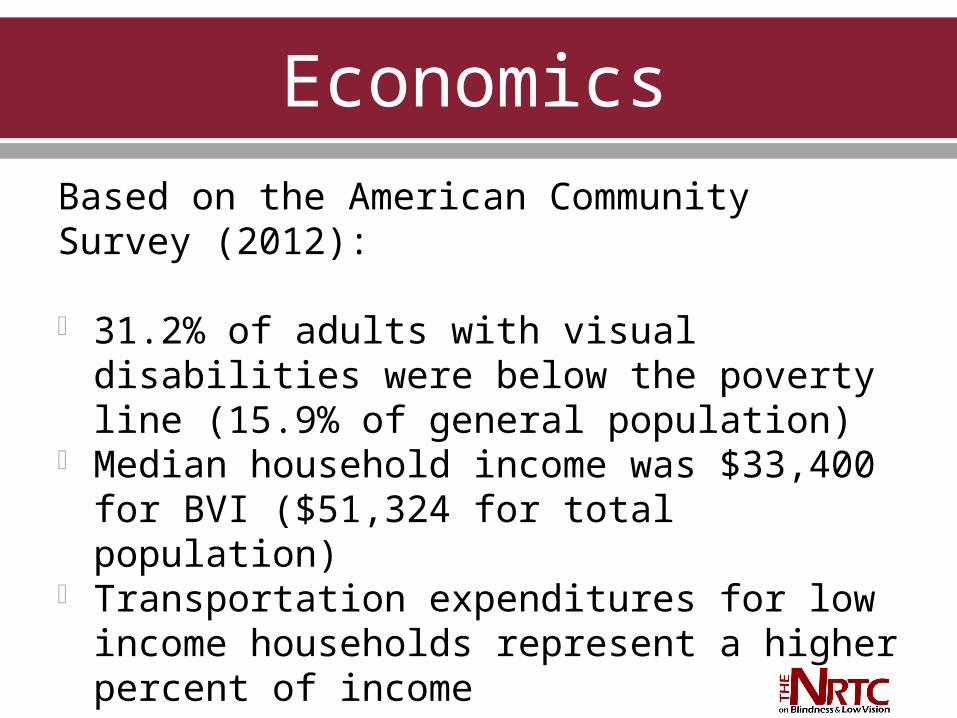
EconomicsBased on the American Community Survey (2012):
31.2% of adults with visual disabilities were below the poverty line (15.9% of general population)
Median household income was $33,400 for BVI ($51,324 for total population)
Transportation expenditures for low income households represent a higher percent of income

Vocational Rehabilitation Strategies Provide O&M training Reimburse for defined period Discuss importance of reliable
transportation Provide information about local
options Assist with paratransit applications
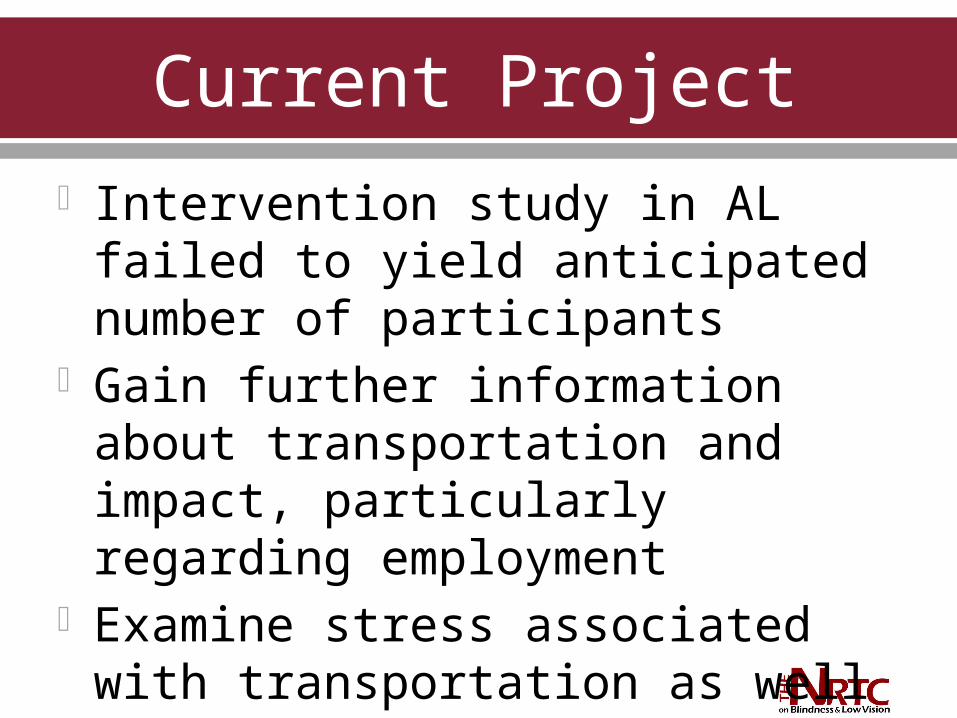
Current Project Intervention study in AL failed to yield
anticipated number of participants Gain further information about
transportation and impact, particularly regarding employment
Examine stress associated with transportation as well as availability

NRTC Transportation Survey Disseminated to NRTC Participant
Registry Useable pool of 142 persons $25 gift card to participants Modified survey disseminated to
larger audience

Limitations Not a representative sample Issues with technology Some missing data Self report
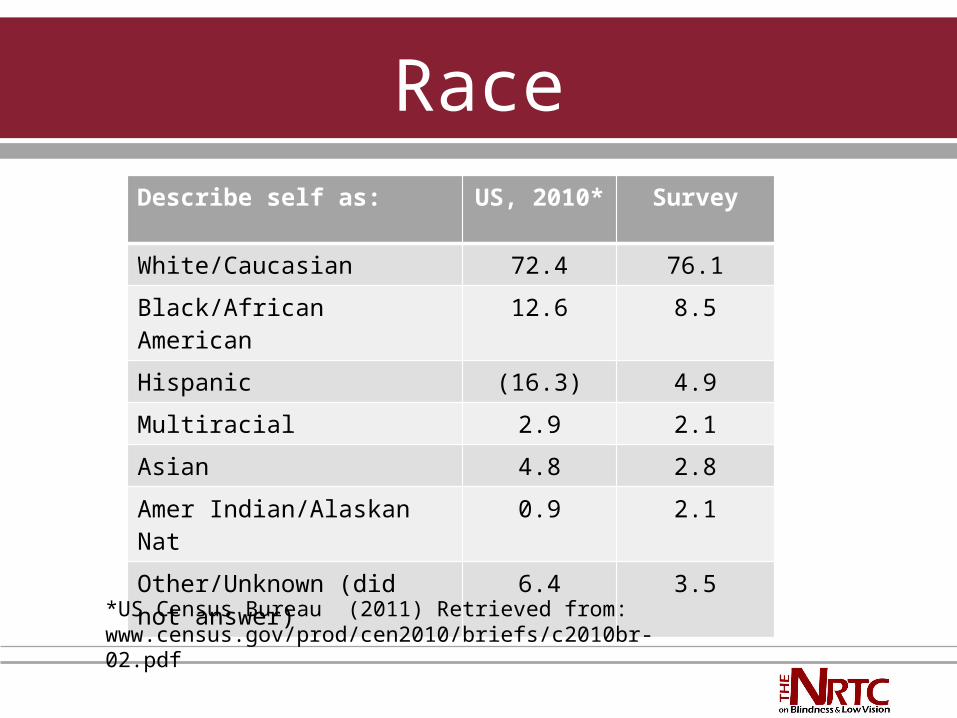
RaceDescribe self as: US, 2010* Survey
White/Caucasian 72.4 76.1
Black/African American 12.6 8.5
Hispanic (16.3) 4.9
Multiracial 2.9 2.1
Asian 4.8 2.8
Amer Indian/Alaskan Nat 0.9 2.1
Other/Unknown (did not answer)
6.4 3.5
*US Census Bureau (2011) Retrieved from: www.census.gov/prod/cen2010/briefs/c2010br-02.pdf
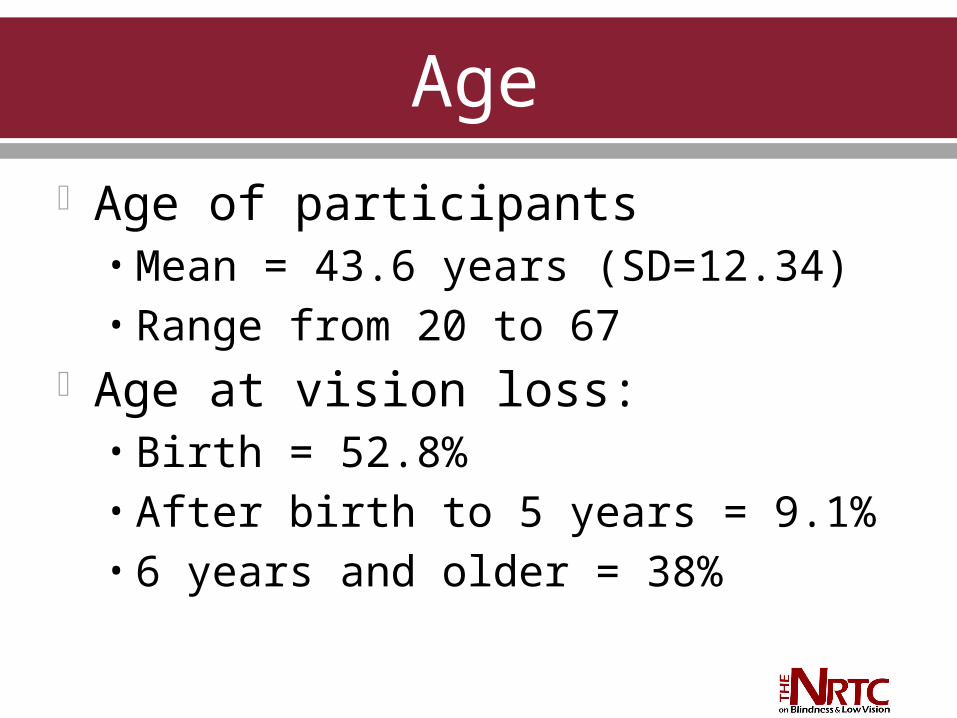
Age Age of participants
• Mean = 43.6 years (SD=12.34)• Range from 20 to 67
Age at vision loss: • Birth = 52.8%• After birth to 5 years = 9.1%• 6 years and older = 38%

Level of Vision Loss Totally blind = 37.3% Legally blind = 54.2% Less severe VI = 8.5%
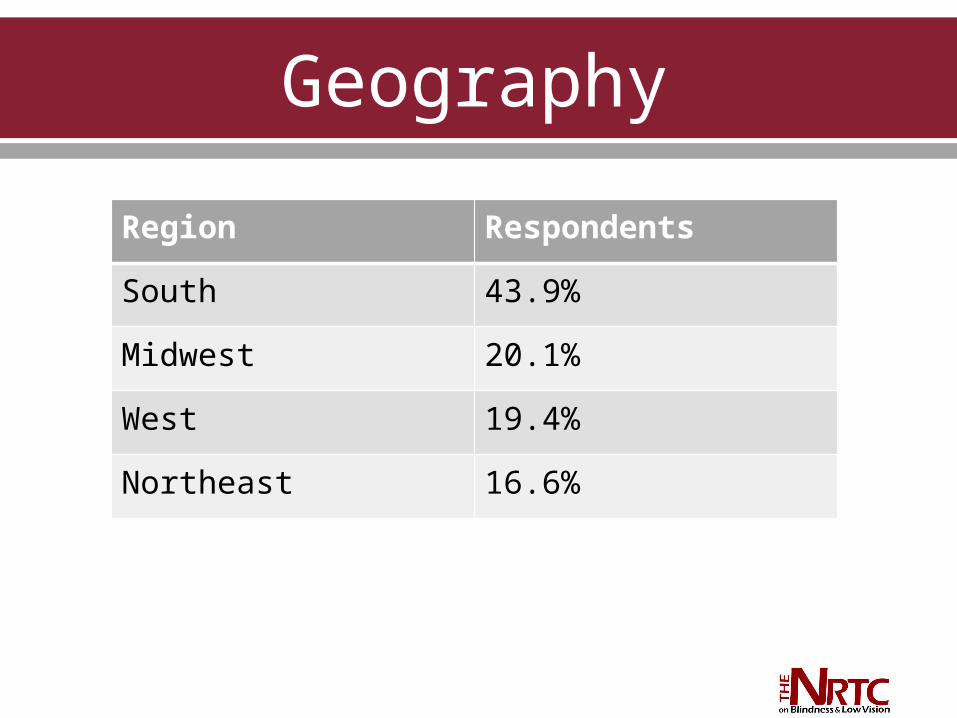
Geography
Region Respondents
South 43.9%
Midwest 20.1%
West 19.4%
Northeast 16.6%

Income
Income Ranges US 2012* (see note)
Survey Respondents
Less than $25,000
24.7 33.1
Between $25,001 - $50,000
24.3 26.1
Between $50,001 - $75,000
17.5 16.9
$75,001 - $100,000
11.7 6.3
Over $100,001 22 4.9
Missing (chose not to answer)
12.7

Living Situation
Residence Respondents
Spouse or partner 45.1%
Alone 34.5%
Other adult(s) 6.3%
Adult children 5.6%
Other family 18.3%
Could select more than one.
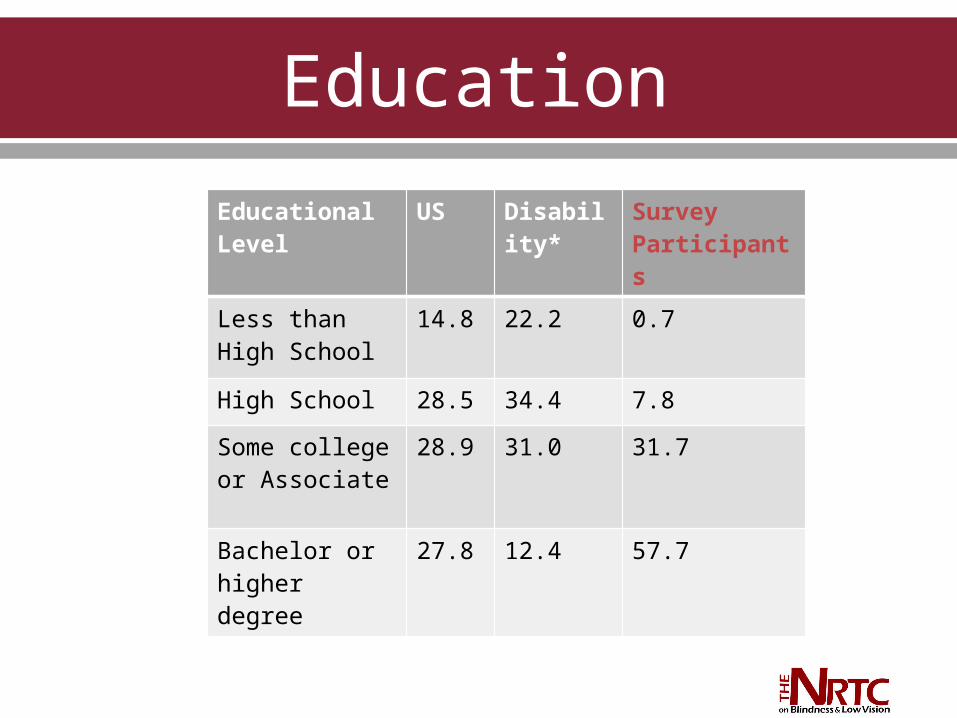
Education
EducationalLevel
US Disability*
Survey Participants
Less thanHigh School
14.8 22.2 0.7
High School 28.5 34.4 7.8
Some college or Associate
28.9 31.0 31.7
Bachelor or higher degree
27.8 12.4 57.7

Travel 75.4% white cane users 24.7% guide dog users 18.3% use neither 16.2% use other (wayfinding devices)
Vocational Rehabilitation 69% received VR services Of those, 20.6% said the VR agency
assisted in locating transportation to and from work
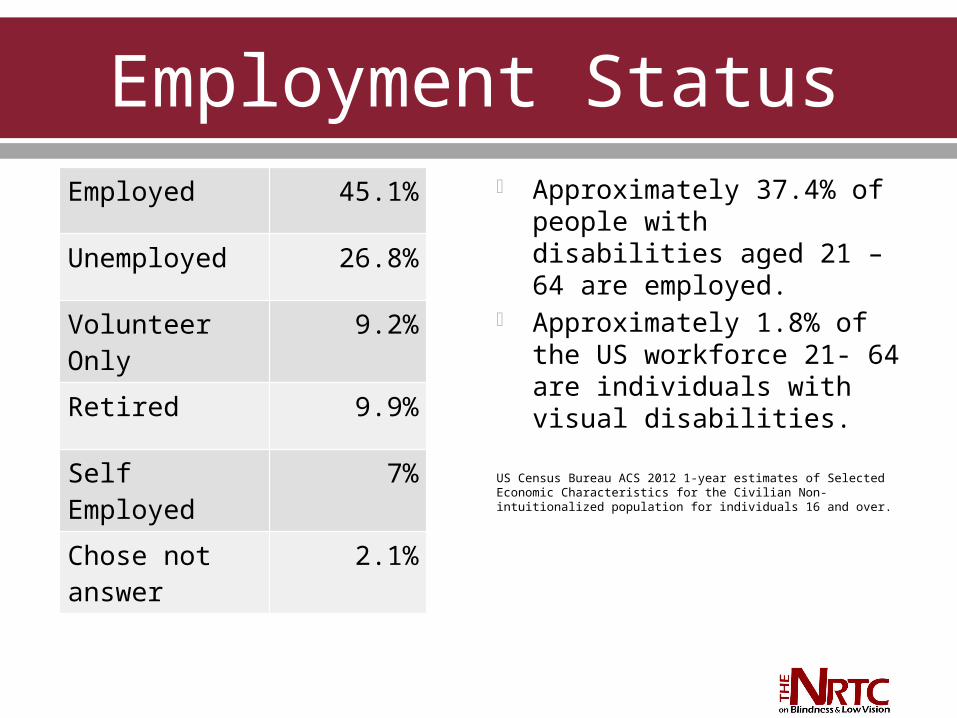
Employment StatusEmployed 45.1%
Unemployed 26.8%
Volunteer Only 9.2%
Retired 9.9%
Self Employed 7%
Chose not answer
2.1%
Approximately 37.4% of people with disabilities aged 21 – 64 are employed.
Approximately 1.8% of the US workforce 21- 64 are individuals with visual disabilities.
US Census Bureau ACS 2012 1-year estimates of Selected Economic Characteristics for the Civilian Non-intuitionalized population for individuals 16 and over.

Employment BarriersBarrier % Experienced
Employer discrimination/negative attitude
55.6
Lack of accommodations/AT 46.5
Lack of jobs 44.4
Lack of jobs with adequate pay 35.2
Potential loss of benefits 35.2
Difficulty with travel skills 20.4
Low expectations of rehab counselor 20.4
Lack of needed VR services 19.7
Disagreements with rehab counselor 16.9
Lack of skills or abilities for job 13.4

Work TransportationMethod How do you
typically get to work?
Public Transportation 34.5
Walk 21.8
Paratransit 20.7
Spouse/family member 17.2
Cab/taxi 11.5
Volunteer Driver 10.3
Carpool 8.1
Hired Driver 3.5
Work at home 20.7

How satisfied are you with how you get to work? (scale from 0 to 10)
• 23% (0 to 3) Dissatisfied• 43.7% (4 to 6) Neutral• 33.3% (7 to10) Satisfied
34.3% have turned down a job because of transportation concerns
Work Transportation Satisfaction

Public Transportation 75% had public transportation available 57.7% used public transportation one or
more times per week in the last year 76.7% were very or somewhat
comfortable using public transportation 93.9% who do not have public
transportation would use it if available 82.3% have used paratransit

Public Transportation cont. 11% were very or somewhat
uncomfortable using public transportation
Reasons not used:• Inconvenience – 66.7%• Difficulty getting to destination –
58.3%• Poor shelter from weather while
waiting – 33.3%

Orientation & Mobility 78.9% Received O & M services
Received training in use of bus, train, or subway
Respondents
YES 78.3
No, declined it 3.8
No, not available 17.9
Transportation Availability
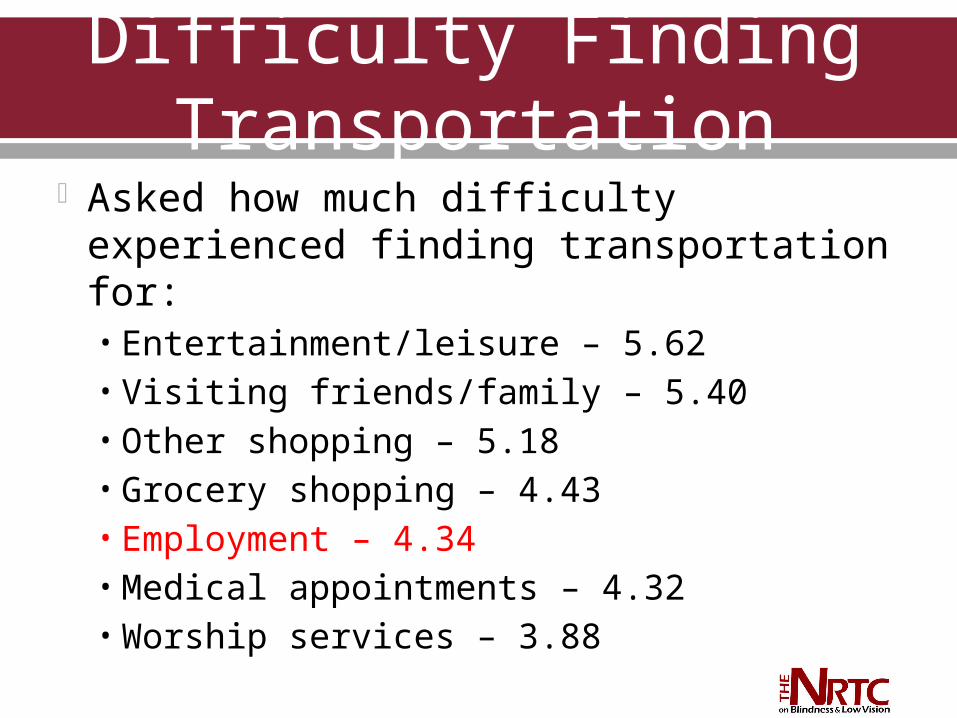
Difficulty Finding Transportation Asked how much difficulty experienced
finding transportation for:• Entertainment/leisure – 5.62• Visiting friends/family – 5.40• Other shopping – 5.18• Grocery shopping – 4.43• Employment – 4.34• Medical appointments – 4.32• Worship services – 3.88

Lack of Transportation LimitsActivity Respondent %
Entertainment/Leisure activities 68.8
Visiting friends or family 66.7
Other shopping (not groceries) 55.8
Employment 48.0
Volunteer activities 44.2
Grocery shopping 41.3
Transportation Stress

Stress Using Transportation Asked how stressful it is to use
transportation for the same activities• Entertainment/leisure – 4.74• Visiting friends/family – 4.59• Other shopping – 4.45• Medical appointments – 4.11• Employment – 4.06• Grocery shopping – 3.77• Worship services – 3.15

Transportation Stress Limits Activity Respondent %
Entertainment/Leisure activities 54.9
Visiting family/friends 47.9
Other shopping (not groceries) 45.1
Grocery shopping 37.3
Medical appointments 32.4
Employment 31.0
Differences on Difficulty/Stress Do people who are working, have higher
incomes, or have access to public transportation have lower levels of difficulty & stress?
Working vs. not working:• Difficulty finding transportation: only
had differences on employment• Stress using transportation: only had
differences on employment

Differences on Difficulty/Stress Low income (< $25K vs. $25K+):
• Difficulty finding transportation: only had differences on employment
• Stress using transportation: only had differences on employment
Public transportation available:• Difficulty finding transportation:
differences on most• Stress using transportation: differences
on some (visit family/friends & leisure)

Unemployed 36.1% of unemployed persons said
transportation is reason 37.8% have looked for a job in last 4
weeks 27.8% of unemployed believe they
are somewhat or extremely likely to make enough money at a job to afford transportation

If Unemployed Offered a Job 44.1% of those not currently working
report one or more factors would prevent them from accepting a job (even if transportation was not an issue)• 25% - Potential loss of benefits• 14.7% - Poor health or other disability• 10.3% - Difficulty with travel skills• 4.4% - Lack of interest

Drivers Only 7 drivers, 6 had a license 2 use a bioptic device 6 have problems driving at night 4 restrict length of time driving 3 restrict the route

Conclusions
Participants : Were more likely to be working than
general population of people with visual difficulties
Had more difficulty with transportation for factors other than work

Conclusions People who are working have similar
amounts of transportation difficulty/stress as non-workers (other than employment).
People with lower incomes have similar amounts of transportation difficulty/stress as people with higher incomes (other than employment).
Many more differences on difficulty/stress based on access to public transportation.

Reflections Is work related transportation the
problem we think it is? Low percentage get help from VR – is
this surprising? What could VR do? What is best way to uncover and
document work related transportation issues?

Thank You! Adele Crudden: [email protected] Michele McDonnall: [email protected]
Visit our website at: http://www.blind.msstate.edu/