Embed Size (px)
Citation preview
THE UK’S EXIT FROM THE EUROPEAN UNION: NORTHERN IRELAND AND IRELAND – POSITION PAPER
1
Additional Data Paper: Northern Ireland Trade Data and Statistics
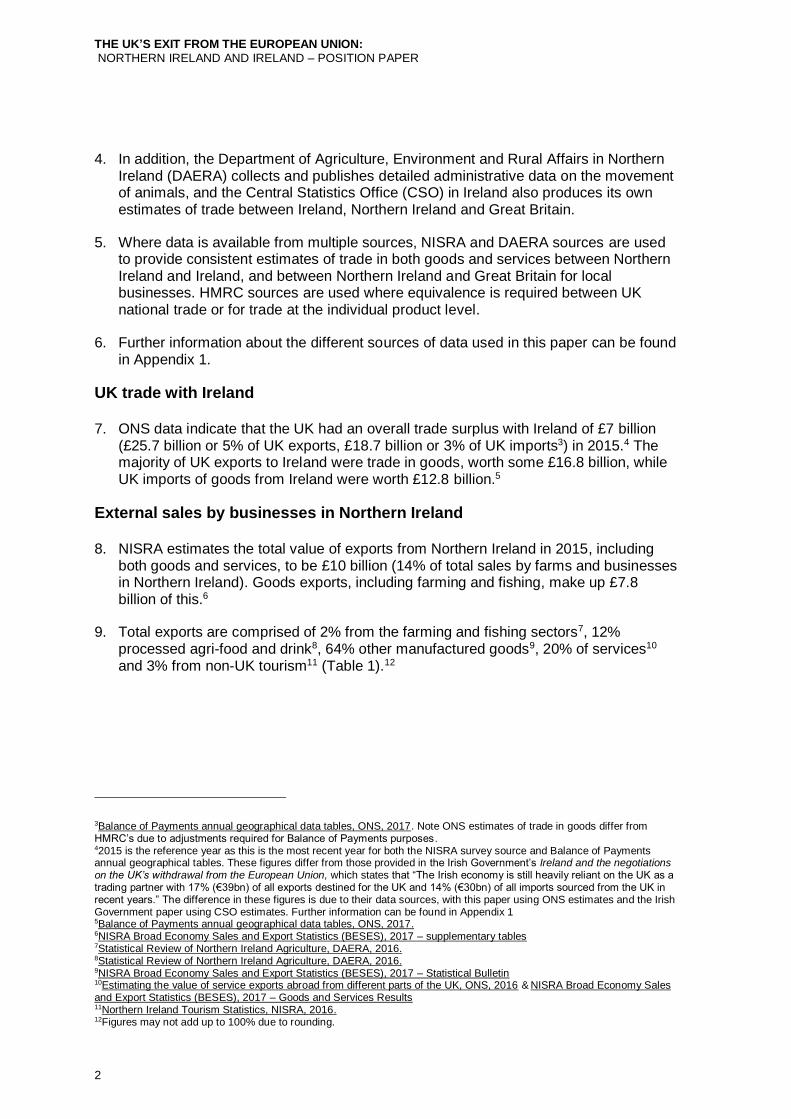
This annex summarises the available trade data and statistics relating to Northern Ireland as of August 2017. It includes:
• Value of trade between Northern Ireland, Ireland and Great Britain
• Characteristics of exporting businesses in Northern Ireland
• Volumes of freight to and from Northern Ireland
• Agriculture and food cross-border supply chains
Summary 1. The United Kingdom (UK) remains the most significant market for businesses in
Northern Ireland – sales to Great Britain were worth one and a half times the value of all Northern Ireland exports and nearly four times the value of exports to Ireland in 2015.1 Nevertheless, the sale of finished products to Great Britain relies upon cross-border trade in raw materials and components within integrated supply chains meaning trade with both Great Britain and Ireland are vital to Northern Ireland’s economy.
2. The trade in higher value finished products is often dependent on lower value, higher volume, cross-border trade earlier in the supply chain. Over 5,000 businesses in Northern Ireland exported goods to Ireland in 2015, one and a half times as many as sold goods to Great Britain, with just over half the businesses exporting goods and services to Ireland employing fewer than 10 people. This dependency on cross-border trade is most notable in the agri-food sector, where exports account for 27% of Northern Ireland food and drink processing sales, and Ireland is the destination for 53% of export sales from the sector.
Data sources
3. There are two main sources of data on trade for Northern Ireland:
• HM Revenue & Customs (HMRC) – HMRC is responsible for collecting the UK's international trade in goods data. Their 'UK Regional Trade Statistics (RTS)' combine UK-wide Intrastat returns and customs declarations with data from Office for National Statistics’ (ONS) Inter-Departmental Business Register to apportion trade to each of the constituent parts of the UK, including Northern Ireland.
• Northern Ireland Statistics & Research Agency (NISRA) – NISRA is responsible for
collecting the Broad Economy Sales and Export Statistics (BESES). BESES provides an experimental measure of local businesses’ domestic, regional and export sales2 to markets outside Northern Ireland and has been gathered through the Northern Ireland Annual Business Inquiry since 2011.
1NISRA Broad Economy Sales and Export Statistics (BESES), 2017 2Only Northern Ireland sales to, or purchases from, outside the UK (i.e. not those with Great Britain) are considered exports or imports.
THE UK’S EXIT FROM THE EUROPEAN UNION: NORTHERN IRELAND AND IRELAND – POSITION PAPER
2
4. In addition, the Department of Agriculture, Environment and Rural Affairs in Northern Ireland (DAERA) collects and publishes detailed administrative data on the movement of animals, and the Central Statistics Office (CSO) in Ireland also produces its own estimates of trade between Ireland, Northern Ireland and Great Britain.
5. Where data is available from multiple sources, NISRA and DAERA sources are used to provide consistent estimates of trade in both goods and services between Northern Ireland and Ireland, and between Northern Ireland and Great Britain for local businesses. HMRC sources are used where equivalence is required between UK national trade or for trade at the individual product level.
6. Further information about the different sources of data used in this paper can be found in Appendix 1.
UK trade with Ireland 7. ONS data indicate that the UK had an overall trade surplus with Ireland of £7 billion
(£25.7 billion or 5% of UK exports, £18.7 billion or 3% of UK imports3) in 2015.4 The majority of UK exports to Ireland were trade in goods, worth some £16.8 billion, while UK imports of goods from Ireland were worth £12.8 billion.5
External sales by businesses in Northern Ireland 8. NISRA estimates the total value of exports from Northern Ireland in 2015, including
both goods and services, to be £10 billion (14% of total sales by farms and businesses in Northern Ireland). Goods exports, including farming and fishing, make up £7.8 billion of this.6
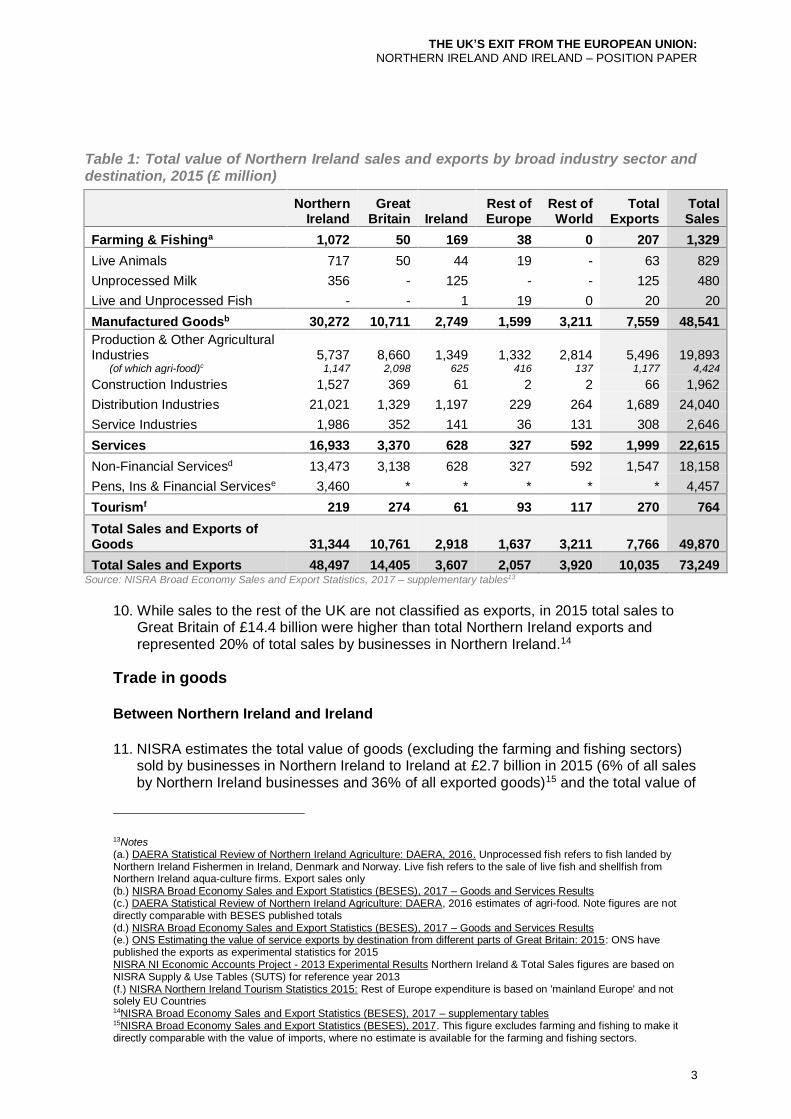
9. Total exports are comprised of 2% from the farming and fishing sectors7, 12% processed agri-food and drink8, 64% other manufactured goods9, 20% of services10 and 3% from non-UK tourism11 (Table 1).12
3Balance of Payments annual geographical data tables, ONS, 2017. Note ONS estimates of trade in goods differ from HMRC’s due to adjustments required for Balance of Payments purposes. 42015 is the reference year as this is the most recent year for both the NISRA survey source and Balance of Payments annual geographical tables. These figures differ from those provided in the Irish Government’s Ireland and the negotiations on the UK’s withdrawal from the European Union, which states that “The Irish economy is still heavily reliant on the UK as a trading partner with 17% (€39bn) of all exports destined for the UK and 14% (€30bn) of all imports sourced from the UK in recent years.” The difference in these figures is due to their data sources, with this paper using ONS estimates and the Irish Government paper using CSO estimates. Further information can be found in Appendix 1 5Balance of Payments annual geographical data tables, ONS, 2017. 6NISRA Broad Economy Sales and Export Statistics (BESES), 2017 – supplementary tables 7Statistical Review of Northern Ireland Agriculture, DAERA, 2016. 8Statistical Review of Northern Ireland Agriculture, DAERA, 2016. 9NISRA Broad Economy Sales and Export Statistics (BESES), 2017 – Statistical Bulletin 10Estimating the value of service exports abroad from different parts of the UK, ONS, 2016 & NISRA Broad Economy Sales and Export Statistics (BESES), 2017 – Goods and Services Results 11Northern Ireland Tourism Statistics, NISRA, 2016. 12Figures may not add up to 100% due to rounding.
THE UK’S EXIT FROM THE EUROPEAN UNION: NORTHERN IRELAND AND IRELAND – POSITION PAPER
3
Table 1: Total value of Northern Ireland sales and exports by broad industry sector and destination, 2015 (£ million)
Northern Ireland
Great Britain Ireland
Rest of Europe
Rest of World
Total Exports
Total Sales
Farming & Fishinga 1,072 50 169 38 0 207 1,329
Live Animals 717 50 44 19 - 63 829
Unprocessed Milk 356 - 125 - - 125 480
Live and Unprocessed Fish - - 1 19 0 20 20
Manufactured Goodsb 30,272 10,711 2,749 1,599 3,211 7,559 48,541
Production & Other Agricultural Industries 5,737 8,660 1,349 1,332 2,814 5,496 19,893 (of which agri-food)c 1,147 2,098 625 416 137 1,177 4,424
Construction Industries 1,527 369 61 2 2 66 1,962
Distribution Industries 21,021 1,329 1,197 229 264 1,689 24,040
Service Industries 1,986 352 141 36 131 308 2,646
Services 16,933 3,370 628 327 592 1,999 22,615
Non-Financial Servicesd 13,473 3,138 628 327 592 1,547 18,158
Pens, Ins & Financial Servicese 3,460 * * * * * 4,457
Tourismf 219 274 61 93 117 270 764
Total Sales and Exports of Goods 31,344 10,761 2,918 1,637 3,211 7,766 49,870
Total Sales and Exports 48,497 14,405 3,607 2,057 3,920 10,035 73,249 Source: NISRA Broad Economy Sales and Export Statistics, 2017 – supplementary tables13
10. While sales to the rest of the UK are not classified as exports, in 2015 total sales to Great Britain of £14.4 billion were higher than total Northern Ireland exports and represented 20% of total sales by businesses in Northern Ireland.14
Trade in goods Between Northern Ireland and Ireland
11. NISRA estimates the total value of goods (excluding the farming and fishing sectors)
sold by businesses in Northern Ireland to Ireland at £2.7 billion in 2015 (6% of all sales by Northern Ireland businesses and 36% of all exported goods)15 and the total value of
13Notes (a.) DAERA Statistical Review of Northern Ireland Agriculture: DAERA, 2016. Unprocessed fish refers to fish landed by Northern Ireland Fishermen in Ireland, Denmark and Norway. Live fish refers to the sale of live fish and shellfish from Northern Ireland aqua-culture firms. Export sales only (b.) NISRA Broad Economy Sales and Export Statistics (BESES), 2017 – Goods and Services Results (c.) DAERA Statistical Review of Northern Ireland Agriculture: DAERA, 2016 estimates of agri-food. Note figures are not directly comparable with BESES published totals (d.) NISRA Broad Economy Sales and Export Statistics (BESES), 2017 – Goods and Services Results (e.) ONS Estimating the value of service exports by destination from different parts of Great Britain: 2015: ONS have published the exports as experimental statistics for 2015 NISRA NI Economic Accounts Project - 2013 Experimental Results Northern Ireland & Total Sales figures are based on NISRA Supply & Use Tables (SUTS) for reference year 2013 (f.) NISRA Northern Ireland Tourism Statistics 2015: Rest of Europe expenditure is based on 'mainland Europe' and not solely EU Countries 14NISRA Broad Economy Sales and Export Statistics (BESES), 2017 – supplementary tables 15NISRA Broad Economy Sales and Export Statistics (BESES), 2017. This figure excludes farming and fishing to make it directly comparable with the value of imports, where no estimate is available for the farming and fishing sectors.
THE UK’S EXIT FROM THE EUROPEAN UNION: NORTHERN IRELAND AND IRELAND – POSITION PAPER
4
goods imported from Ireland at £1.8 billion over the same period.16 The value of exports to Ireland has remained fairly stable over the period between 2011 and 2015, fluctuating between a peak of £3 billion in 2013 and a low of £2.7 billion in 2015.17
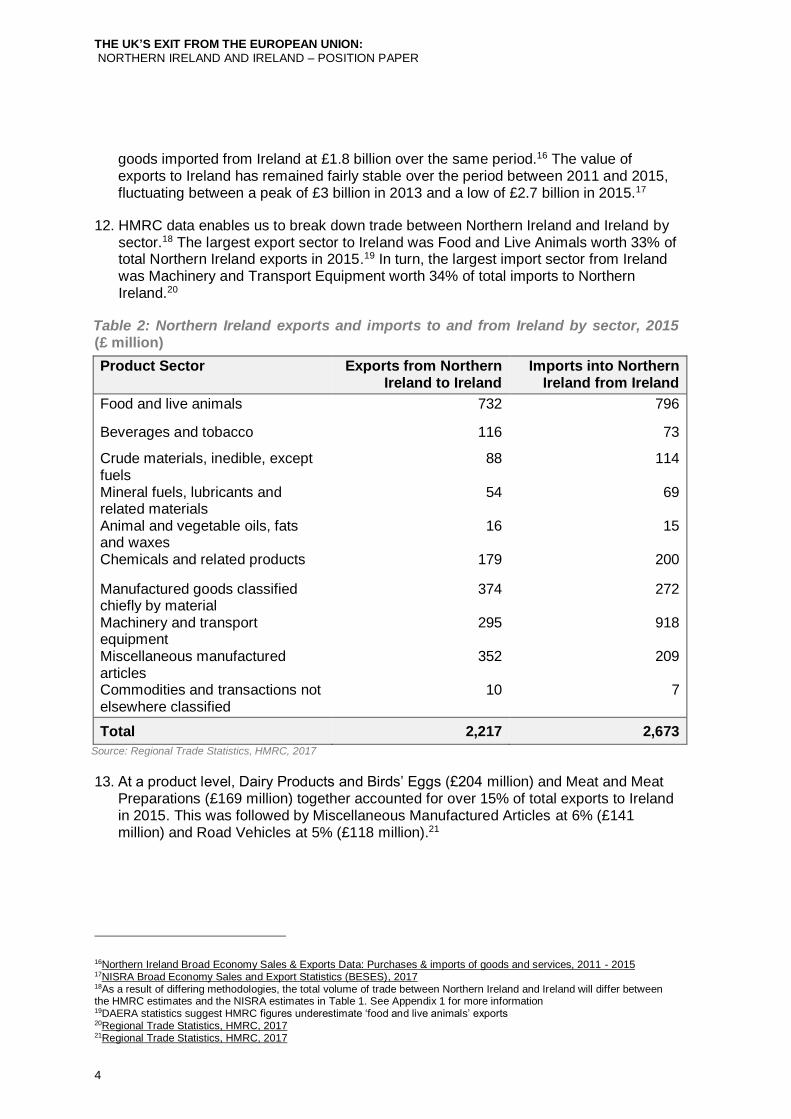
12. HMRC data enables us to break down trade between Northern Ireland and Ireland by sector.18 The largest export sector to Ireland was Food and Live Animals worth 33% of total Northern Ireland exports in 2015.19 In turn, the largest import sector from Ireland was Machinery and Transport Equipment worth 34% of total imports to Northern Ireland.20
Table 2: Northern Ireland exports and imports to and from Ireland by sector, 2015 (£ million)
Product Sector Exports from Northern Ireland to Ireland
Imports into Northern Ireland from Ireland
Food and live animals 732 796
Beverages and tobacco 116 73
Crude materials, inedible, except fuels
88 114
Mineral fuels, lubricants and related materials
54 69
Animal and vegetable oils, fats and waxes
16 15
Chemicals and related products 179 200
Manufactured goods classified chiefly by material
374 272
Machinery and transport equipment
295 918
Miscellaneous manufactured articles
352 209
Commodities and transactions not elsewhere classified
10 7
Total 2,217 2,673
Source: Regional Trade Statistics, HMRC, 2017
13. At a product level, Dairy Products and Birds’ Eggs (£204 million) and Meat and Meat Preparations (£169 million) together accounted for over 15% of total exports to Ireland in 2015. This was followed by Miscellaneous Manufactured Articles at 6% (£141 million) and Road Vehicles at 5% (£118 million).21
16Northern Ireland Broad Economy Sales & Exports Data: Purchases & imports of goods and services, 2011 - 2015 17NISRA Broad Economy Sales and Export Statistics (BESES), 2017 18As a result of differing methodologies, the total volume of trade between Northern Ireland and Ireland will differ between the HMRC estimates and the NISRA estimates in Table 1. See Appendix 1 for more information 19DAERA statistics suggest HMRC figures underestimate ‘food and live animals’ exports 20Regional Trade Statistics, HMRC, 2017 21Regional Trade Statistics, HMRC, 2017
THE UK’S EXIT FROM THE EUROPEAN UNION: NORTHERN IRELAND AND IRELAND – POSITION PAPER
5
14. Telecoms and Sound Recording Equipment (£691 million), Meat and Meat Preparations (£292 million) and Cereals (£143 million) represented the largest product categories imported to Northern Ireland from Ireland over the same period.22
Between Northern Ireland and Great Britain
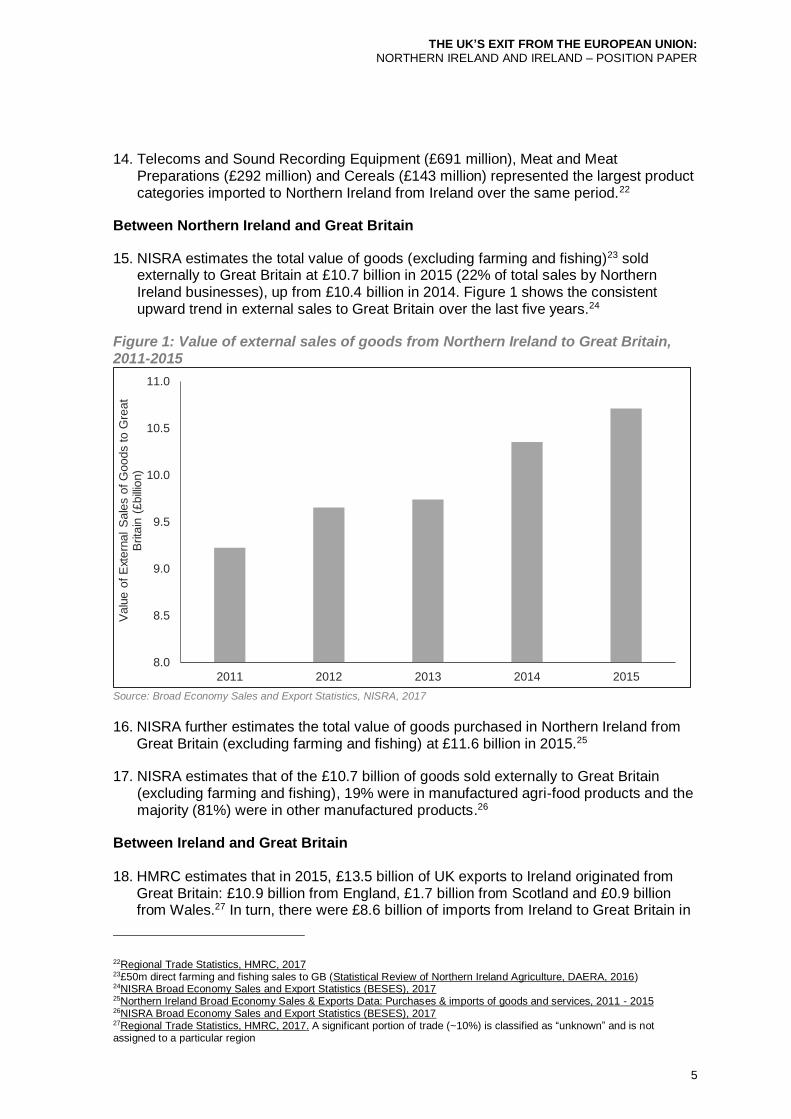
15. NISRA estimates the total value of goods (excluding farming and fishing)23 sold externally to Great Britain at £10.7 billion in 2015 (22% of total sales by Northern Ireland businesses), up from £10.4 billion in 2014. Figure 1 shows the consistent upward trend in external sales to Great Britain over the last five years.24
Figure 1: Value of external sales of goods from Northern Ireland to Great Britain, 2011-2015
Source: Broad Economy Sales and Export Statistics, NISRA, 2017
16. NISRA further estimates the total value of goods purchased in Northern Ireland from Great Britain (excluding farming and fishing) at £11.6 billion in 2015.25
17. NISRA estimates that of the £10.7 billion of goods sold externally to Great Britain (excluding farming and fishing), 19% were in manufactured agri-food products and the majority (81%) were in other manufactured products.26
Between Ireland and Great Britain 18. HMRC estimates that in 2015, £13.5 billion of UK exports to Ireland originated from
Great Britain: £10.9 billion from England, £1.7 billion from Scotland and £0.9 billion from Wales.27 In turn, there were £8.6 billion of imports from Ireland to Great Britain in
22Regional Trade Statistics, HMRC, 2017 23£50m direct farming and fishing sales to GB (Statistical Review of Northern Ireland Agriculture, DAERA, 2016) 24NISRA Broad Economy Sales and Export Statistics (BESES), 2017 25Northern Ireland Broad Economy Sales & Exports Data: Purchases & imports of goods and services, 2011 - 2015 26NISRA Broad Economy Sales and Export Statistics (BESES), 2017 27Regional Trade Statistics, HMRC, 2017. A significant portion of trade (~10%) is classified as “unknown” and is not assigned to a particular region
8.0
8.5
9.0
9.5
10.0
10.5
11.0
2011 2012 2013 2014 2015
Valu
e o
f E
xtern
al
Sale
s o
f G
oods to G
reat
Brita
in (
£bill
ion)
THE UK’S EXIT FROM THE EUROPEAN UNION: NORTHERN IRELAND AND IRELAND – POSITION PAPER
6
the same year: £8 billion to England, £0.3 billion to Scotland, and £0.3 billion to Wales.28
19. HMRC further estimates that in 2016, the value of UK exports to Ireland originating from Great Britain increased to £13.6 billion, and that the value of UK imports from Ireland originating in Great Britain increased to £9.1 billion.29
20. The Irish CSO trade statistics indicate that €13.8 billion worth of goods were exported from Ireland to Great Britain in 2015 (12% of total Ireland goods exports) and €16.9 billion worth of goods were imported to Ireland from Great Britain in 2015 (24% of total Ireland goods imports).30
Between Northern Ireland and the rest of the European Union and rest of the world 21. HMRC’s Regional Trade Statistics estimates that in 2015, Northern Ireland exported
£1.7 billion of goods to the rest of the European Union (EU), excluding Ireland (24% of total goods exports) and £3 billion to the rest of the world (44% of total goods exports).31
Trade in services 22. The services sector accounted for almost three quarters of gross value added (GVA)
in Northern Ireland in 201532 and currently represents over 80% of employment in Northern Ireland.33 Over the last five years the sector has contributed over 43,000 jobs to the Northern Ireland economy, by far the largest of any sector, and increased in size by almost 6%.34 External sales make up a significant part of this picture.
23. In 2015, 6,290 businesses in Northern Ireland were involved in external sales of services, 95% of which employ fewer than 50 people. Businesses selling services outside of Northern Ireland account for employment of around 119,000 and GVA of £5.6 billion for the Northern Ireland economy.35
24. The primary external market for Northern Ireland services is Great Britain, which accounted for 67% (£3.1 billion) of sales in 2015. A further £1 billion of external sales was recorded in Ireland (£630 million) and the rest of the EU (£330 million). Sales from the rest of the world amounted to £590 million in the same period.36
Characteristics of businesses selling outside of Northern Ireland 25. Over 5,000 businesses in Northern Ireland sold goods to Ireland in 2015, of which all
but 67 were Small and Medium Enterprises (SMEs).37 Micro-businesses (0-9
28Regional Trade Statistics, HMRC, 2017. A significant portion of trade (~10%) is classified as “unknown” and is not assigned to a particular region 29Regional Trade Statistics, HMRC, 2017. A significant portion of trade (~10%) is classified as “unknown” and is not assigned to a particular region 30Goods Exports and Imports, Central Statistics Office, 2017. These figures differ from those in Footnote 4 as they are for goods only and do not include services. For further detail about the differences between these figures, refer to Appendix 1 31Regional Trade Statistics, HMRC, 2017. A significant portion of trade (~10%) is classified as “unknown” and is not assigned to a particular region. BESES data allocate trade to Europe as opposed to the EU so HRMC data is used here. 32Regional gross value added (income approach), ONS, December 2016 33Quarterly Employment Survey, NISRA, June 2017 34Quarterly Employment Survey, NISRA, June 2017 35NISRA Broad Economy Sales and Export Statistics (BESES), 2017 36NISRA Broad Economy Sales and Export Statistics (BESES), 2017 37SMEs comprise businesses with fewer than 250 employees

THE UK’S EXIT FROM THE EUROPEAN UNION: NORTHERN IRELAND AND IRELAND – POSITION PAPER
7
employees) account for a large share of the total number of businesses exporting to Ireland. Although only 10% of micro-businesses in Northern Ireland export to Ireland they account for over half (51%) the number of business trading across the land border.38
26. An InterTradeIreland report of 2013 on exporting SMEs in Ireland and Northern Ireland found that cross-border trade represented the first market outside of their domestic market for the vast majority (73%) of Northern Ireland businesses that commenced exporting within the last 10 years.39
27. In value terms, 80% of external sales in goods from Northern Ireland to Ireland were accounted for by businesses with fewer than 250 employees in 2015. However, only 13% were accounted for by micro-businesses.40
28. Preliminary analysis indicates that businesses with employees in district councils closest to the border may have a greater propensity to export. Table 3 shows that those businesses with a larger share of exports relative to their share of employment are likely to share a border with Ireland. The exception is Fermanagh and Omagh, which has a relatively low value of export activity.41
Table 3: Export share as proportion of employment share, by District Council, 2015 (%)
District Council Share of Total Exports
Share of Employment
Export Share as % of Employment Share
Antrim & Newtownabbey 8 8 101
Ards & North Down 3 6 45
Armagh City, Banbridge & Craigavon
13 10 127
Belfast 24 29 81
Causeway Coast & Glens 3 6 51
Derry City & Strabane 7 7 102
Fermanagh & Omagh 2 5 47
Lisburn & Castlereagh 6 7 80
Mid & East Antrim 4 6 62
Mid Ulster 12 8 151
Newry, Mourne & Down 9 8 120
Head Office outside Northern Ireland
10 0 -
Source: Broad Economy Sales and Export Statistics, NISRA, 2017 NI Business Register and Employment Survey, September 2015
38NISRA Broad Economy Sales and Export Statistics (BESES), 2017 39Analysis of the key features of an exporting SME on the island of Ireland, InterTradeIreland, 2013 40NISRA Broad Economy Sales and Export Statistics (BESES), 2017 41NISRA Broad Economy Sales and Export Statistics (BESES), 2017 & NI Business Register and Employment Survey, September 2015
THE UK’S EXIT FROM THE EUROPEAN UNION: NORTHERN IRELAND AND IRELAND – POSITION PAPER
8
29. Almost 3,500 businesses sold goods to Great Britain in 2015, of which all but 65 were SMEs. Businesses employing more than 250 people accounted for over 60% of sales to Great Britain. Despite a similar number of large businesses (over 250 employees) trading with Ireland and Great Britain, their sales to Great Britain were more than 10 times the value of sales to Ireland.42
Volume of freight 30. While the HMRC and NISRA trade statistics provide insight into the value of goods
sold outside of Northern Ireland, in order to gather as complete a picture as possible, we must further consider the volume of freight moving in and out of Northern Ireland. This is because trade in finished products is often dependent on lower value but sometimes higher volume cross-border trade earlier in the supply chain.
Road freight between Northern Ireland and Ireland 31. The Irish Revenue Commissioners estimate that 177,000 heavy goods vehicles
(HGVs) and 208,000 light vans cross the border between Northern Ireland and Ireland each month.43
32. The Department for Transport estimates that in 2015, there were 0.4 million laden journeys and 6.4 million tonnes of freight were carried by Northern Ireland registered HGVs between Northern Ireland and Ireland (10% of goods lifted in total by Northern Ireland registered HGVs). 4.4 million tonnes were lifted in Northern Ireland and transported to Ireland while 2.1 million tonnes were lifted in Ireland and transported to Northern Ireland.44
33. In addition, 1.6 million tonnes of goods were transported from Northern Ireland to Ireland by Irish HGVs, representing 1.4% of all Irish freight lifted while 2.3 million tonnes were lifted from Ireland to Northern Ireland representing 1.9% of all Irish freight lifted.45
34. The Department for Transport also produces estimates that show that in 2015, the largest commodity, by volume, of goods transported from Northern Ireland to Ireland by UK-registered HGVs was in food and drink products (770,000 tonnes). There were also large quantities of glass, cement and other non-metallic mineral products (500,000 tonnes) and agricultural products (480,000 tonnes) transported.46
35. In turn, from Ireland to Northern Ireland the largest volume of products transported in 2015 by UK-registered HGVs were glass, cement and other non-metallic mineral products (880,000 tonnes), wood products (550,000 tonnes) and food and drink products (460,000 tonnes).47
36. Half of all border crossings to Ireland by Northern Ireland-registered HGVs are at the Newry-Dundalk corridor, with the rest predominantly on the southern part of the border along main roads into the Irish borderlands and Dublin. 70% of cross-border journeys by Northern Ireland registered HGVs start and/or end in the areas of Northern Ireland
42NISRA Broad Economy Sales and Export Statistics (BESES), 2017 43Daniel Mulhall, Ambassador of Ireland to the UK, oral evidence to the Northern Ireland Affairs Committee, February 2017 44Road Freight: CSRGT NI, 2014-2016, Department for Transport, 2016 45CSO Road Freight Transport Survey, Central Statistics Office, 2017 46Road Freight: CSRGT NI, 2013-2015, Department for Transport, 2016 47Road Freight: CSRGT NI, 2013-2015, Department for Transport, 2016
THE UK’S EXIT FROM THE EUROPEAN UNION: NORTHERN IRELAND AND IRELAND – POSITION PAPER
9
closest to the border, predominantly near Newry, Dundalk, Aughnacloy, Middletown, and Monaghan.48
Road freight between Northern Ireland and Great Britain 37. The Department for Transport estimate that in 2015, there were 2.9 million tonnes of
freight carried by UK-registered HGVs between Northern Ireland and Great Britain. This was made up of 1.4 million tonnes of freight transported from Northern Ireland to Great Britain and 1.4 million tonnes transported from Great Britain to Northern Ireland.49
38. The Department for Transport further estimates that in 2015, the largest commodity transported by volume both from Northern Ireland to Great Britain and from Great Britain to Northern Ireland by UK-registered HGVs was in food and drink products (680 thousand tonnes in both directions).50
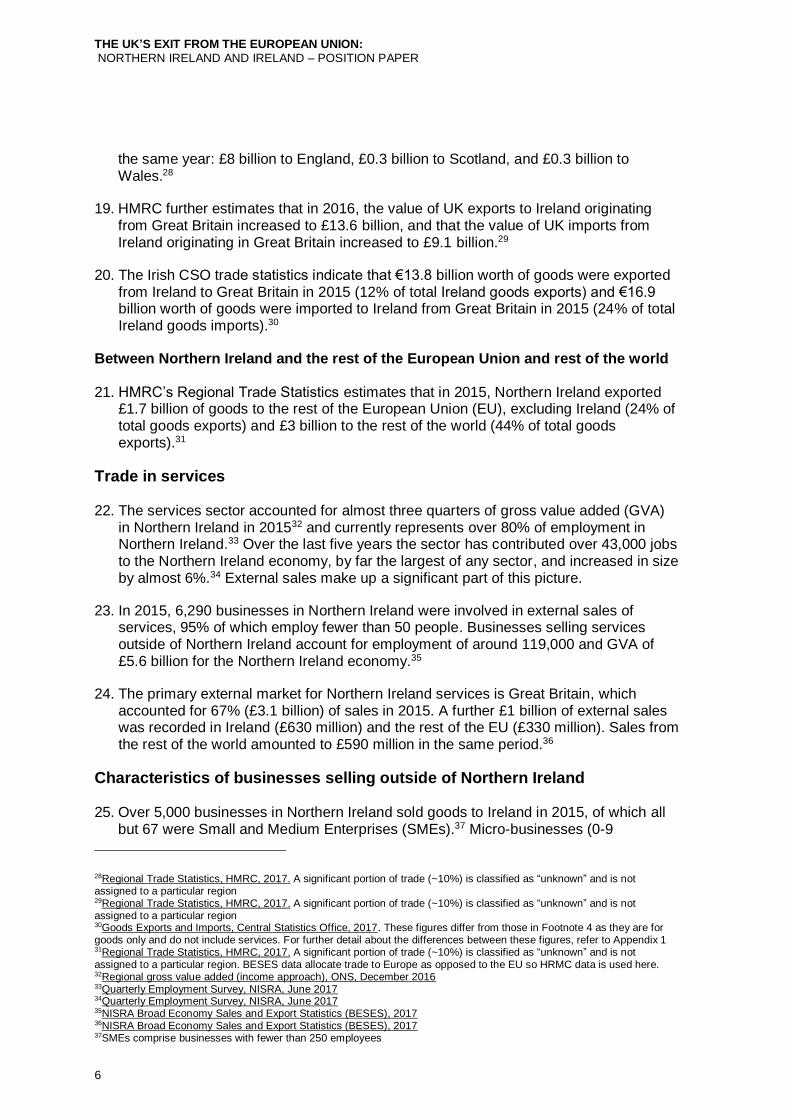
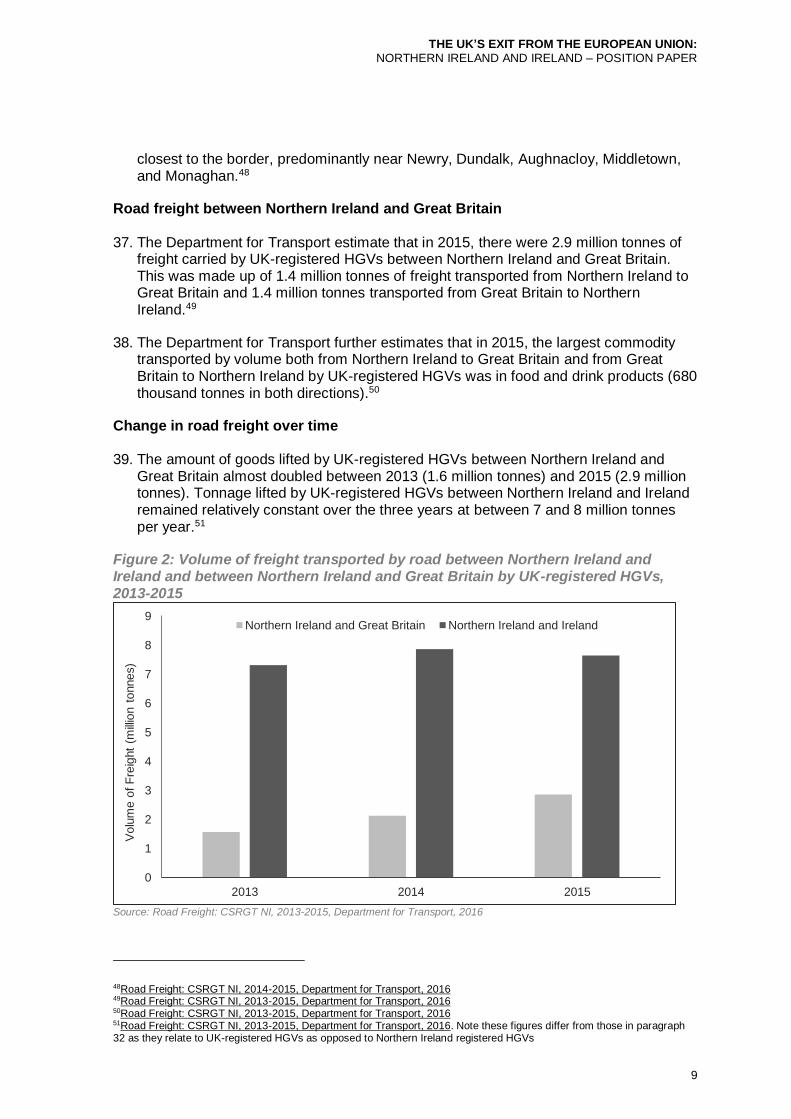
Change in road freight over time 39. The amount of goods lifted by UK-registered HGVs between Northern Ireland and
Great Britain almost doubled between 2013 (1.6 million tonnes) and 2015 (2.9 million tonnes). Tonnage lifted by UK-registered HGVs between Northern Ireland and Ireland remained relatively constant over the three years at between 7 and 8 million tonnes
per year.51
Figure 2: Volume of freight transported by road between Northern Ireland and Ireland and between Northern Ireland and Great Britain by UK-registered HGVs, 2013-2015
Source: Road Freight: CSRGT NI, 2013-2015, Department for Transport, 2016
48Road Freight: CSRGT NI, 2014-2015, Department for Transport, 2016 49Road Freight: CSRGT NI, 2013-2015, Department for Transport, 2016 50Road Freight: CSRGT NI, 2013-2015, Department for Transport, 2016 51Road Freight: CSRGT NI, 2013-2015, Department for Transport, 2016. Note these figures differ from those in paragraph 32 as they relate to UK-registered HGVs as opposed to Northern Ireland registered HGVs
0
1
2
3
4
5
6
7
8
9
2013 2014 2015
Volu
me o
f F
reig
ht
(mill
ion t
onnes)
Northern Ireland and Great Britain Northern Ireland and Ireland
THE UK’S EXIT FROM THE EUROPEAN UNION: NORTHERN IRELAND AND IRELAND – POSITION PAPER
10
Northern Ireland port freight movements
40. The majority of trade between Northern Ireland and Great Britain is through the ports, with a small volume of freight (31,000 tonnes) handled through Belfast International and Belfast City airports in 2015.52 Of the 24.8 million tonnes of freight handled by Northern Ireland major ports during 2015, Belfast port handled 16.7 million tonnes (67%).53
41. Belfast Port has estimated that approximately 15-20% of its traffic either emanates from, or is destined for, Ireland. For some trades, the percentage will be lower (for example, timber and fertilizer) while for others it is much greater (for example, newsprint and packaging and steel imports).54
Agriculture and food cross-border supply chains 42. Farming and processing industries are contributing over £1.1 billion per annum of
value added to the Northern Ireland economy in 2016, which represents around 3.3% of total annual GVA55 in Northern Ireland.56
43. The cross-border integration of the agri-food industry means it is a key focus of Northern Ireland trade flows to and from Ireland. InterTradeIreland estimates that food, beverages and tobacco account for 49% of cross-border manufacturing trade.57 Exports account for 27% of Northern Ireland food and drink processing sales, and Ireland is the destination for 53% of export sales from the sector.58
44. For a number of food processing sectors, the reliance on exports is above average. For example, dairy processing (42% of sales are exports), sheep processing (37%), fish processing (39%) and drinks manufacturing (44%). In addition, 27% of the milk produced on Northern Ireland farms is processed in Ireland and 42% of sheep and lambs are processed in Ireland.59
45. The product journey of milk illustrates the integration of cross-border supply chains. A quarter of the milk produced on Northern Ireland’s farms (nearly 600 million litres) goes to Ireland for processing60 with an estimated value of £124.5m. In addition, around 5% of milk processed in Northern Ireland is also imported from Ireland.61
Conclusion 46. This document represents the most detailed picture available of trade to and from
Northern Ireland at the time of publishing (16 August 2017). While this is a one-off analytical publication, further internal work is underway to update and improve on these estimates to better understand these flows and the complex supply chains underpinning them.
52Freight 2005-2015, Civil Aviation Authority, 2017 53Port Freight Statistics, Department for Transport, 2017 54Belfast Harbour’s Commercial Director 55Where value added is defined as “the sum of all output, less costs of intermediate inputs, or, in national accounts terms, intermediate consumption” 56Northern Ireland Agri-Food Sector, Key Statistics, DAERA, 2017 57Sectoral Cross Border Trade, InterTradeIreland, 2015. 58Size and Performance of the Northern Ireland Food and Drinks Processing Sector, DAERA, 2015 59Size and Performance of the Northern Ireland Food and Drinks Processing Sector, DAERA, 2015 60DAERA estimate using Statistical Review of Northern Ireland Agriculture, DAERA, 2016 61Statistical Review of Northern Ireland Agriculture, DAERA, 2016
THE UK’S EXIT FROM THE EUROPEAN UNION: NORTHERN IRELAND AND IRELAND – POSITION PAPER
11
Appendix 1: Further detail on available data sources
1. There are two main sources of Northern Ireland, UK and Ireland trade data: HMRC’s Regional Trade Statistics, based on Intrastat, and customs declarations relating to products, and NISRA’s Broad Economy Sales and Exports Survey (BESES) covering trade in goods and services, including with Great Britain.
2. In addition, DAERA produces estimates of trade in farming, fishing and agri-food and the Irish CSO produces trade statistics relating to products based on Intrastat and customs declarations to the Irish Revenue Commissioners.
3. Each of these series is derived from systems originally designed to serve different purposes, use a range of different methodologies and as a result provide different estimates of the value of trade.
4. This Appendix provides further background on the sources and the rationale for their use in this paper, reflecting their respective strengths and limitations.
Differences between sources
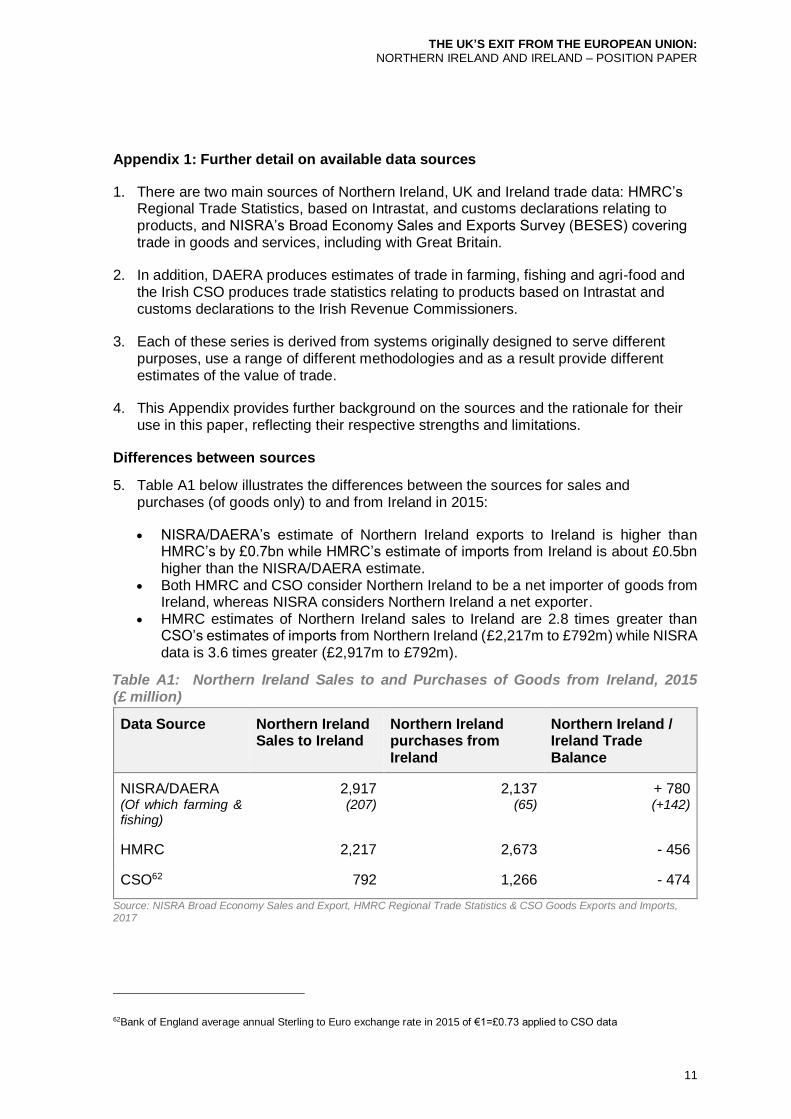
5. Table A1 below illustrates the differences between the sources for sales and purchases (of goods only) to and from Ireland in 2015:
• NISRA/DAERA’s estimate of Northern Ireland exports to Ireland is higher than HMRC’s by £0.7bn while HMRC’s estimate of imports from Ireland is about £0.5bn higher than the NISRA/DAERA estimate.
• Both HMRC and CSO consider Northern Ireland to be a net importer of goods from Ireland, whereas NISRA considers Northern Ireland a net exporter.
• HMRC estimates of Northern Ireland sales to Ireland are 2.8 times greater than CSO’s estimates of imports from Northern Ireland (£2,217m to £792m) while NISRA data is 3.6 times greater (£2,917m to £792m).
Table A1: Northern Ireland Sales to and Purchases of Goods from Ireland, 2015 (£ million)
Data Source Northern Ireland Sales to Ireland
Northern Ireland purchases from Ireland
Northern Ireland / Ireland Trade Balance
NISRA/DAERA (Of which farming & fishing)
2,917 (207)
2,137 (65)
+ 780 (+142)
HMRC 2,217 2,673 - 456
CSO62 792 1,266 - 474
Source: NISRA Broad Economy Sales and Export, HMRC Regional Trade Statistics & CSO Goods Exports and Imports, 2017
62Bank of England average annual Sterling to Euro exchange rate in 2015 of €1=£0.73 applied to CSO data

THE UK’S EXIT FROM THE EUROPEAN UNION: NORTHERN IRELAND AND IRELAND – POSITION PAPER
1
6. These differences arise because
• HMRC RTS data is derived from the Oversea Trade Statistics, which is designed to provide estimates of UK national trade with other countries. RTS, however, is a National Statistic dataset to show trade by individual constituent parts of the UK (including Northern Ireland). The estimates for Northern Ireland therefore include both direct reports of trade by Northern Ireland businesses and some trade allocated to Northern Ireland, which is reported by Great Britain-based businesses that have employees based in Northern Ireland.
• HMRC also models the type of product traded by the smallest businesses that are not required to describe product type below the reporting threshold (£250,000 for exports).
• It is not possible to allocate around 8% of UK exports or 8% of imports to any of the constituent parts of the UK.
• BESES covers all large Northern Ireland businesses (20 or more employees) and a stratified sample of the remainder. It covers both goods and services and sales to Great Britain, which are not available from HMRC. BESES estimates are grossed to population levels but are subject to sampling error.
• BESES does not cover the farming, fishing, financial, insurance and pension sectors, but is consistent with turnover and GVA estimates from NISRA’s main financial survey (Annual Business Inquiry). NISRA also shares data with DAERA on the agri-food sector to optimise coherence.
• CSO estimates are based on administrative returns to the Irish Revenue Commissioners. While they also estimate trade in products below the reporting threshold this is quite high for businesses selling into Ireland (€500,000).
Discussion
7. Recent improvements to the HMRC regional allocation methodology have narrowed the gap between NISRA and HMRC estimates of goods exports, but widened the difference regarding imports. Prior to the change, BESES and HMRC estimates of Northern Ireland imports were historically very close, and trended similarly. However, the new methodology introduced by HMRC has resulted in their estimate of Northern Ireland imports increasing from a historical norm of just under £6 billion to around £8.6 billion in 2013. HMRC estimates show that Northern Ireland total imports were worth £9.3bn in 2015 and £10.1 billion in 2016. These differences are very marked for imports from the rest of the EU and the rest of the world and least marked for trade with Ireland.
Conclusion
8. HMRC sources have therefore been used where equivalence is required between UK national trade or for trade at the individual product level. NISRA and DAERA sources have been used to provide consistent estimates of trade in both goods and services between Northern Ireland and Ireland and Northern Ireland and Great Britain for local businesses.